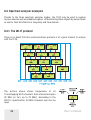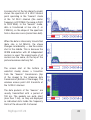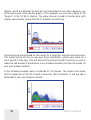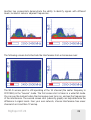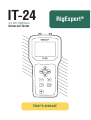
1
IT-24 2.4 GHz ISM Band RigExpert ® Universal Tester User’s manual Table of contents 1. Description 2. Specifications 3. Using the tester 3.1. Before you start 3.2. Turning the tester on and off 3.3. Main Menu 3.4. Settings menu 4. Measurement modes 4.1. Return loss and SWR 4.1.1. Single-point measurement 4.1.2. SWR graph 4.1.3. Tester calibration 4.2. Transmitter power measurement 4.3. Spectrum analyzer 4.3.1. Peak and average levels 4.3.2. Density graph 4.3.3. Waterfall 5. Computer connection 5.1. Screen shots 5.2. Firmware updates 6. Examples of use 6.1. SWR measurement of antennas 6.2. Testing RF cables 6.3. Transmitter power measurement 6.4. Spectrum analyzer examples 6.4.1. The Wi-Fi protocol 6.4.2. The WiMAX protocol 6.4.3. The Bluetooth protocol 6.4.4. Proprietary data transfer protocols 4 5 6 6 6 7 8 9 9 9 10 11 12 12 13 13 14 15 15 15 16 16 18 19 20 20 24 25 26 1. Description 1 2 RigExpert IT-24 is a universal, ultra-portable device for testing, checking, tuning or repairing antennas and antenna feedlines of the 2.4 GHz ISM band (operating frequencies are 2.3 … 2.6 GHz). The following tasks are easily accomplished by using the IT-24: 3 • Quick tests of antennas and RF cables • Output power measurement of wireless access points and other transmitters • RF environment monitoring (in the spectrum analyzer mode) 4 IT-24 may be used by: • Telecommunication providers to check their own wireless data transfer networks • Service companies to test the equipment • Antenna and transmitter/receiver manufacturers Technologies: • Wi-Fi • WiMAX • ZigBee • Proprietary data transfer protocols 4 5 6 1. SMA connector 2. RP-SMA connector 3. Liquid crystal display 4. Keypad 5. Power on/off button 6. USB connector User’s manual Single-point return loss and SWR (standing wave ratio) measurement: • Frequency range: 2.3 … 2.6 GHz • Frequency resolution: 1 MHz • Return loss measurement range: >2 dB • SWR measurement range: 1 … 10 • Output power in this mode: about +5 dBm • Measurement error limits are displayed by the shaded area on the chart. These limits are valid for the 2.4…2.5 GHz range. SWR graph: • 4 frequency sub-bands: 2.3…2.4 GHz, 2.4…2.5 GHz, 2.5…2.6 GHz, 2.3…2.6 GHz • SWR display range: 1 … 5 Transmitter power measurement: • Frequency range: 2.3 … 2.6 GHz • Power limits: -20 … +25 dBm (0.01 … 300 mW) • Input SWR of the power meter: less than 1.5 • Measurement error: better than ±2 dBm Spectrum analyzer: • Display modes: peak and average levels, density graph, waterfall • Frequency range: 2.3 … 2.6 GHz • Bandwidth of sub-bands: 100 MHz (5 overlapping sub-bands), 20 MHz (30 overlapping sub-bands), 10 MHz (60 overlapping sub-bands) • Input signal levels: about -100 … -20 dBm • Signal level marks: 10 dB/div • Receive preamplifier: -10 dB, 0 dB, +6 dB Size: 17•8•3 cm Operating temperature: 0…40 °C Weight including batteries: 350 g. RigExpert IT-24 2. Specifications RF connectors: • RP-SMA for SWR and spectrum modes • SMA for power measurement Interface: • Color TFT display, 320•240 pixels • Water-proof keypad, 9 keys • Multi-language menus and help screens • Computer connection via USB port Power: • 4 pieces of AAA rechargeable or alkaline batteries (the charger is not included with the tester; batteries are not charged inside the tester) • From a computer USB socket 5 3. Using the tester 3.1. Before you start Open the cover on the bottom panel of the tester. Install four fully charged 1.2V Ni-MH (or four 1.5V alkaline) batteries, watching the polarity. Do not: – mix new and old batteries; – use batteries of different types at the same time; – overheat or disassemble batteries; – short-circuit batteries; – try to re-charge alkaline batteries. To charge Ni-MH batteries, use charging adapters recommended for this type of batteries. Any leaks of electrolyte from the batteries may seriously damage the tester. Remove batteries if the analyzer is not being used for a long time. Store batteries in a dry cool place. 3.2. Turning the tester on and off To turn the tester on or off, use the power button , located at the bottom left corner of the keypad. When this button is pressed, firmware version number as well as battery voltage are displayed on the LCD. The on-screen menu system of the RigExpert IT-24 provides a simple but effective way to control the entire device. 6 User’s manual 3.3. Main Menu Once the tester is turned on, the Main menu appears on the LCD: The Main menu contains a brief list of available commands. By using (down) keys, menu items are selected. The chosen measurement mode. Just press (up) and (OK) key will then run a previously (cancel) to return back to the main menu. There is a power indicator in the top-right corner of the Main menu screen: • The battery indicator shows battery discharge level. When the battery voltage is too low, this indicator starts flashing; • The USB icon is displayed when the analyzer is plugged to a personal computer or to a DC adapter with USB socket. The help system (a list of keys and their functions) is built into the tester: there is a “Help” item in the menu in each mode. Here is an example of the help screen for the main menu: RigExpert IT-24 7 3.4. Settings menu The Settings menu (press the button in the main menu) is used to change the setting of the tester, such as interface language, keypress sounds, colors, backlight, splash screens and battery type. In addition, you may reset the tester to factory settings. There is a test mode to quickly check several operating functions of the tester. An SMA to RP-SMA cable should be connected between the RF connector of the tester to run the test mode. The following parameters are displayed: output power (with and without the built-in attenuator); SWR at the input of the power meter. Normal values are marked with green, while the red color indicates a problem. 8 User’s manual 4. M easurement modes 4.1. Return loss and SWR 4.1.1. Single-point measurement In this mode, antenna or any other load is connected to the RP-SMA socket. Once this mode is used for the first time, a simple calibration is required. The following screen shot illustrates the return loss and SWR measurement mode: The (left) and measurement, press the (right) keys change the operating frequency. To hold the (ОК) key: you will then see the “H” pictogram in the top right corner of the screen. Pressing the this measurement mode. RigExpert IT-24 (menu) key will display a help screen for 9 4.1.2. SWR graph In this mode, antenna is also connected to the RP-SMA socket. One of four frequency sub-bands may be chosen by pressing (left) or (right) keys: watch the filled bar and the numbers at the bottom of the screen. OK) button will hold the measurement, displaying the “H” pictogram in the The top right corner of the screen. Pressing the screen. 10 (menu) button will display a help User’s manual 4.1.3. Tester calibration To ensure the SWR measurements are accurate, it is necessary to calibrate the tester. Following the instructions on the screen, just disconnect your antenna from the RPSMA connector; the calibration will then be done automatically. In general, it is sufficient to perform calibration only once, after the tester is turned on for the first time. However, it is recommended to re-calibrate the device if ambient conditions, such as temperature, are significantly changed. RigExpert IT-24 11 4.2. Transmitter power measurement By using an SMA to RP-SMA cable, connect your RF signal source to the SMA socket of the tester. Please watch the difference between SMA and RP-SMA ends of the cable. Please also make sure the RF power is less then 1 Watt, since larger power may permanently damage the tester. Since some transmitters (such as Wi-Fi access points) operate in pulse mode, peak power (maximum measured power over an interval of about 1 second) is displayed on the screen. (OK) key will hold the measurement, and the As usual, the display a help screen for this operating mode. (menu) button will 4.3. Spectrum analyzer There are three modes the RigExpert IT-24 can display spectrum of the input RF signal. ) to set the scan bandwidth In each mode, you may press the menu button ( (100 MHz, 20 MHz and 10 MHz) and the pre-amplifier mode (-10 dB – attenuator, 0 dB – turned off, +6 dB – turned on). In addition, you may set the refresh speed in the waterfall mode. The scan bandwidth, as well as scan bounds may be quickly changed by pressing the (up), (down), (left) and displayed at the bottom part of the screen. The (right) keys. This parameters are (OK) button will clear the screen. Connect your antenna to the RP-SMA socket. Please notice that injecting high power (such as an output of a wireless access point) into this socket may damage the tester. 12 User’s manual 4.3.1. Peak and average levels In this mode, different colors are used to display peak and average levels at each frequency of the scanned range. This mode is especially useful for detecting short peaks of the RF signal (such as data from a sensor alarm). 4.3.2. Density graph In this mode, color of each dot on the screen depends on how often the signal with a certain level is detected. The color changes from blue (rare) to red (often). This mode may be used for monitoring several sources of RF signal, received with different levels at the same or at overlapping frequencies. An example density graph is shown on the next page. In the density graph mode, data is collected on the screen until the user presses the (OK) key to re-start the measurement. RigExpert IT-24 13 4.3.3. Waterfall In this mode, the screen is continuously filled with data (the “old” lines of the image are replaced with “new” lines). The color of each point corresponds to the certain level of the RF signal at a given frequency at the input of the tester. Even small changes of the input signal are clearly visible, since the data is collected on the screen for a long time. The waterfall mode is recommended to monitor narrow-band signals with small levels, which are not even visible in other modes. 14 User’s manual 5. Computer connection The RigExpert IT-24 may be connected to the USB port of a personal computer running Windows operating system. All necessary drivers are installed automatically. You may find the latest software for the IT-24 at the manufacturer’s website, www.rigexpert.com. 5.1. Screen shots The LCD2Clip program helps in transferring the screen shots of the tester to the PC. (screen shot) key after running this program, and the current screen Press the will be sent to the LCD2Clip. The image is automatically copied into the clipboard, so you may then paste it into your favorite graphics editor or send via e-mail. 5.2. Firmware updates The latest updates of the firmware for the IT-24 are available at the manufacturer’s website, www.rigexpert.com (please see the Downloads section). Just run the FirmwareUpdate.exe and follow the instructions on the screen. RigExpert IT-24 15 6. Examples of use 6.1. SWR measurement of antennas While the ISM band covers frequencies from 2.4 to 2.5 GHz only, it is appropriate to scan wider range (2.3 to 2.6 GHz) to see how the SWR curve behaves at different frequencies. In the first case, a simple antenna (taken from a Wi-Fi access point) was measured (see the screenshots below). It can be easily seen that the minimum SWR (about 1.3) is achieved at the very center of the Wi-Fi band. The values at 2.4 and 2.5 GHz are not very high either (about 1.5), so it looks like the antenna under test is performing quite well. 16 User’s manual Next, a directional antenna (a planar array antenna with a gain of 15 dBi for 2.4 … 2.5 GHz) was tested. The SWR is only good at very ends of this frequency range, mostly having very high values (more then 2). This indicates a poor quality of the antenna and/ or the cable. In the third experiment (see the screenshot below), yet another antenna was connected to the tester: a 17 dBi, parabolic reflector and a log-periodic feed. It looks like this antenna has never been tested at the factory: the SWR curve looks fully random. RigExpert IT-24 17 6.2. Testing RF cables A cable under test is connected to the RP-SMA socket if the IT-24. The far end of the cable should be terminated with a 50-Ohm dummy load. The load should have low SWR (less than 1.2) at working frequencies. A 1.8 meter long cable (diameter approximately 5 mm) was connected to the tester during the first experiment. The measured SWR is under 1.3 in the whole range of 2.4 to 2.5 GHz, which indicates a good quality of the cable. Since the characteristic impedance of the cable is not exactly 50 Ohm, the SWR curve is not too smooth. Another cable shows much larger values of the SWR (up to 1.6). This cable is unlikely to be used for connecting equipment in the 2.4 GHz ISM band. 18 User’s manual 6.3. Transmitter power measurement Two different Wi-Fi access points were connected to the IT-24 (by using an SMA to RPSMA converter cable) during this experiment. A “beacon” mode was activated, sending data packets with 100-millisecond intervals. The measured output power of the first access point was 15 dBm. Then, a possible measurement error (±2 dBm) as well as a possible signal loss in the converter cable (up to 1 dB) were taken into the account. As a result, the actual output power could range from 14 to 18 dBm. The power stated by the manufacturer of the access point is 16 dBm, which is in good agreement with measured values. The other access point was only able to show 11 dBm on the screen of the IT-24. This value is too far from 17 dBm, an output power according to the manufacturer’s specifications. RigExpert IT-24 19 6.4. Spectrum analyzer examples Thanks to the three spectrum analyzer modes, the IT-24 may be used to explore narrow-band as well as wideband signals, differentiating these signals by power levels as well as their distribution in frequency and time domain. 6.4.1. The Wi-Fi protocol There is no doubt that this communications protocol is of a great interest to analyze with the IT-24. The picture above shows frequencies of all 14 overlapping Wi-Fi channels. Each channel occupies 20 MHz (in fact, up to 22 MHz). According to the 802.11n specification, 40 MHz channels may also be used. 20 User’s manual A screen shot at the top (density graph) shows the spectrum of a Wi-Fi access point operating in the “beacon” mode at the 1st Wi-Fi channel (the center frequency is 2412 MHz, the range is 2401 to 2423 MHz). In the “beacon” mode, data is transferred at low rate (1 or 2 Mbit/s), so the shape of the spectrum form a Gaussian curve (looks like a bell). When the data is intensively transmitted (data rate is 54 Mbit/s), the shape changes considerably — see the screen shot in the middle. This is because the OFDM modulation with 52 independent carriers is used. The signal levels of all carriers are the same, so the top of the picture becomes relatively flat. The screen shot at the bottom (a waterfall mode) shows a transition from the “beacon” transmission (top of the image) to the intensive data transmission (bottom of the image). The wireless access point still transmits at the 1st Wi-Fi channel. The data packets of the “beacon” are usually transmitted with a period of 100 ms. The packets are quite short (less than 1 ms), so they are displayed as individual dots inside the frequency limits of the chosen Wi-Fi channel. RigExpert IT-24 21 Signals, which are different by level but are transmitted at the same frequency, can all be easily seen at the density graph. In this example, you can see a signal of the “beacon” at the 1st Wi-Fi channel. The same channel is used to transfer data (with smaller signal levels). Some other Wi-Fi channels are also busy. The data can be accumulated on the screen for a long time: minutes and even hours. This useful feature will let you see even those transmitters, which were active for a short period of time only. This will take into the account any Wi-Fi activity, as well as industrial and domestic interference. Less crowded channels can then be chosen for your own wireless network. In the following example, data is collected for 10 minutes. The screen shot shows that the upper part of the Wi-Fi band is less busy (Wi-Fi channels 11 and up) and is preferred for your own wireless network. 22 User’s manual Another two screenshots demonstrate the ability to identify signals with different levels, located at same or adjacent frequencies. The following screen shots illustrate the interference from a microwave oven: The Wi-Fi access point is still operating at the 1st channel (the center frequency is 2412 MHz) in the “beacon” mode. The first screen shot is taken in a waterfall mode. You can see the moment when the microwave oven turns on, and see the frequencies of the interference. The second screen shot (a density graph) can help determine the difference in signal levels. Four your own network, choose interference-free areas: channels 5 or 6 and then 12 and up. RigExpert IT-24 23 6.4.2. The WiMAX protocol The IT-24 can successfully be uses to find WiMAX base stations and measure signal levels of their transmitters. Two WiMAX base stations (2355 and 2375 MHz) are visible at the first screen shot (waterfall mode). The second screen shot (a density graph) helps compare the signal levels of both base stations. In addition, it is clearly seen that each base station consists of several transmitters with different signal levels (this may be segments of a single base station, or even different base stations). Changing the location of the antenna connected to the tester, you can find the point of maximum level of the receiving signal. At least, you will be able to avoid positions with small levels while choosing the location of the subscriber’s WiMAX equipment. 24 User’s manual 6.4.3. The Bluetooth protocol The most convenient mode for monitoring Bluetooth signals is a density graph, since the Bluetooth protocol utilizes frequency hopping transmissions. The Bluetooth transmitter is turned off at the first screenshot. An access point is active at the 1st Wi-Fi channel. In addition, signals with lower levels are visible at other frequencies. The PC is now searching for Bluetooth devices. Transmissions are clearly visible at a wide (from about 2430 to about 2480 MHz) range. Data is transferred from a PC to the peripheral device. Apparently, Bluetooth transmitter frequencies do not overlap with active Wi-Fi channels (adaptive frequency hopping algorithm is in use). RigExpert IT-24 25 6.4.4. Proprietary data transfer protocols By using the RigExpert IT-24, it is interesting to study signals with parameters not known in advance. The tester was placed near the car alarm RFID transmitter/receiver, operating somewhere at 2.4 GHz. A group of short signals appear at different frequencies periodically (every 20-30 seconds) – see the first screen shot (a waterfall mode). These signals are better visible in the peak and average mode (see the second screen shot). 26 User’s manual The next screen shots help study the data transmission from one RF module to another. The waterfall mode can let you know the operating frequency of the transmitter. The signal looks like a solid vertical line; the center frequency is about 2433 MHz. By using a density graph you can, for instance, compare the level of your signal and the level of interference (WiFi access point at the 1st channel, in this case). Looking at the peak and average levels graph, you may notice that the average levels of the RF module (blue color) are almost the same as peak levels (red color). This is because the transmitter is on all the time. On the contrary, the Wi-Fi access point does not transmit too often: there is a large difference between its peak and average levels. RigExpert IT-24 27 NOTES 28 User’s manual RigExpert IT-24 29 Rig Expert Ukraine Ltd. Yakira str. 17A, 04119 Kyiv, Ukraine Tel./fax: +380 44 353-92-42 E-mail: Web: www.rigexpert.com Director Denis Nechitailov 29-March-2013 The Technical documentation is kept at the following address: 37 Stanley Av., Barking, Essex, IG110LD, UK RigExpert IT-24 This device complies with Part 15 of the FCC Rules. Operation is subject to the following two conditions: (1) this device may not cause harmful interference, and (2) this device must accept any interference received, including interference that may cause undesired operation. NOTE: This equipment has been tested and found to comply with the limits for a Class A digital device, pursuant to Part 15 of the FCC Rules. These limits are designed to provide reasonable protection against harmful interference when the equipment is operated in a commercial environment. This equipment generates, uses, and can radiate radio frequency energy and, if not installed and used in accordance with the instruction manual, may cause harmful interference to radio communications. Operation of this equipment in a residential area is likely to cause harmful interference in which case the user will be required to correct the interference at his own expense. Test report № 13/356 of March 25, 2013 RigExpert IT-24: «Відповідає Технічному Регламенту з електромагнітної сумісності обладнання, стандарти: ДСТУ IEC 61326-1:2002 Обладнання електричне для вимірювання, контролю та лабораторного застосування. Частина 1. Вимоги щодо електромагнітної сумісності (ЕМС) (ІEC 61326-1:2000, ІDT)» Декларація про відповідність № UA.004.D.00474-13, 02.04.2013 р. Протокол випробувань № 13/355, 25.03.2013 р. Copyright © 2013 Rig Expert Ukraine Ltd http://www.rigexpert.com RigExpert is a registered trademark of Rig Expert Ukraine Ltd. 1.04.2013