1
Programmer Manual
3066 & 3086
3 GHz Real Time Spectrum Analyzer
071-0502-01
This document supports firmware version 2.2.
Copyright E Sony/Tektronix Corporation. All rights reserved.
Copyright E Tektronix, Inc. All rights reserved.
Tektronix products are covered by U.S. and foreign patents, issued and pending. Information in this publication supercedes
that in all previously published material. Specifications and price change privileges reserved.
Printed in Japan.
Sony/Tektronix Corporation, P.O.Box 5209, Tokyo Int’l, Tokyo 100–31 Japan
Tektronix, Inc., P.O. Box 1000, Wilsonville, OR 97070–1000
TEKTRONIX and TEK are registered trademarks of Tektronix, Inc.
WARRANTY
Tektronix warrants that this product will be free from defects in materials and workmanship for a period of one (1) year
from the date of shipment. If any such product proves defective during this warranty period, Tektronix, at its option, either
will repair the defective product without charge for parts and labor, or will provide a replacement in exchange for the
defective product.
In order to obtain service under this warranty, Customer must notify Tektronix of the defect before the expiration of the
warranty period and make suitable arrangements for the performance of service. Customer shall be responsible for
packaging and shipping the defective product to the service center designated by Tektronix, with shipping charges prepaid.
Tektronix shall pay for the return of the product to Customer if the shipment is to a location within the country in which the
Tektronix service center is located. Customer shall be responsible for paying all shipping charges, duties, taxes, and any
other charges for products returned to any other locations.
This warranty shall not apply to any defect, failure or damage caused by improper use or improper or inadequate
maintenance and care. Tektronix shall not be obligated to furnish service under this warranty a) to repair damage resulting
from attempts by personnel other than Tektronix representatives to install, repair or service the product; b) to repair
damage resulting from improper use or connection to incompatible equipment; or c) to service a product that has been
modified or integrated with other products when the effect of such modification or integration increases the time or
difficulty of servicing the product.
THIS WARRANTY IS GIVEN BY TEKTRONIX WITH RESPECT TO THIS PRODUCT IN LIEU OF ANY
OTHER WARRANTIES, EXPRESSED OR IMPLIED. TEKTRONIX AND ITS VENDORS DISCLAIM ANY
IMPLIED WARRANTIES OF MERCHANTABILITY OR FITNESS FOR A PARTICULAR PURPOSE.
TEKTRONIX’ RESPONSIBILITY TO REPAIR OR REPLACE DEFECTIVE PRODUCTS IS THE SOLE AND
EXCLUSIVE REMEDY PROVIDED TO THE CUSTOMER FOR BREACH OF THIS WARRANTY. TEKTRONIX
AND ITS VENDORS WILL NOT BE LIABLE FOR ANY INDIRECT, SPECIAL, INCIDENTAL, OR
CONSEQUENTIAL DAMAGES IRRESPECTIVE OF WHETHER TEKTRONIX OR THE VENDOR HAS
ADVANCE NOTICE OF THE POSSIBILITY OF SUCH DAMAGES.
Table of Contents
Getting Started
Getting Started . . . . . . . . . . . . . . . . . . . . . . . . . . . . . . . . . . . . . . . . . . . .
1–1
The Difference between the 3066 and 3086 . . . . . . . . . . . . . . . . . . . . . . . . . . . .
Overview of the Manual . . . . . . . . . . . . . . . . . . . . . . . . . . . . . . . . . . . . . . . . . . . .
Connecting the Interface . . . . . . . . . . . . . . . . . . . . . . . . . . . . . . . . . . . . . . . . . . .
Using Communication Ports . . . . . . . . . . . . . . . . . . . . . . . . . . . . . . . . . . . . . . . .
Setting Communication Parameters from the Front Panel . . . . . . . . . . . . . . . . . .
1–1
1–2
1–4
1–5
1–7
Syntax and Commands
Command Syntax . . . . . . . . . . . . . . . . . . . . . . . . . . . . . . . . . . . . . . . . . .
2–1
Commands and Queries . . . . . . . . . . . . . . . . . . . . . . . . . . . . . . . . . . . . . . . . . . . .
Constructed Mnemonics . . . . . . . . . . . . . . . . . . . . . . . . . . . . . . . . . . . . . . . . . . . .
2–2
2–6
Command Groups . . . . . . . . . . . . . . . . . . . . . . . . . . . . . . . . . . . . . . . . . .
2–7
Functional Groups . . . . . . . . . . . . . . . . . . . . . . . . . . . . . . . . . . . . . . . . . . . . . . . .
General Programming Sequence . . . . . . . . . . . . . . . . . . . . . . . . . . . . . . . . . . . . .
Configuration Commands . . . . . . . . . . . . . . . . . . . . . . . . . . . . . . . . . . . . . . . . . .
Setup Commands . . . . . . . . . . . . . . . . . . . . . . . . . . . . . . . . . . . . . . . . . . . . . . . . .
View Commands . . . . . . . . . . . . . . . . . . . . . . . . . . . . . . . . . . . . . . . . . . . . . . . . .
Utility Commands . . . . . . . . . . . . . . . . . . . . . . . . . . . . . . . . . . . . . . . . . . . . . . . .
2–8
2–10
2–11
2–12
2–14
2–34
Configuration Commands . . . . . . . . . . . . . . . . . . . . . . . . . . . . . . . . . . .
Standard Setup Commands . . . . . . . . . . . . . . . . . . . . . . . . . . . . . . . . . .
CDMA Setup Commands . . . . . . . . . . . . . . . . . . . . . . . . . . . . . . . . . . . .
Waveform View Commands . . . . . . . . . . . . . . . . . . . . . . . . . . . . . . . . . .
Analog View Commands . . . . . . . . . . . . . . . . . . . . . . . . . . . . . . . . . . . . .
FSK View Commands . . . . . . . . . . . . . . . . . . . . . . . . . . . . . . . . . . . . . . .
Spectrogram View Commands . . . . . . . . . . . . . . . . . . . . . . . . . . . . . . . .
Waterfall View Commands . . . . . . . . . . . . . . . . . . . . . . . . . . . . . . . . . . .
Polar View Commands . . . . . . . . . . . . . . . . . . . . . . . . . . . . . . . . . . . . . .
Eye Diagram View Commands . . . . . . . . . . . . . . . . . . . . . . . . . . . . . . .
Symbol Table View Commands . . . . . . . . . . . . . . . . . . . . . . . . . . . . . . .
EVM View Commands . . . . . . . . . . . . . . . . . . . . . . . . . . . . . . . . . . . . . .
CDMA Waveform View Commands . . . . . . . . . . . . . . . . . . . . . . . . . . .
CDMA Polar View Commands . . . . . . . . . . . . . . . . . . . . . . . . . . . . . . .
CDMA Time View Commands . . . . . . . . . . . . . . . . . . . . . . . . . . . . . . . .
3066 & 3086 3 GHz Real Time Spectrum Analyzer Programmer Manual
2–37
2–57
2–77
2–91
2–119
2–131
2–141
2–155
2–171
2–187
2–191
2–197
2–207
2–229
2–247
i
Table of Contents
CodeSpectrogram View Commands
(3066 Option 15 and 3086 Option 16 Only) . . . . . . . . . . . . . . . . . .
CodePolar View Commands
(3066 Option 15 and 3086 Option 16 Only) . . . . . . . . . . . . . . . . . .
CodePower View Commands
(3066 Option 15 and 3086 Option 16 Only) . . . . . . . . . . . . . . . . . .
CodeWSpectrogram View Commands (3086 Option 16 Only) . . . . . .
CodeWPolar View Commands (3086 Option 16 Only) . . . . . . . . . . . .
CodeWPower View Commands (3086 Option16 Only) . . . . . . . . . . . .
CCDF Commands (Option 20 Only) . . . . . . . . . . . . . . . . . . . . . . . . . . .
CCDFView Commands (Option 20 Only) . . . . . . . . . . . . . . . . . . . . . . .
Self Gain-Calibration Commands . . . . . . . . . . . . . . . . . . . . . . . . . . . . .
Save/Load Commands . . . . . . . . . . . . . . . . . . . . . . . . . . . . . . . . . . . . . .
Average Commands . . . . . . . . . . . . . . . . . . . . . . . . . . . . . . . . . . . . . . . . .
Remote Commands . . . . . . . . . . . . . . . . . . . . . . . . . . . . . . . . . . . . . . . . .
Retrieving Response Message . . . . . . . . . . . . . . . . . . . . . . . . . . . . . . . . .
2–287
2–299
2–309
2–319
2–331
2–347
2–357
2–361
2–375
2–381
2–399
Status and Events . . . . . . . . . . . . . . . . . . . . . . . . . . . . . . . . . . . . . . . . . .
3–1
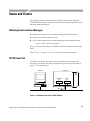
Obtaining Event and Error Messages . . . . . . . . . . . . . . . . . . . . . . . . . . . . . . . . . .
TCP/IP Event Port . . . . . . . . . . . . . . . . . . . . . . . . . . . . . . . . . . . . . . . . . . . . . . . .
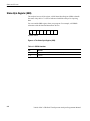
Status Byte Register (SBR) . . . . . . . . . . . . . . . . . . . . . . . . . . . . . . . . . . . . . . . . .
Messages . . . . . . . . . . . . . . . . . . . . . . . . . . . . . . . . . . . . . . . . . . . . . . . . . . . . . . .
3–1
3–1
3–2
3–3
2–267
2–277
Status and Events
Programming Examples
Programming Examples . . . . . . . . . . . . . . . . . . . . . . . . . . . . . . . . . . . . .
4–1
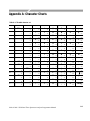
Appendix A: Character Charts . . . . . . . . . . . . . . . . . . . . . . . . . . . . . . .
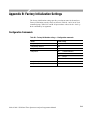
Appendix B: Factory Initialization Settings . . . . . . . . . . . . . . . . . . . . .
A–1
B–1
Configuration Commands . . . . . . . . . . . . . . . . . . . . . . . . . . . . . . . . . . . . . . . . . .
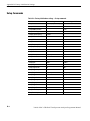
Setup Commands . . . . . . . . . . . . . . . . . . . . . . . . . . . . . . . . . . . . . . . . . . . . . . . . .
View Commands . . . . . . . . . . . . . . . . . . . . . . . . . . . . . . . . . . . . . . . . . . . . . . . . .
Utility Commands . . . . . . . . . . . . . . . . . . . . . . . . . . . . . . . . . . . . . . . . . . . . . . . .
:Config:Mode Command . . . . . . . . . . . . . . . . . . . . . . . . . . . . . . . . . . . . . . . . . . .
B–1
B–2
B–3
B–15
B–16
Appendices
Glossary and Index
ii
3066 & 3086 3 GHz Real Time Spectrum Analyzer Programmer Manual
Table of Contents
List of Figures
Figure 1–1: Common message elements . . . . . . . . . . . . . . . . . . . . . . . .
Figure 1–2: Functional groupings and an alphabetical list of
commands . . . . . . . . . . . . . . . . . . . . . . . . . . . . . . . . . . . . . . . . . . . . .
Figure 1–3: Event (interrupt) driven programs . . . . . . . . . . . . . . . . . .
Figure 1–4: Example programs of the PERL source codes . . . . . . . . .
Figure 1–5: Interface connector location on the rear panel . . . . . . . .
Figure 1–6: GPIB connection . . . . . . . . . . . . . . . . . . . . . . . . . . . . . . . . .
Figure 1–7: Typical GPIB network configurations . . . . . . . . . . . . . . .
Figure 1–8: Ethernet connection . . . . . . . . . . . . . . . . . . . . . . . . . . . . . .
Figure 1–9: Setting the communication parameters . . . . . . . . . . . . . .
Figure 1–10: Setting the GPIB parameters . . . . . . . . . . . . . . . . . . . . . .
Figure 1–11: Setting the TCP/IP parameters . . . . . . . . . . . . . . . . . . . .
1–2
1–2
1–3
1–3
1–4
1–5
1–5
1–6
1–7
1–8
1–9
Figure 2–1: Example of subsystem hierarchy tree . . . . . . . . . . . . . . . .
Figure 2–2: Example of chaining commands and queries . . . . . . . . . .
Figure 2–3: Example of omitting root and lower-level nodes in a
chained message . . . . . . . . . . . . . . . . . . . . . . . . . . . . . . . . . . . . . . . .
Figure 2–4: Settings for burst analysis . . . . . . . . . . . . . . . . . . . . . . . . .
Figure 2–5: Setting the mask for the EVM calculation . . . . . . . . . . . .
Figure 2–6: Setting the reference line at 1 MHz of RBW . . . . . . . . . .
Figure 2–7: Setting the reference line at 30 kHz of RBW . . . . . . . . . .
Figure 2–8: Settings for burst analysis . . . . . . . . . . . . . . . . . . . . . . . . .
Figure 2–9: Setting the trigger mask . . . . . . . . . . . . . . . . . . . . . . . . . . .
Figure 2–10: :View<x>:Scale:XStartZero On and Off (example) . . .
Figure 2–10: Data file structure . . . . . . . . . . . . . . . . . . . . . . . . . . . . . . .
Figure 2–11: Retrieving response message . . . . . . . . . . . . . . . . . . . . . .
2–4
2–174
2–202
2–216
2–218
2–232
2–256
2–344
2–361
2–399
Figure 3–1: Obtaining event on the TCP/IP Ethernet . . . . . . . . . . . . .
Figure 3–2: The Status Byte Register (SBR) . . . . . . . . . . . . . . . . . . . . .
3–1
3–2
3066 & 3086 3 GHz Real Time Spectrum Analyzer Programmer Manual
2–2
2–4
iii
Table of Contents
List of Tables
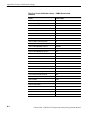
Table 2–1: BNF symbols and meanings . . . . . . . . . . . . . . . . . . . . . . . .
Table 2–2: Comparison of header off and on responses . . . . . . . . . . .
Table 2–3: Parameter types used in syntax descriptions . . . . . . . . . .
Table 2–4: Constructed mnemonics . . . . . . . . . . . . . . . . . . . . . . . . . . .
Table 2–5: Functional groups in the command set . . . . . . . . . . . . . . .
Table 2–6: Configuration commands . . . . . . . . . . . . . . . . . . . . . . . . . .
Table 2–7: Standard Setup commands . . . . . . . . . . . . . . . . . . . . . . . . .
Table 2–8: CDMA Setup commands . . . . . . . . . . . . . . . . . . . . . . . . . . .
Table 2–9: Waveform View commands . . . . . . . . . . . . . . . . . . . . . . . .
Table 2–10: Analog View commands . . . . . . . . . . . . . . . . . . . . . . . . . .
Table 2–11: FSK View commands . . . . . . . . . . . . . . . . . . . . . . . . . . . . .
Table 2–12: Spectrogram View commands . . . . . . . . . . . . . . . . . . . . .
Table 2–13: Waterfall View commands . . . . . . . . . . . . . . . . . . . . . . . .
Table 2–14: Polar View commands . . . . . . . . . . . . . . . . . . . . . . . . . . . .
Table 2–15: Eye Diagram View commands . . . . . . . . . . . . . . . . . . . . .
Table 2–16: Symbol Table View commands . . . . . . . . . . . . . . . . . . . . .
Table 2–17: EVM View commands . . . . . . . . . . . . . . . . . . . . . . . . . . . .
Table 2–18: CDMA Waveform View commands . . . . . . . . . . . . . . . . .
Table 2–19: CDMA Polar View commands . . . . . . . . . . . . . . . . . . . . .
Table 2–20: CDMA Time View commands . . . . . . . . . . . . . . . . . . . . .
Table 2–21: CodeSpectrogram View commands
(3066 option 15 and 3086 option 16 only) . . . . . . . . . . . . . . . . . . .
Table 2–22: CodePolar View commands
(3066 option 15 and 3086 option 16 only) . . . . . . . . . . . . . . . . . . .
Table 2–23: CodePower View commands
(3066 option 15 and 3086 option 16 only) . . . . . . . . . . . . . . . . . . .
Table 2–24: CodeWSpectrogram View commands
(3086 option 16 only) . . . . . . . . . . . . . . . . . . . . . . . . . . . . . . . . . . . .
Table 2–25: CodeWPolar View commands (3086 option 16 only) . . .
Table 2–26: CodeWPower View commands (3086 option 16 only) . .
Table 2–27: CCDF commands (option 20 only) . . . . . . . . . . . . . . . . . .
Table 2–28: CCDFView commands (option 20 only) . . . . . . . . . . . . .
Table 2–29: Self Gain-Calibration commands . . . . . . . . . . . . . . . . . . .
Table 2–30: Save/Load commands . . . . . . . . . . . . . . . . . . . . . . . . . . . .
Table 2–31: Average commands . . . . . . . . . . . . . . . . . . . . . . . . . . . . . .
Table 2–32: Remote commands . . . . . . . . . . . . . . . . . . . . . . . . . . . . . . .
iv
2–1
2–3
2–3
2–6
2–9
2–11
2–12
2–13
2–14
2–16
2–17
2–18
2–19
2–20
2–21
2–22
2–22
2–23
2–24
2–26
2–27
2–28
2–29
2–29
2–30
2–31
2–32
2–33
2–34
2–34
2–35
2–36
3066 & 3086 3 GHz Real Time Spectrum Analyzer Programmer Manual
Table of Contents
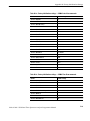
Table 3–1: SBR bit functions . . . . . . . . . . . . . . . . . . . . . . . . . . . . . . . . .
Table 3–2: Event message . . . . . . . . . . . . . . . . . . . . . . . . . . . . . . . . . . .
Table 3–3: No error . . . . . . . . . . . . . . . . . . . . . . . . . . . . . . . . . . . . . . . .
Table 3–4: Command error . . . . . . . . . . . . . . . . . . . . . . . . . . . . . . . . . .
Table 3–5: Execution error . . . . . . . . . . . . . . . . . . . . . . . . . . . . . . . . . .
Table 3–6: Device specific error . . . . . . . . . . . . . . . . . . . . . . . . . . . . . .
Table 3–7: GPIB error . . . . . . . . . . . . . . . . . . . . . . . . . . . . . . . . . . . . . .
3–2
3–3
3–4
3–4
3–4
3–5
3–5
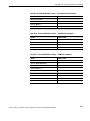
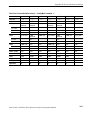
Table A–1: The 3066 character set . . . . . . . . . . . . . . . . . . . . . . . . . . . . .
Table A–2: ASCII & GPIB code chart . . . . . . . . . . . . . . . . . . . . . . . . . .
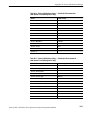
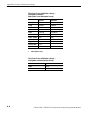
Table B–1: Factory initialization settings — Configuration
commands . . . . . . . . . . . . . . . . . . . . . . . . . . . . . . . . . . . . . . . . . . . . .
Table B–2: Factory initialization settings — Setup commands . . . . .
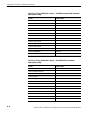
Table B–3: Factory initialization settings — Waveform View
commands . . . . . . . . . . . . . . . . . . . . . . . . . . . . . . . . . . . . . . . . . . . . .
Table B–4: Factory initialization settings — Analog View
commands . . . . . . . . . . . . . . . . . . . . . . . . . . . . . . . . . . . . . . . . . . . . .
Table B–5: Factory initialization settings — FSK View commands .
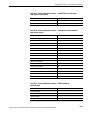
Table B–6: Factory initialization settings — Spectrogram View
commands . . . . . . . . . . . . . . . . . . . . . . . . . . . . . . . . . . . . . . . . . . . . .
Table B–7: Factory initialization settings — Waterfall View
commands . . . . . . . . . . . . . . . . . . . . . . . . . . . . . . . . . . . . . . . . . . . . .
Table B–8: Factory initialization settings — Polar View commands
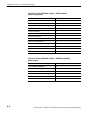
Table B–9: Factory initialization settings — Eye diagram View
commands . . . . . . . . . . . . . . . . . . . . . . . . . . . . . . . . . . . . . . . . . . . . .
Table B–10: Factory initialization settings — Symbol View
commands . . . . . . . . . . . . . . . . . . . . . . . . . . . . . . . . . . . . . . . . . . . . .
Table B–11: Factory initialization settings — EVM View commands
Table B–12: Factory initialization settings — CDMA Waveform
View commands . . . . . . . . . . . . . . . . . . . . . . . . . . . . . . . . . . . . . . . .
Table B–13: Factory initialization settings — CDMA Polar View
commands . . . . . . . . . . . . . . . . . . . . . . . . . . . . . . . . . . . . . . . . . . . . .
Table B–14: Factory initialization settings — CDMA Time View
commands . . . . . . . . . . . . . . . . . . . . . . . . . . . . . . . . . . . . . . . . . . . . .
Table B–15: Factory initialization settings — CodeSpectrogram
View commands (3066 option 15 and 3086 option 16 only) . . . . .
Table B–16: Factory initialization settings — CodePolar View
commands (3066 option 15 and 3086 option 16 only) . . . . . . . . . .
Table B–17: Factory initialization settings — CodePower View
commands (3066 option 15 and 3086 option 16 only) . . . . . . . . . .
A–1
A–2
3066 & 3086 3 GHz Real Time Spectrum Analyzer Programmer Manual
B–1
B–2
B–3
B–4
B–4
B–4
B–5
B–6
B–7
B–7
B–7
B–8
B–9
B–9
B–10
B–11
B–11
v
Table of Contents
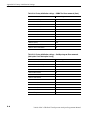
Table B–18: Factory initialization settings — CodeWSpectrogram
View commands (3086 option 16 only) . . . . . . . . . . . . . . . . . . . . . .
Table B–19: Factory initialization settings — CodeWPolar View
commands (3086 option 16 only) . . . . . . . . . . . . . . . . . . . . . . . . . .
Table B–20: Factory initialization settings — CodeWPower View
commands (3086 option 16 only) . . . . . . . . . . . . . . . . . . . . . . . . . .
Table B–21: Factory initialization settings — CCDF commands
(option 20 only) . . . . . . . . . . . . . . . . . . . . . . . . . . . . . . . . . . . . . . . . .
Table B–22: Factory initialization settings — CCDFView commands
(option 20 only) . . . . . . . . . . . . . . . . . . . . . . . . . . . . . . . . . . . . . . . . .
Table B–23: Factory initialization settings — Self gain-calibration
commands . . . . . . . . . . . . . . . . . . . . . . . . . . . . . . . . . . . . . . . . . . . . .
Table B–24: Factory initialization settings — Save/Load commands
Table B–25: Factory initialization settings — Average commands . .
Table B–26: Factory initialization settings — Remote commands . .
Table B–27: Factory initialization settings — :Config:Mode
command – 1 . . . . . . . . . . . . . . . . . . . . . . . . . . . . . . . . . . . . . . . . . . .
Table B–28: Factory initialization settings — :Config:Mode
command – 2 . . . . . . . . . . . . . . . . . . . . . . . . . . . . . . . . . . . . . . . . . . .
Table B–29: Factory initialization settings — :Config:Mode
command (3066 option 15 and 3086 option 16 only) . . . . . . . . . .
Table B–30: Factory initialization settings — :Config:Mode
command (option 20 only) . . . . . . . . . . . . . . . . . . . . . . . . . . . . . . . .
vi
B–12
B–12
B–13
B–13
B–14
B–15
B–15
B–15
B–15
B–16
B–17
B–18
B–18
3066 & 3086 3 GHz Real Time Spectrum Analyzer Programmer Manual
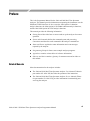
Preface
This is the Programmer Manual for the 3066 and 3086 Real Time Spectrum
Analyzer. This manual provides information on operating the instrument over the
GPIB and TCP/IP interfaces. It also covers the 3066 Option 15 cdmaOne
analysis functions, the 3086 Option 16 W-CDMA/cdmaOne analysis functions,
and the 3066/3086 Option 20 CCDF analysis functions.
This manual provides the following information:
H
Getting Started describes how to connect and set up the analyzer for remote
operation.
H
Syntax and Commands defines the command syntax and processing
conventions and describes each command in the analyzer command set.
H
Status and Events explains the status information and event messages
reported by the analyzer.
H
Programming Examples shows some example analyzer programs.
H
Appendices contains various tables of reference information.
H
Glossary and Index contains a glossary of common terms and an index to
this manual.
Related Manuals
Other documentation for the analyzer includes:
H
The 3066 and 3086 Real Time Spectrum Analyzer User Manual (Tektronix
part number 071-0501-XX) describes the operation of the instrument.
H
The 3066 and 3086 Real Time Spectrum Analyzer Service Manual (Tektronix part number 071-0503-XX) provides information for maintaining and
servicing the analyzer.
3066 & 3086 3 GHz Real Time Spectrum Analyzer Programmer Manual
vii
Preface
viii
3066 & 3086 3 GHz Real Time Spectrum Analyzer Programmer Manual
Getting Started
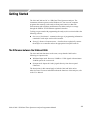
Getting Started
The 3066 and 3086 are DC to 3 GHz Real Time Spectrum Analyzer. The
instrument software operates on the Windows 95. You can write computer
programs that remotely set the analyzer front panel controls or that take
measurements and read those measurements for further analysis or storage
through the GPIB or TCP/IP Ethernet (optional) interface.
To help you get started with programming the analyzer, this section includes the
following sections:
H
Overview of the Manual – summarizes the type of programming information
contained in each major section of this manual.
H
Setting Up Remote Communications – describes how to physically connect
the analyzer to a controller and set the appropriate front panel controls.
The Difference between the 3066 and 3086
The 3066 and 3086 functions are the same, except that the 3086 has the
following two input modes:
H
Wideband input mode: Processes 50 MHz to 3 GHz signals with maximum
30 MHz span in the vector mode.
H
IQ input mode: Inputs the I and Q signals directly from the rear panel
connectors.
The descriptions in this manual apply to both the 3066 and 3086, unless
otherwise noted. For more information about the functions of the analyzer, refer
to the User Manual.
3066 & 3086 3 GHz Real Time Spectrum Analyzer Programmer Manual
1-1
Getting Started
Overview of the Manual
The information contained in each major section of this manual is described
below.
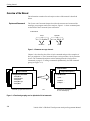
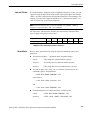
Syntax and Commands
The Syntax and Commands chapter describes the structure and content of the
messages your program sends to the analyzer, Figure 1–1 shows command parts
as described in the Command Syntax subsection.
Command Parts
Header
Arguments
:Util3:PeakHoldĂĂActive,100,0,D1
Mnemonics
Space
Comma
Figure 1-1: Common message elements
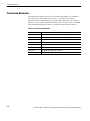
Chapter 2 also describes the effect of each command and provides examples of
how you might use it. The Command Groups section provides a list by functional area. The command description sections starting from the Configuration
Commands on page 2–37 arrange commands alphabetically for each command
group (see Figure 1–2).
Utility
Waveform View Commands
:Setup:FFTPoints
Setup Commands
:Setup:CenterFrequency
Configuration Commands
:Setup:BlockSize
:Config:Block
:Config:Continue
:Config:Label
:Config:Message
:Config:Mode
Commands grouped in functional areas
Syntax: . . .
Argument: . . .
Examples: . . .
and
Commands listed alphabetically
for each command group
Figure 1-2: Functional groupings and an alphabetical list of commands
1-2
3066 & 3086 3 GHz Real Time Spectrum Analyzer Programmer Manual
Getting Started
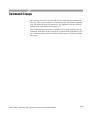
Status and Events
The program may request information from the analyzer. The analyzer provides
information in the form of status and error messages. Figure 1–3 illustrates the
basic operation of this system.
The Status and Events chapter starting on page 3–1 describes how to obtain
status and event messages in your programs.
Your program requests
status and event reports.
Controller
The analyzer sends status and
event reports.
3066/3086
Figure 1-3: Event (interrupt) driven programs
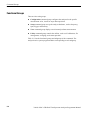
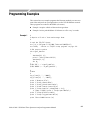
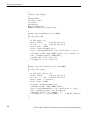
Programming Examples
The Programming Examples chapter starting on page 4–1 describes some
example programs of the PERL source codes (PERL is a freeware).
#
# Main
#
tcp_client(S, '', '3000');
tcp_client(SS, '', '3001');
print S "NewLine LF\n";
print S "Config:Pause On\n";
print S "Config:View1 Waveform\n";
print S "View1:Trace2:Source D1\n";
Figure 1-4: Example programs of the PERL source codes
3066 & 3086 3 GHz Real Time Spectrum Analyzer Programmer Manual
1-3
Getting Started
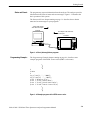
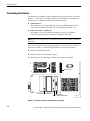
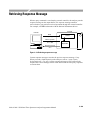
Connecting the Interface
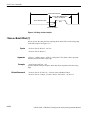
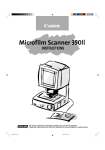
The analyzer has an IBM PC based expansion slots on its rear panel, as shown in
Figure 1–5. The analyzer is shipped standard with a GPIB port. In addition, the
analyzer can be configured with optional networking cards.
H
GPIB interface
This connector has a D-type shell and conforms to IEEE Std 488.1–1987
(The cable is available from Tektronix as part number 012–0991–00).
H
Ethernet interface (Option 10)
With Option 10, you can connect the analyzer directly to an Ethernet
network using a twisted pair (10BASE-T/100BASE-TX) cable.
NOTE. Only a service personnel can install the network card. Contact Tektronix
for details.
You can also connect the following peripheral devices to the analyzer. Refer to
the 3066 and 3086 User Manual for information on using these interfaces.
H
Mouse and keyboard interface
H
Parallel interface for connecting a printer
H
SCSI interface for connecting a SCSI device such as an hard disk.
Parallel connector
SCSI connector
Ethernet interface (Option 10)
GPIB interface
Mouse and keyboard interface
Figure 1-5: Interface connector location on the rear panel
1-4
3066 & 3086 3 GHz Real Time Spectrum Analyzer Programmer Manual
Getting Started
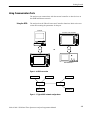
Using Communication Ports
The analyzer can communicate with the external controller or other devices on
the GPIB and Ethernet network.
Using the GPIB
The analyzer has the Talker/Listener and Controller functions. Refer to the next
section about setting the parameters for the port.
Controller
3066/3086 as the Controller
OR
Bus
Bus
Other GPIB device
3066/3086 as the Talker/Listner
Figure 1-6: GPIB connection
GPIB Device
GPIB Device
GPIB Device
GPIB Device
GPIB Device
GPIB Device
GPIB Device
Figure 1-7: Typical GPIB network configurations
3066 & 3086 3 GHz Real Time Spectrum Analyzer Programmer Manual
1-5
Getting Started
GPIB Requirements. Observe these rules when you use your analyzer with a
GPIB network:
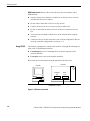
Using TCP/IP
H
Assign a unique device address to each device on the bus. No two devices
can share the same device address.
H
Do not connect more than 15 devices to any one bus.
H
Connect one device for every 2 meters (6 feet) of cable used.
H
Do not use more than 20 meters (65 feet) of cable to connect devices to a
bus.
H
Turn on at least two-thirds of the devices on the network while using the
network.
H
Connect the devices on the network in a star or linear configuration. Do not
use loop or parallel configurations (see Figure 1–7).
The analyzer communicates with the external devices through the following two
ports on the TCP/IP Ethernet network.
H
Command port receives commands from, or returns responses to the
external controller.
H
Event port sends events to the external controller.
Refer to the next section about setting the parameters for these ports.
3066/3086
Controller
Command
port
Event
port
TCP/IP Ethernet network
Figure 1-8: Ethernet connection
1-6
3066 & 3086 3 GHz Real Time Spectrum Analyzer Programmer Manual
Getting Started
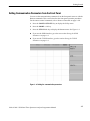
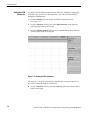
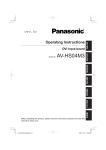
Setting Communication Parameters from the Front Panel
You can set the communication parameters from the front panel menu or with the
Remote commands. This section describes the front panel operation procedures.
For the remote control commands, refer to Remote Commands on page 2–381.
1. Press the CONFIG:UTILITY key to display the Utility menu.
2. Press the MORE... side key.
3. Press the UTIL H side key to display the Remote menu. See Figure 1–9.
H
If you use the GPIB interface, go to the next section Setting the GPIB
Parameters on page 1–8.
H
If you use the TCP/IP interface, go to the section Setting the TCP/IP
Parameters on page 1–9.
Figure 1-9: Setting the communication parameters
3066 & 3086 3 GHz Real Time Spectrum Analyzer Programmer Manual
1-7
Getting Started
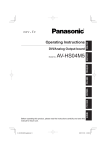
Setting the GPIB
Parameters
You need to set the GPIB parameters of the analyzer to match the configuration
of the bus. Once you have set these parameters, you can control the analyzer
through the GPIB interface.
1. Press the GPIB side key to display the GPIB configuration menu.
See Figure 1–10.
2. Press the Interface side key, and select Talker/Listener using either the
general purpose knob or the keypad.
3. Press the Primary Address side key, and set GPIB address using either the
general purpose knob or the keypad.
Figure 1-10: Setting the GPIB parameters
The analyzer is set up for bidirectional communication with your controller. If
you wish to isolate the analyzer from the bus:
H
1-8
Press the Interface side key, and select Off using either the general purpose
knob or the keypad.
3066 & 3086 3 GHz Real Time Spectrum Analyzer Programmer Manual
Getting Started
Setting the TCP/IP
Parameters
You need to set the TCP/IP parameters of the analyzer to match the network
configuration. Once you have set these parameters, you can control the analyzer
on the Ethernet network.
1. Press the TCP/IP side key to display the TCP/IP configuration menu.
See Figure 1–11.
2. Press the Command Port side key, and set the command port number using
either the general purpose knob or the keypad. The number ranges 1024 to
32767.
3. Press the Event Port side key, and set the event port number using either the
general purpose knob or the keypad. The number ranges 1024 to 32767. It
must be different from the command port number.
4. Press the New Line side key, and select the new-line character of returned
value using either the general purpose knob or the keypad.
Figure 1-11: Setting the TCP/IP parameters
3066 & 3086 3 GHz Real Time Spectrum Analyzer Programmer Manual
1-9
Getting Started
1-10
3066 & 3086 3 GHz Real Time Spectrum Analyzer Programmer Manual
Syntax and Commands
Command Syntax
This section contains general information on command structure and syntax
usage. You should familiarize yourself with this material before using the
analyzer command descriptions.
This manual describes commands and queries using the Backus-Naur Form
(BNF) notation. Table 2–1 defines the standard BNF symbols.
Table 2-1: BNF symbols and meanings
Symbol
Meaning
<ą>
Defined element
::=
Is defined as
|
Exclusive OR
{ą}
Group; one element is required
[ą]
Optional; can be omitted
.ă.Ă.
Previous element(s) may be repeated
(ą)
Comment
3066 & 3086 3 GHz Real Time Spectrum Analyzer Programmer Manual
2-1
Command Syntax
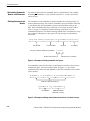
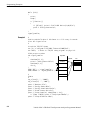
Commands and Queries
The analyzer commands are based on a hierarchical or tree structure (see Figure
2–1) that represents a subsystem. The top level of the tree is the root node; it is
followed by one or more lower-level nodes.
X
View1
Root node
Marker
LowerĆlevel
nodes
DeltaX
Peak
Figure 2-1: Example of subsystem hierarchy tree
You can create commands and queries from these subsystem hierarchy trees.
Commands specify actions for the instrument to perform. Queries return
measurement data and information about parameter settings.
Creating Commands
The analyzer commands are created by stringing together the nodes of a
subsystem hierarchy and separating each node by a colon (:).
In Figure 2–1, View1 is the root node and Marker, X, DeltaX, and Peak are
lower-level nodes. To create a command, start with the root node View1 and
move down the tree structure adding nodes until you reach the end of a branch.
Most commands and some queries have parameters; you must include a value for
these parameters. The command descriptions, which start on page 2–7, list the
valid values for all parameters.
For example, :View1:Marker:X 1.5 is a valid command created from the
hierarchy tree in Figure 2–1.
NOTE. If you specify a parameter value that is out of range, the parameter will
be set to a default value.
Creating Queries
2-2
To create a query, start at the root node of a tree structure, move down to the end
of a branch, and add a question mark. :View1:Marker:X? is an example of a
valid query using the hierarchy tree in Figure 2–1.
3066 & 3086 3 GHz Real Time Spectrum Analyzer Programmer Manual
Command Syntax
Headers in Query
Responses
You can control whether the analyzer returns headers as part of the query
response. Use the [:Util8]:Header command (page 2–386) to control this
feature. If header is on, the query response returns command headers and formats
itself as a valid set command. When header is off, the response includes only the
values. This may make it easier to parse and extract the information from the
response. Table 2–2 shows the difference in responses.
Table 2-2: Comparison of header off and on responses
Parameter Types
Query
Header off response
Header on response
:View1:Source?
"FILE1.AP"
:View1:Source "File1.AP"
:Setup:Span?
5M
:Setup:Span 5M
Parameters are indicated by angle brackets, such as <file_name>. There are
several different types of parameters, as listed in Table 2–3. The parameter type
is listed after the parameter. Some parameter types are defined specifically for
the analyzer command set and some are defined by ANSI/IEEE 488.2-1987.
Table 2-3: Parameter types used in syntax descriptions
Special Characters
Parameter Type
Description
Example
boolean
Boolean numbers or values
On, Off
discrete
A list of specific values
MIN, MAX
NR1 1 numeric
Integers
0, 1, 15, -1
NR2 1 numeric
Decimal numbers
1.2, 3.141516, -6.5
NR3 1 numeric
Floating point numbers
3.1415E-9, -16.1E5
NRf 1 numeric
Flexible decimal number that
may be type NR1, NR2, or NR3
See NR1, NR2, NR3 examples
string 2
Alphanumeric characters (must
be within quotation marks)
Testing 1, 2, 3"
1
An ANSI/IEEE 488.2Ć1992Ćdefined parameter type.
2
Defined in ANSI/IEEE 488.2 as String Response Data" and String Program Data."
The Line Feed (LF) character (ASCII 10) and all characters in the range of
ASCII 127-255 are defined as special characters. Using these characters in any
command yields unpredictable results.
3066 & 3086 3 GHz Real Time Spectrum Analyzer Programmer Manual
2-3
Command Syntax
Abbreviating Commands,
Queries, and Parameters
You must not abbreviate all commands, queries, and parameters. For example,
shortening the command :Setup:CenterFrequency to :Setup:CenterFreq
causes an error.
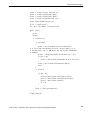
Chaining Commands and
Queries
You can chain several commands or queries together into a single message. To
create a chained message, first create a command or query, then add a semicolon
(;), and finally add more commands or queries and semicolons until you are
done. If the command following a semicolon is a root node, precede it with a
colon (:). Figure 2–2 illustrates a chained message consisting of several
commands and queries. The chained message should end in a command or query,
not a semicolon. Responses to any queries in your message are separated by
semicolons.
:Config:Setup Standard;:Setup:BlockSize 200;:View1:Marker:X?;:Util2:Source?
First command
Second command
The response from this chained message might be:
First query
Second query
1.2;Active
Response from first query
Response from second query
Figure 2-2: Example of chaining commands and queries
If a command or query has the same root and lower-level nodes as the previous
command or query, you can omit these nodes. In Figure 2–3, the second
command has the same root node (Marker) as the first command, so these nodes
can be omitted.
:View1:Marker:X 1.5;:View1:Marker:Y -20;:View1:Marker:DeltaMarker On
Identical root and lowerĆlevel nodes
:View1:Marker:X 1.5;Y -20;DeltaMarker On
First command
Additional commands
(omitted the root nodes)
Figure 2-3: Example of omitting root and lowerĆlevel nodes in a chained message
2-4
3066 & 3086 3 GHz Real Time Spectrum Analyzer Programmer Manual
Command Syntax
Unit and SI Prefix
If a decimal numeric argument refers to amplitude, frequency, or time, you can
express it using SI units instead of the scaled explicit point input value format
<NR3>. (SI units conform to the Systeme International d’Unites standard.) For
example, you can use the input format 200 m or 1.0 M instead of 200.0E–3 or
1.0E+6, respectively, to specify the argument.
NOTE. You must omit the unit, such as Hz and dB. For example, 5 MHz of
frequency is represented by “5M” in a command.
The SI prefixes, which must be included, are shown below. Note that either
lower or upper case prefixes can be used.
SI prefix
p/P
n/N
u/U
m/M
k/K
m/M
g/G
Corresponding power
10-12
10-9
10-6
10-3
103
106
109
*
General Rules
Note that the prefix m/M indicates 10-3 when the decimal numeric argument denotes
amplitude or time, but 106 when it denotes frequency.
Here are three general rules for using the analyzer commands, queries, and
parameters:
H
H
You must use double (“ ”) quotation marks for quoted strings.
correct:
“This string uses quotation marks correctly.”
incorrect:
‘This string also uses quotation marks correctly.’
incorrect:
“This string does not use quotation marks correctly.’
You can use upper case, lower case, or a mixture of both cases for all
commands, queries, and parameters.
:VIEW1:MASK:RBW1M:FREQUENCYĂ25M
is the same as
:view1:mask:rbw1m:frequencyĂ25m
and
:view1:mask:rbw1m:FREQUENCYĂ25M
H
No embedded spaces are allowed between or within nodes.
correct:
:VIEW1:MASK:RBW1M:FREQUENCYĂ25M
incorrect:
:VIEW1: MASK: RBW1M: FREQ UENCYĂ25M
3066 & 3086 3 GHz Real Time Spectrum Analyzer Programmer Manual
2-5
Command Syntax
Constructed Mnemonics
Some header mnemonics specify one of a range of mnemonics. For example, a
view mnemonic can be either View1, View2, ... or View8. You use these
mnemonics in the command just as you do any other mnemonic. For example,
there is a View1:Format command, and there is also a View2:Format command.
In the command descriptions, this list of choices is abbreviated as View<x>.
Table 2-4: Constructed mnemonics
2-6
Symbol
Meaning
View<x>
A view specifier where <x> = 1 to 8, corresponding to A - H
Utility<x>
A utility specifier where <x> = 1 to 8, corresponding to A - H
Dev<x>
A GPIB device where <x> is the GPIB address
Result<x>
A result specifier whrere <x> ranges 1 to 26, depending on commands
<address>
GPIB address, ranging 1 to 30
<command>
IEEE 488.2 command e.g. *IDN
<message>
Specify the message for the command
<item>
Specify the item for the command
3066 & 3086 3 GHz Real Time Spectrum Analyzer Programmer Manual
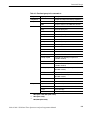
Command Groups
The following sections list the 3066 and 3086 spectrum analyzer commands in
two ways. They first present them by functional groups, then list them alphabetically. The functional group lists start below. The alphabetical lists provide more
detail on each command and start on page 2–37.
Items followed by question marks are queries; items without question marks are
commands. Some items in this section have a question mark in parentheses (?) in
the command header section; this indicates that the item can be both a command
and a query.
3066 & 3086 3 GHz Real Time Spectrum Analyzer Programmer Manual
2-7
Command Groups
Functional Groups
There are four main groups:
H
Configuration command group configures the analyzer for the specific
measurement. Also, it starts or stops data acquisition.
H
Setup command group sets up the analyzer hardware, such as frequency,
span, trigger, and memory.
H
View command group displays waveform and performs measurement.
H
Utility command group controls the utilities, such as self calibration, file
management, averaging, and remote operation.
Table 2–5 lists the functional groups and subgroups of the commands. The
analyzer has its system program modules corresponding to each subgroup.
2-8
3066 & 3086 3 GHz Real Time Spectrum Analyzer Programmer Manual
Command Groups
Table 2-5: Functional groups in the command set
Group
Subgroup
Description
Configuration
-
Configure the analyzer and start/stop acquisition
Setup
Standard
Set up the analyzer for the standard measurement
CDMA
Set up the analyzer for the CDMA measurement
Waveform
Control the Waveform view
Analog
Control the Analog view
FSK
Control the FSK view
Spectrogram
Control the Spectrogram view
Waterfall
Control the Waterfall view
Polar
Control the Polar view
Eye diagram
Control the Eye diagram view
Symbol table
Control the Symbol table view
EVM
Control the EVM view
CDMA Waveform
Control the CDMA Waveform view
CDMA Polar
Control the CDMA Polar view
CDMA Time
Control the CDMA Time view
View
Utility
CodeSpectrogram
1
Control the codeĆdomain spectrogram view
(cdmaOne standard)
CodePolar
1
Control the polar view (cdmaOne standard)
CodePower
1
Control the codeĆdomain power view
(cdmaOne standard)
CodeWSpectrogram
2
Control the codeĆdomain spectrogram view
(WĆCDMA standard)
CodeWPolar
2
Control the polar view (WĆCDMA standard)
CodeWPower
2
Control the codeĆdomain power view
(WĆCDMA standard)
CCDF
3
Control the CCDF measurement
CCDFView
3
Control the CCDF view
Self gainĆcalibration
Control the self gainĆcalibration
Save/Load
Control to save and load data to/from files
Average
Control averaging
Remote
Control remote operation
1
3066 option 15 and 3086 option 16 only.
2
3086 option 16 only.
3
3066/3086 option 20 only.
3066 & 3086 3 GHz Real Time Spectrum Analyzer Programmer Manual
2-9
Command Groups
General Programming Sequence
The programs for controlling the analyzer have the following steps in general:
1. Configuration: Use the Configuration command group to set the basic
operation mode and assign the Views.
Also, use the Remote command subgroup (Util8) to set the communication
parameters with other device.
2. Setup: Use the Setup command group to set the hardware, such as frequency,
span, trigger, and memory.
3. Acquisition: Use the Configuration command group to start or stop the
waveform acquisition.
You can load previously acquired data with the Save/Load command
subgroup (Util2).
4. Measurement and Display: Use the View command group to measure and
display the result. For example, if you have selected the Spectrogram View
in the configuration, use the Spectrogram View command subgroup.
You can use the Average command subgroup (Util3) to average waveforms.
Also, you can save the data to a file with the Save/Load command subgroup
(Util2).
Section 4, Programming Examples shows some example programs.
Powering on the analyzer initializes its settings to the factory defaults. For the
details about the factory defaults, refer to Appendix B: Factory Initialization
Settings.
2-10
3066 & 3086 3 GHz Real Time Spectrum Analyzer Programmer Manual
Command Groups
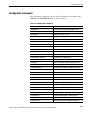
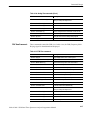
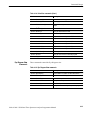
Configuration Commands
These commands configure the system. These commands are equivalent to the
CONFIG and START/STOP menu on the front panel.
Table 2-6: Configuration commands
Header
Description
:Config:Block
Start or stop data acquisition in the Block mode
:Config:Continue
Continue the data acquisition
:Config:Label
Display a label on the screen
:Config:Message
Display a message in red on the screen
:Config:Mode
Load settings from the basic configuration file
:Config:Mode:Load
Load settings from a file saved before
:Config:Mode:Save
Save settings to a file
:Config:Next
Stop and restart a block data acquisition
:Config:Pause (?)
Pause the data acquisition on each block
:Config:PrintScreen
Print a screen image to a printer
:Config:PrintScreen:Printer (?)
Specify the printer to print screen images
:Config:PrintScreen:Items?
Return the list of available printers
:Config:PrintScreen:Save
Save a screen image to a file
:Config:Roll
Start or stop the data acquisition in the Roll mode
:Config:Setup (?)
Load the Setup program for the SETUP menu
:Config:Setup:Items?
Return the list of available programs for the setup
:Config:Setup:Show
Display the CONFIG:SETUP menu
:Config:Start
Start a data acquisition in the Block mode
:Config:StartAgain
Stop and restart the acquisition in the Block mode
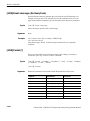
:Config:Status:Overload?
Query the overload status of the A/D converter
:Config:Status:Pause?
Query if the data acquisition pauses
:Config:Status:Triggered?
Query if the analyzer is triggered
:Config:Status:Uncal?
Query if the analyzer is uncalibrated
:Config:Stop
Stop the data acquisition
:Config:System?
Query the instrument name
:Config:Util:Items?
Return the list of available programs for the utility
:Config:Util<x> (?)
Assign the Utility program to a Utility side key
:Config:Util<x>:Show
Display the CONFIG:UTILITY menu
:Config:Version?
Query the version of the Configuration program
3066 & 3086 3 GHz Real Time Spectrum Analyzer Programmer Manual
2-11
Command Groups
Table 2-6: Configuration commands (Cont.)
Header
Description
:Config:View:BackgroundColor (?)
Select the background color for waveform view area
:Config:View:Items?
Return the list of available programs for the view
:Config:View:MarkerLink (?)
Determine whether the markers in different views
move in unison or separately
:Config:View:Style (?)
Select the view layout
:Config:View<x> (?)
Assign the View program to a View side key
:Config:View<x>:Show
Display the View menu
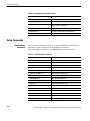
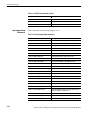
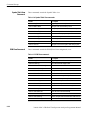
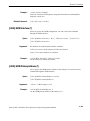
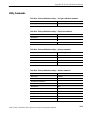
Setup Commands
Standard Setup
Commands
When you select Standard in the Config:Setup command, use the following
commands to control parameters for the standard measurement.
These commands are equivalent to the SETUP menu on the front panel.
Table 2-7: Standard Setup commands
2-12
Header
Description
:Setup:BlockSize (?)
Set the number of frames per block
:Setup:CenterFrequency (?)
Set the center frequency
:Setup:FFTPoints (?)
Set the number of FFT sampling points per frame
:Setup:FFTWindow (?)
Select the FFT window
:Setup:FramePeriod (?)
Set the frame period in the Block mode
:Setup:FrequencyOffset (?)
Set the frequency display offset
:Setup:InputCoupling (?)
Select the input coupling to the RF input
:Setup:InputMode (?)
Select the signal input mode
:Setup:LevelOffset (?)
Set the level display offset
:Setup:Load
Load a trigger mask from a file
:Setup:MarkerToFreq
Set the center frequency to the value at the marker
:Setup:MaxSpan
Set the span to the maximum
:Setup:MemoryMode (?)
Select the memory mode
:Setup:ReferenceLevel (?)
Set the reference level
:Setup:ReferenceOsc (?)
Select the reference oscillator
:Setup:Save
Save a trigger mask to a file
3066 & 3086 3 GHz Real Time Spectrum Analyzer Programmer Manual
Command Groups
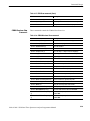
Table 2-7: Standard Setup commands (Cont.)
CDMA Setup Commands
Header
Description
:Setup:Span (?)
Select the span
:Setup:Trigger (?)
Select the trigger mode
:Setup:TriggerCount (?)
Turn the trigger counter on or off
:Setup:TriggerDelayed (?)
Set the delay time in the Delayed trigger mode
:Setup:TriggerDomain (?)
Select the trigger domain
:Setup:TriggerInterval (?)
Set the time interval in the Interval trigger mode
:Setup:TriggerPosition (?)
Set the trigger position
:Setup:TriggerSlope (?)
Select the trigger slope
:Setup:TriggerSource (?)
Select the trigger source
:Setup:TriggerTimeout (?)
Set the timeout in the Timeout trigger mode
:Setup:TriggerTimes (?)
Set the trigger count in the Count trigger mode
:Setup:Version?
Query the version of the Setup program
:Setup:Zoom:Execute
Expand the waveform
:Setup:Zoom:Frequency (?)
Set the center frequency for zooming
:Setup:Zoom:Mag (?)
Select the magnification factor for zooming
When you select CDMA in the Config:Setup command, use the following
commands to control parameters for the CDMA measurement.
These commands are equivalent to the SETUP menu on the front panel.
Table 2-8: CDMA Setup commands
Header
Description
:Setup:BlockSize (?)
Set the number of frames per block
:Setup:CDMA:Channel (?)
Select the channel
:Setup:CDMA:Span30M
Set the span to 30 MHz
:Setup:CDMA:Span50M
Set the span to 50 MHz
:Setup:CDMA:Span5MAuto
Set the span to 5 MHz and the trigger mode to
Auto
:Setup:CDMA:Span5MNormal
Set the span to 5 MHz and the trigger mode to
Normal
:Setup:CDMA:Standard (?)
Select the CDMA standard
:Setup:CDMA:TriggerLevel (?)
Set the trigger mask level in the time domain
:Setup:MarkerToFreq
Set the center frequency to the value at the marker
3066 & 3086 3 GHz Real Time Spectrum Analyzer Programmer Manual
2-13
Command Groups
Table 2-8: CDMA Setup commands (Cont.)
Header
Description
:Setup:MaxSpan
Set the span to the maximum
:Setup:ReferenceLevel (?)
Set the reference level
:Setup:ReferenceOsc (?)
Select the reference oscillator
:Setup:Span (?)
Select the span
:Setup:Trigger (?)
Select the trigger mode
:Setup:TriggerCount (?)
Turn the trigger counter on or off
:Setup:TriggerDelayed (?)
Set the delay time in the Delayed trigger mode
:Setup:TriggerDomain (?)
Select the trigger domain
:Setup:TriggerInterval (?)
Set the time interval in the Interval trigger mode
:Setup:TriggerPosition (?)
Set the trigger position in a block
:Setup:TriggerSlope (?)
Select the trigger slope
:Setup:TriggerSource (?)
Select the trigger source
:Setup:TriggerTimeout (?)
Set the timeout in the Timeout trigger mode
:Setup:TriggerTimes (?)
Set the trigger count in the Count trigger mode
:Setup:Version?
Query the version of the CDMA Setup program
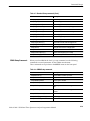
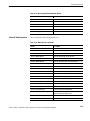
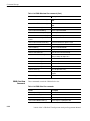
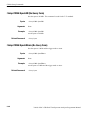
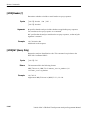
View Commands
Waveform View
Commands
These commands control the Waveform view.
Table 2-9: Waveform View commands
2-14
Header
Description
:View<x>:Average:Times (?)
Set the number of frames for averaging
:View<x>:Average:Type (?)
Select the average type
:View<x>:Compression (?)
Select the way to compress data for displaying
:View<x>:CopyFrom
Copy display data from a text file to the data register
:View<x>:CopyTo
Copy display data to a file or data register
:View<x>:Edit (?)
Determine whether or not to display the trigger mask
:View<x>:Edit:DrawHorizontal
Draw the entire trigger mask line horizontally through
the marker
:View<x>:Edit:DrawLine
Draw the trigger mask line between the marker and
the delta marker
3066 & 3086 3 GHz Real Time Spectrum Analyzer Programmer Manual
Command Groups
Table 2-9: Waveform View commands (Cont.)
Header
Description
:View<x>:Edit:DrawMax
Draw the entire trigger mask line horizontally at the
maximum level
:View<x>:Edit:DrawMin
Draw the entire trigger mask line horizontally at the
minimum level
:View<x>:Edit:Y (?)
Set the vertical position of the marker in editing the
trigger mask
:View<x>:Format (?)
Select the waveform display format
:View<x>:Marker:Band:Center (?)
Set the center frequency of the band marker
:View<x>:Marker:Band:Left (?)
Set the left side frequency of the band marker
:View<x>:Marker:Band:Right (?)
Set the right side frequency of the band marker
:View<x>:Marker:Band:Width (?)
Set the bandwidth of the band marker
:View<x>:Marker:DeltaMarker (?)
Turn on or off the delta marker
:View<x>:Marker:DeltaX (?)
Set the horizontal position of the delta marker
:View<x>:Marker:DeltaY?
Query the vertical position of the delta marker
:View<x>:Marker:Peak
Move the marker to the adjacent peak
:View<x>:Marker:ResetDelta
Move the delta marker to the marker position
:View<x>:Marker:SearchMax
Search the maximum peak and place the marker on it
:View<x>:Marker:SearchMin
Search the minimum peak and place the marker on it
:View<x>:Marker:SearchSeparation (?)
Set the resolution to separate two peaks
:View<x>:Marker:Trace (?)
Select the trace on which the markers are placed
:View<x>:Marker:X (?)
Set the horizontal position of the marker
:View<x>:Marker:Y?
Query the vertical position of the marker
:View<x>:MaskVisible (?)
Specify whether or not to display the trigger mask
:View<x>:Measurement (?)
Select the measurement item
:View<x>:Measurement:ACP:BW (?)
Set the bandwidth for the ACP measurement
:View<x>:Measurement:ACP:Marker
(?)
Select the marker position for the ACP measurement
:View<x>:Measurement:ACP:SP (?)
Set the frequency interval between adjacent channels
for the ACP measurement
:View<x>:Measurement:OBW (?)
Set the occupied bandwidth
:View<x>:Position (?)
Set the display position in a block
:View<x>:Result<y>?
Query the measurement results
:View<x>:Scale:AutoScale
Scale the vertical axis automatically
:View<x>:Scale:HoldYScale (?)
Determine whether to hold or reset the vertical scale
when you change the input source
3066 & 3086 3 GHz Real Time Spectrum Analyzer Programmer Manual
2-15
Command Groups
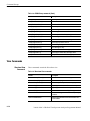
Table 2-9: Waveform View commands (Cont.)
Analog View Commands
Header
Description
:View<x>:Scale:XScale (?)
Scale the horizontal axis
:View<x>:Scale:XStart (?)
Set the start point of the horizontal axis on the screen
:View<x>:Scale:YScale (?)
Scale the vertical axis
:View<x>:Scale:YStart (?)
Set the start point of the vertical axis on the screen
:View<x>:Source (?)
Select the input data source
:View<x>:Trace2:Compression (?)
Select the compression method to display the trace 2
:View<x>:Trace2:Format (?)
Select the display format of the trace 2
:View<x>:Trace2:Source (?)
Select the input data source of the trace 2
:View<x>:Trace2:Z (?)
Set the frame number of the trace 2
:View<x>:Version?
Query the version of the Waveform View program
:View<x>:Z (?)
Set the frame number
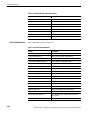
These commands control the Analog view to analyze an analog modulating
signal. This view is capable of demodulating and displaying PM (Phase
Modulation), AM (Amplitude Modulation), or FM (Frequency Modulation)
signals.
Table 2-10: Analog View commands
2-16
Header
Description
:View<x>:CopyTo
Copy display data to a file or data register
:View<x>:Format (?)
Select the waveform display format
:View<x>:Marker:DeltaMarker (?)
Turns on or off the delta marker
:View<x>:Marker:DeltaX (?)
Query the horizontal position of the delta marker
:View<x>:Marker:DeltaY?
Query the vertical position of the delta marker
:View<x>:Marker:Peak
Move the marker to the adjacent peak
:View<x>:Marker:ResetDelta
Move the delta marker to the marker position
:View<x>:Marker:SearchMax
Search the maximum peak and place the marker on it
:View<x>:Marker:SearchMin
Search the minimum peak and place the marker on it
:View<x>:Marker:SearchSeparation (?)
Set the resolution to separate two peaks
:View<x>:Marker:X (?)
Set the horizontal position of the marker
:View<x>:Marker:Y?
Query the vertical position of the marker
:View<x>:Scale:AutoScale
Scale the vertical axis automatically
3066 & 3086 3 GHz Real Time Spectrum Analyzer Programmer Manual
Command Groups
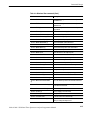
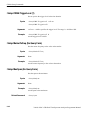
Table 2-10: Analog View commands (Cont.)
FSK View Commands
Header
Description
:View<x>:Scale:HoldYScale (?)
Determine whether to hold or reset the vertical scale
when you change the input source
:View<x>:Scale:XScale (?)
Scale the horizontal axis
:View<x>:Scale:XStart (?)
Set the start point of the horizontal axis on the screen
:View<x>:Scale:YScale (?)
Scale the vertical axis
:View<x>:Scale:YStart (?)
Set the start point of the vertical axis on the screen
:View<x>:Source (?)
Select the input data source
:View<x>:Version?
Query the version of the Analog View program
:View<x>:Z (?)
Set the frame number
These commands control the FSK view. In this view, the FSK (Frequency Shift
Keying) signal is demodulated and displayed.
Table 2-11: FSK View commands
Header
Description
:View<x>:CopyTo
Copy display data to a file or data register
:View<x>:Marker:DeltaMarker (?)
Turns on or off the delta marker
:View<x>:Marker:DeltaX (?)
Set the horizontal position of the delta marker
:View<x>:Marker:DeltaY?
Query the vertical position of the delta marker
:View<x>:Marker:Peak
Move the marker to the adjacent peak
:View<x>:Marker:ResetDelta
Move the delta marker to the marker position
:View<x>:Marker:SearchMax
Search the maximum peak and place the marker on it
:View<x>:Marker:SearchMin
Search the minimum peak and place the marker on it
:View<x>:Marker:SearchSeparation (?)
Set the resolution to separate two peaks
:View<x>:Marker:X (?)
Set the horizontal position of the marker
:View<x>:Marker:Y?
Query the vertical position of the marker
:View<x>:Scale:AutoScale
Scale the vertical axis automatically
:View<x>:Scale:HoldYScale (?)
Determine whether to hold or reset the vertical scale
when you change the input source
:View<x>:Scale:XScale (?)
Scale the horizontal axis
:View<x>:Scale:XStart (?)
Set the start point of the horizontal axis on the screen
:View<x>:Scale:YScale (?)
Scale the vertical axis
:View<x>:Scale:YStart (?)
Set the start point of the vertical axis on the screen
3066 & 3086 3 GHz Real Time Spectrum Analyzer Programmer Manual
2-17
Command Groups
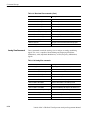
Table 2-11: FSK View commands (Cont.)
Spectrogram View
Commands
Header
Description
:View<x>:Source (?)
Select the input data source
:View<x>:Version?
Query the version of the FSK View program
:View<x>:Z (?)
Set the frame number
These commands control the Spectrogram view.
Table 2-12: Spectrogram View commands
2-18
Header
Description
:View<x>:Compression (?)
Select the way to compress data for displaying
:View<x>:Format (?)
Select the waveform display format
:View<x>:Marker:DeltaMarker (?)
Turn the delta marker on or off
:View<x>:Marker:DeltaT?
Query the delta marker position on the time axis
:View<x>:Marker:DeltaX (?)
Set the horizontal position of the delta marker
:View<x>:Marker:DeltaY?
Query the vertical position of the delta marker
:View<x>:Marker:DeltaZ (?)
Set the delta marker position on the Z axis
:View<x>:Marker:Peak
Move the marker to the adjacent peak
:View<x>:Marker:ResetDelta
Move the delta marker to the marker position
:View<x>:Marker:SearchMax
Search the maximum peak and place the marker on it
:View<x>:Marker:SearchMin
Search the minimum peak and place the marker on it
:View<x>:Marker:SearchSeparation (?)
Set the resolution to separate two peaks
:View<x>:Marker:T?
Query the marker position on the time axis
:View<x>:Marker:X (?)
Set the horizontal position of the marker
:View<x>:Marker:Y?
Query the vertical position of the marker
:View<x>:Marker:Z (?)
Set the marker position on the Z axis
:View<x>:Monochrome (?)
Set the display to monochrome
:View<x>:NumberColors (?)
Select the number of display colors
:View<x>:Scale:AutoScale
Scale the vertical axis automatically
:View<x>:Scale:HoldYScale (?)
Determine whether to hold or reset the vertical scale
when you change the input source
:View<x>:Scale:XScale (?)
Scale the horizontal axis
:View<x>:Scale:XStart (?)
Set the start point of the horizontal axis on the screen
:View<x>:Scale:YScale (?)
Scale the vertical axis
3066 & 3086 3 GHz Real Time Spectrum Analyzer Programmer Manual
Command Groups
Table 2-12: Spectrogram View commands (Cont.)
Waterfall View Commands
Header
Description
:View<x>:Scale:YStart (?)
Set the start point of the vertical axis on the screen
:View<x>:Scale:ZScale (?)
Scale the Z axis
:View<x>:Scale:ZStart (?)
Set the start point of the Z axis on the screen
:View<x>:Source (?)
Select the input data source
:View<x>:Version?
Query the version of the Spectrogram View program
:View<x>:ZGap (?)
Set the interval between two frames on the Z axis
These commands control the Waterfall view.
Table 2-13: Waterfall View commands
Header
Description
:View<x>:Compression (?)
Select the way to compress data for displaying
:View<x>:Format (?)
Select the waveform display format
:View<x>:Marker:DeltaMarker (?)
Turn the delta marker on or off
:View<x>:Marker:DeltaT?
Query the delta marker on the time axis
:View<x>:Marker:DeltaX (?)
Set the horizontal position of the delta marker
:View<x>:Marker:DeltaY?
Query the vertical position of the delta marker
:View<x>:Marker:DeltaZ (?)
Set the delta marker position on the Z axis
:View<x>:Marker:Peak
Move the marker to the adjacent peak
:View<x>:Marker:ResetDelta
Move the delta marker to the marker position
:View<x>:Marker:SearchMax
Search the maximum peak and place the marker on it
:View<x>:Marker:SearchMin
Search the minimum peak and place the marker on it
:View<x>:Marker:SearchSeparation (?)
Set the resolution to separate two peaks
:View<x>:Marker:T?
Query the marker position on the time axis
:View<x>:Marker:X (?)
Set the horizontal position of the marker
:View<x>:Marker:Y?
Query the vertical position of the marker
:View<x>:Marker:Z (?)
Set the marker position on the Z axis
:View<x>:Scale:AutoScale
Scale the vertical axis automatically
:View<x>:Scale:HoldYScale (?)
Determine whether to hold or reset the vertical scale
when you change the input source
:View<x>:Scale:XScale (?)
Scale the horizontal axis
:View<x>:Scale:XStart (?)
Set the start point of the horizontal axis on the screen
3066 & 3086 3 GHz Real Time Spectrum Analyzer Programmer Manual
2-19
Command Groups
Table 2-13: Waterfall View commands (Cont.)
Polar View Commands
Header
Description
:View<x>:Scale:YScale (?)
Scale the vertical axis
:View<x>:Scale:YStart (?)
Set the start point of the vertical axis on the screen
:View<x>:Scale:ZScale (?)
Scale the Z axis
:View<x>:Scale:ZStart (?)
Set the start point of the Z axis on the screen
:View<x>:Source (?)
Select the input data source
:View<x>:Version?
Query the version of the Waterfall View program
:View<x>:YHeight (?)
Specify the number of pixels of vertical fullĆscale
:View<x>:ZGap (?)
Set interval between adjacent Z axes on the screen
These commands control the Polar view.
Table 2-14: Polar View commands
2-20
Header
Description
:View<x>:AlphaBT (?)
Set the a/BT
:View<x>:AutoCarrier (?)
Turn on or off the carrier search function
:View<x>:Burst:BlockSize (?)
Set the range for searching a burst
:View<x>:Burst:NumberFrames (?)
Set the range for acquiring burst data
:View<x>:Burst:Offset (?)
Set the start point for acquiring burst data
:View<x>:Burst:Search (?)
Determine whether to search a burst
:View<x>:Burst:Threshold (?)
Set the threshold to detect the rising edge of a burst
:View<x>:Carrier (?)
Set the carrier frequency
:View<x>:Display (?)
Select the display data source
:View<x>:Format (?)
Select the waveform display format
:View<x>:Marker:A?
Query the amplitude at the marker position
:View<x>:Marker:DeltaT (?)
Set the delta marker position on the time axis
:View<x>:Marker:P?
Query the phase at the marker position
:View<x>:Marker:T (?)
Set the marker position on the time axis
:View<x>:Marker:X?
Query the horizontal position of the marker
:View<x>:Marker:Y?
Query the vertical position of the marker
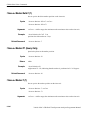
:View<x>:MeasDestination (?)
Select the data register to which the measurement
data is output
:View<x>:MeasFilter (?)
Select the filter for the measurement data
3066 & 3086 3 GHz Real Time Spectrum Analyzer Programmer Manual
Command Groups
Table 2-14: Polar View commands (Cont.)
Eye Diagram View
Commands
Header
Description
:View<x>:Modulation (?)
Select the modulation type
:View<x>:Position (?)
Set display position in a block
:View<x>:RefDestination (?)
Select the data register to which the reference data is
output
:View<x>:RefFilter (?)
Select the filter for the reference data
:View<x>:Result<y>?
Query the measurement results
:View<x>:Source (?)
Select the input data source
:View<x>:Standard:CDPD
Set parameters according to the CDPD standard
:View<x>:Standard:GSM
Set parameters according to the GSM standard
:View<x>:Standard:NADC
Set parameters according to the NADC standard
:View<x>:Standard:PDC
Set parameters according to the PDC standard
:View<x>:Standard:PHS
Set parameters according to the PHS standard
:View<x>:Standard:TETRA
Set parameters according to the TETRA standard
:View<x>:SymbolRate (?)
Set the symbol rate
:View<x>:Version?
Query the version of the Polar View program
:View<x>:Z (?)
Set the frame number
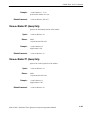
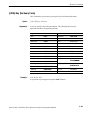
These commands control the Eye Diagram view.
Table 2-15: Eye Diagram View commands
Header
Description
:View<x>:EyeLength (?)
Set the number of symbols on the horizontal axis
:View<x>:Format (?)
Select the waveform display format
:View<x>:Marker:T (?)
Set the marker position on the time axis
:View<x>:Marker:Y?
Query the vertical position of the marker
:View<x>:Source (?)
Select the input data source
:View<x>:Version?
Query the version of the Eye Diagram View program
3066 & 3086 3 GHz Real Time Spectrum Analyzer Programmer Manual
2-21
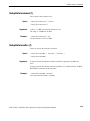
Command Groups
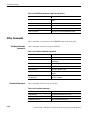
Symbol Table View
Commands
These commands control the Symbol Table view.
Table 2-16: Symbol Table View commands
EVM View Commands
Header
Description
:View<x>:CopyTo
Copy display data to the clipboard
:View<x>:Marker:Data?
Query the value at the marker position
:View<x>:Marker:Symbol?
Query the symbol location where the marker is placed
:View<x>:Marker:T (?)
Set the marker position on the time axis
:View<x>:Radix (?)
Select the radix to display the Symbol Table
:View<x>:Rotate (?)
Set the reference phase
:View<x>:Source (?)
Select the input data source
:View<x>:Symbol (?)
Set the symbol location where the marker is placed
:View<x>:Version?
Query the version of the Symbol Table View program
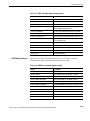
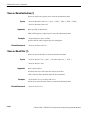
These commands control the EVM (Error Vector Magnitude) view.
Table 2-17: EVM View commands
2-22
Header
Description
:View<x>:CopyTo
Copy display data to a file or data register
:View<x>:Format (?)
Select the waveform display format
:View<x>:Marker:DeltaMarker (?)
Turn the delta marker on or off
:View<x>:Marker:DeltaX (?)
Set the horizontal position of the delta marker
:View<x>:Marker:DeltaY?
Query the vertical position of the delta marker
:View<x>:Marker:ResetDelta
Move the delta marker to the marker position
:View<x>:Marker:SearchMax
Search the maximum peak and place the marker on it
:View<x>:Marker:SearchMin
Search the minimum peak and place the marker on it
:View<x>:Marker:X (?)
Set the horizontal position of the marker
:View<x>:Marker:Y?
Query the vertical position of the marker
:View<x>:MaskArea (?)
Set the area to exclude from calculating EVM
:View<x>:Result<y>?
Query the measurement results
:View<x>:Scale:AutoScale
Scale the vertical axis automatically
:View<x>:Scale:XScale (?)
Scale the horizontal axis
:View<x>:Scale:XStart (?)
Set the start point of the horizontal axis on the screen
:View<x>:Scale:YScale (?)
Scale the vertical axis
3066 & 3086 3 GHz Real Time Spectrum Analyzer Programmer Manual
Command Groups
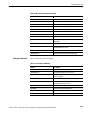
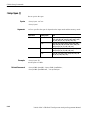
Table 2-17: EVM View commands (Cont.)
CDMA Waveform View
Commands
Header
Description
:View<x>:Scale:YStart (?)
Set the start point of the vertical axis on the screen
:View<x>:Symbol (?)
Set the symbol location where the marker is placed
:View<x>:Version?
Query the version of the EVM View program
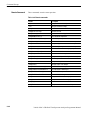
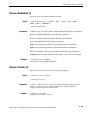
These commands control the CDMA Waveform view.
Table 2-18: CDMA Waveform View commands
Header
Description
:View<x>:Average:Times (?)
Set the number of frames for averaging
:View<x>:Average:Type (?)
Select the average type
:View<x>:CDMA:Channel (?)
Select the channel
:View<x>:CDMA:Standard (?)
Select the CDMA standard
:View<x>:Compression (?)
Select the way to compress data for displaying
:View<x>:CopyFrom
Copy display data from a text file to data register
:View<x>:CopyTo
Copy display data to a file or data register
:View<x>:Format (?)
Select the waveform display format
:View<x>:Marker:DeltaMarker (?)
Turn on or off the delta marker
:View<x>:Marker:DeltaX (?)
Set the horizontal position of the delta marker
:View<x>:Marker:DeltaY?
Query the vertical position of the delta marker
:View<x>:Marker:Peak
Move the marker to the adjacent peak
:View<x>:Marker:ResetDelta
Move the delta marker to the marker position
:View<x>:Marker:SearchMax
Search the maximum peak and place the marker on it
:View<x>:Marker:SearchMin
Search the minimum peak and place the marker on it
:View<x>:Marker:SearchSeparation (?)
Set the resolution to separate two peaks
:View<x>:Marker:X (?)
Set the horizontal position of the marker
:View<x>:Marker:Y?
Query the vertical position of the marker
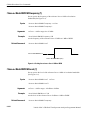
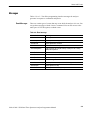
:View<x>:Mask:RBW1M:Frequency (?)
Set frequency of the reference line at 1 MHz RBW
:View<x>:Mask:RBW1M:Level (?)
Set level of the reference line at 1 MHz RBW
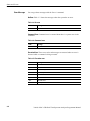
:View<x>:Mask:RBW30k:Frequency1
(?)
Set the inner frequency of the reference line at
30 kHz RBW
:View<x>:Mask:RBW30k:Frequency2
(?)
Set the outer frequency of the reference line at
30 kHz RBW
3066 & 3086 3 GHz Real Time Spectrum Analyzer Programmer Manual
2-23
Command Groups
Table 2-18: CDMA Waveform View commands (Cont.)
CDMA Polar View
Commands
Header
Description
:View<x>:Mask:RBW30k:Level1 (?)
Set the inner level of the reference line at 30 kHz
RBW
:View<x>:Mask:RBW30k:Level2 (?)
Set the outer level of the reference line at 30 kHz
RBW
:View<x>:Measurement (?)
Select the measurement function
:View<x>:Measurement:OBW (?)
Set the occupied bandwidth
:View<x>:Measurement:Separation (?)
Set the spurious resolution
:View<x>:Measurement:SortedBy (?)
Select the sort key of spurious
:View<x>:Measurement:SpuriousĆ
Search
Turn the spurious search function on or off
:View<x>:Measurement:Threshold (?)
Set the threshold for the spurious search
:View<x>:Position (?)
Set the display position in a block
:View<x>:RBW (?)
Set the resolution bandwidth
:View<x>:Result<y>?
Query the measurement results
:View<x>:Scale:AutoScale
Scale the vertical axis automatically
:View<x>:Scale:HoldYScale (?)
Determine whether to hold or reset the vertical scale
when you change the input source
:View<x>:Scale:XScale (?)
Scale the horizontal axis
:View<x>:Scale:XStart (?)
Set the start point of the horizontal axis on the screen
:View<x>:Scale:YScale (?)
Scale the vertical axis
:View<x>:Scale:YStart (?)
Set the start point of the vertical axis on the screen
:View<x>:Source (?)
Select the input data source
:View<x>:Version?
Query the version of the CDMA Waveform View
program
:View<x>:Z (?)
Set the frame number
These commands control the CDMA Polar view.
Table 2-19: CDMA Polar View commands
2-24
Header
Description
:View<x>:AlphaBT (?)
Set the a/BT
:View<x>:AutoCarrier (?)
Turn the carrier search function on or off
:View<x>:Burst:BlockSize (?)
Set the range for searching a burst
:View<x>:Burst:NumberFrames (?)
Set the range for acquiring burst data
3066 & 3086 3 GHz Real Time Spectrum Analyzer Programmer Manual
Command Groups
Table 2-19: CDMA Polar View commands (Cont.)
Header
Description
:View<x>:Burst:Offset (?)
Set the start point for acquiring burst data
:View<x>:Burst:Search (?)
Determine whether to search a burst
:View<x>:Burst:Threshold (?)
Set the threshold to detect the rising edge of a burst
:View<x>:Carrier (?)
Set the carrier frequency
:View<x>:Display (?)
Select the display data source
:View<x>:Format (?)
Select the waveform display format
:View<x>:Marker:A?
Query the amplitude at the marker position
:View<x>:Marker:DeltaT (?)
Set the delta marker position on the time axis
:View<x>:Marker:P?
Query the phase at the marker position
:View<x>:Marker:T (?)
Set the marker position on the time axis
:View<x>:Marker:X?
Query the horizontal position of the marker
:View<x>:Marker:Y?
Query the vertical position of the marker
:View<x>:MeasDestination (?)
Select the data register to which the measurement
data is output
:View<x>:MeasFilter (?)
Select the filter for the measurement data
:View<x>:Modulation (?)
Select the modulation type
:View<x>:Position (?)
Set the display position in a block
:View<x>:RefDestination (?)
Select the data register to which the reference data is
output
:View<x>:RefFilter (?)
Select the filter for the reference data
:View<x>:Result<y>?
Query the measurement results
:View<x>:Source (?)
Select the input data source
:View<x>:Standard:CDPD
Set parameters according to the CDPD standard
:View<x>:Standard:GSM
Set parameters according to the GSM standard
:View<x>:Standard:IS95
Set parameters according to the ISĆ95 standard
:View<x>:Standard:NADC
Set parameters according to the NADC standard
:View<x>:Standard:PDC
Set parameters according to the PDC standard
:View<x>:Standard:PHS
Set parameters according to the PHS standard
:View<x>:Standard:TETRA
Set parameters according to the TETRA standard
:View<x>:SymbolRate (?)
Set the symbol rate
:View<x>:Version?
Query the version of the CDMA Polar View program
:View<x>:Z (?)
Set the frame number
3066 & 3086 3 GHz Real Time Spectrum Analyzer Programmer Manual
2-25
Command Groups
CDMA Time View
Commands
These commands control the CDMA Time view.
Table 2-20: CDMA Time View commands
2-26
Header
Description
:View<x>:Average:Times (?)
Set the number of frames for averaging
:View<x>:Block (?)
Set the block number
:View<x>:BreakMeasure
Stop executing the Measure function
:View<x>:BreakMeasureData
Stop executing the Measure Data function
:View<x>:Executing?
Query the operation status of the Measure or
MeasureData command
:View<x>:Marker:DeltaMarker (?)
Turn the delta marker on or off
:View<x>:Marker:DeltaX (?)
Set the horizontal position of the delta marker
:View<x>:Marker:DeltaY?
Query the vertical position of the delta marker
:View<x>:Marker:Peak
Move the marker to the adjacent peak
:View<x>:Marker:ResetDelta
Move the delta marker to the marker position
:View<x>:Marker:SearchMax
Search the maximum peak and place the marker on it
:View<x>:Marker:SearchMin
Search the minimum peak and place the marker on it
:View<x>:Marker:SearchSeparation (?)
Set the resolution to separate two peaks
:View<x>:Marker:X (?)
Set the horizontal position of the marker
:View<x>:Marker:Y?
Query the vertical position of the marker
:View<x>:Mask:OffLeft (?)
Set the reference time just before the rising edge
:View<x>:Mask:OffLevel (?)
Set the reference offĆlevel
:View<x>:Mask:OffRight (?)
Set the reference time just after the falling edge
:View<x>:Mask:OnLeft (?)
Set the reference time after rising edge
:View<x>:Mask:OnLevel (?)
Set the reference onĆlevel
:View<x>:Mask:OnRight (?)
Set the reference time just before the falling edge
:View<x>:Measure
Average newly acquired data and perform PASS/FAIL
test
:View<x>:MeasureData
Average data on the memory and perform PASS/FAIL
test
:View<x>:Position (?)
Set the display position in a block
:View<x>:Result<y>?
Query measurement results
:View<x>:Scale:FallingEdge
Expand the falling edge of waveform on the screen
:View<x>:Scale:FullScale
Display the whole waveform
:View<x>:Scale:HoldYScale (?)
Determine whether to hold or reset the vertical scale
when you change the input source
3066 & 3086 3 GHz Real Time Spectrum Analyzer Programmer Manual
Command Groups
Table 2-20: CDMA Time View commands (Cont.)
CodeSpectrogram View
Commands
Header
Description
:View<x>:Scale:RisingEdge
Expand the rising edge of waveform on the screen
:View<x>:Scale:XScale (?)
Scale the horizontal axis
:View<x>:Scale:XStart (?)
Set the start point of the horizontal axis on the screen
:View<x>:Scale:YScale (?)
Scale the vertical axis
:View<x>:Scale:YStart (?)
Set the start point of the vertical axis on the screen
:View<x>:Source (?)
Select the input data source
:View<x>:Trace2:TraceVisible (?)
Determine whether or not to display Trace 2
:View<x>:TraceVisible (?)
Determine whether or not to display Trace 1
:View<x>:Version?
Query the version of the CDMA Time View program
3066 option 15 and 3086 option 16 only. These commands control the
code-domain spectrogram view according to the cdmaOne standard.
Table 2-21: CodeSpectrogram View commands
(3066 option 15 and 3086 option 16 only)
Header
Description
:View<x>:Marker:DeltaMarker (?)
Turn the delta marker on or off
:View<x>:Marker:ResetDelta
Move the delta marker to the marker position
:View<x>:Marker:SearchMax
Search the maximum peak and place the marker on it
:View<x>:Marker:SearchMin
Search the minimum peak and place the marker on it
:View<x>:Marker:SearchSeparation (?)
Set the resolution to separate two peaks
:View<x>:Marker:X (?)
Set the horizontal position of the marker
:View<x>:Marker:Z (?)
Set the marker position on the Z axis
:View<x>:Monochrome (?)
Set the display to monochrome
:View<x>:NumberColors (?)
Select the number of display colors
:View<x>:Scale:AutoScale
Scale the vertical axis automatically
:View<x>:Scale:XScale (?)
Scale the horizontal axis
:View<x>:Scale:XStart (?)
Set the start point of the horizontal axis on the screen
:View<x>:Scale:YScale (?)
Scale the vertical axis
:View<x>:Scale:YStart (?)
Set the start point of the vertical axis on the screen
:View<x>:Scale:ZScale (?)
Scale the Z axis
:View<x>:Scale:ZStart (?)
Set the start point of the Z axis on the screen
3066 & 3086 3 GHz Real Time Spectrum Analyzer Programmer Manual
2-27
Command Groups
Table 2-21: CodeSpectrogram View commands
(3066 option 15 and 3086 option 16 only) (Cont.)
CodePolar View
Commands
Header
Description
:View<x>:Version?
Query the version of the CodeSpectrogram View
program
:View<x>:ZGap (?)
Set the symbol display interval on the Z axis
3066 option 15 and 3086 option 16 only. These commands control the vector
diagram view according to the cdmaOne standard.
Table 2-22: CodePolar View commands
(3066 option 15 and 3086 option 16 only)
CodePower View
Commands
2-28
Header
Description
:View<x>:AlphaBT (?)
Set the a/BT
:View<x>:Analysis:TimeSlot (?)
Select the symbol to display the constellation
:View<x>:Analyze
Perform analysis on the background for all symbols
:View<x>:AutoCarrier (?)
Turn on or off the carrier search function
:View<x>:BreakAnalyze
Stop analysis
:View<x>:Carrier (?)
Set the carrier frequency
:View<x>:Display (?)
Select the display data source
:View<x>:Format (?)
Select the waveform display format
:View<x>:Marker:T (?)
Set the marker position on the time axis
:View<x>:MeasFilter (?)
Select the filter to create measurement data
:View<x>:Modulation (?)
Select the modulation type
:View<x>:RefFilter (?)
Select the filter to create reference data
:View<x>:Source (?)
Select the input data source
:View<x>:Standard:IS95
Configure the modulating system according to the
ISĆ95 standard without the equalizer
:View<x>:Standard:IS95EQ
Configure the modulating system according to the
ISĆ95 standard with the equalizer
:View<x>:SymbolRate (?)
Set the chip rate
:View<x>:Version?
Query the version of the CodePolar View program
3066 option 15 and 3086 option 16 only. These commands control the
code-domain power view according to the cdmaOne standard.
3066 & 3086 3 GHz Real Time Spectrum Analyzer Programmer Manual
Command Groups
Table 2-23: CodePower View commands
(3066 option 15 and 3086 option 16 only)
CodeWSpectrogram View
Commands
Header
Description
:View<x>:Average (?)
Determine whether to display average results
:View<x>:Average:AllFrames
Specify the average range of all frames
:View<x>:Average:BeginZ (?)
Set the uppermost frame in the average range
:View<x>:Average:EndZ (?)
Set the lowermost frame in the average range
:View<x>:Average:Execute
Execute averaging
:View<x>:Average:MarkerToFrame
Specify the average range between two markers
:View<x>:Average:Times (?)
Set the number of acquisitions for averaging
:View<x>:Average:Type (?)
Select the average type
:View<x>:Marker:DeltaMarker (?)
Turn on or off the delta marker
:View<x>:Marker:ResetDelta
Move the delta marker to the marker position
:View<x>:Marker:SearchMax
Search the maximum peak and place the marker on it
:View<x>:Marker:SearchMin
Search the minimum peak and place the marker on it
:View<x>:Marker:SearchSeparation (?)
Set the resolution to separate two peaks
:View<x>:Marker:X (?)
Set the horizontal position of the marker
:View<x>:Scale:AutoScale
Reset the vertical axis scale to the default
:View<x>:Scale:XScale (?)
Scale the horizontal axis
:View<x>:Scale:XStart (?)
Set the start point of the horizontal axis on the screen
:View<x>:Scale:YScale (?)
Scale the vertical axis
:View<x>:Scale:YStart (?)
Set the start point of the vertical axis on the screen
:View<x>:Version?
Query the version of the CodePower View program
:View<x>:Z (?)
Set the symbol number
3086 option 16 only. These commands control the code-domain spectrogram
view according to the W-CDMA standard.
Table 2-24: CodeWSpectrogram View commands (3086 option 16 only)
Header
Description
:View<x>:Marker:DeltaMarker (?)
Turn the delta marker on or off
:View<x>:Marker:ResetDelta
Move the delta marker to the marker position
:View<x>:Marker:SearchMax
Search the maximum peak and place the marker on it
:View<x>:Marker:SearchMin
Search the minimum peak and place the marker on it
:View<x>:Marker:SearchSeparation (?)
Set the resolution to separate two peaks
3066 & 3086 3 GHz Real Time Spectrum Analyzer Programmer Manual
2-29
Command Groups
Table 2-24: CodeWSpectrogram View commands (3086 option 16 only) (Cont.)
CodeWPolar View
Commands
Header
Description
:View<x>:Marker:X (?)
Set the horizontal position of the marker
:View<x>:Marker:Z (?)
Set the marker position on the Z axis
:View<x>:Monochrome (?)
Set the display to monochrome
:View<x>:NumberColors (?)
Select the number of display colors
:View<x>:Scale:AutoScale
Scale the vertical axis automatically
:View<x>:Scale:XScale (?)
Scale the horizontal axis
:View<x>:Scale:XStart (?)
Set the start point of the horizontal axis on the screen
:View<x>:Scale:YScale (?)
Scale the vertical axis
:View<x>:Scale:YStart (?)
Set the start point of the vertical axis on the screen
:View<x>:Scale:ZScale (?)
Scale the Z axis
:View<x>:Scale:ZStart (?)
Set the start point of the Z axis on the screen
:View<x>:SymbolRate (?)
Set the symbol rate
:View<x>:Version?
Query the version of the CodeWSpectrogram View
program
:View<x>:ZGap (?)
Set the symbol display interval on the Z axis
3086 option 16 only. These commands control the vector diagram view
according to the W-CDMA standard.
Table 2-25: CodeWPolar View commands (3086 option 16 only)
2-30
Header
Description
:View<x>:AlphaBT (?)
Set the a/BT
:View<x>:Analysis:TimeSlot (?)
Specify the symbol to display the constellation
:View<x>:Analyze
Perform analysis on the background for all symbols
:View<x>:AutoCarrier (?)
Turn on or off the carrier search function
:View<x>:BreakAnalyze
Stop analysis
:View<x>:Carrier (?)
Set the carrier frequency
:View<x>:Display (?)
Select the display data source
:View<x>:Format (?)
Select the waveform display format
:View<x>:Marker:T (?)
Set the marker position on the time axis
:View<x>:MeasFilter (?)
Select the filter to create measurement data
:View<x>:Modulation (?)
Select the modulation type
:View<x>:RefFilter (?)
Select the filter to create reference data
3066 & 3086 3 GHz Real Time Spectrum Analyzer Programmer Manual
Command Groups
Table 2-25: CodeWPolar View commands (3086 option 16 only) (Cont.)
CodeWPower View
Commands
Header
Description
:View<x>:ShortCode (?)
Specify the short code
:View<x>:Source (?)
Select the input data source
:View<x>:Standard:WCDMA16M
Configure the modulating system according to the
WĆCDMA standard with the chip rate of 16 M/s
:View<x>:Standard:WCDMA4M
Configure the modulating system according to the
WĆCDMA standard with the chip rate of 4 M/s
:View<x>:Standard:WCDMA8M
Configure the modulating system according to the
WĆCDMA standard with the chip rate of 8 M/s
:View<x>:SymbolConstellation (?)
Determine whether to display symbol constellation
:View<x>:SymbolRate (?)
Set the symbol rate
:View<x>:TimeSlot (?)
Specify the time slot
:View<x>:Version?
Query the version of the CodeWPolar View program
3086 option 16 only. These commands control the code-domain power view
according to the W-CDMA standard.
Table 2-26: CodeWPower View commands (3086 option 16 only)
Header
Description
:View<x>:Average (?)
Determine whether to display average results
:View<x>:Average:AllFrames
Specify the average range of all frames
:View<x>:Average:BeginZ (?)
Set the uppermost frame in the average range
:View<x>:Average:EndZ (?)
Set the lowermost frame in the average range
:View<x>:Average:Execute
Execute averaging
:View<x>:Average:MarkerToFrame
Specify the average range between two markers
:View<x>:Average:Times (?)
Set the number of acquisitions for averaging
:View<x>:Average:Type (?)
Select the average type
:View<x>:Marker:DeltaMarker (?)
Turn on or off the delta marker
:View<x>:Marker:ResetDelta
Move the delta marker to the marker position
:View<x>:Marker:SearchMax
Search the maximum peak and place the marker on it
:View<x>:Marker:SearchMin
Search the minimum peak and place the marker on it
:View<x>:Marker:SearchSeparation (?)
Set the resolution to separate two peaks
:View<x>:Marker:X (?)
Set the horizontal position of the marker
:View<x>:Scale:AutoScale
Reset the vertical scale to the default
3066 & 3086 3 GHz Real Time Spectrum Analyzer Programmer Manual
2-31
Command Groups
Table 2-26: CodeWPower View commands (3086 option 16 only) (Cont.)
CCDF Commands
Header
Description
:View<x>:Scale:XScale (?)
Scale the horizontal axis
:View<x>:Scale:XStart (?)
Set the start point of the horizontal axis on the screen
:View<x>:Scale:YScale (?)
Scale the vertical axis
:View<x>:Scale:YStart (?)
Set the start point of the vertical axis on the screen
:View<x>:ShortCode (?)
Specify the short code
:View<x>:SymbolRate (?)
Set the symbol rate
:View<x>:Version?
Query the version of the CodeWPower View program
:View<x>:XAxis (?)
Select the variable for the horizontal axis
:View<x>:Z (?)
Set the time slot number
Option 20 only. These commands control the CCDF (Cumulative Complementary Distribution Function) analysis.
Table 2-27: CCDF commands (option 20 only)
2-32
Header
Description
:View<x>:AllFrames
Specify the CCDF calculation range of all frames
:View<x>:Average:Reset
Restart the CCDF measurement
:View<x>:BeginZ (?)
Set the uppermost frame in the calculation range
:View<x>:Destination
Select the destination to output the calculation results
:View<x>:EndZ (?)
Set the lowermost frame in the calculation range
:View<x>:Execute
Execute CCDF calculation
:View<x>:Marker:DeltaMarker (?)
Turn on or off the delta marker
:View<x>:Marker:ResetDelta
Move the delta marker to the marker position
:View<x>:Marker:SearchMax
Search the maximum peak and place the marker on it
:View<x>:Marker:SearchMin
Search the minimum peak and place the marker on it
:View<x>:Marker:SearchSeparation (?)
Set the resolution to separate two peaks
:View<x>:Marker:X (?)
Set the horizontal position of the marker
:View<x>:MarkerToFrame
Specify the calculation range between two markers
:View<x>:OutputFormat (?)
Select the format for displaying calculation results
:View<x>:Position (?)
Set the display position in a block
:View<x>:Resolution (?)
Set the resolution of the histogram
:View<x>:Result1?
Query the crest factor
3066 & 3086 3 GHz Real Time Spectrum Analyzer Programmer Manual
Command Groups
Table 2-27: CCDF commands (option 20 only) (Cont.)
CCDFView Commands
Header
Description
:View<x>:Result2?
Query the maximum amplitude
:View<x>:Result3?
Query the average amplitude
:View<x>:Scale:AutoScale
Reset the vertical axis to fullĆsacle
:View<x>:Scale:HoldYScale (?)
Determine whether to hold or reset the vertical scale
when you change the input source
:View<x>:Scale:Origin
Reset the vertical and horizontal axis to the default
:View<x>:Scale:XScale (?)
Scale the horizontal axis
:View<x>:Scale:XStart (?)
Set the start point of the horizontal axis on the screen
:View<x>:Scale:XStartZero (?)
Determine whether to set the left edge of each frame
to zero on the time axis
:View<x>:Scale:YScale (?)
Scale the vertical axis
:View<x>:Scale:YStart (?)
Set the start point of the vertical axis on the screen
:View<x>:Source (?)
Select the input data source
:View<x>:Version?
Query the version of the CCDF program
:View<x>:Z (?)
Set the frame number
Option 20 only. These commands control the view of CCDF (Cumulative
Complementary Distribution Function) measurement results.
Table 2-28: CCDFView commands (option 20 only)
Header
Description
:View<x>:CopyFrom
Copy display data from a data register or text file
:View<x>:CopyTo
Copy display data to a data register or text file
:View<x>:Marker:DeltaMarker (?)
Turns on or off the delta marker
:View<x>:Marker:ResetDelta
Move the delta marker to the marker position
:View<x>:Marker:SearchMax
Search the maximum peak and place the marker on it
:View<x>:Marker:SearchMin
Search the minimum peak and place the marker on it
:View<x>:Marker:SearchSeparation (?)
Set the resolution to separate two peaks
:View<x>:Marker:X (?)
Set the horizontal position of the marker
:View<x>:Scale:AutoScale
Scale the vertical axis automatically
:View<x>:Scale:LYStart (?)
Set the bottom edge of the vertical axis on the screen
:View<x>:Scale:LYStop (?)
Set the top edge of the vertical axis on the screen
3066 & 3086 3 GHz Real Time Spectrum Analyzer Programmer Manual
2-33
Command Groups
Table 2-28: CCDFView commands (option 20 only) (Cont.)
Header
Description
:View<x>:Scale:Origin (?)
Reset the vertical and horizontal axis scale to the
default
:View<x>:Scale:XScale (?)
Scale the horizontal axis
:View<x>:Scale:XStart (?)
Set the start point of the horizontal axis on the screen
:View<x>:Source (?)
Select the input data source
:View<x>:Version?
Query the version of the CCDFView program
Utility Commands
These commands are equivalent to the UTILITY menu on the front panel.
Self GainĆCalibration
Commands
These commands control the self gain-calibration.
Table 2-29: Self GainĆCalibration commands
Save/Load Commands
Header
Description
:Util1:Execute
Perform the self gainĆcalibration
:Util1:Gain:Auto (?)
Determine whether to perform the self gainĆcalibration
automatically
:Util1:Gain:Execute
Perform the self gainĆcalibration
:Util1:IQOffset:Execute (the 3086 only)
Compensate the offset of the I and Q input signals
:Util1:Result<x>?
Query the calibration results
:Util1:Version?
Query the version of the Self Gain-Calibration
program
:Util1:WideOffset:Request
(the 3086 only)
Compensate the offset of the Wideband mode at the
next data acquisition
These commands control to save or load data.
Table 2-30: Save/Load commands
2-34
Header
Description
:Util2:AllFrames
Specify that the all frames are saved
:Util2:BeginZ (?)
Select the first frame to be saved
:Util2:Buffer:<item> (?)
Set the file header in the buffer
3066 & 3086 3 GHz Real Time Spectrum Analyzer Programmer Manual
Command Groups
Table 2-30: Save/Load commands (Cont.)
Average Commands
Header
Description
:Util2:Buffer:CopyHeader (?)
Store file header to the buffer
:Util2:Buffer:SaveHeader (?)
Save the file header in the buffer to the file
:Util2:Data:Load
Load data from a file in the IQ format
:Util2:Data:Save
Save the data to the file in the IQ or AP format
:Util2:Data:SaveDateTime
Add date and time for the specified frame to the file
:Util2:Data:SaveFlatness
Add calibration data to the file
:Util2:Data:SaveFrame
Add frame data to the file
:Util2:Data:SaveHeader
Save file header for the specified frames to the file
:Util2:Data:Saved
Inform other system programs of the name of the
updated file
:Util2:EndZ (?)
Specify the last frame to be saved
:Util2:MarkerToFrame
Specify that the frames between the main marker and
the delta marker are saved
:Util2:Source (?)
Select the data source to be saved
:Util2:Version?
Query the version of the Save/Load program
These commands control averaging.
Table 2-31: Average commands
Header
Description
:Util3:AllFrames
Specify that all frames are processed
:Util3:BeginZ (?)
Specify the first frame to be processed
:Util3:Destination (?)
Specify the destination to which the result of the
process is output
:Util3:EndZ (?)
Specify the last frame to be processed
:Util3:MarkerToFrame
Specify that the frames between the main marker and
the delta marker are processed
:Util3:PeakHold
Perform average in the peak hold mode
:Util3:RMS
Perform average in the RMS mode
:Util3:Source (?)
Select the input data source
:Util3:Version?
Query the version of the Average program
3066 & 3086 3 GHz Real Time Spectrum Analyzer Programmer Manual
2-35
Command Groups
Remote Commands
These commands control remote operation.
Table 2-32: Remote commands
2-36
Header
Description
:Clipboard?
Query the contents of the clipboard
:Set?
Query the instrument settings
[:Util8]:Dev<address>:<command>
Send the command to the GPIB device
[:Util8]:Event:<message>
Generate an event
[:Util8]:Format (?)
Select the waveform display format
[:Util8]:GPIB:Interface (?)
Select the GPIB configuration
[:Util8]:GPIB:PrimaryAddress (?)
Set the GPIB primary address
[:Util8]:Header (?)
Determine whether to include headers on responses
[:Util8]:Id?
Query identifying information about the analyzer
[:Util8]:Key
Equivalent to pressing the button on the front panel
[:Util8]:NewLine (?)
Select the newĆline character of query responses
[:Util8]:NumericOutput (?)
Select the numerical format of the returned value
[:Util8]:Register:Data
Write a value to the data register
[:Util8]:Register:Header
Specify axes scaling and labeling for the data register
[:Util8]:Source (?)
Select the input data source
[:Util8]:Source:<item>?
Query the setting for the item
[:Util8]:Status?
Query the status of the analyzer
[:Util8]:TCPIP:Port:Command (?)
Set the TCP/IP command port number
[:Util8]:TCPIP:Port:Command:Reset
Close the TCP/IP command port
[:Util8]:TCPIP:Port:Event (?)
Set the TCP/IP event port number
[:Util8]:TCPIP:Port:Event:Reset
Close the TCP/IP event port
[:Util8]:Version?
Query the version of the Remote program
[:Util8]:ViewName?
Query the name of the Remote program
[:Util8]:Z (?)
Set the frame number
[:Util8]:Z:<item>?
Query information about the frame of input data
3066 & 3086 3 GHz Real Time Spectrum Analyzer Programmer Manual
Configuration Commands
Use the Configuration commands to set the analyzer with the basic configuration
pattern before acquiring, displaying, and measuring spectra.
3066 & 3086 3 GHz Real Time Spectrum Analyzer Programmer Manual
2-37
Congifuration Commands
:Config:Block (No Query Form)
Starts data acquisition in the Block mode. During data acquisition, this command
stops it.
Syntax
Arguments
Examples
Related Commands
:Config:Block
None
:Config:Block
starts data acquisition in the Block mode. During data acquisition, this command
stops it.
:Config:Start, :Config:Stop
:Config:Continue (No Query Form)
Breaks the pause and starts data acquisition again.
Syntax
Arguments
Examples
Related Commands
2-38
:Config:Continue
None
:Config:Continue
breaks the pause and starts data acquisition again.
:Config:Pause
3066 & 3086 3 GHz Real Time Spectrum Analyzer Programmer Manual
Congifuration Commands
:Config:Label (No Query Form)
Displays label in black on the upper left of screen.
Syntax
Arguments
Examples
Related Commands
:Config:Label <string>
<string>
Labels must be alphanumeric characters within 32 characters.
:Config:Label "Sample Waveform 1"
displays “Sample Waveform 1” on the upper left of screen.
:Config:Message
:Config:Message (No Query Form)
Displays message in red on the upper left of screen.
Syntax
Arguments
Examples
Related Commands
:Config:Message <string>
<string>
Messages must be alphanumeric characters within 32 characters.
:Config:Message "Measure the spectrum"
displays “Measure the spectrum” in red on the upper left of screen.
:Config:Label
3066 & 3086 3 GHz Real Time Spectrum Analyzer Programmer Manual
2-39
Congifuration Commands
:Config:Mode (No Query Form)
Loads the configuration parameters from the analyzer standard configuration file.
For details on the parameter settings, refer to the factory initialization settings of
the :Config:Mode command on page B–16.
Syntax
Arguments
:Config:Mode { Dual | Freq1 | Freq2 | Zoom | opCDMA1 |
opCDMA2 | opCDMA3 | opCDMA4 | opCDMA5 | opCDMA6 | opDemod1 |
opCode1 | opCodeW1 | opCCDF }
Dual loads the configuration parameters for the Dual mode.
Freq1 loads the configuration parameters to observe spectrum.
Freq2 loads the configuration parameters to observe spectrum and spectrogram.
Zoom loads the configuration parameters for the Zoom mode.
opCDMA1 loads the configuration parameters to measure, analyze, and display the
EVM (Error Vector Magnitude), r (Rho meter), frequency error, and origin offset
error for the IS-95 standard.
opCDMA2 loads the configuration parameters to measure, analyze, and display the
power, occupied bandwidth (OBW), and spurious for the IS-95 standard.
opCDMA3 loads the configuration parameters to measure, analyze, and display the
time characteristic for the burst signal for the IS-95 standard.
opCDMA4 loads the configuration parameters to measure, analyze, and display the
EVM (Error Vector Magnitude), r (Rho meter), frequency error, and origin offset
error for the T-53 standard.
opCDMA5 loads the configuration parameters to measure, analyze, and display the
power, occupied bandwidth (OBW), and spurious for the T-53 standard.
opCDMA6 loads the configuration parameters to measure, analyze, and display the
time characteristic for the burst signal for the T-53 standard.
opDemod1 loads the configuration parameters to observe digital modulating
signals.
opCode1 loads the configuration parameters for the cdmaOne forward link signal
analysis (3066 option 15 and 3086 option 16 only).
opCodeW1 loads the configuration parameters for the W-CDMA down-link signal
analysis (3086 option 16 only).
opCCDF loads the configuration parameters for the CCDF analysis (option 20
only).
2-40
3066 & 3086 3 GHz Real Time Spectrum Analyzer Programmer Manual
Congifuration Commands
Examples
:Config:Mode Dual
loads the configuration file for the Dual mode.
:Config:Mode:Load (No Query Form)
Loads the configuration parameters from the file to which you have stored them
previously.
Syntax
Arguments
Examples
Related Commands
:Config:Mode:Load <file_name>
<file_name>::=<string> specifies the configuration file (“*.CFG”).
:Config:Mode:Load "SAMPLE1.CFG"
loads the configuration parameters from the file SAMPLE1.CFG.
:Config:Mode:Save
:Config:Mode:Save (No Query Form)
Saves the configuration parameters to a file.
Syntax
Arguments
Examples
Related Commands
:Config:Mode:Save <file_name>
<file_name>::=<string> specifies the configuration file (“*.CFG”).
:Config:Mode:Save "SAMPLE1.CFG"
saves the parameters to the configuration file SAMPLE1.CFG.
:Config:Mode:Load
3066 & 3086 3 GHz Real Time Spectrum Analyzer Programmer Manual
2-41
Congifuration Commands
:Config:Next (No Query Form)
Stops to acquire the current block and starts to acquire the next block.
Syntax
Arguments
Examples
:Config:Next
None
:Config:Next
stops to acquire the current block and starts to acquire the next block.
:Config:Pause (?)
Turns the Pause mode on or off. In the Pause mode, the data acquisition pauses
every block to allow you to process the data. Use the :Config:Continue
command to resume.
Syntax
:Config:Pause { On | Off }
:Config:Pause?
Arguments
On turns the Pause mode on.
Off turns the Pause mode off.
Examples
Related Commands
2-42
:Config:Pause On
turns the Pause mode on.
:Config:Continue
3066 & 3086 3 GHz Real Time Spectrum Analyzer Programmer Manual
Congifuration Commands
:Config:PrintScreen (No Query Form)
Prints the screen image to the printer specified with the :Config:PrintScreen:
Printer command.
Syntax
Arguments
Examples
Related Commands
:Config:PrintScreen
None
:Config:PrintScreen
prints the screen image to the printer.
:Config:PrintScreen:Printer
:Config:PrintScreen:Printer (?)
Specifies or queries the printer to print the screen image.
Syntax
:Config:PrintScreen:Printer <printer_name>
:Config:PrintScreen:Printer?
Arguments
Examples
Related Commands
<printer_name>::=<string> specifies the printer.
:Config:PrintScreen:Printer "PRINTER1"
specifies that the screen image is output to the printer named PRINTER1.
:Config:PrintScreen
3066 & 3086 3 GHz Real Time Spectrum Analyzer Programmer Manual
2-43
Congifuration Commands
:Config:PrintScreen:Printer:Items? (Query Only)
Returns the list of available printers.
Syntax
:Config:PrintScreen:Printer:Items?
Returns
<printer_name>[,<printer_name>...]
where <printer_name>::=<string>.
Examples
Related Commands
:Config:PrintScreen:Printer:Items?
might return "PRINTER1","PRINTER2","PRINTER3".
:Config:PrintScreen:Printer
:Config:PrintScreen:Save (No Query)
Save the screen image to a file.
Syntax
Arguments
Examples
Related Commands
2-44
:Config:PrintScreen:Save <file_name>
<file_name>::=<string> must be “*.BMP” (bitmap file).
:Config:PrintScreen:Save "C:\SAMPLE1.BMP"
save the screen image to the file C:\SAMPLE1.BMP.
:Config:PrintScreen
3066 & 3086 3 GHz Real Time Spectrum Analyzer Programmer Manual
Congifuration Commands
:Config:Roll (No Query Form)
Starts data acquisition in the Roll mode. During data acquisition, this command
stops it.
Syntax
Arguments
Examples
Related Commands
:Config:Roll
None
:Config:Roll
starts the data acquisition in the Roll mode. During data acquisition, this
command stops it.
:Config:Block
:Config:Setup (?)
Loads the Setup program for the SETUP menu.
Syntax
:Config:Setup { None | Standard | CDMA }
:Config:Setup?
Arguments
None disables the SETUP menu.
Standard loads the Standard Setup program.
CDMA loads the CDMA Setup program.
Examples
:Config:Setup Standard
loads the Standard Setup program for the SETUP menu.
3066 & 3086 3 GHz Real Time Spectrum Analyzer Programmer Manual
2-45
Congifuration Commands
:Config:Setup:Items? (Query Only)
Returns the list of available programs for the Setup. Select the program with the
:Config:Setup command.
Syntax
Returns
Examples
Related Commands
:Config:Setup:Items?
<program_name>[,<program_name>...]
where <program_name>::=<string>.
:Config:Setup:Items?
might return None,Standard,CDMA.
:Config:Setup
:Config:Setup:Show (No Query Form)
Displays the SETUP menu on the analyzer screen.
Syntax
Arguments
Examples
Related Commands
2-46
:Config:Setup:Show
None
:Config:Setup:Show
displays the Setup menu on the analyzer screen.
:Config:Setup
3066 & 3086 3 GHz Real Time Spectrum Analyzer Programmer Manual
Congifuration Commands
:Config:Start (No Query Form)
Starts data acquisition in the Block mode. During data acquisition, the analyzer
ignores this command.
Syntax
Arguments
Examples
Related Commands
:Config:Start
None
:Config:Start
starts data acquisition in the Block mode.
:Config:Stop
:Config:StartAgain (No Query Form)
Stops the data acquisition and restarts data acquisition in the Block mode.
Syntax
Arguments
Examples
Related Commands
:Config:StartAgain
None
:Config:StartAgain
stops the data acquisition and restarts data acquisition in the Block mode.
:Config:Start, :Config:Stop
3066 & 3086 3 GHz Real Time Spectrum Analyzer Programmer Manual
2-47
Congifuration Commands
:Config:Status:Overload? (Query Only)
Queries whether the analyzer’s A/D converter overloads.
Syntax
Returns
:Config:Status:Overload?
On indicates the analyzer’s A/D converter overloads.
Off indicates the analyzer’s A/D converter does not overload.
Examples
:Config:Status:Overload?
might return On that indicates the analyzer’s A/D converter overloads.
:Config:Status:Pause? (Query Only)
Queries whether data acquisition pauses.
Syntax
Returns
:Config:Status:Pause?
On indicates data acquisition stops.
Off indicates the analyzer is acquiring data.
Examples
2-48
:Config:Status:Pause?
might return On that indicates data acquisition stops.
3066 & 3086 3 GHz Real Time Spectrum Analyzer Programmer Manual
Congifuration Commands
:Config:Status:Triggered? (Query Only)
Queries whether the analyzer is triggered.
Syntax
Returns
:Config:Status:Triggered?
On indicates the analyzer is triggered.
Off indicates the analyzer is not triggered.
Examples
:Config:Status:Triggered?
might return On that indicates the analyzer is triggered.
:Config:Status:Uncal? (Query Only)
Queries whether the analyzer is in an uncalibrated state due to the increased
temperature.
NOTE. If the instrument is in the uncal state, perform the self gain-calibration to
ensure the normal operation.
Syntax
Returns
:Config:Status:Uncal?
On indicates the analyzer is not calibrated.
Off indicates the analyzer is calibrated.
Examples
Related Commands
:Config:Status:Uncal?
might return On which indicates the analyzer is not calibrated.
:Util1:Execute
3066 & 3086 3 GHz Real Time Spectrum Analyzer Programmer Manual
2-49
Congifuration Commands
:Config:Stop (No Query Form)
Stops data acquisition. When data acquisition stops, the analyzer ignores this
command.
Syntax
Arguments
Examples
Related Commands
:Config:Stop
None
:Config:Stop
stops the data acquisition.
:Config:Start, :Config:StartAgain
:Config:System? (Query Only)
Queries the instrument name.
Syntax
Returns
Examples
2-50
:Config:System?
<NR1>
:Config:System?
might return 3086.
3066 & 3086 3 GHz Real Time Spectrum Analyzer Programmer Manual
Congifuration Commands
:Config:Util:Items? (Query Only)
Returns the list of available programs for the Utility 1 to 8 (A to H). Select the
program with the :Config:Util<x> command.
Syntax
Returns
Examples
Related Commands
:Config:Util:Items?
<program_name>[,<program_name>...]
where <program_name>::=<string>.
:Config:Util:Items?
might return None,SelfGainCal,SaveLoad,Average.
:Config:Util<x>
:Config:Util<x> (?)
Assigns the utility program to the UTILITY side key.
NOTE. UTILITY 1, 2, 3, and 8 are already used; Self Gain-Calibration,
Save/Load, Average, and Remote, respectively. You can assign UTILITY 4 to 7
when new utility programs are released.
Syntax
:Config:Util<x> { <name> | None }
:Config:Util<x>?
Arguments
<name>::=<string> is the utility program name.
None disables the UTILITY side key.
Examples
:Config:Util5 SAMPLE
assigns the utility program SAMPLE to the UTILITY 5 (UTILITY E) key.
:Config:Util1 None
disables the UTILITY 1 (UTILITY A) key.
3066 & 3086 3 GHz Real Time Spectrum Analyzer Programmer Manual
2-51
Congifuration Commands
:Config:Util<x>:Show (No Query Form)
Displays the utility menu for the specified UTILITY side key.
Syntax
Arguments
Examples
Related Commands
:Config:Util<x>:Show
None
:Config:Util1:Show
displays the utility menu of the UTILITY 1 side key.
:Config:Util<x>
:Config:Version? (Query Only)
Queries the version of the Configuration program.
Syntax
Returns
Examples
2-52
:Config:Version?
<NR2>
:Config:Version?
might return 1.1.
3066 & 3086 3 GHz Real Time Spectrum Analyzer Programmer Manual
Congifuration Commands
:Config:View:BackgroundColor (?)
Selects or queries the background color of the waveform display area.
Syntax
:Config:View:BackgroundColor { Black | White }
:Config:View:BackgroundColor?
Arguments
Black selects black for the background color.
White selects white for the background color.
Examples
:Config:View:BackgroundColor Black
selects black for the background color.
:Config:View:Items? (Query Only)
Returns the list of available programs for the View 1 to 8 (A to H). Select the
program with the :Config:View<x> command.
Syntax
Returns
Examples
Related Commands
:Config:View:Items?
<program_name>[,<program_name>...]
where <program_name>::=<string>.
:Config:View:Items?
might return None,Waveform,Spectrogram,Waterfall.
:Config:View<x>, :Config:View<x>:Show
3066 & 3086 3 GHz Real Time Spectrum Analyzer Programmer Manual
2-53
Congifuration Commands
:Config:View:MarkerLink (?)
Determines whether the markers in different views move together in unison or
separately.
Syntax
:Config:View:MarkerLink { On | Off }
:Config:View:MarkerLink?
Arguments
On ties the markers in different views together.
Off frees the markers in different views to move separately.
Examples
:Config:View:MarkerLink On
specifies that the markers in different views move in unison.
:Config:View:Style (?)
Specifies or queries the layout of the views on screen.
Syntax
:Config:View:Style { OneByOne | OneByTwo | OneByFour | TwoByTwo }
:Config:View:Style?
Arguments
OneByOne specifies that one view displays on the screen.
OneByTwo selects 1
OneByFour selects 1
TwoByTwo selects 2
Examples
2 view display.
4 view display.
2 view display.
:Config:View:Style TwoByTwo
selects 2 2 view display.
:Config:View<x> (?)
Assigns the View program to the VIEW key.
2-54
3066 & 3086 3 GHz Real Time Spectrum Analyzer Programmer Manual
Congifuration Commands
Syntax
:Config:View<x> { None | Waveform | Analog | FSK | Spectrogram |
Waterfall | Polar | EyeDiagram | SymbolTable | EVM |
CDMAWaveform | CDMAPolar | CDMATime |
CodeSpectrogram | CodePolar | CodePower |
CodeWSpectrogram | CodeWPolar | CodeWPower | CCDF | CCDFView }
:Config:View<x>?
Arguments
Each argument represents the system program for the specific measurement.
For detail settings, refer to the section starting on the page listed below.
Argument
System program
Display form
Detail
settings
None
None
None
-
Waveform
Waveform View
Spectrum
p. 2-91
Analog
Analog View
Time domain for AM/FM/PM
p. 2-119
FSK
FSK View
Time domain for FSK
p. 2-131
Spectrogram
Spectrogram View
Spectrogram
p. 2-141
Waterfall
Waterfall View
Waterfall
p. 2-155
Polar
Polar View
Polar
p. 2-171
EyeDiagram
Eye Diagram View
Eye Diagram
p. 2-187
SymbolTable
Symbol Table View
Symbol Table
p. 2-191
EVM
EVM View
Error vector magnitude
p. 2-197
CDMAWaveform
CDMA Waveform View
Spectrum for ISĆ95/TĆ53
p. 2-207
CDMAPolar
CDMA Polar View
Polar for ISĆ95/TĆ53
p. 2-229
CDMATime
CDMA TIme View
Time domain for ISĆ95/TĆ53
p. 2-247
CodeSpectrogram
1
CodeSpectrogram View
Spectrogram (cdmaOne)
p. 2-267
CodePolar
1
CodePolar View
Polar (cdmaOne)
p. 2-277
CodePower
1
CodePower View
Spectrum (cdmaOne)
p. 2-287
CodeWSpectrogram
2
CodeWSpectrogram View Spectrogram (cdmaOne)
p. 2-299
CodeWPolar
2
CodeWPolar View
Polar (cdmaOne)
p. 2-309
CodeWPower
2
CodeWPower View
Spectrum (cdmaOne)
p. 2-319
CCDF
3
CCDF
Time domain for CCDF
p. 2-331
CCDFView
3
CCDFView
CCDF
p. 2-347
1
3066 option 15 and 3086 option 16 only.
2
3086 option 16 only.
3
Option 20 only.
3066 & 3086 3 GHz Real Time Spectrum Analyzer Programmer Manual
2-55
Congifuration Commands
Examples
Related Commands
:Config:View1 Waveform
assigns the Waveform View program to the VIEW 1 (VIEW A) key.
:Config:View:Items
:Config:View<x>:Show (No Query Form)
Displays the View menu on the analyzer screen for the specified view.
Syntax
Arguments
Examples
Related Commands
2-56
:Config:View<x>:Show
None
:Config:View1:Show
displays the View 1 (View A) menu on the analyzer screen.
:Config:View<x>
3066 & 3086 3 GHz Real Time Spectrum Analyzer Programmer Manual
Standard Setup Commands
When you select Standard in the Config:Setup command, use the commands
in this section to set the details for the standard setup.
3066 & 3086 3 GHz Real Time Spectrum Analyzer Programmer Manual
2-57
Standard Setup Commands
:Setup:BlockSize (?)
Sets or queries the number of frames per block.
Syntax
:Setup:BlockSize <value>
:Setup:BlockSize?
Arguments
Examples
Related Commands
2-58
<value>::=<NR1> depends on the FFT points and the memory mode:
FFT points
Memory mode
<value>
256
-
1 to 16000
1024
Frequency
1 to 4000
Other than Frequency
1 to 2000
:Setup:BlockSize 200
sets the number of frames per block to 200.
:Setup:FFTPoints, :Setup:MemoryMode
3066 & 3086 3 GHz Real Time Spectrum Analyzer Programmer Manual
Standard Setup Commands
:Setup:CenterFrequency (?)
Sets or queries the center frequency.
Syntax
:Setup:CenterFrequency <value>
:Setup:CenterFrequency?
Arguments
<value>::=<NR3> depends on the input mode:
Input mode
<value>
IQ 1
0
Wideband 1, RF
Span/2 Hz to 3 GHz - Span/2 Hz
Baseband
Span/2 Hz to 10 MHz - Span/2 Hz
1
Examples
Related Commands
The 3086 only.
:Setup:CenterFrequency 1.5G
sets the center frequency to 1.5 GHz.
:Setup:InputMode
3066 & 3086 3 GHz Real Time Spectrum Analyzer Programmer Manual
2-59
Standard Setup Commands
:Setup:FFTPoints (?)
Sets or queries the number of FFT sampling points per frame.
Syntax
:Setup:FFTPoints <value>
:Setup:FFTPoints?
Arguments
Examples
Related Commands
<value>::=<NR1> depends on the memory mode:
Memory mode
<value>
Frequency
{ 1024 | 256 }
Other than Frequency
1024
:Setup:FFTPoints 1024
sets the number of FFT points to 1024.
:Setup:MemoryMode
:Setup:FFTWindow (?)
Selects or queries the FFT window.
Syntax
:Setup:FFTWindow { Blackman | Hamming | Rect }
:Setup:FFTWindow?
Arguments
Blackman selects the Blackman-Harris window.
Hamming selects the Hamming window.
Rect selects the Rectangular window.
Examples
2-60
:Setup:FFTWindow Blackman
selects the Blackman-Harris window.
3066 & 3086 3 GHz Real Time Spectrum Analyzer Programmer Manual
Standard Setup Commands
:Setup:FramePeriod (?)
Sets or queries the frame period in the Block mode. The setting is effective in the
Frequency and Dual memory mode. In the Zoom mode, this setting is ignored.
Syntax
:Setup:FramePeriod <value>
:Setup:FramePeriod?
Arguments
Examples
Related Commands
<value>::=<NR3> ranges 20 ms to 60 s.
:Setup:FramePeriod 30m
sets the frame period to 30 ms.
:Setup:MemoryMode
:Setup:FrequencyOffset (?)
Sets or queries the frequency display offset. This setting is useful, for example,
when a down converter connects externally. It has no effect on the analyzer
hardware settings.
Syntax
FrequencyOffset <value>
FrequencyOffset?
Arguments
Examples
Related Commands
<value>::=<NR3> ranges –100 GHz to 100 GHz.
:Setup:FrequencyOffset 100G
sets the frequency display offset to 100 GHz.
:Setup:CenterFrequency
3066 & 3086 3 GHz Real Time Spectrum Analyzer Programmer Manual
2-61
Standard Setup Commands
:Setup:InputCoupling (?)
Selects or queries the input coupling to the RF INPUT connector on the front
panel. In the IQ mode of the 3086, this command is ignored.
Syntax
:Setup:InputCoupling <value>
:Setup:InputCoupling?
Arguments
<value> depends on the input mode:
Input mode
<value>
Wideband 1, RF
AC
Baseband
{ AC | GND | DC }
1
The 3086 only.
AC sets the input coupling to AC.
GND sets the input coupling to ground.
DC sets the input coupling to DC.
Examples
Related Commands
2-62
:Setup:InputCoupling AC
sets the RF input coupling to AC.
:Setup:InputMode
3066 & 3086 3 GHz Real Time Spectrum Analyzer Programmer Manual
Standard Setup Commands
:Setup:InputMode (?)
Selects or queries the signal input mode.
Syntax
:Setup:InputMode { IQ | Wideband | RF | Baseband }
:Setup:InputMode?
Arguments
IQ selects the IQ mode (the 3086 only). This mode processes the I and Q input
signals from the rear panel connectors.
Wideband selects the Wideband mode (the 3086 only). This mode can process 50
MHz to 3 GHz signals with maximum 30 MHz span in the vector mode.
RF selects the RF mode. This mode can process 10 MHz to 3 GHz signals with
maximum 6 MHz span.
Baseband selects the baseband mode. This mode does not use the internal 3 GHz
down converter. It can only process DC to 10 MHz signals.
Examples
Related Commands
:Setup:InputMode RF
selects the RF mode.
:Setup:CenterFrequency, :Setup:InputCoupling
:Setup:LevelOffset (?)
Sets or queries the level display offset. This setting is useful, for example, when
an attenuator connects externally. It has no effect on the analyzer hardware
settings.
Syntax
:Setup:LevelOffset <value>
:Setup:LevelOffset?
Arguments
Examples
Related Commands
<value>::=<NR3> ranges –100 dB to 100 dB.
:Setup:LevelOffset 100
sets the level display offset to 100 dB.
:Setup:ReferenceLevel
3066 & 3086 3 GHz Real Time Spectrum Analyzer Programmer Manual
2-63
Standard Setup Commands
:Setup:Load (No Query Form)
Loads the trigger mask from the specified file.
Syntax
Arguments
Examples
Related Commands
:Setup:Load <file_name>
<file_name>::=<string> specifies the file that contains the trigger mask.
The file name must be “*.TRG”.
:Setup:Load "SAMPLE1.TRG"
loads the trigger mask from the file SAMPLE1.TRG.
:Setup:Save
:Setup:MarkerToFreq (No Query Form)
Sets the center frequency to the value at the marker.
Syntax
Arguments
Examples
Related Commands
2-64
:Setup:MarkerToFreq
None
:Setup:MarkerToFreq
sets the center frequency to the value at the marker.
:Setup:CenterFrequency
3066 & 3086 3 GHz Real Time Spectrum Analyzer Programmer Manual
Standard Setup Commands
:Setup:MaxSpan (No Query Form)
Sets the span to the maximum.
Syntax
Arguments
Examples
Related Commands
:Setup:MaxSpan
None
:Setup:MaxSpan
sets the span to the maximum.
:Setup:Span
:Setup:MemoryMode (?)
Selects or queries the memory mode.
Syntax
:Setup:MemoryMode { Frequency | Dual | Zoom }
:Setup:MemoryMode?
Arguments
Frequency selects the Frequency mode. Only frequency domain data is written
into the memory.
Dual selects the Dual mode. The data for both frequency and time domain are
written into the memory at the same time.
Zoom expands a specific part of the spectrum.
In the IQ mode of the 3086, the memory mode is fixed to the Zoom.
Examples
Related Commands
:Setup:MemoryMode Frequency
sets the memory mode to Frequency.
:Setup:BlockSize, :Setup:FFTPoints, :Setup:FramePeriod
3066 & 3086 3 GHz Real Time Spectrum Analyzer Programmer Manual
2-65
Standard Setup Commands
:Setup:ReferenceLevel (?)
Sets or queries the reference level.
Syntax
:Setup:ReferenceLevel <value>
:Setup:ReferenceLevel?
Arguments
<value>::=<NR1> depends on the input mode:
Input mode
<value>
IQ 1
0
Wideband 1, RF
-50 dBm to 30 dBm
Baseband
-30 dBm to 30 dBm
1
Examples
Related Commands
2-66
The 3086 only.
:Setup:ReferenceLevel 30
sets the reference level to 30 dBm.
:Setup:LevelOffset
3066 & 3086 3 GHz Real Time Spectrum Analyzer Programmer Manual
Standard Setup Commands
:Setup:ReferenceOsc (?)
Selects or queries the reference oscillator.
Syntax
:Setup:ReferenceOsc { Internal | External }
:Setup:ReferenceOsc?
Arguments
Internal selects the internal reference oscillator. It generates 10 MHz sine
wave.
External selects the external reference oscillator. It is connected to the 10 MHz
REF INPUT connector on the rear panel.
Examples
:Setup:ReferenceOsc Internal
selects the internal reference oscillator.
:Setup:Save (No Query Form)
Saves the trigger mask to the specified file.
Syntax
Arguments
Examples
Related Commands
:Setup:Save <file_name>
<file_name>::=<string> specifies the file to save the trigger mask.
The file name must be “*.TRG”.
:Setup:Save "SAMPLE1.TRG"
saves the trigger mask to the file SAMPLE1.TRG.
:Setup:Load
3066 & 3086 3 GHz Real Time Spectrum Analyzer Programmer Manual
2-67
Standard Setup Commands
:Setup:Span (?)
Sets or queries the span.
Syntax
:Setup:Span <value>
:Setup:Span?
Arguments
<value> depends on the input mode and the memory mode:
Input mode
Memory mode
<value>
IQ 1, Wideband 1
-
{ 30M | 20M | 10M }
RF
Other than Zoom
{ 3G | 2G | 1G | 500M | 200M | 100M | 50M | 30M |
20M | 10M | 6M | 5M | 2M | 1M | 500k | 200k | 100k |
50k | 20k | 10k | 5k | 2k | 1k | 500 | 200 | 100 }
Zoom
{ 3G | 2G | 1G | 500M | 200M | 100M | 50M | 30M |
20M | 10M | 5M | 2M | 1M | 500k | 200k | 100k | 50k
| 20k | 10k | 5k | 2k | 1k | 500 | 200 | 100 }
Other than Zoom
{ 10M | 6M | 5M | 2M | 1M | 500k | 200k | 100k | 50k
| 20k | 10k | 5k | 2k | 1k | 500 | 200 | 100 }
Zoom
{ 5M | 2M | 1M | 500k | 200k | 100k | 50k | 20k | 10k
| 5k | 2k | 1k | 500 | 200 | 100 }
Baseband
1
Examples
Related Commands
The 3086 only.
:Setup:Span 1M
sets the span to 1 MHz.
:Setup:InputMode, :Setup:MemoryMode
:Setup:Trigger (?)
Selects or queries the trigger mode.
Syntax
:Setup:Trigger { Auto | Delayed | Interval | Never | Normal |
Quick | QuickInterval | Timeout }
:Setup:Trigger?
2-68
3066 & 3086 3 GHz Real Time Spectrum Analyzer Programmer Manual
Standard Setup Commands
Arguments
In the IQ and Wideband modes of the 3086, you can not select Quick and
QuickInterval.
Auto acquires data regardless of trigger generation as follows:
If you have turned off the trigger count, the data acquisition will repeat until you
stop it.
If you have turned on the trigger count, the data will be acquired the number of
times specified with the :Setup:TriggerTimes command after you start the
acquisition.
Delayed causes the data acquisition to stop for the time after the trigger specified
with the :Setup:TriggerDelayed command.
Interval specifies that a block data is acquired and displayed at the time
interval set with the :Setup:TriggerInterval command.
Never ignores any trigger settings. The data acquisition repeats until you stop it.
Normal waits for a valid trigger event.
Quick is the same as the Normal except that data is displayed after all blocks are
acquired. It shortens the time interval between two block data acquisitions. In the
Normal mode, the interval is several decade milli-seconds. In the Quick mode, it
is several hundred micro-seconds.
QuickInterval is the same as the Interval, except that data is displayed after
all blocks are acquired. You can capture phenomena which are missed during
data display in the Interval mode.
Timeout stops the data acquisition if the trigger event does not occur within the
time specified with the :Setup:TriggerTimeout command. This argument is
effective only when the trigger source is set to Internal.
Examples
Related Commands
:Setup:Trigger Auto
selects the Auto trigger mode.
:Config:Block, :Config:Start, :Config:Stop,
:Setup:TriggerCount, :Setup:TriggerDelayed, :Setup:TriggerDomain,
:Setup:TriggerInterval, :Setup:TriggerPosition,
:Setup:TriggerSlope, :Setup:TriggerSource, :Setup:TriggerTimeout,
:Setup:TriggerTimes
3066 & 3086 3 GHz Real Time Spectrum Analyzer Programmer Manual
2-69
Standard Setup Commands
:Setup:TriggerCount (?)
Turns the trigger counter on or off.
Syntax
:Setup:TriggerCount { On | Off }
:Setup:TriggerCount?
Arguments
On turns the trigger counter on.
Off turns the trigger counter off.
Examples
Related Commands
:Setup:TriggerCount On
turns the trigger counter on.
:Setup:Trigger, :Setup:TriggerTimes
:Setup:TriggerDelayed (?)
Sets or queries the delay time for the Delayed trigger mode.
Syntax
:Setup:TriggerDelayed <value>
:Setup:TriggerDelayed?
Arguments
Examples
Related Commands
2-70
<value>::=<NR3> specifies the delay time. The range is 0 to 60 s.
:Setup:TriggerDelayed 100m
sets the trigger delay time to 100 ms.
:Setup:Trigger
3066 & 3086 3 GHz Real Time Spectrum Analyzer Programmer Manual
Standard Setup Commands
:Setup:TriggerDomain (?)
Sets or queries the domain in which the analyzer is triggered.
Syntax
:Setup:TriggerDomain { Frequency | Time }
:Setup:TriggerDomain?
Arguments
Frequency selects the frequency domain for trigger.
Time selects the time domain for trigger.
Examples
Related Commands
:Setup:TriggerDomain Frequency
selects the frequency domain for trigger.
:Setup:Trigger
:Setup:TriggerInterval (?)
Sets or queries the time interval for the Interval and Quick Interval trigger
modes.
Syntax
:Setup:TriggerInterval <value>
:Setup:TriggerInterval?
Arguments
Examples
Related Commands
<value>::=<NR3> ranges 1 s to 3600 s.
:Setup:TriggerInterval 3000
sets the time interval for the Interval and Quick Interval trigger modes to 3000 s.
:Setup:Trigger
3066 & 3086 3 GHz Real Time Spectrum Analyzer Programmer Manual
2-71
Standard Setup Commands
:Setup:TriggerPosition (?)
Sets or queries the trigger position.
Syntax
:Setup:TriggerPosition <value>
:Setup:TriggerPosition?
Arguments
Examples
Related Commands
<value>::=<NR2> ranges 0 to 100 % in 1 % step.
The trigger position represents the ratio of the number of frames preceding the
trigger generation to that of one block.
:Setup:TriggerPosition 10
For example, if the block size is 1,000 frames, 100 frames will be acquired
before the trigger generation, and 900 frames after it.
:Setup:Trigger
:Setup:TriggerSlope (?)
Selects or queries a rising or falling edge for the trigger.
Syntax
:Setup:TriggerSlope { Rise | Fall }
:Setup:TriggerSlope?
Arguments
Rise specifies to trigger on the rising or positive edge of a signal.
Fall specifies to trigger on the falling or negative edge of a signal.
Examples
Related Commands
2-72
:Setup:TriggerSlope Rise
specifies to trigger on the rising edge of a signal.
:Setup:Trigger, :Setup:TriggerSource
3066 & 3086 3 GHz Real Time Spectrum Analyzer Programmer Manual
Standard Setup Commands
:Setup:TriggerSource (?)
Selects or queries the trigger source.
Syntax
:Setup:TriggerSource { Internal | External }
:Setup:TriggerSource?
Arguments
Internal uses the trigger mask pattern stored in the internal register for trigger
generation.
External uses the signal from the EXT TRIG connector on the front panel as a
trigger input.
In the IQ mode of the 3086, the source is fixed to External.
Examples
Related Commands
:Setup:TriggerSource Internal
uses the trigger mask pattern stored in the internal register as the trigger source.
:Setup:Trigger
:Setup:TriggerTimeout (?)
Sets or queries the timeout value in the Timeout trigger mode.
Syntax
:Setup:TriggerTimeout <value>
:Setup:TriggerTimeout?
Arguments
Examples
Related Commands
<value>::=<NR3> specifies the timeout value. The range is 0 to 60 s.
:Setup:TriggerTimeout 30
sets the timeout to 30 s.
:Setup:Trigger
3066 & 3086 3 GHz Real Time Spectrum Analyzer Programmer Manual
2-73
Standard Setup Commands
:Setup:TriggerTimes (?)
Sets or queries the trigger count for the Count trigger mode.
Syntax
:Setup:TriggerTimes <value>
:Setup:TriggerTimes?
Arguments
Examples
Related Commands
<value>::=<NR1> depends on the FFT points and the memory mode:
FFT points
Memory mode
<value>
256
-
1 to 16000/(Block size)
1024
Frequency
1 to 4000/(Block size)
Other than Frequency
1 to 2000/(Block size)
:Setup:TriggerTimes 10
sets the trigger count to 10.
:Setup:Trigger
:Setup:Version? (Query Only)
Queries the version of the Setup program.
Syntax
Returns
Examples
2-74
:Setup:Version?
<NR2> indicates the version number.
:Setup:Version?
might return 1.1.
3066 & 3086 3 GHz Real Time Spectrum Analyzer Programmer Manual
Standard Setup Commands
:Setup:Zoom:Execute (No Query Form)
Zooms waveform with the expansion factor specified by the :Setup:Zoom:Mag
command.
Syntax
Arguments
Examples
Related Commands
:Setup:Zoom:Execute
None
:Setup:Zoom:Execute
zooms waveform.
:Setup:MemoryMode, :Setup:Zoom:Frequency, :Setup:Zoom:Mag
:Setup:Zoom:Frequency (?)
Sets or queries the center frequency for the zoom.
Syntax
:Setup:Zoom:Frequency <value>
:Setup:Zoom:Frequency?
Arguments
Examples
Related Commands
<value>::=<NR3> specifies the center frequency for the zoom.
:Setup:Zoom:Frequency 1.5G
sets the center frequency for the zoom to 1.5 GHz.
:Setup:Zoom:Execute, :Setup:Zoom:Mag
3066 & 3086 3 GHz Real Time Spectrum Analyzer Programmer Manual
2-75
Standard Setup Commands
:Setup:Zoom:Mag (?)
Sets or queries the expansion factor in the Zoom mode.
Syntax
:Setup:Zoom:Mag <value>
:Setup:Zoom:Mag?
Arguments
<value>::=<NR1> is the expansion factor. It depends on the span.
Span before zoom
Expansion factor
5 MHz
2 | 5 | 10 | 20 | 50 | 100 | 200 | 500 | 1000
Other than 5 MHz
2 | 4 | 10 | 20 | 40 | 100 | 200 | 400 | 1000
In the IQ and Wideband modes of the 3086, the expansion factor is the same as
in 5 MHz span.
Examples
Related Commands
2-76
:Setup:Zoom:Mag 10
magnifies the display 10 times.
:Setup:Zoom:Execute, :Setup:Zoom:Frequency
3066 & 3086 3 GHz Real Time Spectrum Analyzer Programmer Manual
CDMA Setup Commands
When you select CDMA in the Config:Setup command, use the commands in this
section to set the details for the CDMA setup.
3066 & 3086 3 GHz Real Time Spectrum Analyzer Programmer Manual
2-77
CDMA Setup Commands
:Setup:BlockSize (?)
Sets or queries the number of frames per block.
Syntax
:Setup:BlockSize <value>
:Setup:BlockSize?
Arguments
Examples
Related Commands
2-78
<value>::=<NR1> depends on the FFT points and the memory mode:
FFT points
Memory mode
<value>
256
-
1 to 16000
1024
Frequency
1 to 4000
Other than Frequency
1 to 2000
:Setup:BlockSize 200
sets the number of frames per block to 200.
:Setup:FFTPoints, :Setup:MemoryMode
3066 & 3086 3 GHz Real Time Spectrum Analyzer Programmer Manual
CDMA Setup Commands
:Setup:CDMA:Channel (?)
Selects or queries the channel.
Syntax
:Setup:CDMA:Channel <value>
:Setup:CDMA:Channel?
Arguments
<value>::=<NR1> specifies the channel number.
For the IS-95 standard, the range is 1 to 777. Channel 1 and 777 correspond to
825.03 and 848.31 MHz, respectively. The frequency difference between two
adjacent channels is 0.03 MHz.
For the T-53 standard, the range is 1 to 1199. Channel 1 and 1199 correspond to
915.0125 and 888.9875 MHz, respectively. The frequency difference between
two adjacent channels is 0.0125 MHz.
Examples
Related Commands
:Setup:CDMA:Channel 777
sets the channel number to 777.
:Setup:CDMA:Standard
:Setup:CDMA:Span30M (No Query Form)
Sets the span to 30 MHz. This command is used for the IS-95 standard.
Syntax
Arguments
Examples
Related Commands
:Setup:CDMA:Span30M
None
:Setup:CDMA:Span30M
sets the span to 30 MHz.
:Setup:Span
3066 & 3086 3 GHz Real Time Spectrum Analyzer Programmer Manual
2-79
CDMA Setup Commands
:Setup:CDMA:Span50M (No Query Form)
Sets the span to 50 MHz. This command is used for the T-53 standard.
Syntax
Arguments
Examples
Related Commands
:Setup:CDMA:Span50M
None
:Setup:CDMA:Span50M
sets the span to 50 MHz.
:Setup:Span
:Setup:CDMA:Span5MAuto (No Query Form)
Sets the span to 5 MHz and the trigger mode to Auto.
Syntax
Arguments
Examples
Related Commands
2-80
:Setup:CDMA:Span5MAuto
None
:Setup:CDMA:Span5MAuto
sets the span to 5 MHz and the trigger mode to Auto.
:Setup:Span
3066 & 3086 3 GHz Real Time Spectrum Analyzer Programmer Manual
CDMA Setup Commands
:Setup:CDMA:Span5MNormal (No Query Form)
Sets the span to 5 MHz and the trigger mode to Normal.
Syntax
Arguments
Examples
Related Commands
:Setup:CDMA:Span5MNormal
None
:Setup:CDMA:Span5MNormal
sets the span to 5 MHz and the trigger mode to Normal.
:Setup:Span
:Setup:CDMA:Standard (?)
Selects or queries the CDMA standard.
Syntax
:Setup:CDMA:Standard { IS95 | T53 }
:Setup:CDMA:Standard?
Arguments
IS95 selects the IS-95 standard.
T53 selects the T-53 standard.
Examples
:Setup:CDMA:Standard IS95
selects the IS-95 standard.
3066 & 3086 3 GHz Real Time Spectrum Analyzer Programmer Manual
2-81
CDMA Setup Commands
:Setup:CDMA:TriggerLevel (?)
Sets or queries the trigger level in the time domain.
Syntax
:Setup:CDMA:TriggerLevel <value>
:Setup:CDMA:TriggerLevel?
Arguments
Examples
<value>::=<NR2> specifies the trigger level. The range is –40 dB to 0 dB.
:Setup:CDMA:TriggerLevel 0
sets the trigger level to 0 dB.
:Setup:MarkerToFreq (No Query Form)
Sets the center frequency to the value at the marker.
Syntax
Arguments
Examples
:Setup:MarkerToFreq
None
:Setup:MarkerToFreq
sets the center frequency to the value at the marker.
:Setup:MaxSpan (No Query Form)
Sets the span to the maximum.
Syntax
Arguments
Examples
Related Commands
2-82
:Setup:MaxSpan
None
:Setup:MaxSpan
sets the span to the maximum.
:Setup:Span
3066 & 3086 3 GHz Real Time Spectrum Analyzer Programmer Manual
CDMA Setup Commands
:Setup:ReferenceLevel (?)
Sets or queries the reference level.
Syntax
:Setup:ReferenceLevel <value>
:Setup:ReferenceLevel?
Arguments
Examples
<value>::=<NR1> specifies the reference level.
The range is –50 dBm to 30 dBm.
:Setup:ReferenceLevel 30
sets the reference level to 30 dBm.
:Setup:ReferenceOsc (?)
Selects or queries the reference oscillator.
Syntax
:Setup:ReferenceOsc { Internal | External }
:Setup:ReferenceOsc?
Arguments
Internal selects the internal reference oscillator. It generates 10 MHz sine
wave.
External selects the external reference oscillator. It is connected to the 10 MHz
REF INPUT connector on the rear panel.
Examples
:Setup:ReferenceOsc Internal
selects the internal reference oscillator.
3066 & 3086 3 GHz Real Time Spectrum Analyzer Programmer Manual
2-83
CDMA Setup Commands
:Setup:Span (?)
Sets or queries the span.
Syntax
:Setup:Span <value>
:Setup:Span?
Arguments
<value> specifies the span. It depends on the input mode and the memory mode:
Input mode
Memory mode
Span
RF
Other than Zoom
{ 3G | 2G | 1G | 500M | 200M | 100M | 50M | 30M |
20M | 10M | 6M | 5M | 2M | 1M | 500k | 200k | 100k |
50k | 20k | 10k | 5k | 2k | 1k | 500 | 200 | 100 }
Zoom
{ 3G | 2G | 1G | 500M | 200M | 100M | 50M | 30M |
20M | 10M | 5M | 2M | 1M | 500k | 200k | 100k | 50k
| 20k | 10k | 5k | 2k | 1k | 500 | 200 | 100 }
Other than Zoom
{ 10M | 6M | 5M | 2M | 1M | 500k | 200k | 100k | 50k
| 20k | 10k | 5k | 2k | 1k | 500 | 200 | 100 }
Zoom
{ 5M | 2M | 1M | 500k | 200k | 100k | 50k | 20k | 10k
| 5k | 2k | 1k | 500 | 200 | 100 }
Baseband
Examples
Related Commands
2-84
:Setup:Span 5M
sets the span to 5 MHz.
:Setup:CDMA:Span30M, :Setup:CDMA:Span5MAuto,
:Setup:CDMA:Span5MNormal, :Setup:MaxSpan
3066 & 3086 3 GHz Real Time Spectrum Analyzer Programmer Manual
CDMA Setup Commands
:Setup:Trigger (?)
Selects or queries the trigger mode.
Syntax
:Setup:Trigger { Auto | Delayed | Interval | Never | Normal |
Quick | QuickInterval | Timeout }
:Setup:Trigger?
Arguments
Auto acquires data regardless of trigger generation as follows:
If you have turned off the trigger count, the data acquisition will repeat until you
stop it.
If you have turned on the trigger count, the data will be acquired the number of
times specified with the :Setup:TriggerTimes command after you start the
acquisition.
Delayed causes the data acquisition to stop the specified time after the trigger.
Interval specifies that a block data is acquired and displayed at the time
interval set with the :Setup:TriggerInterval command.
Never ignores any trigger settings. The data acquisition repeats until you stop it.
Normal waits for a valid trigger event.
Quick is the same as the Normal except that data is displayed after all blocks are
acquired. It shortens the time interval between two block data acquisitions. In the
Normal mode, the interval is several decade milli-seconds. In the Quick mode, it
is several hundred micro-seconds.
QuickInterval is the same as the Interval, except that data is displayed after
all blocks are acquired. You can capture phenomena which are missed during
data display in the Interval mode.
Timeout stops the data acquisition if the trigger event does not occur within the
time specified with the :Setup:TriggerTimeout command. This argument is
effective only when the trigger source is set to Internal.
Examples
Related Commands
:Setup:Trigger Auto
selects the Auto trigger mode.
:Config:Block, :Config:Start, :Config:Stop,
:Setup:TriggerCount, :Setup:TriggerDelayed, :Setup:TriggerDomain,
:Setup:TriggerInterval, :Setup:TriggerPosition,
:Setup:TriggerSlope, :Setup:TriggerSource, :Setup:TriggerTimeout,
:Setup:TriggerTimes
3066 & 3086 3 GHz Real Time Spectrum Analyzer Programmer Manual
2-85
CDMA Setup Commands
:Setup:TriggerCount (?)
Turns the trigger counter on or off.
Syntax
:Setup:TriggerCount { Off | On }
:Setup:TriggerCount?
Arguments
On turns the trigger counter on.
Off turns the trigger counter off.
Examples
Related Commands
:Setup:TriggerCount On
turns the trigger counter on.
:Setup:Trigger, :Setup:TriggerTimes
:Setup:TriggerDelayed (?)
Sets or queries the delay time for the Delayed trigger mode.
Syntax
:Setup:TriggerDelayed <value>
:Setup:TriggerDelayed?
Arguments
Examples
Related Commands
2-86
<value>::=<NR3> specifies the delay time. The range is 0 to 60 s.
:Setup:TriggerDelayed 100m
sets the trigger delay time to 100 ms.
:Setup:Trigger
3066 & 3086 3 GHz Real Time Spectrum Analyzer Programmer Manual
CDMA Setup Commands
:Setup:TriggerDomain (?)
Sets or queries the domain in which the analyzer is triggered.
Syntax
:Setup:TriggerDomain { Frequency | Time }
:Setup:TriggerDomain?
Arguments
Frequency selects the frequency domain for trigger.
Time selects the time domain for trigger.
Examples
Related Commands
:Setup:TriggerDomain Frequency
selects the frequency domain for trigger.
:Setup:Trigger
:Setup:TriggerInterval (?)
Sets or queries the time interval for the Interval and Quick Interval trigger
modes.
Syntax
:Setup:TriggerInterval <value>
:Setup:TriggerInterval?
Arguments
Examples
Related Commands
<value>::=<NR3> ranges 1 s to 3600 s.
:Setup:TriggerInterval 3000
sets the time interval for the Interval and Quick Interval trigger modes to 3000 s.
:Setup:Trigger
3066 & 3086 3 GHz Real Time Spectrum Analyzer Programmer Manual
2-87
CDMA Setup Commands
:Setup:TriggerPosition (?)
Sets or query the trigger position.
Syntax
:Setup:TriggerPosition <value>
:Setup:TriggerPosition?
Arguments
Examples
Related Commands
<value>::=<NR2> ranges 0 to 100 % in 1 % step.
The trigger position represents the ratio of the number of frames preceding the
trigger generation to that of one block.
:Setup:TriggerPosition 10
For example, if the block size is 1,000 frames, 100 frames will be acquired
before the trigger generation, and 900 frames after it.
:Setup:Trigger
:Setup:TriggerSlope (?)
Selects either a rising or falling edge for the trigger.
Syntax
:Setup:TriggerSlope { Rise | Fall }
:Setup:TriggerSlope?
Arguments
Rise specifies to trigger on the rising or positive edge of a signal.
Fall specifies to trigger on the falling or negative edge of a signal.
Examples
Related Commands
2-88
:Setup:TriggerSlope Rise
specifies to trigger on the rising edge of a signal.
:Setup:Trigger, :Setup:TriggerSource
3066 & 3086 3 GHz Real Time Spectrum Analyzer Programmer Manual
CDMA Setup Commands
:Setup:TriggerSource (?)
Selects or queries the trigger source.
Syntax
:Setup:TriggerSource { Internal | External }
:Setup:TriggerSource?
Arguments
Internal uses the trigger mask pattern stored in the internal register for trigger
generation.
External uses the signal from the EXT TRIG connector on the front panel as a
trigger input.
Examples
Related Commands
:Setup:TriggerSource Internal
uses the trigger mask pattern stored in the internal register as the trigger source.
:Setup:Trigger
:Setup:TriggerTimeout (?)
Sets or queries the timeout value in the Timeout trigger mode.
Syntax
:Setup:TriggerTimeout <value>
:Setup:TriggerTimeout?
Arguments
Examples
Related Commands
<value>::=<NR3> specifies the timeout value. The range is 0 to 60 s.
:Setup:TriggerTimeout 30
sets the timeout to 30 s.
:Setup:Trigger
3066 & 3086 3 GHz Real Time Spectrum Analyzer Programmer Manual
2-89
CDMA Setup Commands
:Setup:TriggerTimes (?)
Sets or queries the trigger count in the Count trigger mode.
Syntax
:Setup:TriggerTimes <value>
:Setup:TriggerTimes?
Arguments
Examples
Related Commands
<value>::=<NR1> depends on the FFT points and the memory mode:
FFT points
Memory mode
<value>
256
-
1 to 16000/(Block size)
1024
Frequency
1 to 4000/(Block size)
Other than Frequency
1 to 2000/(Block size)
:Setup:TriggerTimes 10
sets the trigger count to 10.
:Setup:Trigger
:Setup:Version? (Query Only)
Queries the version of the CDMA Setup program.
Syntax
Returns
Examples
2-90
:Setup:Version?
<NR2> indicates the version number.
:Setup:Version?
might return 1.1.
3066 & 3086 3 GHz Real Time Spectrum Analyzer Programmer Manual
Waveform View Commands
When you select Waveform in the Config:View<x> command, use the
commands in this section to set the details for the Waveform view.
3066 & 3086 3 GHz Real Time Spectrum Analyzer Programmer Manual
2-91
Waveform View Commands
:View<x>:Average:Times (?)
Sets or queries the number of frames that make up an averaged waveform.
Syntax
:View<x>:Average:Times <value>
:View<x>:Average:Times?
Arguments
Examples
Related Commands
<value>::=<NR1> is the number of frames for averaging, from 1 to 1000.
:View1:Average:Times 1000
specifies that an averaged waveform will show the result of combining 1000
frames.
:View<x>:Average:Type
:View<x>:Average:Type (?)
Selects or queries the average type. You can also select the peak hold mode. For
more information about the averaging, refer to the User Manual.
Syntax
:View<x>:Average:Type { RMSExpo | RMS | PeakHold }
:View<x>:Average:Type?
Arguments
RMSExpo averages with the RMS (root mean squared) exponential. This mode
weights older acquisition data so that they have a progressively smaller effect on
the average.
RMS averages with the RMS (root mean squared).
PeakHold holds the peak value for each data point.
Examples
Related Commands
2-92
:View1:Average:Type RMSExpo
averages waveform with the exponential RMS.
:View<x>:Average:Time
3066 & 3086 3 GHz Real Time Spectrum Analyzer Programmer Manual
Waveform View Commands
:View<x>:Compression (?)
Selects or queries the display data compression method. It specifies how to take
or discard each acquired data point for a corresponding pixel on the screen
because the number of horizontal pixels is usually less than that of data points.
Syntax
:View<x>:Compression { Sample | MinMax | Max | Min }
:View<x>:Compression?
Arguments
Sample takes the acquired data points at regular intervals to obtain a waveform
display.
MinMax takes the minimum and the maximum data points for a corresponding
pixel. The minimum and the maximum data points are displayed with a vertical
bar on the screen.
Max takes the maximum data point for a corresponding pixel.
Min takes the minimum data point for a corresponding pixel.
Examples
:View1:Compression Sample
takes the acquired data points at regular intervals to obtain a waveform display.
:View<x>:CopyFrom (No Query Form)
Loads the display data from the text file.
Syntax
Arguments
Examples
Related Commands
:View<x>:CopyFrom <file_name>
<file_name>::=<string> is “*.TXT” (ASCII text file).
The file is the one to which the display data has been stored with the
:View<x>:CopyTo command.
:View1:CopyFrom "SAMPLE1.TXT"
loads the display data from the file SAMPLE1.TXT.
:View<x>:CopyTo
3066 & 3086 3 GHz Real Time Spectrum Analyzer Programmer Manual
2-93
Waveform View Commands
:View<x>:CopyTo (No Query Form)
Stores the display data to a file or data register. This command is effective only
for the data acquired in the Vector mode.
Syntax
Arguments
:View<x>:CopyTo { Clipboard | D1 | D2 | D3 | D4 | D5 | D6 | D7 |
D8 | <file_name> }
Clipboard copies the display data to the Windows clipboard in the ASCII text
format. You can use the data in your application.
D1 to D8 are the data register 1 to 8, respectively.
<file_name>::=<string> is “*.TXT” (ASCII text file). The extension is set to
“.TXT” automatically.
Examples
Related Commands
:View1:CopyTo Clipboard
stores the display data to the clipboard.
:View<x>:CopyFrom
:View<x>:Edit (?)
Determines whether to display the trigger mask on the analyzer screen.
Displaying the mask enables you to edit it.
Syntax
:View<x>:Edit { On | Off }
:View<x>:Edit?
Arguments
On displays the trigger mask and enables you to edit it.
Off does not display the trigger mask and disables you to edit it.
Examples
2-94
:View1:Edit On
displays the trigger mask and enables you to edit it.
3066 & 3086 3 GHz Real Time Spectrum Analyzer Programmer Manual
Waveform View Commands
:View<x>:Edit:DrawHorizontal (No Query Form)
Fills the trigger mask area below the horizontal line on which the marker exists.
Syntax
Arguments
Examples
Related Commands
:View<x>:Edit:DrawHorizontal
None
:View1:Edit:DrawHorizontal
fills the trigger mask area below the horizontal line on which the marker exists.
:View<x>:Edit:Y
:View<x>:Edit:DrawLine (No Query Form)
Fills the trigger mask area below the line connecting the main marker and the
delta marker.
Syntax
Arguments
Examples
Related Commands
:View<x>:Edit:DrawLine
None
:View1:Edit:DrawLine
fills the trigger mask area below the line connecting the main marker and the
delta marker.
:View<x>:Edit:Y, :View<x>:Marker:ResetDelta
3066 & 3086 3 GHz Real Time Spectrum Analyzer Programmer Manual
2-95
Waveform View Commands
:View<x>:Edit:DrawMax (No Query Form)
Fills the trigger mask area below the maximum line i.e. the level 40 dB higher
than the reference level.
Syntax
Arguments
Examples
Related Commands
:View<x>:Edit:DrawMax
None
:View1:Edit:DrawMax
fills the trigger mask area below the maximum line.
:View<x>:Edit:DrawMin
:View<x>:Edit:DrawMin (No Query Form)
Fills the trigger mask area below the minimum line i.e. the level 70 dB lower
than the reference level.
Syntax
Arguments
Examples
Related Commands
:View<x>:Edit:DrawMin
None
:View1:Edit:DrawMin
fills the trigger mask area below the minimum line.
:View<x>:Edit:DrawMax
:View<x>:Edit:Y (?)
Sets or queries the marker vertical position when editing the trigger mask.
Syntax
:View<x>:Edit:Y <value>
:View<x>:Edit:Y?
2-96
3066 & 3086 3 GHz Real Time Spectrum Analyzer Programmer Manual
Waveform View Commands
Arguments
Examples
Related Commands
<value>::=<NR3> ranges from the minimum (low) edge to the maximum (high)
edge of the the vertical axis.
:View1:Edit:Y -50
places the marker on –50 of the vertical position.
:View<x>:Edit:DrawHorizontal, :View<x>:Edit:DrawLine
:View<x>:Format (?)
Selects or queries the waveform display format.
Syntax
:View<x>:Format { FreqAmpl | FreqPhase | FreqI | FreqQ | TimeAmpl
| TimePhase | TimeI | TimeQ }
:View<x>:Format?
Arguments
Examples
Defines the parameters associated with the horizontal and vertical axes as
follows:
Argument
Horizontal axis
Vertical axis
FreqAmpl
Frequency (span)
Amplitude
FreqPhase
Frequency (span)
Phase
FreqI
Frequency (span)
I (In-Phase)
FreqQ
Frequency (span)
Q (QuadratureĆPhase)
TimeAmpl
Time
Amplitude
TimePhase
Time
Phase
TimeI
Time
I (In-Phase)
TimeQ
Time
Q (QuadratureĆphase)
:View1:Format FreqAmpl
shows the waveform with frequency along the horizontal axis and amplitude
along the vertical axis.
3066 & 3086 3 GHz Real Time Spectrum Analyzer Programmer Manual
2-97
Waveform View Commands
:View<x>:Marker:Band:Center (?)
Sets or queries the center frequency of the band marker (the two vertical bar
cursors).
Syntax
:View<x>:Marker:Band:Center <value>
:View<x>:Marker:Band:Center?
Arguments
Examples
Related Commands
<value>::=<NR3> ranges from the minimum (left) edge to the maximum (right)
edge of the the horizontal axis.
:View1:Marker:Band:Center 1G
sets the center frequency of the band marker to 1 GHz.
:View<x>:Marker:Band:Left, :View<x>:Marker:Band:Right
:View<x>:Marker:Band:Left (?)
Sets or queries the frequency of the left edge of the band marker (the two vertical
bar cursors).
Syntax
:View<x>:Marker:Band:Left <value>
:View<x>:Marker:Band:Left?
Arguments
2-98
<value>::=<NR3> ranges from the minimum (left) edge to the maximum (right)
edge of the the horizontal axis.
Examples
:View1:Marker:Band:Left 900M
sets the frequency of the left edge of the band marker to 900 MHz.
Related Commands
:View<x>:Marker:Band:Center, :View<x>:Marker:Band:Right
3066 & 3086 3 GHz Real Time Spectrum Analyzer Programmer Manual
Waveform View Commands
:View<x>:Marker:Band:Right (?)
Sets or queries the frequency of the right edge of the band marker (the two
vertical bar cursors).
Syntax
:View<x>:Marker:Band:Right <value>
:View<x>:Marker:Band:Right?
Arguments
Examples
Related Commands
<value>::=<NR3> ranges from the minimum (left) edge to the maximum (right)
edge of the the horizontal axis.
:View1:Marker:Band:Right 1.1G
sets the frequency of the right edge of the band marker to 1.1 GHz.
:View<x>:Marker:Band:Center, :View<x>:Marker:Band:Left
:View<x>:Marker:Band:Width (?)
Sets or queries the bandwidth of the band marker (the two vertical bar cursors).
Syntax
:View<x>:Marker:Band:Width <value>
:View<x>:Marker:Band:Width?
Arguments
Examples
Related Commands
<value>::=<NR3> ranges 0 to full-scale of the horizontal axis.
:View1:Marker:Band:Width 50M
sets the bandwidth of the band marker to 50 MHz.
:View<x>:Marker:Band:Center, :View<x>:Marker:Band:Left,
:View<x>:Marker:Band:Right
3066 & 3086 3 GHz Real Time Spectrum Analyzer Programmer Manual
2-99
Waveform View Commands
:View<x>:Marker:DeltaMarker (?)
Turns the delta marker on or off.
Syntax
:View<x>:Marker:DeltaMarker { On | Off }
:View<x>:Marker:DeltaMarker?
Arguments
On turns the delta marker on.
Off turns the delta marker off.
Examples
Related Commands
:View1:Marker:DeltaMarker On
turns the delta marker on.
:View<x>:Marker:DeltaX, :View<x>:Marker:DeltaY?,
:View<x>:Marker:ResetDelta
:View<x>:Marker:DeltaX (?)
Sets or queries the horizontal position of the delta marker.
Syntax
:View<x>:Marker:DeltaX <value>
:View<x>:Marker:DeltaX?
Arguments
Examples
Related Commands
2-100
<value>::=<NR3> ranges from the minimum (left) edge to the maximum (right)
edge of the the horizontal axis.
:View1:Marker:DeltaX 1G
positions the delta marker at 1 GHz.
:View<x>:Marker:DeltaY
3066 & 3086 3 GHz Real Time Spectrum Analyzer Programmer Manual
Waveform View Commands
:View<x>:Marker:DeltaY? (Query Only)
Queries the vertical position of the delta marker.
Syntax
Returns
Examples
Related Commands
:View<x>:Marker:DeltaY?
<NR3>
:View1:Marker:DeltaY?
might return –100, indicating that the delta marker is at –100 dB.
:View<x>:Marker:DeltaX
:View<x>:Marker:Peak (No Query Form)
Moves the marker to the adjacent peak in the specified direction. Note that the
adjacent peak is farther than the distance specified with the :View<x>:Marker
:SearchSeparation command.
Syntax
Arguments
:View<x>:Marker:Peak { 1 | -1 }
1 moves the marker to the adjacent peak on the left of the marker.
-1 moves the marker to the adjacent peak on the right of the marker.
Examples
Related Commands
:View1:Marker:Peak -1
moves the marker to the adjacent peak on the right of the marker.
:View<x>:Marker:SearchMax, :View<x>:Marker:SearchMin,
:View<x>:Marker:SearchSeparation
3066 & 3086 3 GHz Real Time Spectrum Analyzer Programmer Manual
2-101
Waveform View Commands
:View<x>:Marker:ResetDelta (No Query Form)
Moves the delta marker to the main marker position.
Syntax
Arguments
Examples
Related Commands
:View<x>:Marker:ResetDelta
None
:View1:Marker:ResetDelta
moves the delta marker to the main marker position.
:View<x>:Marker:DeltaMarker
:View<x>:Marker:SearchMax (No Query Form)
Positions the marker on the highest signal on screen.
Syntax
Arguments
Examples
Related Commands
2-102
:View<x>:Marker:SearchMax
None
:View1:Marker:SearchMax
positions the marker on the highest signal on screen.
:View<x>:Marker:SearchMin
3066 & 3086 3 GHz Real Time Spectrum Analyzer Programmer Manual
Waveform View Commands
:View<x>:Marker:SearchMin (No Query Form)
Positions the marker on the lowest signal on screen.
Syntax
Arguments
Examples
Related Commands
:View<x>:Marker:SearchMin
None
:View1:Marker:SearchMin
positions the marker on the lowest signal on screen.
:View<x>:Marker:SearchMax
:View<x>:Marker:SearchSeparation (?)
Sets or queries the minimum horizontal distance to separate two peaks.
Syntax
:View<x>:Marker:SearchSeparation <value>
Arguments
<value>::=<NR2> specifies the minimum horizontal distance to separate two
peaks. The range is 1 to 10 % relative to full-scale.
Examples
:View1:Marker:SearchSeparation 10
sets the minimum horizontal distance for peak separation to 10 % relative to
full-scale.
Related Commands
:View<x>:Marker:Peak
3066 & 3086 3 GHz Real Time Spectrum Analyzer Programmer Manual
2-103
Waveform View Commands
:View<x>:Marker:Trace (?)
Selects or queries the trace on which the marker is placed.
Syntax
:View<x>:Marker:Trace { Trace1 | Trace2 }
:View<x>:Marker:Trace?
Arguments
Trace1 places the marker on the waveform specified with the :View<x>:Source
command.
Trace2 places the marker on the waveform specified with the
:View<x>:Trace2:Source command.
Examples
Related Commands
:View1:Marker:Trace Trace1
places the marker on the Trace 1.
:View<x>:Source, :View<x>:Trace2:Source
:View<x>:Marker:X (?)
Sets or queries the horizontal position of the marker.
Syntax
:View<x>:Marker:X <value>
:View<x>:Marker:X?
Arguments
Examples
Related Commands
2-104
<value>::=<NR3> ranges from the minimum (left) edge to the maximum (right)
edge of the the horizontal axis.
:View1:Marker:X 1.5G
positions the marker at 1.5 GHz.
:View<x>:Marker:Y?
3066 & 3086 3 GHz Real Time Spectrum Analyzer Programmer Manual
Waveform View Commands
:View<x>:Marker:Y? (Query Only)
Queries the vertical position of the marker.
Syntax
Returns
Examples
Related Commands
:View<x>:Marker:Y?
<NR3>
:View1:Marker:Y?
might return -30, indicating that the marker is at –30 dBm.
:View<x>:Marker:X
:View<x>:MaskVisible (?)
Determines whether or not to display the trigger mask on the analyzer screen.
Syntax
:View<x>:MaskVisible { On | Off }
:View<x>:MaskVisible?
Arguments
On displays the trigger mask.
Off hides the trigger mask.
Examples
:View1:MaskVisible On
displays the trigger mask.
3066 & 3086 3 GHz Real Time Spectrum Analyzer Programmer Manual
2-105
Waveform View Commands
:View<x>:Measurement (?)
Selects or queries the measurement item. The measurement starts with the data
acquisition. Query the results with the :View<x>:Result<y>? command.
Syntax
:View<x>:Measurement { Off | Noise | Power | C/N | C/No | ACP |
OBW }
:View<x>:Measurement?
Arguments
Off turns the measurement off.
Noise selects the noise measurement.
Power selects the power measurement.
C/N selects the carrier-to-noise ratio (C/N) measurement.
C/No selects the carrier-to-noise density ratio (C/No) measurement.
ACP selects the adjacent channel leakage power (ACP) measurement.
OBW selects the occupied bandwidth (OBW) measurement.
Examples
Related Commands
2-106
:View1:Measurement Noise
selects the noise measurement.
:View<x>:Measurement:ACP:BW, :View<x>:Measurement:ACP:SP,
:View<x>:Measurement:OBW, :View<x>:Result<y>?
3066 & 3086 3 GHz Real Time Spectrum Analyzer Programmer Manual
Waveform View Commands
:View<x>:Measurement:ACP:BW (?)
Sets or queries the bandwidth for the ACP measurement.
Syntax
:View<x>:Measurement:ACP:BW <value>
:View<x>:Measurement:ACP:BW?
Arguments
Examples
Related Commands
<value>::=<NR3> ranges 0 to full-scale.
:View1:Measurement:ACP:BW 1M
sets the bandwidth for the ACP measurement to 1 MHz.
:View<x>:Measurement
:View<x>:Measurement:ACP:Marker (?)
Selects or queries the band-marker position for the ACP measurement.
Syntax
:View<x>:Measurement:ACP:Marker { Upper | Center | Lower }
:View<x>:Measurement:ACP:Marker?
Arguments
Upper places the band marker to the next higher channel.
Center places the band marker to the current channel.
Lower places the band marker to the next lower channel.
Examples
Related Commands
:View1:Measurement:ACP:Marker Upper
places the band marker to the next higher channel.
:View<x>:Measurement
3066 & 3086 3 GHz Real Time Spectrum Analyzer Programmer Manual
2-107
Waveform View Commands
:View<x>:Measurement:ACP:SP (?)
Sets or queries the frequency interval between the adjacent channels for the ACP
measurement.
Syntax
:View<x>:Measurement:ACP:SP <value>
:View<x>:Measurement:ACP:SP?
Arguments
Examples
Related Commands
<value>::=<NR3> ranges 0 to full-scale.
:View1:Measurement:ACP:SP 2M
sets the frequency interval between the adjacent channels to 2 MHz for the ACP
measurement.
:View<x>:Measurement
:View<x>:Measurement:OBW (?)
Sets or queries the occupied bandwidth.
Syntax
:View<x>:Measurement:OBW <value>
:View<x>:Measurement:OBW?
Arguments
<value>::=<NR2> ranges 90 to 99.8 %.
Examples
:View1:Measurement:OBW 99.8
sets the occupied bandwidth to 99.8 %.
Related Commands
2-108
:View<x>:Measurement
3066 & 3086 3 GHz Real Time Spectrum Analyzer Programmer Manual
Waveform View Commands
:View<x>:Position (?)
Specifies or queries which frame in a block to be displayed.
Syntax
:View<x>:Position <value>
:View<x>:Position?
Arguments
Examples
<value>::=<NR2> ranges 0 to 100 %. It specifies the display frame position
relative to the block size. 0 % specifies that the first frame in a block is
displayed. 100 % represents the last frame.
:View1:Position 100
displays the last frame in a block.
:View<x>:Result<y>? (Query Only)
Queries the measurement results. Selects the measurement with the
:View<x>:Measurement command.
Syntax
Returns
:View<x>:Result<y>?
<NR3>
Result1 returns the result of the measurement specified with the
:View<x>:Measurement command. For the ACP measurement, it returns the
lower measurement result.
Result2 returns the ACP upper measurement result.
Examples
Related Commands
:View1:Measurement OBW;Result1?
might return 57.36E+03, indicating that the occupied bandwidth is 57.36 kHz.
:View<x>:Measurement
3066 & 3086 3 GHz Real Time Spectrum Analyzer Programmer Manual
2-109
Waveform View Commands
:View<x>:Scale:AutoScale (No Query Form)
Adjusts the scaling of the vertical axis automatically to best display the data.
When the parameter is level or phase, this command sets the vertical axis to
full-scale.
Syntax
Arguments
Examples
Related Commands
:View<x>:Scale:AutoScale
None
:View1:Scale:AutoScale
adjusts the scaling of the vertical axis automatically.
:View<x>:Format, :View<x>:Scale:XScale, :View<x>:Scale:YScale
:View<x>:Scale:HoldYScale (?)
Determines whether to hold or reset the vertical scale when you change the input
source.
Syntax
:View<x>:Scale:HoldYScale { On | Off }
:View<x>:Scale:HoldYScale?
Arguments
On holds the vertical scale setting when you change the input source.
Off resets the vertical scale to full-scale.
Examples
Related Commands
2-110
:View1:Scale:HoldYScale On
holds the vertical scale setting when you change the input source.
:View<x>:Scale:YScale, :View<x>:Scale:YStart, :View<x>:Source
3066 & 3086 3 GHz Real Time Spectrum Analyzer Programmer Manual
Waveform View Commands
:View<x>:Scale:XScale (?)
Sets or queries the horizontal axis full-scale to display a portion of the data.
Syntax
:View<x>:Scale:XScale <value>
:View<x>:Scale:XScale?
Arguments
Examples
Related Commands
<value>::=<NR3> ranges full-scale/256 to full-scale of the acquired data.
:View1:Scale:XScale 2.5M
sets the horizontal axis full-scale to 2.5 MHz.
:View<x>:Scale:XStart, :View<x>:Scale:YScale
:View<x>:Scale:XStart (?)
Sets or queries the value represented by the minimum (left) edge of the
horizontal axis.
Syntax
:View<x>:Scale:XStart <value>
:View<x>:Scale:XStart?
Arguments
Examples
Related Commands
<value>::=<NR3> ranges from the minimum to the maximum value on the
horizontal axis of the acquired data.
:View1:Scale:XStart 800M
sets the value represented by the left edge of the horizontal axis to 800 MHz.
:View<x>:Scale:XScale
3066 & 3086 3 GHz Real Time Spectrum Analyzer Programmer Manual
2-111
Waveform View Commands
:View<x>:Scale:YScale (?)
Sets or queries the vertical axis full-scale to display a portion of the data.
Syntax
:View<x>:Scale:YScale <value>
:View<x>:Scale:YScale?
Arguments
Examples
Related Commands
<value>::=<NR3> ranges full-scale/100 to full-scale of the acquired data.
:View1:Scale:YScale 20
sets the vertical axis full-scale to 20 dB.
:View<x>:Scale:XScale, :View<x>:Scale:YStart
:View<x>:Scale:YStart (?)
Sets or queries the value represented by the minimum (bottom) edge of the
vertical axis.
Syntax
:View<x>:Scale:YStart <value>
:View<x>:Scale:YStart?
Arguments
<value>::=<NR3> ranges from the reference level – 200 dB to the reference
level + 100 dB.
Examples
:View1:Scale:YStart -120
sets the value represented by the bottom edge of the vertical axis to –120 dB.
Related Commands
2-112
:View<x>:Scale:YScale
3066 & 3086 3 GHz Real Time Spectrum Analyzer Programmer Manual
Waveform View Commands
:View<x>:Source (?)
Selects or queries the display data source for the specified view.
Syntax
:View<x>:Source { None | Active | Average | Zoom | D1D2 |
D3D4 | D5D6 | D7D8 | D1 | D2 | D3 | D4 | D5 | D6 | D7 | D8 |
<file_name> }
:View<x>:Source?
Arguments
None specifies no source. The display area in the view will be emptied.
Active specifies the currently acquired data as the source.
Average specifies the averaged data as the source. When you select this item,
you have to set the average type and the number of averages using the
:View<x>:Average:Type and the :View<x>:Average:Times commands,
respectively.
Zoom specifies the zoomed data as the source.
D1D2 to D7D8 specify the register pair D1D2 to D7D8 as the source, respectively.
D1 to D8 specify the data register D1 to D8 as the source, respectively.
<file_name>::=<string> specifies the file as the source. The file name must
be “*.IQ” (the IQ format) or “*.AP” (the AP format).
Examples
Related Commands
:View1:Source Active
specifies the currently acquired data as the view source.
:Config:Mode, :View<x>:Average:Times, :View<x>:Average:Type
3066 & 3086 3 GHz Real Time Spectrum Analyzer Programmer Manual
2-113
Waveform View Commands
:View<x>:Trace2:Compression (?)
Selects or queries the Trace 2 display data compression method i.e. how to take
or discard each acquired data point for a corresponding pixel on the screen
because the number of horizontal pixels is usually less than that of data points.
Syntax
:View<x>:Trace2:Compression { Sample | MinMax | Max | Min }
:View<x>:Trace2:Compression?
Arguments
Sample takes the acquired data points at regular intervals to obtain a waveform
display.
MinMax takes the minimum and the maximum data points for a corresponding
pixel. The minimum and the maximum data points are displayed with a vertical
bar on the screen.
Max takes the maximum data point for a corresponding pixel.
Min takes the minimum data point for a corresponding pixel.
Examples
Related Commands
2-114
:View1:Trace2:Compression Sample
takes the acquired data points at regular intervals to obtain a waveform display.
:View<x>:Compression, :View<x>:Trace2:Source?
3066 & 3086 3 GHz Real Time Spectrum Analyzer Programmer Manual
Waveform View Commands
:View<x>:Trace2:Format (?)
Selects or queries the display format for the Trace 2.
Syntax
:View<x>:Trace2:Format { FreqAmpl | FreqPhase | FreqI | FreqQ |
TimeAmpl | TimePhase | TimeI | TimeQ }
:View<x>:Trace2:Format?
Arguments
Examples
Related Commands
Defines the parameters for the horizontal and vertical axes as follows:
Argument
Horizontal axis
Vertical axis
FreqAmpl
Frequency (span)
Amplitude
FreqPhase
Frequency (span)
Phase
FreqI
Frequency (span)
I (In-Phase)
FreqQ
Frequency (span)
Q (QuadratureĆPhase)
TimeAmpl
Time
Amplitude
TimePhase
Time
Phase
TimeI
Time
I (In-Phase)
TimeQ
Time
Q (QuadratureĆphase)
:View1:Trace2:Format FreqAmpl
shows the Trace 2 waveform with frequency along the horizontal axis and
amplitude along the vertical axis.
:View<x>:Trace2:Source
3066 & 3086 3 GHz Real Time Spectrum Analyzer Programmer Manual
2-115
Waveform View Commands
:View<x>:Trace2:Source (?)
Specifies or queries the display data source for the Trace 2.
Syntax
:View<x>:Trace2:Source { None | Active | Zoom | D1D2 |
D3D4 | D5D6 | D7D8 | D1 | D2 | D3 | D4 | D5 | D6 | D7 | D8 |
<file_name> }
:View<x>:Trace2:Source?
Arguments
None specifies no source. The display area in the view will be emptied.
Active specifies the currently acquired data as the source.
Zoom specifies the zoomed data as the source.
D1D2 to D7D8 specify the register pair D1D2 to D7D8 as the source, respectively.
D1 to D8 specify the data register D1 to D8 as the source, respectively.
<file_name>::=<string> specifies the data file as the source. The file name
must be “*.IQ” (the IQ format) or “*.AP” (the AP format).
Examples
Related Commands
:View1:Trace2:Source Active
specifies the currently acquired data as the source.
:Config:Mode, :View<x>:Source
:View<x>:Trace2:Z (?)
Specifies or queries the frame number to be displayed for the Trace 2.
Syntax
:View<x>:Trace2:Z <value>
:View<x>:Trace2:Z?
Arguments
Examples
Related Commands
2-116
<value>::=<NR1> ranges 0 to the number of frames – 1.
:View1:Trace2:Z 199
specifies that the frame 199 displays for the Trace 2.
:View<x>:Z
3066 & 3086 3 GHz Real Time Spectrum Analyzer Programmer Manual
Waveform View Commands
:View<x>:Version? (Query Only)
Queries the version of the Waveform View program.
Syntax
Returns
Examples
:View<x>:Version?
<NR2>
:View1:Version?
might return 1.1.
:View<x>:Z (?)
Specifies or queries the displayed frame number.
Syntax
:View<x>:Z <value>
:View<x>:Z?
Arguments
Examples
Related Commands
<value>::=<NR1> ranges from 0 to the number of frames – 1.
:View1:Z 199
specifies that the frame 199 displays.
:View<x>:Trace2:Z
3066 & 3086 3 GHz Real Time Spectrum Analyzer Programmer Manual
2-117
Waveform View Commands
2-118
3066 & 3086 3 GHz Real Time Spectrum Analyzer Programmer Manual
Analog View Commands
When you select Analog in the Config:View<x> command, use the commands
in this section to set the details for the Analog view.
3066 & 3086 3 GHz Real Time Spectrum Analyzer Programmer Manual
2-119
Analog View Commands
:View<x>:CopyTo (No Query Form)
Stores the display data to a file or data register. This command is effective only
for the data acquired in the Vector mode.
Syntax
Arguments
:View<x>:CopyTo { Clipboard | D1 | D2 | D3 | D4 | D5 | D6 | D7 |
D8 | <file_name> }
Clipboard stores the display data to the Windows clipboard in the ASCII text
format. You can use the data in your application.
D1 to D8 select the data register 1 to 8, respectively.
<file_name>::=<string> is “*.TXT” (ASCII text file). The extension is set to
“.TXT” automatically.
Examples
:View1:CopyTo Clipboard
stores the display data to the clipboard.
:View<x>:Format (?)
Selects or queries the signal modulation type.
Syntax
:View<x>:Format { AM | PM | FM }
:View<x>:Format?
Arguments
Examples
2-120
Specifies the modulation type:
Argument
Modulation type
Horizontal axis
Vertical axis
AM
Amplitude modulation
Time
Modulating factor
PM
Phase modulation
Time
Phase
FM
Frequency modulation
Time
Frequency
:View1:Format AM
selects the AM modulation.
3066 & 3086 3 GHz Real Time Spectrum Analyzer Programmer Manual
Analog View Commands
:View<x>:Marker:DeltaMarker (?)
Turns the delta marker on or off.
Syntax
:View<x>:Marker:DeltaMarker { On | Off }
:View<x>:Marker:DeltaMarker?
Arguments
On turns the delta marker on.
Off turns the delta marker off.
Examples
Related Commands
:View1:Marker:DeltaMarker On
turns the delta marker on.
:View<x>:Marker:DeltaX?, :View<x>:Marker:DeltaY?,
:View<x>:Marker:ResetDelta
:View<x>:Marker:DeltaX? (Query Only)
Queries the horizontal position of the delta marker.
Syntax
Returns
Examples
Related Commands
:View<x>:Marker:DeltaX?
<NR3>
:View1:Marker:DeltaX?
might return 3.4E-03, indicating that the delta marker is positioned at 3.4 ms.
:View<x>:Marker:DeltaY?
3066 & 3086 3 GHz Real Time Spectrum Analyzer Programmer Manual
2-121
Analog View Commands
:View<x>:Marker:DeltaY? (Query Only)
Queries the vertical position of the delta marker.
Syntax
Returns
Examples
Related Commands
:View<x>:Marker:DeltaY?
<NR3>
:View1:Marker:DeltaY?
might return –100, indicating that the delta marker is positioned at –100 dB.
:View<x>:Marker:DeltaX?
:View<x>:Marker:Peak (No Query Form)
Moves the marker to the adjacent peak in the specified direction. Note that the
adjacent peak is farther than the distance specified with the :View<x>:Marker
:SearchSeparation command.
Syntax
Arguments
:View<x>:Marker:Peak { 1 | -1 }
1 moves the marker to the adjacent peak on the left of the marker.
-1 moves the marker to the adjacent peak on the right of the marker.
Examples
Related Commands
2-122
:View1:Marker:Peak -1
moves the marker to the adjacent peak on the right of the marker.
:View<x>:Marker:SearchMax, :View<x>:Marker:SearchMin,
:View<x>:Marker:SearchSeparation
3066 & 3086 3 GHz Real Time Spectrum Analyzer Programmer Manual
Analog View Commands
:View<x>:Marker:ResetDelta (No Query Form)
Moves the delta marker to the main marker position.
Syntax
Arguments
Examples
Related Commands
:View<x>:Marker:ResetDelta
None
:View1:Marker:ResetDelta
moves the delta marker to the main marker position.
:View<x>:Marker:DeltaMarker
:View<x>:Marker:SearchMax (No Query Form)
Positions the marker on the highest signal on screen.
Syntax
Arguments
Examples
Related Commands
:View<x>:Marker:SearchMax
None
:View1:Marker:SearchMax
positions the marker on the highest signal on screen.
:View<x>:Marker:SearchMin
3066 & 3086 3 GHz Real Time Spectrum Analyzer Programmer Manual
2-123
Analog View Commands
:View<x>:Marker:SearchMin (No Query Form)
Positions the marker on the lowest signal on screen.
Syntax
Arguments
Examples
Related Commands
:View<x>:Marker:SearchMin
None
:View1:Marker:SearchMin
positions the marker on the lowest signal on screen.
:View<x>:Marker:SearchMax
:View<x>:Marker:SearchSeparation (?)
Sets or queries the minimum horizontal distance to separate two peaks.
Syntax
Arguments
<value>::=<NR2> specifies the minimum horizontal distance to separate two
peaks. The range is 1 to 10 % relative to full-scale.
Examples
:View1:Marker:SearchSeparation 10
sets the minimum horizontal distance for peak separation to 10 % relative to
full-scale.
Related Commands
2-124
:View<x>:Marker:SearchSeparation <value>
:View<x>:Marker:Peak
3066 & 3086 3 GHz Real Time Spectrum Analyzer Programmer Manual
Analog View Commands
:View<x>:Marker:X (?)
Sets or queries the horizontal position of the marker.
Syntax
:View<x>:Marker:X <value>
:View<x>:Marker:X?
Arguments
Examples
Related Commands
<value>::=<NR3> ranges from the minimum (left) edge to the maximum (right)
edge of the the horizontal axis.
:View1:Marker:X -50u
positions the marker at –50 ms.
:View<x>:Marker:Y?
:View<x>:Marker:Y? (Query Only)
Queries the vertical position of the marker.
Syntax
Returns
Examples
Related Commands
:View<x>:Marker:Y?
<NR3>
:View1:Marker:Y?
might return 30, indicating that the marker is at 30 % when the modulation type
is AM.
:View<x>:Marker:X
3066 & 3086 3 GHz Real Time Spectrum Analyzer Programmer Manual
2-125
Analog View Commands
:View<x>:Scale:AutoScale (No Query Form)
Adjusts the scaling of the vertical axis automatically to best display the data.
When the parameter is level or phase, this command sets the vertical axis to
full-scale.
Syntax
Arguments
Examples
Related Commands
:View<x>:Scale:AutoScale
None
:View1:Scale:AutoScale
adjusts the scaling of the vertical axis automatically.
:View<x>:Format, :View<x>:Scale:XScale, :View<x>:Scale:YScale
:View<x>:Scale:HoldYScale (?)
Determines whether to hold or reset the vertical scale when you change the input
source.
Syntax
:View<x>:Scale:HoldYScale { On | Off }
:View<x>:Scale:HoldYScale?
Arguments
On holds the vertical scale setting when you change the input source.
Off resets the vertical scale to full-scale.
Examples
Related Commands
2-126
:View1:Scale:HoldYScale On
holds the vertical scale setting when you change the input source.
:View<x>:Scale:YScale, :View<x>:Scale:YStart, :View<x>:Source
3066 & 3086 3 GHz Real Time Spectrum Analyzer Programmer Manual
Analog View Commands
:View<x>:Scale:XScale (?)
Sets or queries the horizontal axis full-scale to display a portion of the data.
Syntax
:View<x>:Scale:XScale <value>
:View<x>:Scale:XScale?
Arguments
Examples
Related Commands
<value>::=<NR3> ranges full-scale/256 to full-scale of the acquired data.
:View1:Scale:XScale 20u
sets the horizontal axis full-scale to 20 ms.
:View<x>:Scale:XStart, :View<x>:Scale:YScale
:View<x>:Scale:XStart (?)
Sets or queries the value represented by the minimum (left) edge of the
horizontal axis.
Syntax
:View<x>:Scale:XStart <value>
:View<x>:Scale:XStart?
Arguments
<value>::=<NR3> ranges from the minimum to the maximum value on the
horizontal axis of the acquired data.
Examples
:View1:Scale:XStart -50u
sets the value represented by the left edge of the horizontal axis to –50 ms.
Related Commands
:View<x>:Scale:XScale
3066 & 3086 3 GHz Real Time Spectrum Analyzer Programmer Manual
2-127
Analog View Commands
:View<x>:Scale:YScale (?)
Sets or queries the vertical axis full-scale to display a portion of the data.
Syntax
:View<x>:Scale:YScale <value>
:View<x>:Scale:YScale?
Arguments
<value>::=<NR3> ranges full-scale/100 to full-scale of the acquired data.
Examples
:View1:Scale:YScale 20
sets the vertical axis full-scale to 20 % when the modulation type is AM.
Related Commands
:View<x>:Scale:XScale, :View<x>:Scale:YStart
:View<x>:Scale:YStart (?)
Sets or queries the value represented by the minimum (bottom) edge of the
vertical axis.
Syntax
:View<x>:Scale:YStart <value>
:View<x>:Scale:YStart?
Arguments
Examples
Related Commands
2-128
<value>::=<NR3> ranges from the reference level – 200 dB to the reference
level + 100 dB.
:View1:Scale:YStart -10
sets the value represented by the bottom edge of the vertical axis to –10 % when
the modulation type is AM.
:View<x>:Scale:YScale
3066 & 3086 3 GHz Real Time Spectrum Analyzer Programmer Manual
Analog View Commands
:View<x>:Source (?)
Selects or queries the display data source for the specified view.
Syntax
:View<x>:Source { None | Active | Zoom | D1D2 | D3D4 | D5D6 |
D7D8 | <file_name> }
:View<x>:Source?
Arguments
None specifies no source. The display area in the view will be emptied.
Active specifies the currently acquired data as the source.
Zoom specifies the zoomed data as the source.
D1D2 to D7D8 specify the register pair D1D2 to D7D8 as the source, respectively.
<file_name>::=<string> specifies the data file as the source. The file name
must be “*.IQ” (the IQ format) or “*.AP” (the AP format).
Examples
Related Commands
:View1:Source Active
specifies the currently acquired data as the view source.
:Config:Mode
:View<x>:Version? (Query Only)
Queries the version of the Analog View program.
Syntax
Returns
Examples
:View<x>:Version?
<NR2>
:View1:Version?
might return 1.1.
3066 & 3086 3 GHz Real Time Spectrum Analyzer Programmer Manual
2-129
Analog View Commands
:View<x>:Z (?)
Specifies or queries the displayed frame number.
Syntax
:View<x>:Z <value>
:View<x>:Z?
Arguments
Examples
2-130
<value>::=<NR1> ranges from 0 to the number of frames – 1.
:View1:Z 199
specifies that the frame 199 displays.
3066 & 3086 3 GHz Real Time Spectrum Analyzer Programmer Manual
FSK View Commands
When you select FSK in the Config:View<x> command, use the commands in
this section to set the details for the FSK view.
3066 & 3086 3 GHz Real Time Spectrum Analyzer Programmer Manual
2-131
FSK View Commands
:View<x>:CopyTo (No Query Form)
Stores the display data to a file or data register. This command is effective only
for the data acquired in the Vector mode.
Syntax
Arguments
:View<x>:CopyTo { Clipboard | D1 | D2 | D3 | D4 | D5 | D6 | D7 |
D8 | <file_name> }
Clipboard stores the display data to the Windows clipboard in the ASCII text
format. You can use the data in your application.
D1 to D8 selects the data register 1 to 8, respectively.
<file_name>::=<string> is “*.TXT” (ASCII text file). The extension is set to
“.TXT” automatically.
Examples
:View1:CopyTo Clipboard
stores the display data to the clipboard.
:View<x>:Marker:DeltaMarker (?)
Turns the delta marker on or off.
Syntax
:View<x>:Marker:DeltaMarker { On | Off }
:View<x>:Marker:DeltaMarker?
Arguments
On turns the delta marker on.
Off turns the delta marker off
Examples
Related Commands
2-132
:View1:Marker:DeltaMarker On
turns the delta marker on.
:View<x>:Marker:DeltaX, :View<x>:Marker:DeltaY?,
:View<x>:Marker:ResetDelta
3066 & 3086 3 GHz Real Time Spectrum Analyzer Programmer Manual
FSK View Commands
:View<x>:Marker:DeltaX (?)
Sets or queries the horizontal position of the delta marker.
Syntax
:View<x>:Marker:DeltaX <value>
:View<x>:Marker:DeltaX?
Arguments
Examples
Related Commands
<value>::=<NR3> ranges from the minimum (left) edge to the maximum (right)
edge of the the horizontal (time) axis.
:View1:Marker:DeltaX 1.2m
positions the delta marker at 1.2 ms.
:View<x>:Marker:DeltaY
:View<x>:Marker:DeltaY? (Query Only)
Queries the vertical position of the delta marker.
Syntax
Returns
Examples
Related Commands
:View<x>:Marker:DeltaY?
<NR3>
:View1:Marker:DeltaY?
might return 850.5M, indicating that the delta marker is positioned at
850.5 MHz.
:View<x>:Marker:DeltaX?
3066 & 3086 3 GHz Real Time Spectrum Analyzer Programmer Manual
2-133
FSK View Commands
:View<x>:Marker:Peak (No Query Form)
Moves the marker to the adjacent peak in the specified direction. Note that the
adjacent peak is farther than the distance specified with the :View<x>:Marker
:SearchSeparation command.
Syntax
Arguments
:View<x>:Marker:Peak { 1 | -1 }
1 moves the marker to the adjacent peak on the left of the marker.
-1 moves the marker to the adjacent peak on the right of the marker.
Examples
Related Commands
:View1:Marker:Peak -1
moves the marker to the adjacent peak on the right of the marker.
:View<x>:Marker:SearchMax, :View<x>:Marker:SearchMin,
:View<x>:Marker:SearchSeparation
:View<x>:Marker:ResetDelta (No Query Form)
Moves the delta marker to the main marker position.
Syntax
Arguments
Examples
Related Commands
:View<x>:Marker:ResetDelta
None
:View1:Marker:ResetDelta
:View<x>:Marker:DeltaMarker
:View<x>:Marker:SearchMax (No Query Form)
Positions the marker on the highest signal on screen.
Syntax
Arguments
2-134
:View<x>:Marker:SearchMax
None
3066 & 3086 3 GHz Real Time Spectrum Analyzer Programmer Manual
FSK View Commands
Examples
Related Commands
:View1:Marker:SearchMax
positions the marker on the highest signal on screen.
:View<x>:Marker:SearchMin
:View<x>:Marker:SearchMin (No Query Form)
Positions the marker on the lowest signal on screen.
Syntax
Arguments
Examples
Related Commands
:View<x>:Marker:SearchMin
None
:View1:Marker:SearchMin
positions the marker on the lowest signal on screen.
:View<x>:Marker:SearchMax
:View<x>:Marker:SearchSeparation (?)
Sets or queries the minimum horizontal distance to separate two peaks.
Syntax
:View<x>:Marker:SearchSeparation <value>
Arguments
<value>::=<NR2> specifies the minimum horizontal distance to separate two
peaks. The range is 1 to 10 % relative to full-scale.
Examples
:View1:Marker:SearchSeparation 10
sets the minimum horizontal distance for peak separation to 10 % relative to
full-scale.
Related Commands
:View<x>:Marker:Peak
3066 & 3086 3 GHz Real Time Spectrum Analyzer Programmer Manual
2-135
FSK View Commands
:View<x>:Marker:X (?)
Sets or queries the horizontal position of the marker.
Syntax
:View<x>:Marker:X <value>
:View<x>:Marker:X?
Arguments
Examples
Related Commands
<value>::=<NR3> ranges from the minimum (left) edge to the maximum (right)
edge of the the horizontal (time) axis.
:View1:Marker:X 3.4
positions the marker at 3.4 ms.
:View<x>:Marker:Y?
:View<x>:Marker:Y? (Query Only)
Queries the vertical position of the marker.
Syntax
Returns
Examples
Related Commands
:View<x>:Marker:Y?
<NR3>
:View1:Marker:Y?
might return 543.2M, indicating that the marker is positioned at 543.2 MHz.
:View<x>:Marker:X
:View<x>:Scale:AutoScale (No Query Form)
Adjusts the scaling of the vertical (frequency) axis automatically to best display
the data.
Syntax
Arguments
2-136
:View<x>:Scale:AutoScale
None
3066 & 3086 3 GHz Real Time Spectrum Analyzer Programmer Manual
FSK View Commands
Examples
Related Commands
:View1:Scale:AutoScale
adjusts the scaling of the vertical axis automatically.
:View<x>:Scale:XScale, :View<x>:Scale:YScale
:View<x>:Scale:HoldYScale (?)
Determines whether to hold or reset the vertical scale when you change the input
source.
Syntax
:View<x>:Scale:HoldYScale { On | Off }
:View<x>:Scale:HoldYScale?
Arguments
On holds the vertical scale setting when you change the input source.
Off resets the vertical scale to full-scale.
Examples
Related Commands
:View1:Scale:HoldYScale On
holds the vertical scale setting when you change the input source.
:View<x>:Scale:YScale, :View<x>:Scale:YStart, :View<x>:Source
:View<x>:Scale:XScale (?)
Sets or queries the horizontal axis full-scale to display a portion of the data.
Syntax
:View<x>:Scale:XScale <value>
:View<x>:Scale:XScale?
Arguments
Examples
Related Commands
<value>::=<NR3> ranges full-scale/256 to full-scale of the acquired data.
:View1:Scale:XScale 20u
sets the horizontal axis full-scale to 20 ms.
:View<x>:Scale:XStart, :View<x>:Scale:YScale
3066 & 3086 3 GHz Real Time Spectrum Analyzer Programmer Manual
2-137
FSK View Commands
:View<x>:Scale:XStart (?)
Sets or queries the value represented by the minimum (left) edge of the
horizontal (time) axis.
Syntax
:View<x>:Scale:XStart <value>
:View<x>:Scale:XStart?
Arguments
<value>::=<NR3> ranges from the minimum to the maximum value on the
horizontal axis of the acquired data.
Examples
:View1:Scale:XStart -50u
sets the value represented by the left edge of the horizontal axis to –50 ms.
Related Commands
:View<x>:Scale:XScale
:View<x>:Scale:YScale (?)
Sets or queries the vertical axis full-scale to display a portion of the data.
Syntax
:View<x>:Scale:YScale <value>
:View<x>:Scale:YScale?
Arguments
Examples
Related Commands
2-138
<value>::=<NR3> ranges full-scale/100 to full-scale of the acquired data.
:View1:Scale:YScale 10M
sets the vertical axis full-scale to 10 MHz.
:View<x>:Scale:XScale, :View<x>:Scale:YStart
3066 & 3086 3 GHz Real Time Spectrum Analyzer Programmer Manual
FSK View Commands
:View<x>:Scale:YStart (?)
Sets or queries the value represented by the minimum (bottom) edge of the
vertical axis.
Syntax
:View<x>:Scale:YStart <value>
:View<x>:Scale:YStart?
Arguments
<value>::=<NR3> ranges from the minimum to the maximum value on the
vertical axis of the acquired data.
Examples
:View1:Scale:YStart -5M
sets the value represented by the bottom edge of the vertical axis to –5 MHz.
Related Commands
:View<x>:Scale:YScale
:View<x>:Source (?)
Selects or queries the display data source for the specified view.
Syntax
:View<x>:Source { None | Active | Zoom | D1D2 | D3D4 | D5D6 |
D7D8 | <file_name> }
:View<x>:Source?
Arguments
None specifies no source. The display area in the view will be emptied.
Active specifies the currently acquired data as the source.
Zoom specifies the zoomed data as the source.
D1D2 to D7D8 specify the register pair D1D2 to D7D8 as the source, respectively.
<file_name>::=<string> specifies the data file as the source. The file name
must be “*.IQ” (the IQ format) or “*.AP” (the AP format).
Examples
Related Commands
:View1:Source Active
specifies the currently acquired data as the view source.
:Config:Mode
3066 & 3086 3 GHz Real Time Spectrum Analyzer Programmer Manual
2-139
FSK View Commands
:View<x>:Version? (Query Only)
Queries the version of the FSK View program.
Syntax
Returns
Examples
:View<x>:Version?
<NR2>
:View1:Version?
might return 1.1.
:View<x>:Z (?)
Specifies or queries the displayed frame number.
Syntax
:View<x>:Z <value>
:View<x>:Z?
Arguments
Examples
2-140
<value>::=<NR1> ranges from 0 to the number of frames – 1.
:View1:Z 199
specifies that the frame 199 displays.
3066 & 3086 3 GHz Real Time Spectrum Analyzer Programmer Manual
Spectrogram View Commands
When you select Spectrogram in the Config:View<x> command, use the
commands in this section to control the Spectrogram view.
3066 & 3086 3 GHz Real Time Spectrum Analyzer Programmer Manual
2-141
Spectrogram View Commands
:View<x>:Compression (?)
Selects or queries the display data compression method. It specifies how to take
or discard each acquired data point for a corresponding pixel on the screen
because the number of horizontal pixels is usually less than that of data points.
Syntax
:View<x>:Compression { Sample | Max | Min }
:View<x>:Compression?
Arguments
Sample takes the acquired data points at regular intervals to obtain a waveform
display.
Max takes the maximum data point for a corresponding pixel.
Min takes the minimum data point for a corresponding pixel.
Examples
:View1:Compression Sample
takes the acquired data points at regular intervals to obtain a spectrogram display.
:View<x>:Format (?)
Selects or queries the waveform display format.
Syntax
:View<x>:Format { FreqAmpl | FreqPhase }
:View<x>:Format?
Arguments
Examples
2-142
Defines the parameters associated with the horizontal axis, vertical axis, and
colors as follows:
Argument
Horizontal axis
Vertical (Z) axis
Color
FreqAmpl
Frequency
Frame number
Amplitude
FreqPhase
Frequency
Frame number
Phase
:View1:Format FreqAmpl
shows frame-by-frame time-series spectrum along the vertical axis. In each
spectrum, the horizontal axis represents frequency and the color represents
amplitude.
3066 & 3086 3 GHz Real Time Spectrum Analyzer Programmer Manual
Spectrogram View Commands
:View<x>:Marker:DeltaMarker (?)
Turns the delta marker on or off.
Syntax
:View<x>:Marker:DeltaMarker { On | Off }
:View<x>:Marker:DeltaMarker?
Arguments
On turns the delta marker on.
Off turns the delta marker off
Examples
Related Commands
:View1:Marker:DeltaMarker On
turns the delta marker on.
:View<x>:Marker:DeltaX, :View<x>:Marker:DeltaY?,
:View<x>:Marker:DeltaZ, :View<x>:Marker:ResetDelta
:View<x>:Marker:DeltaT? (Query Only)
Queries the delta-marker position on the Z (frame number) axis as the time.
Syntax
Returns
Examples
Related Commands
:View<x>:Marker:DeltaT?
<NR3>
:View1:Marker:DeltaT?
might return 0.0096, indicating that the delta marker is positioned at 0.0096 s.
:View<x>:Marker:DeltaMarker?, :View<x>:Marker:DeltaZ
3066 & 3086 3 GHz Real Time Spectrum Analyzer Programmer Manual
2-143
Spectrogram View Commands
:View<x>:Marker:DeltaX (?)
Sets or queries the horizontal position of the delta marker.
Syntax
:View<x>:Marker:DeltaX <value>
:View<x>:Marker:DeltaX?
Arguments
Examples
Related Commands
<value>::=<NR3> ranges from the minimum (left) edge to the maximum (right)
edge of the horizontal (frequency) axis.
:View1:Marker:DeltaX 1.2G
positions the delta marker at 1.2 GHz.
:View<x>:Marker:DeltaY?, :View<x>:Marker:DeltaZ,
:View<x>:Marker:ResetDelta
:View<x>:Marker:DeltaY? (Query Only)
Queries the delta-marker position on the Y (color) axis.
Syntax
Returns
Examples
Related Commands
:View<x>:Marker:DeltaY?
<NR3>
:View1:Marker:DeltaY?
might return –12.3, indicating that the delta marker is positioned at –12.3 dBm.
:View<x>:Marker:DeltaX, :View<x>:Marker:DeltaZ,
:View<x>:Marker:ResetDelta
:View<x>:Marker:DeltaZ (?)
Sets or queries the delta-marker position on the Z (frame number) axis.
Syntax
:View<x>:Marker:DeltaZ <value>
:View<x>:Marker:DeltaZ?
2-144
3066 & 3086 3 GHz Real Time Spectrum Analyzer Programmer Manual
Spectrogram View Commands
Arguments
Examples
Related Commands
<value>::=<NR1> ranges 0 to the number of frames – 1.
:View1:Marker:DeltaZ 199
positions the delta marker at 199 of the frame number.
:View<x>:Marker:DeltaX, :View<x>:Marker:DeltaY?,
:View<x>:Marker:ResetDelta
:View<x>:Marker:Peak (No Query Form)
Moves the marker to the adjacent peak in the specified direction. Note that the
adjacent peak is farther than the distance specified with the :View<x>:Marker
:SearchSeparation command.
Syntax
Arguments
:View<x>:Marker:Peak { 1 | -1 }
1 moves the marker to the adjacent peak on the left of the marker.
-1 moves the marker to the adjacent peak on the right of the marker.
Examples
Related Commands
:View1:Marker:Peak -1
moves the marker to the adjacent peak on the right of the marker.
:View<x>:Marker:SearchMax, :View<x>:Marker:SearchMin,
:View<x>:Marker:SearchSeparation
:View<x>:Marker:ResetDelta (No Query Form)
Moves the delta marker to the main marker position.
Syntax
Arguments
Examples
Related Commands
:View<x>:Marker:ResetDelta
None
:View1:Marker:ResetDelta
:View<x>:Marker:DeltaMarker
3066 & 3086 3 GHz Real Time Spectrum Analyzer Programmer Manual
2-145
Spectrogram View Commands
:View<x>:Marker:SearchMax (No Query Form)
Positions the marker on the highest signal on screen.
Syntax
Arguments
Examples
Related Commands
:View<x>:Marker:SearchMax
None
:View1:Marker:SearchMax
positions the marker on the highest signal on screen.
:View<x>:Marker:SearchMin
:View<x>:Marker:SearchMin (No Query Form)
Positions the marker on the lowest signal on screen.
Syntax
Arguments
Examples
Related Commands
:View<x>:Marker:SearchMin
None
:View1:Marker:SearchMin
positions the marker on the lowest signal on screen.
:View<x>:Marker:SearchMax
:View<x>:Marker:SearchSeparation (?)
Sets or queries the minimum horizontal distance to separate two peaks.
Syntax
Arguments
2-146
:View<x>:Marker:SearchSeparation <value>
<value>::=<NR2> specifies the minimum horizontal distance to separate two
peaks. The range is 1 to 10 % relative to full-scale.
3066 & 3086 3 GHz Real Time Spectrum Analyzer Programmer Manual
Spectrogram View Commands
Examples
Related Commands
:View1:Marker:SearchSeparation 10
sets the minimum horizontal distance for peak separation to 10 % relative to
full-scale.
:View<x>:Scale:XScale
:View<x>:Marker:T? (Query Only)
Queries the marker position on the Z (frame number) axis as the time.
Syntax
Returns
Examples
Related Commands
:View<x>:Marker:T?
<NR3>
:View1:Marker:T?
might return 0.005827, indicating that the delta marker is positioned at 5.827 ms.
:View<x>:Marker:Z
:View<x>:Marker:X (?)
Sets or queries the horizontal position of the marker.
Syntax
:View<x>:Marker:X <value>
:View<x>:Marker:X?
Arguments
Examples
Related Commands
<value>::=<NR3> ranges from the minimum (left) edge to the maximum (right)
edge of the the horizontal (frequency) axis.
:View1:Marker:X 1.2G
positions the marker at 1.2 GHz.
:View<x>:Marker:Y?, :View<x>:Marker:Z
3066 & 3086 3 GHz Real Time Spectrum Analyzer Programmer Manual
2-147
Spectrogram View Commands
:View<x>:Marker:Y? (Query Only)
Queries the marker position on the Y (color) axis.
Syntax
Returns
Examples
Related Commands
:View<x>:Marker:Y?
<NR3>
:View1:Marker:Y?
might return –12.3, indicating that the marker is positioned at –12.3 dBm when
the Y axis represents amplitude.
:View<x>:Marker:X, :View<x>:Marker:Z
:View<x>:Marker:Z (?)
Sets or queries the marker position on the vertical (frame number) axis.
Syntax
:View<x>:Marker:Z <value>
:View<x>:Marker:Z?
Arguments
Examples
Related Commands
<value>::=<NR1> ranges 0 to the number of frames – 1.
:View1:Marker:Z 199
positions the marker at 199 of the frame number.
:View<x>:Marker:X, :View<x>:Marker:Y?
:View<x>:Monochrome (?)
Determines whether to display spectrogram in monochrome.
Syntax
:View<x>:Monochrome { On | Off }
:View<x>:Monochrome?
2-148
3066 & 3086 3 GHz Real Time Spectrum Analyzer Programmer Manual
Spectrogram View Commands
Arguments
On displays spectrogram in monochrome.
Off displays spectrogram in color.
Examples
:View1:Monochrome On
displays spectrogram in monochrome.
:View<x>:NumberColors (?)
Selects or queries the number of display colors.
Syntax
:View<x>:NumberColors { 10 | 100 }
:View<x>:NumberColors?
Arguments
10 selects 10-color display (same as the system software version 1.6 or before).
100 selects 100-color display (default).
Examples
Related Commands
:View1:NumberColors 100
selects 100 color display.
:View<x>:Scale:YScale, :View<x>:Scale:YStart
:View<x>:Scale:AutoScale (No Query Form)
Adjusts the scaling of the Y (color) axis automatically to best display the data. In
the Spectrogram view, this command displays data in full-scale.
Syntax
Arguments
Examples
Related Commands
:View<x>:Scale:AutoScale
None
:View1:Scale:AutoScale
adjusts the scaling of the Y axis automatically.
:View<x>:Scale:YScale
3066 & 3086 3 GHz Real Time Spectrum Analyzer Programmer Manual
2-149
Spectrogram View Commands
:View<x>:Scale:HoldYScale (?)
Determines whether to hold or reset the Y (color) axis scale when you change the
input source.
Syntax
:View<x>:Scale:HoldYScale { On | Off }
:View<x>:Scale:HoldYScale?
Arguments
On holds the Y axis scale setting when you change the input source.
Off resets the Y axis scale to full-scale.
Examples
Related Commands
:View1:Scale:HoldYScale On
holds the vertical scale setting when you change the input source.
:View<x>:Scale:YScale, :View<x>:Scale:YStart, :View<x>:Source
:View<x>:Scale:XScale (?)
Sets or queries the horizontal (frequency) axis full-scale to display a portion of
the data.
Syntax
:View<x>:Scale:XScale <value>
:View<x>:Scale:XScale?
Arguments
Examples
Related Commands
2-150
<value>::=<NR3> ranges full-scale/256 to full-scale of the acquired data.
:View1:Scale:XScale 2.5M
sets the horizontal axis full-scale to 2.5 MHz.
:View<x>:Scale:XStart, :View<x>:Scale:YScale
3066 & 3086 3 GHz Real Time Spectrum Analyzer Programmer Manual
Spectrogram View Commands
:View<x>:Scale:XStart (?)
Sets or queries the value represented by the minimum (left) edge of the
horizontal (frequency) axis.
Syntax
:View<x>:Scale:XStart <value>
:View<x>:Scale:XStart?
Arguments
Examples
Related Commands
<value>::=<NR3> ranges from the minimum to the maximum value on the
horizontal axis of the acquired data.
:View1:Scale:XStart 543.2M
sets the value represented by the left edge of the horizontal axis to 543.2 MHz.
:View<x>:Scale:XScale
:View<x>:Scale:YScale (?)
Sets or queries the Y (color) axis full-scale to display a portion of the data.
Syntax
:View<x>:Scale:YScale <value>
:View<x>:Scale:YScale?
Arguments
<value>::=<NR3> ranges full-scale/100 to full-scale of the acquired data.
Examples
:View1:Scale:YScale 2
sets the Y axis full-scale to 2 dB when the axis represents the amplitude.
Related Commands
:View<x>:Scale:XScale
3066 & 3086 3 GHz Real Time Spectrum Analyzer Programmer Manual
2-151
Spectrogram View Commands
:View<x>:Scale:YStart (?)
Sets or queries the value represented by the minimum (bottom) edge of the Y
(color) axis.
Syntax
:View<x>:Scale:YStart <value>
:View<x>:Scale:YStart?
Arguments
Examples
Related Commands
<value>::=<NR3> ranges from the minimum to the maximum value on the Y
axis of the acquired data.
:View1:Scale:YStart -12.5
sets the value represented by the bottom edge of the Y axis to –12.5 dBm.
:View<x>:Scale:YScale
:View<x>:Scale:ZScale (?)
Sets or queries the frame display interval. The spectrogram is displayed every
specified number of frames.
Syntax
:View<x>:Scale:ZScale <value>
:View<x>:Scale:ZScale?
Arguments
Examples
Related Commands
2-152
<value>::=<NR1> ranges 1 to 32.
1 means every frame is displayed. 32 means every 32th frame is displayed.
:View1:Scale:ZScale 8
displays the spectrogram every 8th frame.
:View<x>:Scale:ZStart
3066 & 3086 3 GHz Real Time Spectrum Analyzer Programmer Manual
Spectrogram View Commands
:View<x>:Scale:ZStart (?)
Sets or queries the value represented by the minimum (bottom) edge of the Z
(frame number) axis, i.e. the first frame to be displayed.
Syntax
:View<x>:Scale:ZStart <value>
:View<x>:Scale:ZStart?
Arguments
Examples
Related Commands
<value>::=<NR1> ranges from 0 to the number of frames – 1.
:View1:Scale:ZStart 20
sets the value represented by the bottom edge of the Z axis to 20.
:View<x>:Scale:ZScale
:View<x>:Source (?)
Selects or queries the display data source for the specified view.
Syntax
:View<x>:Source { None | Active | Zoom | D1 | D2 | D3 | D4 | D5 |
D6 | D7 | D8 | <file_name> }
:View<x>:Source?
Arguments
None specifies no source. The display area in the view will be emptied.
Active specifies the currently acquired data as the source.
Zoom specifies the zoomed data as the source.
D1 to D8 specify the register D1 to D8 as the source, respectively.
<file_name>::=<string> specifies the data file as the source. The file name
must be “*.IQ” (the IQ format) or “*.AP” (the AP format).
Examples
Related Commands
:View1:Source Active
specifies the currently acquired data as the view source.
:Config:Mode
3066 & 3086 3 GHz Real Time Spectrum Analyzer Programmer Manual
2-153
Spectrogram View Commands
:View<x>:Version? (Query Only)
Queries the version of the Spectrogram View program.
Syntax
Returns
Examples
:View<x>:Version?
<NR2>
:View1:Version?
might return 1.1.
:View<x>:ZGap (?)
Sets or queries the display interval between two adjacent frames on the Z (frame
number) axis.
Syntax
:View<x>:ZGap <value>
:View<x>:ZGap?
Arguments
Examples
2-154
<value>::=<NR1> ranges 1 to 10 pixels.
:View1:ZGap 10
sets the display interval between two adjacent frames on the Z axis to 10 pixels.
3066 & 3086 3 GHz Real Time Spectrum Analyzer Programmer Manual
Waterfall View Commands
When you select Waterfall in the :Config:View<x> command, use the
commands in this section to control the Waterfall view.
3066 & 3086 3 GHz Real Time Spectrum Analyzer Programmer Manual
2-155
Waterfall View Commands
:View<x>:Compression (?)
Selects or queries the display data compression method. It specifies how to take
or discard each acquired data point for a corresponding pixel on the screen
because the number of horizontal pixels is usually less than that of data points.
Syntax
:View<x>:Compression { Sample | MinMax | Max | Min }
:View<x>:Compression?
Arguments
Sample takes the acquired data points at regular intervals to obtain a waveform
display.
MinMax takes the minimum and the maximum data points for a corresponding
pixel. The minimum and the maximum data points are displayed with a vertical
bar on the screen.
Max takes the maxmum data point for a corresponding pixel.
Min takes the minimum data point for a corresponding pixel.
Examples
2-156
:View1:Compression Sample
takes the acquired data points at regular intervals to obtain a waveform display.
3066 & 3086 3 GHz Real Time Spectrum Analyzer Programmer Manual
Waterfall View Commands
:View<x>:Format (?)
Selects or queries the waveform display format.
Syntax
:View<x>:Format { FreqAmpl | FreqPhase | FreqI | FreqQ | TimeAmpl
| TimePhase | TimeI | TimeQ }
:View<x>:Format?
Arguments
Examples
Defines the parameters associated with the horizontal and vertical axes as
follows:
Argument
Horizontal axis
Vertical axis
FreqAmpl
Frequency (span)
Amplitude
FreqPhase
Frequency (span)
Phase
FreqI
Frequency (span)
I (In-Phase)
FreqQ
Frequency (span)
Q (QuadratureĆPhase)
TimeAmpl
Time
Amplitude
TimePhase
Time
Phase
TimeI
Time
I (In-Phase)
TimeQ
Time
Q (QuadratureĆphase)
:View1:Format FreqAmpl
shows the waveform, with the frequency along the horizontal axis, and the
amplitude along the vertical axis.
3066 & 3086 3 GHz Real Time Spectrum Analyzer Programmer Manual
2-157
Waterfall View Commands
:View<x>:Marker:DeltaMarker (?)
Turns the delta marker on or off.
Syntax
:View<x>:Marker:DeltaMarker { On | Off }
:View<x>:Marker:DeltaMarker?
Arguments
On turns the delta marker on.
Off turns the delta marker off
Examples
Related Commands
:View1:Marker:DeltaMarker On
turns the delta marker on.
:View<x>:Marker:DeltaX, :View<x>:Marker:DeltaY?,
:View<x>:Marker:DeltaZ, :View<x>:Marker:ResetDelta
:View<x>:Marker:DeltaT? (Query Only)
Queries the delta marker position on the Z (frame number) axis as the time.
Syntax
Returns
Examples
Related Commands
2-158
:View<x>:Marker:DeltaT?
<NR3>
:View1:Marker:DeltaT?
might return 0.0096, indicating that the delta marker is positioned at 0.0096 s.
:View<x>:Marker:DeltaMarker, :View<x>:Marker:DeltaZ
3066 & 3086 3 GHz Real Time Spectrum Analyzer Programmer Manual
Waterfall View Commands
:View<x>:Marker:DeltaX (?)
Sets or queries the horizontal position of the delta marker.
Syntax
:View<x>:Marker:DeltaX <value>
:View<x>:Marker:DeltaX?
Arguments
Examples
Related Commands
<value>::=<NR3> ranges from the minimum (left) edge to the maximum (right)
edge of the the horizontal axis.
:View1:Marker:DeltaX 1.2G
positions the delta marker at 1.2 GHz.
:View<x>:Marker:DeltaY?, :View<x>:Marker:DeltaZ,
:View<x>:Marker:ResetDelta
:View<x>:Marker:DeltaY? (Query Only)
Queries the delta-marker position on the vertical axis.
Syntax
Returns
Examples
Related Commands
:View<x>:Marker:DeltaY?
<NR3>
:View1:Marker:DeltaY?
might return –12.3, indicating that the delta marker is positioned at –12.3 dBm.
:View<x>:Marker:DeltaX, :View<x>:Marker:DeltaZ,
:View<x>:Marker:ResetDelta
3066 & 3086 3 GHz Real Time Spectrum Analyzer Programmer Manual
2-159
Waterfall View Commands
:View<x>:Marker:DeltaZ (?)
Sets or queries the delta-marker position on the Z (frame number) axis.
Syntax
:View<x>:Marker:DeltaZ <value>
:View<x>:Marker:DeltaZ?
Arguments
Examples
Related Commands
<value>::=<NR1> ranges 0 to the number of frames – 1.
:View1:Marker:DeltaZ 199
positions the delta marker at 199 of the frame number.
:View<x>:Marker:DeltaX, :View<x>:Marker:DeltaY?,
:View<x>:Marker:ResetDelta
:View<x>:Marker:Peak (No Query Form)
Moves the marker to the adjacent peak in the specified direction. Note that the
adjacent peak is farther than the distance specified with the :View<x>:Marker
:SearchSeparation command.
Syntax
Arguments
:View<x>:Marker:Peak { 1 | -1 }
1 moves the marker to the adjacent peak on the left of the marker.
-1 moves the marker to the adjacent peak on the right of the marker.
Examples
Related Commands
2-160
:View1:Marker:Peak -1
moves the marker to the adjacent peak on the right of the marker.
:View<x>:Marker:SearchMax, :View<x>:Marker:SearchMin,
:View<x>:Marker:SearchSeparation
3066 & 3086 3 GHz Real Time Spectrum Analyzer Programmer Manual
Waterfall View Commands
:View<x>:Marker:ResetDelta (No Query Form)
Moves the delta marker to the main marker position.
Syntax
Arguments
Examples
Related Commands
:View<x>:Marker:ResetDelta
None
:View1:Marker:ResetDelta
moves the delta marker to the main marker position.
:View<x>:Marker:DeltaMarker
:View<x>:Marker:SearchMax (No Query Form)
Positions the marker on the highest signal on screen.
Syntax
Arguments
Examples
Related Commands
:View<x>:Marker:SearchMax
None
:View1:Marker:SearchMax
positions the marker on the highest signal on screen.
:View<x>:Marker:SearchMin
3066 & 3086 3 GHz Real Time Spectrum Analyzer Programmer Manual
2-161
Waterfall View Commands
:View<x>:Marker:SearchMin (No Query Form)
Positions the marker on the lowest signal on screen.
Syntax
Arguments
Examples
Related Commands
:View<x>:Marker:SearchMin
None
:View1:Marker:SearchMin
positions the marker on the lowest signal on screen.
:View<x>:Marker:SearchMax
:View<x>:Marker:SearchSeparation (?)
Sets or queries the minimum horizontal distance to separate two peaks.
Syntax
Arguments
<value>::=<NR2> specifies the minimum horizontal distance to separate two
peaks. The range is 1 to 10 % relative to full-scale.
Examples
:View1:Marker:SearchSeparation 10
sets the minimum horizontal distance for peak separation to 10 % relative to
full-scale.
Related Commands
2-162
:View<x>:Marker:SearchSeparation <value>
:View<x>:Scale:XScale
3066 & 3086 3 GHz Real Time Spectrum Analyzer Programmer Manual
Waterfall View Commands
:View<x>:Marker:T? (Query Only)
Queries the marker position on the Z (frame number) axis as the time.
Syntax
Returns
Examples
Related Commands
:View<x>:Marker:T?
<NR3>
:View1:Marker:T?
might return 0.0096, indicating that the marker is at 0.0096 s.
:View<x>:Marker:Z
:View<x>:Marker:X (?)
Sets or queries the horizontal position of the marker.
Syntax
:View<x>:Marker:X <value>
:View<x>:Marker:X?
Arguments
Examples
Related Commands
<value>::=<NR3> ranges from the minimum (left) edge to the maximum (right)
edge of the the horizontal axis.
:View1:Marker:X 1.2G
positions the marker at 1.2 GHz.
:View<x>:Marker:Y?, :View<x>:Marker:Z
3066 & 3086 3 GHz Real Time Spectrum Analyzer Programmer Manual
2-163
Waterfall View Commands
:View<x>:Marker:Y? (Query Only)
Queries the marker position on the vertical axis.
Syntax
Returns
Examples
Related Commands
:View<x>:Marker:Y?
<NR3>
:View1:Marker:Y?
might return –12.3, indicating that the marker is positioned at –12.3 dBm.
:View<x>:Marker:X, :View<x>:Marker:Z
:View<x>:Marker:Z (?)
Sets or queries the marker position on the Z (frame number) axis.
Syntax
:View<x>:Marker:Z <value>
:View<x>:Marker:Z?
Arguments
Examples
Related Commands
2-164
<value>::=<NR1> ranges 0 to the number of frames – 1.
:View1:Marker:Z 199
positions the marker at 199 of the frame number.
:View<x>:Marker:X, :View<x>:Marker:Y?
3066 & 3086 3 GHz Real Time Spectrum Analyzer Programmer Manual
Waterfall View Commands
:View<x>:Scale:AutoScale (No Query Form)
Adjusts the scaling of the vertical axis automatically to best display the data.
When the parameter is level or phase, this command sets the vertical axis to
full-scale.
Syntax
Arguments
Examples
Related Commands
:View<x>:Scale:AutoScale
None
:View1:Scale:AutoScale
adjusts the scaling of the vertical axis automatically.
:View<x>:Scale:XScale, :View<x>:Scale:YScale
:View<x>:Scale:HoldYScale (?)
Determines whether to hold or reset the vertical scale when you change the input
source.
Syntax
:View<x>:Scale:HoldYScale { On | Off }
:View<x>:Scale:HoldYScale?
Arguments
On holds the vertical scale setting when you change the input source.
Off resets the vertical scale to full-scale.
Examples
Related Commands
:View1:Scale:HoldYScale On
holds the vertical scale setting when you change the input source.
:View<x>:Scale:YScale, :View<x>:Scale:YStart, :View<x>:Source
3066 & 3086 3 GHz Real Time Spectrum Analyzer Programmer Manual
2-165
Waterfall View Commands
:View<x>:Scale:XScale (?)
Sets or queries the horizontal axis full-scale to display a portion of the data.
Syntax
:View<x>:Scale:XScale <value>
:View<x>:Scale:XScale?
Arguments
Examples
Related Commands
<value>::=<NR3> ranges full-scale/256 to full-scale of the acquired data.
:View1:Scale:XScale 2.5M
sets the horizontal axis full-scale to 2.5 MHz.
:View<x>:Scale:XStart, :View<x>:Scale:YScale
:View<x>:Scale:XStart (?)
Sets or queries the value represented by the minimum (left) edge of the
horizontal axis.
Syntax
:View<x>:Scale:XStart <value>
:View<x>:Scale:XStart?
Arguments
Examples
Related Commands
2-166
<value>::=<NR3> ranges from the minimum to the maximum value on the
horizontal axis of the acquired data.
:View1:Scale:XStart 543.2M
sets the value represented by the left edge of the horizontal axis to 543.2 MHz.
:View<x>:Scale:XScale
3066 & 3086 3 GHz Real Time Spectrum Analyzer Programmer Manual
Waterfall View Commands
:View<x>:Scale:YScale (?)
Sets or queries the vertical axis full-scale to display a portion of the data.
Syntax
:View<x>:Scale:YScale <value>
:View<x>:Scale:YScale?
Arguments
Examples
Related Commands
<value>::=<NR3> ranges full-scale/100 to full-scale of the acquired data.
:View1:Scale:YScale 2
sets the vertical axis full-scale to 2 dB.
:View<x>:Scale:XScale, :View<x>:Scale:YStart
:View<x>:Scale:YStart (?)
Sets or queries the value represented by the minimum (bottom) edge of the
vertical axis.
Syntax
:View<x>:Scale:YStart <value>
:View<x>:Scale:YStart?
Arguments
Examples
Related Commands
<value>::=<NR3> ranges from the minimum to the maximum value on the
vertical axis of the acquired data.
:View1:Scale:YStart -12.5
sets the value represented by the bottom edge of the vertical axis to –12.5 dBm.
:View<x>:Scale:YScale
3066 & 3086 3 GHz Real Time Spectrum Analyzer Programmer Manual
2-167
Waterfall View Commands
:View<x>:Scale:ZScale (?)
Sets or queries the frame display interval. The waveform is displayed every
specified number of frames.
Syntax
:View<x>:Scale:ZScale <value>
:View<x>:Scale:ZScale?
Arguments
Examples
Related Commands
<value>::=<NR1> ranges 1 to 32.
1 means every frame is displayed. 32 means every 32th frame is displayed.
:View1:Scale:ZScale 8
displays the waveform every 8th frame.
:View<x>:Scale:ZStart
:View<x>:Scale:ZStart (?)
Specifies or queries the first frame to be displayed.
Syntax
:View<x>:Scale:ZStart <value>
:View<x>:Scale:ZStart?
Arguments
Examples
Related Commands
2-168
<value>::=<NR1> ranges 0 to the number of frames – 1.
:View1:Scale:ZStart 20
displays the waveform starting from the frame number 20.
:View<x>:Scale:ZScale
3066 & 3086 3 GHz Real Time Spectrum Analyzer Programmer Manual
Waterfall View Commands
:View<x>:Source (?)
Selects or queries the display data source for the specified view.
Syntax
:View<x>:Source { None | Active | Zoom | D1 | D2 | D3 | D4 | D5 |
D6 | D7 | D8 | <file_name> }
:View<x>:Source?
Arguments
None specifies no source. The display area in the view will be emptied.
Active specifies the currently acquired data as the source.
Zoom specifies the zoomed data as the source.
D1 to D8 specify the data register D1 to D7 as the source, respectively.
<file_name>::=<string> specifies the data file as the source. The file name
must be “*.IQ” (the IQ format) or “*.AP” (the AP format).
Examples
Related Commands
:View1:Source Active
specifies the currently acquired data as the view source.
:Config:Mode
:View<x>:Version? (Query Only)
Queries the version of the Waterfall View program.
Syntax
Returns
Examples
:View<x>:Version?
<NR2>
:View1:Version?
might return 1.1.
3066 & 3086 3 GHz Real Time Spectrum Analyzer Programmer Manual
2-169
Waterfall View Commands
:View<x>:YHeight (?)
Sets or queries the full-scale of the vertical axis in pixels.
Syntax
:View<x>:YHeight <value>
:View<x>:YHeight?
Arguments
Examples
Related Commands
<value>::=<NR1> ranges 1 to 100 pixels.
:View1:YHeight 100
sets the full-scale of the vertical axis to 100 pixels.
:View<x>:ZGap
:View<x>:ZGap (?)
Sets or queries the frame interval for the Waterfall display.
Syntax
:View<x>:ZGap <value>
:View<x>:ZGap?
Arguments
Examples
Related Commands
2-170
<value>::=<NR1> ranges 1 to 100 pixels.
:View1:ZGap 100
sets the frame interval to 100 pixels.
:View<x>:YHeight
3066 & 3086 3 GHz Real Time Spectrum Analyzer Programmer Manual
Polar View Commands
When you select Polar in the :Config:View<x> command, use the commands
in this section to control the Polar view.
For information on the Polar view, refer to the User Manual.
3066 & 3086 3 GHz Real Time Spectrum Analyzer Programmer Manual
2-171
Polar View Commands
:View<x>:AlphaBT (?)
Sets or queries the a/BT value.
Syntax
:View<x>:AlphaBT <value>
:View<x>:AlphaBT?
Arguments
Examples
<value>::=<NR2> ranges 0.0001 to 1.
:View1:AlphaBT 1
sets the a/BT value to 1.
:View<x>:AutoCarrier (?)
Determines whether to search the carrier automatically for each frame.
Syntax
:View<x>:AutoCarrier { On | Off }
:View<x>:AutoCarrier?
Arguments
On searches the carrier automatically for each frame, and displays the frequency
error in reference to the center frequency on screen at Freq Error.
Off sets the carrier frequency to the value set with the :View<x>:Carrier
command.
Examples
Related Commands
2-172
:View1:AutoCarrier On
searches the carrier automatically and displays the frequency error.
:View<x>:Carrier
3066 & 3086 3 GHz Real Time Spectrum Analyzer Programmer Manual
Polar View Commands
:View<x>:Burst:BlockSize (?)
Sets or queries the range for searching a burst signal in frames. The start frame is
set with the :View<x>:Z command. If the number of frames after the start frame
does not reach the specified number, the frames before the start frame are also
used. See Figure 2–4.
Syntax
:View<x>:Burst:BlockSize <value>
:View<x>:Burst:BlockSize?
Arguments
Examples
Related Commands
<value>::=<NR1> ranges 1 to 20 frames.
:View1:Burst:BlockSize 4
sets the range for the burst search to 4 frames.
:View<x>:Burst:NumberFrames, :View<x>:Burst:Offset,
:View<x>:Burst:Search, :View<x>:Burst:Threshold, :View<x>:Z
:View<x>:Burst:NumberFrames (?)
Sets or queries the range for acquiring burst data. See Figure 2–4.
Syntax
:View<x>:Burst:NumberFrames <value>
:View<x>:Burst:NumberFrames?
Arguments
Examples
Related Commands
<value>::=<NR1> is 1 or 2 frames.
:View1:Burst:NumberFrames 2
sets the range for burst data acquisition to 2 frames.
:View<x>:Burst:BlockSize, :View<x>:Burst:Offset,
:View<x>:Burst:Search, :View<x>:Burst:Threshold, :View<x>:Z
3066 & 3086 3 GHz Real Time Spectrum Analyzer Programmer Manual
2-173
Polar View Commands
:View<x>:Burst:BlockSize
:View<x>:Burst:NumberFrames
(Data to be analyzed)
:View<x>:Burst:Threshold
Burst
:View<x>:Burst:Offset
Figure 2-4: Settings for burst analysis
:View<x>:Burst:Offset (?)
Sets or queries the start point for acquiring burst data relative to the rising edge
of the burst signal. See Figure 2–4.
Syntax
:View<x>:Burst:Offset <value>
:View<x>:Burst:Offset?
Arguments
<value>::=<NR1> ranges –1024 to +1024 points. The minus values represent
the data points before the rising edge.
Examples
:View1:Burst:Offset -10
specifies that the analyzer acquires burst data from 10 points before the rising
edge.
Related Commands
2-174
:View<x>:Burst:BlockSize, :View<x>:Burst:NumberFrames,
:View<x>:Burst:Search, :View<x>:Burst:Threshold, :View<x>:Z
3066 & 3086 3 GHz Real Time Spectrum Analyzer Programmer Manual
Polar View Commands
:View<x>:Burst:Search (?)
Determines whether to search a burst signal.
Syntax
:View<x>:Burst:Search { On | Off }
:View<x>:Burst:Search?
Arguments
On searches a burst for analyzing.
Off analyzes the frame specified with the :View<x>:Z command.
Examples
Related Commands
:View1:Burst:Search On
searches a burst for analyzing.
:View<x>:Burst:BlockSize, :View<x>:Burst:NumberFrames,
:View<x>:Burst:Offset, :View<x>:Burst:Threshold, :View<x>:Z
:View<x>:Burst:Threshold (?)
Sets or queries the threshold for determining the rising edge of a burst signal.
See Figure 2–4.
Syntax
:View<x>:Burst:Threshold <value>
:View<x>:Burst:Threshold?
Arguments
Examples
Related Commands
<value>::=<NR1> ranges –100 to +10 dB. The value is the relative level from
the maximum within the burst search range.
:View1:Burst:Threshold -20
sets the threshold for determining the rising edge of a burst signal to –20 dB.
:View<x>:Burst:BlockSize, :View<x>:Burst:NumberFrames,
:View<x>:Burst:Offset, :View<x>:Burst:Search, :View<x>:Z
3066 & 3086 3 GHz Real Time Spectrum Analyzer Programmer Manual
2-175
Polar View Commands
:View<x>:Carrier (?)
Sets or queries the carrier frequency.
Syntax
:View<x>:Carrier <value>
:View<x>:Carrier?
Arguments
Examples
Related Commands
<value>::=<NR3> ranges 0 Hz to 3 GHz.
:View1:Carrier 1.2G
sets the carrier frequency to 1.2 GHz.
:View<x>:AutoCarrier
:View<x>:Display (?)
Selects or queries the display data source.
Syntax
:View<x>:Display { Measurement | Reference }
:View<x>:Display?
Arguments
Measurement displays the measurement data.
Reference displays the reference data.
Examples
Related Commands
2-176
:View1:Display Measurement
displays the measurement data.
:View<x>:MeasDestination, :View<x>:RefDestination
3066 & 3086 3 GHz Real Time Spectrum Analyzer Programmer Manual
Polar View Commands
:View<x>:Format (?)
Selects or queries the waveform display format.
Syntax
:View<x>:Format { Vector | Constellation }
:View<x>:Format?
Arguments
Vector specifies the Vector format. It displays symbol-to-symbol movements
using vector.
Constellation specifies the Constellation format. It displays only symbols.
Examples
:View1:Format Vector
selects the Vector display format.
:View<x>:Marker:A? (Query Only)
Queries the amplitude at the marker position.
Syntax
Returns
Examples
Related Commands
:View<x>:Marker:A?
<NR3>
:View1:Marker:A?
might return 0.789.
:View<x>:Marker:P?
3066 & 3086 3 GHz Real Time Spectrum Analyzer Programmer Manual
2-177
Polar View Commands
:View<x>:Marker:DeltaT (?)
Sets or queries the delta-marker position on the time axis.
Syntax
:View<x>:Marker:DeltaT <value>
:View<x>:Marker:DeltaT?
Arguments
Examples
Related Commands
<value>::=<NR3> ranges the minimum to the maximum value on the time axis.
:View1:Marker:DeltaT 5.4u
positions the delta marker at 5.4 ms.
:View<x>:Marker:T
:View<x>:Marker:P? (Query Only)
Queries the phase at the marker position.
Syntax
Returns
Examples
Related Commands
:View<x>:Marker:P?
<NR3>
:View1:Marker:P?
might return 51.313, indicating that the marker is positioned at 51.313 degrees.
:View<x>:Marker:A?
:View<x>:Marker:T (?)
Sets or queries the marker position on the time axis.
Syntax
:View<x>:Marker:T <value>
:View<x>:Marker:T?
Arguments
2-178
<value>::=<NR3> ranges the minimum to the maximum value on the time axis.
3066 & 3086 3 GHz Real Time Spectrum Analyzer Programmer Manual
Polar View Commands
Examples
Related Commands
:View1:Marker:T 5.4u
positions the marker at 5.4 ms.
:View<x>:Marker:DeltaT?
:View<x>:Marker:X? (Query Only)
Queries the horizontal position of the marker.
Syntax
Returns
Examples
Related Commands
:View<x>:Marker:X?
<NR3>
1 represents the full-scale.
:View1:Marker:X?
might return 0.345.
:View<x>:Marker:Y?
:View<x>:Marker:Y? (Query Only)
Queries the vertical position of the marker.
Syntax
Returns
Examples
Related Commands
:View<x>:Marker:Y?
<NR3>
1 represents the full-scale.
:View1:Marker:Y?
might return 0.765.
:View<x>:Marker:X?
3066 & 3086 3 GHz Real Time Spectrum Analyzer Programmer Manual
2-179
Polar View Commands
:View<x>:MeasDestination (?)
Selects or queries the register pair to store the measurement data.
Syntax
:View<x>:MeasDestination { None | D1D2 | D3D4 | D5D6 | D7D8 }
:View<x>:MeasDestination?
Arguments
None specifies no destination.
D1D2 to D7D8 specify a register pair to store the measurement data.
Examples
Related Commands
:View1:MeasDestination D1D2
specifies the D1 and D2 register pair for storing data.
:View<x>:RefDestination
:View<x>:MeasFilter (?)
Selects or queries the filter to create the measurement data.
Syntax
:View<x>:MeasFilter { None | RootRaisedCosine }
:View<x>:MeasFilter?
Arguments
None selects no filter.
RootRaisedCosine selects the root raised-cosine filter.
Examples
Related Commands
2-180
:View1:MeasFilter RootRaisedCosine
selects the root raised-cosine filter to create the measurement data.
:View<x>:RefFilter
3066 & 3086 3 GHz Real Time Spectrum Analyzer Programmer Manual
Polar View Commands
:View<x>:Modulation (?)
Selects or queries the modulation type.
Syntax
:View<x>:Modulation { PI4QPSK | BPSK | QPSK | PSK8 | QAM16 |
QAM64 | GMSK }
:View<x>:Modulation?
Arguments
PI4QPSK selects 1/4 p Shift QPSK (Quadrature Phase Shift Keying) modulation.
BPSK selects BPSK (Binary Phase Shift Keying) modulation.
QPSK selects QPSK (Quadrature Phase Shift Keying) modulation.
PSK8 selects 8PSK (Phase Shift Keying) modulation.
QAM16 selects 16QAM (Quadrature Amplitude Modulation).
QAM64 selects 64QAM (Quadrature Amplitude Modulation).
GMSK selects GMSK (Gaussian-filtered Minimum Shift Keying) modulation.
Examples
:View1:Modulation PI4QPSK
selects the 1/4 p Shift QPSK modulation.
:View<x>:Position (?)
Specifies or queries which frame in a block to be displayed.
Syntax
:View<x>:Position <value>
:View<x>:Position?
Arguments
Examples
<value>::=<NR2> ranges 0 to 100 %. It specifies the display frame position
relative to the block size. 0 % specifies that the first frame in a block is
displayed. 100 % represents the last frame.
:View1:Position 100
displays the last frame in a block.
3066 & 3086 3 GHz Real Time Spectrum Analyzer Programmer Manual
2-181
Polar View Commands
:View<x>:RefDestination (?)
Selects or queries the register pair to store the reference data.
Syntax
:View<x>:RefDestination { None | D1D2 | D3D4 | D5D6 | D7D8 }
:View<x>:RefDestination?
Arguments
None specifies no destination.
D1D2 to D7D8 specify the register pair to store the reference data.
Examples
Related Commands
:View1:RefDestination D1D2
selects the D1 and D2 register pair to store the reference data.
:View<x>:MeasDestination
:View<x>:RefFilter (?)
Selects or queries the filter to create the reference data.
Syntax
:View<x>:RefFilter { None | RaisedCosine | Gaussian }
:View<x>:RefFilter?
Arguments
None selects no filter.
RaisedCosine selects the raised cosine filter.
Gaussian selects the Gaussian filter.
Examples
Related Commands
2-182
:View1:RefFilter RaisedCosine
selects the raised cosine filter to create the reference data.
:View<x>:MeasFilter
3066 & 3086 3 GHz Real Time Spectrum Analyzer Programmer Manual
Polar View Commands
:View<x>:Result<y>? (Query Only)
Queries the measurement result.
Syntax
Returns
:View<x>:Result<y>?
<NR3>
Result1 returns the carrier frequency error in reference to the center frequency.
Result2 returns the origin offset.
Result3 returns the full-scale in volts.
Examples
:View1:Result1?
might return 15.23, indicating that the carrier frequency error is 15.23 Hz.
:View<x>:Source (?)
Selects or queries the display data source for the specified view.
Syntax
:View<x>:Source { None | Active | Zoom | <file_name> }
:View<x>:Source?
Arguments
None specifies no source. The display area in the view will be emptied.
Active specifies the currently acquired data as the source.
Zoom specifies the zoomed data as the source.
<file_name>::=<string> specifies the data file as the source. The file name
must be “*.IQ” (the IQ format).
Examples
Related Commands
:View1:Source Active
specifies the currently acquired data as the source.
:Config:Mode
3066 & 3086 3 GHz Real Time Spectrum Analyzer Programmer Manual
2-183
Polar View Commands
:View<x>:Standard:CDPD (No Query Form)
Configures the modulating system according to the CDPD (Cellular Digital
Packet Data) standard.
Syntax
Arguments
Examples
:View<x>:Standard:CDPD
None
:View1:Standard:CDPD
configures the modulating system according to the CDPD standard.
:View<x>:Standard:GSM (No Query Form)
Configures the modulating system according to the GMS (Global System for
Mobile Communication) standard.
Syntax
Arguments
Examples
:View<x>:Standard:GSM
None
:View1:Standard:GSM
configures the modulating system according to the GMS standard.
:View<x>:Standard:NADC (No Query Form)
Configures the modulating system according to the NADC (North American
Digital Cellular) standard.
Syntax
Arguments
Examples
2-184
:View<x>:Standard:NADC
None
:View1:Standard:NADC
configures the modulating system according to the NADC standard.
3066 & 3086 3 GHz Real Time Spectrum Analyzer Programmer Manual
Polar View Commands
:View<x>:Standard:PDC (No Query Form)
Configures the modulating system according to the PDC (Personal Digital
Cellular System) standard.
Syntax
Arguments
Examples
:View<x>:Standard:PDC
None
:View1:Standard:PDC
configures the modulating system according to the PDC standard.
:View<x>:Standard:PHS (No Query Form)
Configures the modulating system according to the PHS (Personal Handy Phone
System) standard.
Syntax
Arguments
Examples
:View<x>:Standard:PHS
None
:View1:Standard:PHS
configures the modulating system according to the PHS standard.
:View<x>:Standard:TETRA (No Query Form)
Configures the modulating system according to the TETRA (Trans-European
Trunked Radio) standard.
Syntax
Arguments
Examples
:View<x>:Standard:TETRA
None
:View1:Standard:TETRA
configures the modulating system according to the TETRA standard.
3066 & 3086 3 GHz Real Time Spectrum Analyzer Programmer Manual
2-185
Polar View Commands
:View<x>:SymbolRate (?)
Sets or queries the symbol rate for the digital modulation.
Syntax
:View<x>:SymbolRate <value>
:View<x>:SymbolRate?
Arguments
Examples
<value>::=<NR3> ranges 1/s to 30 M/s.
:View1:SymbolRate 8M
sets the symbol rate to 8 M/s.
:View<x>:Version?
Queries the version of the Polar View program.
Syntax
Returns
Examples
:View<x>:Version?
<NR2>
:View1:Version?
might return 1.1.
:View<x>:Z (?)
Specifies or queries the displayed frame number.
Syntax
:View<x>:Z <value>
:View<x>:Z?
Arguments
Examples
2-186
<value>::=<NR1> ranges from 0 to the number of frames – 1.
:View1:Z 199
specifies that the frame 199 displays.
3066 & 3086 3 GHz Real Time Spectrum Analyzer Programmer Manual
Eye Diagram View Commands
When you select EyeDiagram in the :Config:View<x> command, use the
commands in this section to control the Eye Diagram view.
For information on the eye diagram, refer to the User Manual.
3066 & 3086 3 GHz Real Time Spectrum Analyzer Programmer Manual
2-187
Eye Diagram View Commands
:View<x>:EyeLength (?)
Sets or queries the number of symbols to be displayed, i.e. the horizontal scale.
Syntax
:View<x>:EyeLength <value>
:View<x>:EyeLength?
Arguments
<value>::=<NR1> ranges 1 to 16.
The default length is set to two symbols.
Examples
Related Commands
:View1:EyeLength 4
displays four symbols in the eye diagram.
:View<x>:Format
:View<x>:Format (?)
Selects or queries the parameter of the vertical axis. To specify the horizontal
axis, use the :View<x>:EyeLength command.
Syntax
:View<x>:Format { I | Q | Trellis }
:View<x>:Format?
Arguments
I displays the eye diagram with the I data along the vertical axis.
Q displays the eye diagram with the Q data along the vertical axis.
Trellis displays the eye diagram with the phase along the vertical axis.
Examples
Related Commands
2-188
:View1:Format I
displays the eye diagram with the I data along the vertical axis.
:View<x>:EyeLength
3066 & 3086 3 GHz Real Time Spectrum Analyzer Programmer Manual
Eye Diagram View Commands
:View<x>:Marker:T (?)
Sets or queries the marker position on the time axis.
Syntax
:View<x>:Marker:T <value>
:View<x>:Marker:T?
Arguments
Examples
Related Commands
<value>::=<NR3> ranges the minimum to the maximum value on the time axis.
:View1:Marker:T 5.5u
positions the marker at 5.5 ms.
:View<x>:Marker:Y?
:View<x>:Marker:Y? (Query Only)
Queries the vertical position of the marker.
Syntax
Returns
Examples
Related Commands
:View<x>:Marker:Y?
<NR3>
:View1:Marker:Y?
might return 0.000005, indicating that the marker is positioned at 5 ms.
:View<x>:Marker:T
3066 & 3086 3 GHz Real Time Spectrum Analyzer Programmer Manual
2-189
Eye Diagram View Commands
:View<x>:Source (?)
Selects or queries the data source for the eye diagram.
Syntax
:View<x>:Source { Measurement | Reference }
:View<x>:Source?
Arguments
Measurement selects the measurement data as the view source. The data is stored
in the register pair specified with the :View<x>:MeasDestination in the Polar
View or the CDMA Polar View command group.
Reference selects the reference data as the data source. The data is stored in the
register pair specified with the :View<x>:RefDestination in the Polar View or
the CDMA Polar View command group.
Examples
Related Commands
:View1:Source Measurement
selects the measurement data as the view source.
:View<x>:MeasDestination and :View<x>:RefDestination
in the Polar View or the CDMA Polar View command group
:View<x>:Version?
Queries the version of the Eye Diagram View program.
Syntax
Returns
Examples
2-190
:View<x>:Version?
<NR2>
:View1:Version?
might return 1.1.
3066 & 3086 3 GHz Real Time Spectrum Analyzer Programmer Manual
Symbol Table View Commands
When you select SymbolTable in the :Config:View<x> command, use the
commands in this section to control the Symbol Table view.
For information on the symbol table, refer to the User Manual.
3066 & 3086 3 GHz Real Time Spectrum Analyzer Programmer Manual
2-191
Symbol Table View Commands
:View<x>:CopyTo (No Query Form)
Stores the display data to the Windows clipboard.
Syntax
Arguments
Examples
:View<x>:CopyTo Clipboard
Clipboard stores the display data to the Windows clipboard in the ASCII text
format. You can use the data in your application.
:View1:CopyTo Clipboard
stores the display data to the clipboard.
:View<x>:Marker:Data? (Query Only)
Queries the value on the marker position.
Syntax
Returns
Examples
Related Commands
2-192
:View<x>:Marker:Data?
<NR1>
:View1:Marker:Data?
might return 3.
:View<x>:Marker:Symbol?, :View<x>:Marker:T?, :View<x>:Symbol
3066 & 3086 3 GHz Real Time Spectrum Analyzer Programmer Manual
Symbol Table View Commands
:View<x>:Marker:Symbol? (Query Only)
Queries the marker position on the symbol table. This command is the same as
the :View<x>:Symbol? command, and exists for compatibility.
Syntax
Returns
Examples
Related Commands
:View<x>:Marker:Symbol?
<NR1>
:View1:Marker:Symbol?
might return 110, indicating that the marker is positioned at the symbol number
110.
:View<x>:Marker:Data?, :View<x>:Marker:T?, :View<x>:Symbol?
:View<x>:Marker:T (?)
Sets or queries the marker position on the time axis.
Syntax
:View<x>:Marker:T <value>
:View<x>:Marker:T?
Arguments
Examples
Related Commands
<value>::=<NR3> ranges the minimum to the maximum value on the time axis.
:View1:Marker:T 5u
positions the marker at 5 ms.
:View<x>:Marker:Data?, :View<x>:Marker:Symbol?, :View<x>:Symbol
3066 & 3086 3 GHz Real Time Spectrum Analyzer Programmer Manual
2-193
Symbol Table View Commands
:View<x>:Radix (?)
Selects or queries the display data format.
Syntax
:View<x>:Radix { Hex | Oct | Bin }
:View<x>:Radix?
Arguments
Hex selects the hexadecimal format.
Oct selects the octal format.
Bin selects the binary format.
Examples
Related Commands
:View1:Radix Hex
selects the hexadecimal format to display data.
:View<x>:Marker:Data?
:View<x>:Rotate (?)
Sets or queries the numeric value start position. It is unavailable for the 1/4 p
QPSK and GMSK modulating system.
Syntax
:View<x>:Rotate <value>
:View<x>:Rotate?
Arguments
Examples
Related Commands
2-194
<value>::=<NR1> ranges 0 to 3.
:View1:Rotate 3
sets the numeric value start position to 3.
:View<x>:Marker:Data?
3066 & 3086 3 GHz Real Time Spectrum Analyzer Programmer Manual
Symbol Table View Commands
:View<x>:Source (?)
Selects or queries the data source for the symbol table.
Syntax
:View<x>:Source { Measurement | Reference }
:View<x>:Source?
Arguments
Measurement selects the measurement data as the view source. The data is stored
in the register pair specified with the :View<x>:MeasDestination in the Polar
View or the CDMA Polar View command group.
Reference selects the reference data as the view source. The data is stored in the
register pair specified with the :View<x>:RefDestination in the Polar View or
the CDMA Polar View command group.
Examples
Related Commands
:View1:Source Measurement
selects the measurement data as the view source.
:View<x>:MeasDestination and :View<x>:RefDestination
in the Polar View or the CDMA Polar View command group
:View<x>:Symbol (?)
Sets or queries the symbol location where the marker is placed.
Syntax
:View<x>:Symbol <value>
:View<x>:Symbol?
Arguments
Examples
Related Commands
<value>::=<NR1> ranges from 0 to the number of symbols – 1.
:View1:Symbol 10
places the marker on the symbol number 10.
:View<x>:Marker:Symbol?, :View<x>:Marker:T
3066 & 3086 3 GHz Real Time Spectrum Analyzer Programmer Manual
2-195
Symbol Table View Commands
:View<x>:Version? (Query Only)
Queries the version of the Symbol Table View program.
Syntax
Returns
Examples
2-196
:View<x>:Version?
<NR2>
:View1:Version?
might return 1.1.
3066 & 3086 3 GHz Real Time Spectrum Analyzer Programmer Manual
EVM View Commands
When you select EVM in the :Config:View<x> command, use the commands in
this section to control the EVM (Error Vector Magnitude) view.
For information on the EVM view, refer to the User Manual.
3066 & 3086 3 GHz Real Time Spectrum Analyzer Programmer Manual
2-197
EVM View Commands
:View<x>:CopyTo (No Query Form)
Stores the display data to a file or data register. This command is effective only
for the data acquired in the Vector mode.
Syntax
Arguments
:View<x>:CopyTo { Clipboard | D1 | D2 | D3 | D4 | D5 | D6 | D7 |
D8 | <file_name> }
Clipboard stores the display data to the Windows clipboard in the ASCII text
format. You can use the data in your application.
D1 to D8 select the data register 1 to 8, respectively.
<file_name>::=<string> is “*.TXT” (ASCII text file). The extension is set to
“.TXT” automatically.
Examples
:View1:CopyTo Clipboard
stores the display data to the clipboard.
:View<x>:Format (?)
Selects or queries the waveform display format.
Syntax
:View<x>:Format { EVM | MagError | PhaseError }
:View<x>:Format?
Arguments
Examples
2-198
Defines the parameters associated with the horizontal and vertical axes as
follows:
Argument
Display
Horizontal axis
Vertical axis
EVM
Error vector magnitude
Time
Percentage of EVM
MagError
Amplitude error
Time
Percentage of amplitude error
PhaseError
Phase error
Time
Percentage of phase error
:View1:Format EVM
shows the waveform with time along the horizontal axis and percentage of EVM
along the vertical axis.
3066 & 3086 3 GHz Real Time Spectrum Analyzer Programmer Manual
EVM View Commands
:View<x>:Marker:DeltaMarker (?)
Turns the delta marker on or off.
Syntax
:View<x>:Marker:DeltaMarker { On | Off }
:View<x>:Marker:DeltaMarker?
Arguments
On turns the delta marker on.
Off turns the delta marker off.
Examples
Related Commands
:View1:Marker:DeltaMarker On
turns the delta marker on.
:View<x>:Marker:DeltaX, :View<x>:Marker:DeltaY?,
:View<x>:Marker:ResetDelta
:View<x>:Marker:DeltaX (?)
Sets or queries the horizontal position of the delta marker.
Syntax
:View<x>:Marker:DeltaX <value>
:View<x>:Marker:DeltaX?
Arguments
Examples
Related Commands
<value>::=<NR3> ranges from the minimum (left) edge to the maximum (right)
edge of the the horizontal axis.
:View1:Marker:DeltaX 5u
positions the delta marker at 5 ms.
:View<x>:Marker:DeltaY?
3066 & 3086 3 GHz Real Time Spectrum Analyzer Programmer Manual
2-199
EVM View Commands
:View<x>:Marker:DeltaY? (Query Only)
Queries the vertical position of the delta marker.
Syntax
Returns
Examples
Related Commands
:View<x>:Marker:DeltaY?
<NR3>
:View1:Marker:DeltaY?
might return 1.78.
:View<x>:Marker:DeltaX
:View<x>:Marker:ResetDelta (No Query Form)
Moves the delta marker to the main marker position.
Syntax
Arguments
Examples
Related Commands
:View<x>:Marker:ResetDelta
None
:View1:Marker:ResetDelta
:View<x>:Marker:DeltaMarker
:View<x>:Marker:SearchMax (No Query Form)
Positions the marker on the highest signal on screen.
Syntax
Arguments
Examples
Related Commands
2-200
:View<x>:Marker:SearchMax
None
:View1:Marker:SearchMax
positions the marker on the highest signal on screen.
:View<x>:Marker:SearchMin
3066 & 3086 3 GHz Real Time Spectrum Analyzer Programmer Manual
EVM View Commands
:View<x>:Marker:SearchMin (No Query Form)
Positions the marker on the lowest signal on screen.
Syntax
Arguments
Examples
Related Commands
:View<x>:Marker:SearchMin
None
:View1:Marker:SearchMin
positions the marker on the lowest signal on screen.
:View<x>:Marker:SearchMax
:View<x>:Marker:X (?)
Sets or queries the horizontal position of the marker.
Syntax
:View<x>:Marker:X <value>
:View<x>:Marker:X?
Arguments
Examples
Related Commands
<value>::=<NR3> ranges from the minimum (left) edge to the maximum (right)
edge of the the horizontal axis.
:View1:Marker:X 5u
positions the marker at 5 ms.
:View<x>:Marker:Y?
3066 & 3086 3 GHz Real Time Spectrum Analyzer Programmer Manual
2-201
EVM View Commands
:View<x>:Marker:Y? (Query Only)
Queries the vertical position of the marker.
Syntax
:View<x>:Marker:Y?
Returns
<NR3> in percent (%).
Examples
Related Commands
:View1:Marker:Y?
might return 1.543, indicating that the marker is positioned at 1.543 %.
:View<x>:Marker:X
:View<x>:MaskArea (?)
Sets or queries the area on display to exclude from calculating EVM.
See Figure 2–5.
Syntax
:View<x>:MaskArea <value>
:View<x>:MaskArea?
Arguments
<value>::=<NR3> ranges from 0 to 50 %. Both right and left ends are excluded.
0 % excludes no area. 50 % excludes the whole area.
10 %
In this example, 10 % area of both ends
are excluded for the EVM calculation.
10 %
Figure 2-5: Setting the mask for the EVM calculation
2-202
3066 & 3086 3 GHz Real Time Spectrum Analyzer Programmer Manual
EVM View Commands
Examples
:View1:MaskArea 10
excludes 10 % area from both right and left edges for the EVM calculation.
:View<x>:Result<y>? (Query Only)
Queries the measurement results.
Syntax
Returns
:View<x>:Result<y>?
<NR3>
Result1 returns the EVM in percent rms.
Result2 returns the magnitude error in percent rms.
Result3 returns the phase error in degree.
Result4 returns the r (Rho).
Examples
:View1:Result1?
might return 2.913, indicating that the EVM is 2.913 % rms.
:View<x>:Scale:AutoScale (No Query Form)
Adjusts the scaling of the vertical axis automatically to best display the data.
Syntax
Arguments
Examples
Related Commands
:View<x>:Scale:AutoScale
None
:View1:Scale:AutoScale
adjusts the scaling of the vertical axis automatically.
:View<x>:Scale:XScale, :View<x>:Scale:YScale
3066 & 3086 3 GHz Real Time Spectrum Analyzer Programmer Manual
2-203
EVM View Commands
:View<x>:Scale:XScale (?)
Sets or queries the horizontal axis full-scale to display a portion of the data.
Syntax
:View<x>:Scale:XScale <value>
:View<x>:Scale:XScale?
Arguments
Examples
Related Commands
<value>::=<NR3> ranges full-scale/256 to full-scale of the acquired data.
:View1:Scale:XScale 640u
sets the horizontal axis full-scale to 640 ms.
:View<x>:Scale:XStart, :View<x>:Scale:YScale
:View<x>:Scale:XStart (?)
Sets or queries the value represented by the minimum (left) edge of the
horizontal axis.
Syntax
:View<x>:Scale:XStart <value>
:View<x>:Scale:XStart?
Arguments
<value>::=<NR3> ranges from the minimum to the maximum value on the
horizontal axis of the acquired data.
Examples
:View1:Scale:XStart 160u
sets the value represented by the left edge of the horizontal axis to 160 ms.
Related Commands
2-204
:View<x>:Scale:XScale
3066 & 3086 3 GHz Real Time Spectrum Analyzer Programmer Manual
EVM View Commands
:View<x>:Scale:YScale (?)
Sets or queries the vertical axis full-scale to display a portion of the data.
Syntax
:View<x>:Scale:YScale <value>
:View<x>:Scale:YScale?
Arguments
Examples
Related Commands
<value>::=<NR3> ranges full-scale/100 to full-scale of the acquired data.
:View1:Scale:YScale 50
sets the vertical axis full-scale to 50 %.
:View<x>:Scale:XScale, :View<x>:Scale:YStart
:View<x>:Scale:YStart (?)
Sets or queries the value represented by the minimum (bottom) edge of the
vertical axis.
Syntax
:View<x>:Scale:YStart <value>
:View<x>:Scale:YStart?
Arguments
Examples
Related Commands
<value>::=<NR3> ranges from the minimum to the maximum value on the
vertical axis of the acquired data.
:View1:Scale:YStart 0
sets the value represented by the bottom edge of the vertical axis to 0 %.
:View<x>:Scale:YScale
3066 & 3086 3 GHz Real Time Spectrum Analyzer Programmer Manual
2-205
EVM View Commands
:View<x>:Symbol (?)
Sets or queries the symbol position to place the marker.
Syntax
:View<x>:Symbol <value>
:View<x>:Symbol?
Arguments
<value>::=<NR1> ranges from 0 to the number of symbols – 1.
Examples
:View1:Symbol 10
places the marker on the symbol number 10.
Related Commands
:View<x>:Marker:X, :View<x>:Marker:Y?
:View<x>:Version? (Query Only)
Queries the version of the EVM View program.
Syntax
Returns
Examples
2-206
:View<x>:Version?
<NR2>
:View1:Version?
might return 1.1.
3066 & 3086 3 GHz Real Time Spectrum Analyzer Programmer Manual
CDMA Waveform View Commands
When you select CDMAWaveform in the :Config:View<x> command, use the
commands in this section to control the CDMA Waveform view.
3066 & 3086 3 GHz Real Time Spectrum Analyzer Programmer Manual
2-207
CDMA Waveform View Commands
:View<x>:Average:Times (?)
Sets or queries the number of frames that make up an averaged waveform.
Syntax
:View<x>:Average:Times <value>
:View<x>:Average:Times?
Arguments
Examples
Related Commands
<value>::=<NR1> is the number of frames for averaging, from 1 to 1000.
:View1:Average:Times 1000
specifies that an averaged waveform will show the result of combining 1000
frames.
:View<x>:Average:Type
:View<x>:Average:Type (?)
Selects or queries the average type. You can also select the peak hold mode. For
more information about averaging, refer to the User Manual.
Syntax
:View<x>:Average:Type { RMSExpo | RMS | PeakHold }
:View<x>:Average:Type?
Arguments
RMSExpo averages with the RMS (root mean squared) exponential. This mode
weights older acquisition data so that they have a progressively smaller effect on
the average.
RMS averages with the RMS (root mean squared).
PeakHold holds the peak value for each data point.
Examples
Related Commands
:View1:Average:Type RMSExpo
averages waveform with the exponential RMS.
:View<x>:Average:Time
:View<x>:CDMA:Channel (?)
Selects or queries the channel.
2-208
3066 & 3086 3 GHz Real Time Spectrum Analyzer Programmer Manual
CDMA Waveform View Commands
Syntax
:View<x>:CDMA:Channel <value>
:View<x>:CDMA:Channel?
Arguments
<value>::=<NR1> specifies the channel number.
For the IS-95 standard, the range is 1 to 777. Channel 1 and 777 correspond to
825.03 and 848.31 MHz, respectively. The frequency difference between two
adjacent channels is 0.03 MHz.
For the T-53 standard, the range is 1 to 1199. Channel 1 and 1199 correspond to
915.0125 and 888.9875 MHz, respectively. The frequency difference between
two adjacent channels is 0.0125 MHz.
Examples
Related Commands
:View1:CDMA:Channel 777
sets the channel number to 777.
:Setup:CDMA:Channel
:View<x>:Compression (?)
Selects or queries the display data compression method. It specifies how to take
or discard each acquired data point for a corresponding pixel on the screen
because the number of horizontal pixels is usually less than that of data points.
Syntax
:View<x>:Compression { Sample | MinMax | Max | Min }
:View<x>:Compression?
Arguments
Sample takes the acquired data points at regular intervals to obtain a waveform
display.
MinMax takes the minimum and the maximum data points for a corresponding
pixel. The minimum and the maximum data points are displayed with a vertical
bar on the screen.
Max takes the maximum data point for a corresponding pixel.
Min takes the minimum data point for a corresponding pixel.
Examples
:View1:Compression Sample
takes the acquired data points at regular intervals to obtain a waveform display.
3066 & 3086 3 GHz Real Time Spectrum Analyzer Programmer Manual
2-209
CDMA Waveform View Commands
:View<x>:CopyFrom (No Query Form)
Loads the display data from the text file.
Syntax
Arguments
Examples
Related Commands
:View<x>:CopyFrom <file_name>
<file_name>::=<string> is “*.TXT” (ASCII text file).
The file is the one to which the display data has been stored with the
:View<x>:CopyTo command.
:View1:CopyFrom "SAMPLE1.TXT"
loads the display data from the file SAMPLE1.TXT.
:View<x>:CopyTo
:View<x>:CopyTo (No Query Form)
Stores the display data to a file or data register. This command is effective only
for the data acquired in the Vector mode.
Syntax
Arguments
:View<x>:CopyTo { Clipboard | D1 | D2 | D3 | D4 | D5 | D6 | D7 |
D8 | <file_name> }
Clipboard copies the display data to the Windows clipboard in the ASCII text
format. You can use the data in your application.
D1 to D8 are the data register 1 to 8, respectively.
<file_name>::=<string> is “*.TXT” (ASCII text file). The extension is set to
“.TXT” automatically.
Examples
Related Commands
:View1:CopyTo Clipboard
stores the display data to the clipboard.
:View<x>:CopyFrom
:View<x>:Format (?)
Sets or queries the waveform display format.
2-210
3066 & 3086 3 GHz Real Time Spectrum Analyzer Programmer Manual
CDMA Waveform View Commands
Syntax
:View<x>:Format { FreqAmpl | FreqPhase | FreqI | FreqQ | TimeAmpl
| TimePhase | TimeI | TimeQ }
:View<x>:Format?
Arguments
Examples
Defines the parameters associated with the horizontal and vertical axes as
follows:
Argument
Horizontal axis
Vertical axis
FreqAmpl
Frequency (span)
Amplitude
FreqPhase
Frequency (span)
Phase
FreqI
Frequency (span)
I (In-Phase)
FreqQ
Frequency (span)
Q (QuadratureĆPhase)
TimeAmpl
Time
Amplitude
TimePhase
Time
Phase
TimeI
Time
I (In-Phase)
TimeQ
Time
Q (QuadratureĆphase)
:View1:Format FreqAmpl
shows the waveform with frequency along the horizontal axis and amplitude
along the vertical axis.
:View<x>:Marker:DeltaMarker (?)
Turns the delta marker on or off.
Syntax
:View<x>:Marker:DeltaMarker { On | Off }
:View<x>:Marker:DeltaMarker?
Arguments
On turns the delta marker on.
Off turns the delta marker off.
Examples
Related Commands
:View1:Marker:DeltaMarker On
turns the delta marker on.
:View<x>:Marker:DeltaX, :View<x>:Marker:DeltaY?,
:View<x>:Marker:ResetDelta
3066 & 3086 3 GHz Real Time Spectrum Analyzer Programmer Manual
2-211
CDMA Waveform View Commands
:View<x>:Marker:DeltaX (?)
Sets or queries the horizontal position of the delta marker.
Syntax
:View<x>:Marker:DeltaX <value>
:View<x>:Marker:DeltaX?
Arguments
Examples
Related Commands
<value>::=<NR3> ranges from the minimum (left) edge to the maximum (right)
edge of the the horizontal axis.
:View1:Marker:DeltaX 1G
positions the delta marker at 1 GHz.
:View<x>:Marker:DeltaY
:View<x>:Marker:DeltaY? (Query Only)
Queries the vertical position of the delta marker.
Syntax
Returns
Examples
Related Commands
2-212
:View<x>:Marker:DeltaY?
<NR3>
:View1:Marker:DeltaY?
might return –100, indicating that the delta marker is positioned at –100 dB.
:View<x>:Marker:DeltaX
3066 & 3086 3 GHz Real Time Spectrum Analyzer Programmer Manual
CDMA Waveform View Commands
:View<x>:Marker:Peak (No Query Form)
Moves the marker to the adjacent peak in the specified direction. Note that the
adjacent peak is farther than the distance specified with the :View<x>:Marker
:SearchSeparation command.
Syntax
Arguments
:View<x>:Marker:Peak { 1 | -1 }
1 moves the marker to the adjacent peak on the left of the marker.
-1 moves the marker to the adjacent peak on the right of the marker.
Examples
Related Commands
:View1:Marker:Peak -1
moves the marker to the adjacent peak on the right of the marker.
:View<x>:Marker:SearchMax, :View<x>:Marker:SearchMin,
:View<x>:Marker:SearchSeparation
:View<x>:Marker:ResetDelta (No Query Form)
Moves the delta marker to the main marker position.
Syntax
Arguments
Examples
Related Commands
:View<x>:Marker:ResetDelta
None
:View1:Marker:ResetDelta
:View<x>:Marker:DeltaMarker
3066 & 3086 3 GHz Real Time Spectrum Analyzer Programmer Manual
2-213
CDMA Waveform View Commands
:View<x>:Marker:SearchMax (No Query Form)
Positions the marker on the highest signal on screen.
Syntax
Arguments
Examples
Related Commands
:View<x>:Marker:SearchMax
None
:View1:Marker:SearchMax
positions the marker on the highest signal on screen.
:View<x>:Marker:SearchMin
:View<x>:Marker:SearchMin (No Query Form)
Positions the marker on the lowest signal on screen.
Syntax
Arguments
Examples
Related Commands
:View<x>:Marker:SearchMin
None
:View1:Marker:SearchMin
positions the marker on the lowest signal on screen.
:View<x>:Marker:SearchMax
:View<x>:Marker:SearchSeparation (?)
Sets or queries the minimum horizontal distance to separate two peaks.
Syntax
:View<x>:Marker:SearchSeparation <value>
:View<x>:Marker:SearchSeparation?
Arguments
2-214
<value>::=<NR2> specifies the minimum horizontal distance to separate two
peaks. The range is 1 to 10 % relative to full-scale.
3066 & 3086 3 GHz Real Time Spectrum Analyzer Programmer Manual
CDMA Waveform View Commands
Examples
:View1:Marker:SearchSeparation 10
sets the minimum horizontal distance for peak separation to 10 % relative to
full-scale.
:View<x>:Marker:X (?)
Sets or queries the horizontal position of the marker.
Syntax
:View<x>:Marker:X <value>
:View<x>:Marker:X?
Arguments
Examples
Related Commands
<value>::=<NR3> ranges from the minimum (left) edge to the maximum (right)
edge of the the horizontal axis.
:View1:Marker:X 1.5G
positions the marker at 1.5 GHz.
:View<x>:Marker:Y?
:View<x>:Marker:Y? (Query Only)
Queries the vertical position of the marker.
Syntax
Returns
Examples
Related Commands
:View<x>:Marker:Y?
<NR3>
:View1:Marker:Y?
might return -30, indicating that the marker is positioned at –30 dBm.
:View<x>:Marker:X
3066 & 3086 3 GHz Real Time Spectrum Analyzer Programmer Manual
2-215
CDMA Waveform View Commands
:View<x>:Mask:RBW1M:Frequency (?)
Sets or queries the frequency of the reference line at 1 MHz of resolution
bandwidth (See Figure 2–6).
Syntax
:View<x>:Mask:RBW1M:Frequency <value>
:View<x>:Mask:RBW1M:Frequency?
Arguments
Examples
Related Commands
<value>::=<NR3> ranges 0 to 25 MHz.
:View1:Mask:RBW1M:Frequency 25M
sets the frequency of the reference line to 25 MHz at 1 MHz of RBW.
:View<x>:Mask:RBW1M:Level
:View<x>:Mask:RBW1M:Level
:View<x>:Mask:RBW1M:Frequency
Figure 2-6: Setting the reference line at 1 MHz of RBW
:View<x>:Mask:RBW1M:Level (?)
Sets or queries the level of the reference line at 1 MHz of resolution bandwidth
(See Figure 2–6).
Syntax
:View<x>:Mask:RBW1M:Level <value>
:View<x>:Mask:RBW1M:Level?
Arguments
Examples
Related Commands
2-216
<value>::=<NR3> ranges –100 dBm to 30dBm.
:View1:Mask:RBW1M:Level 30
sets the level of the reference line to 30 dBm at 1 MHz of RBW.
:View<x>:Mask:RBW1M:Frequency
3066 & 3086 3 GHz Real Time Spectrum Analyzer Programmer Manual
CDMA Waveform View Commands
:View<x>:Mask:RBW30k:Frequency1 (?)
Sets or queries the frequency of the inner reference line at 30 kHz of resolution
bandwidth (See Figure 2–7).
Syntax
:View<x>:Mask:RBW30k:Frequency1 <value>
:View<x>:Mask:RBW30k:Frequency1?
Arguments
Examples
Related Commands
<value>::=<NR3> ranges 0 to 25 MHz.
:View1:Mask:RBW30k:Frequency1 25M
sets the frequency of the inner reference line to 25 MHz at 30 kHz of RBW.
:View<x>:Mask:RBW30k:Frequency2
:View<x>:Mask:RBW30k:Frequency2 (?)
Sets or queries the frequency of the outer reference line at 30 kHz of resolution
bandwidth (See Figure 2–7).
Syntax
:View<x>:Mask:RBW30k:Frequency2 <value>
:View<x>:Mask:RBW30k:Frequency2?
Arguments
Examples
Related Commands
<value>::=<NR3> ranges 0 to 25 MHz.
:View1:Mask:RBW30k:Frequency2 20M
sets the frequency of the outer reference line to 20 MHz at 30 kHz of RBW.
:View<x>:Mask:RBW30k:Frequency1
3066 & 3086 3 GHz Real Time Spectrum Analyzer Programmer Manual
2-217
CDMA Waveform View Commands
:View<x>:Mask:RBW30k:Level1
:View<x>:Mask:RBW30k:Level2
:View<x>:Mask:RBW30k:Frequency1
:View<x>:Mask:RBW30k:Frequency2
Figure 2-7: Setting the reference line at 30 kHz of RBW
:View<x>:Mask:RBW30k:Level1 (?)
Sets or queries the level of the inner reference line at 30 kHz of resolution
bandwidth (See Figure 2–7).
Syntax
:View<x>:Mask:RBW30k:Level1 <value>
:View<x>:Mask:RBW30k:Level1?
Arguments
Examples
Related Commands
<value>::=<NR3> ranges –100 dB to 0 dB.
:View1:Mask:RBW30k:Level1 -42
sets the level of the inner reference line to –42 dB at 30 kHz of RBW.
:View<x>:Mask:RBW30k:Level2
:View<x>:Mask:RBW30k:Level2 (?)
Sets or queries the level of the outer reference line at 30 kHz of resolution
bandwidth (See Figure 2–7).
Syntax
:View<x>:Mask:RBW30k:Level2 <value>
:View<x>:Mask:RBW30k:Level2?
Arguments
Examples
2-218
<value>::=<NR3> ranges –100 dB to 0 dB.
:View1:Mask:RBW30k:Level2 -54
sets the level of the outer reference line to –54 dB at 30 kHz of RBW.
3066 & 3086 3 GHz Real Time Spectrum Analyzer Programmer Manual
CDMA Waveform View Commands
Related Commands
:View<x>:Mask:RBW30k:Level1
:View<x>:Measurement (?)
Selects or queries the measurement function. The measurement starts with the
data acquisition. Query the results with the :View<x>:Result<y>? command.
Syntax
:View<x>:Measurement { Off | Power | Spurious }
:View<x>:Measurement?
Arguments
Off turns the measurement off.
Power selects the power measurement.
Spurious selects the spurious measurement.
Examples
Related Commands
:View1:Measurement Power
selects the power measurement.
:View<x>:Measurement:OBW, :View<x>:Result<y>?
:View<x>:Measurement:OBW (?)
Sets or queries the occupied bandwidth.
Syntax
:View<x>:Measurement:OBW <value>
:View<x>:Measurement:OBW?
Arguments
<value>::=<NR2> ranges 90 to 99.8 %.
Examples
:View1:Measurement:OBW 99.8
sets the occupied bandwidth to 99.8 %.
Related Commands
:View<x>:Measurement
3066 & 3086 3 GHz Real Time Spectrum Analyzer Programmer Manual
2-219
CDMA Waveform View Commands
:View<x>:Measurement:Separation (?)
Sets or queries the frequency resolution for spurious search to distinguish two
adjacent peaks. The resolution is represented by the ratio (%) to the span.
Syntax
:View<x>:Measurement:Separation <value>
:View<x>:Measurement:Separation?
Arguments
Examples
Related Commands
<value>::=<NR2> ranges 0 to 100 %. 100 % means that the resolution is equal
to the span.
:View1:Measurement:Separation 100
sets the spurious resolution to 100 % (= span).
:View<x>:Measurement, :View<x>:Measurement:SpuriousSearch
:View<x>:Measurement:SortedBy (?)
Sets or queries the sort key for the spurious signals.
Syntax
:View<x>:Measurement:SortedBy { Level | Frequency }
:View<x>:Measurement:SortedBy?
Arguments
Level specifies that the spurious signals are sorted by level.
Frequency specifies that the spurious signals are sorted by frequency.
Examples
Related Commands
2-220
:View1:Measurement:SortedBy Level
specifies that the spurious signals are sorted by level.
:View<x>:Measurement, :View<x>:Measurement:SpuriousSearch
3066 & 3086 3 GHz Real Time Spectrum Analyzer Programmer Manual
CDMA Waveform View Commands
:View<x>:Measurement:SpuriousSearch (?)
Determines whether or not to search spurious for each frame.
Syntax
:View<x>:Measurement:SpuriousSearch { On | Off }
:View<x>:Measurement:SpuriousSearch?
Arguments
On turns the spurious search on.
Off turns the spurious search off.
Examples
Related Commands
:View1:Measurement:SpuriousSearch On
turns the spurious search on.
:View<x>:Measurement:Threshold
:View<x>:Measurement:Threshold (?)
Sets or queries the threshold level to detect spurious.
Syntax
:View<x>:Measurement:Threshold <value>
:View<x>:Measurement:Threshold?
Arguments
Examples
Related Commands
<value>::=<NR1> ranges –150 to 30 dB.
:View1:Measurement:Threshold 30
sets the threshold level to 30 dB for the spurious search.
:View<x>:Measurement:SpuriousSearch
3066 & 3086 3 GHz Real Time Spectrum Analyzer Programmer Manual
2-221
CDMA Waveform View Commands
:View<x>:Position (?)
Specifies or queries which frame in a block to be displayed.
Syntax
:View<x>:Position <value>
:View<x>:Position?
Arguments
Examples
<value>::=<NR2> ranges 0 to 100 %. It specifies the display frame position
relative to the block size. 0 % specifies that the first frame in a block is
displayed. 100 % represents the last frame.
:View1:Position 100
displays the last frame in acquiring waveform.
:View<x>:RBW (?)
Sets or queries the resolution bandwidth.
Syntax
:View<x>:RBW { 1M | 30k | Off }
:View<x>:RBW?
Arguments
1M sets the resolution bandwidth to 1 MHz.
30k sets the resolution bandwidth to 30 kHz.
Off displays the raw data of each bin.
Examples
2-222
:View1:RBW 1M
sets the resolution bandwidth to 1 MHz.
3066 & 3086 3 GHz Real Time Spectrum Analyzer Programmer Manual
CDMA Waveform View Commands
:View<x>:Result<y>? (Query Only)
Queries the measurement results. Select the measurement function with the
:View<x>:Measurement command.
Syntax
Returns
:View<x>:Result<y>?
<NR3>
<y>=1 returns the power.
<y>=2 returns the occupied bandwidth.
<y>=3, 6, 9, 12, 15, 18, 21, or 24 returns the result of spurious test; Pass or Fail.
Each number corresponds to each of eight spurious signals. “Pass” indicates that
the waveform is within the specified limits. “Fail” indicates that the waveform
exceeds the limits.
<y>=4, 7, 10, 13, 16, 19, 22, or 25 returns each spurious level of eight spurious
signals.
<y>=5, 8, 11, 14, 17, 20, 23, or 26 returns each spurious frequency of eight
spurious signals.
Examples
Related Commands
:View1:Result5?
might return 825000000, indicating that the first spurious frequency is 825 MHz.
:View<x>:Measurement
3066 & 3086 3 GHz Real Time Spectrum Analyzer Programmer Manual
2-223
CDMA Waveform View Commands
:View<x>:Scale:AutoScale (No Query Form)
Adjusts the scaling of the vertical axis automatically to best display the data.
When the parameter is level or phase, this command sets the vertical axis to
full-scale.
Syntax
Arguments
Examples
Related Commands
:View<x>:Scale:AutoScale
None
:View1:Scale:AutoScale
adjusts the scaling of the vertical axis automatically.
:View<x>:Format, :View<x>:Scale:XScale, :View<x>:Scale:YScale
:View<x>:Scale:HoldYScale (?)
Determines whether to hold or reset the vertical scale when you change the input
source.
Syntax
:View<x>:Scale:HoldYScale { On | Off }
:View<x>:Scale:HoldYScale?
Arguments
On holds the vertical scale setting when you change the input source.
Off resets the vertical scale to full-scale.
Examples
Related Commands
2-224
:View1:Scale:HoldYScale On
holds the vertical scale setting when you change the input source.
:View<x>:Scale:YScale, :View<x>:Scale:YStart, :View<x>:Source
3066 & 3086 3 GHz Real Time Spectrum Analyzer Programmer Manual
CDMA Waveform View Commands
:View<x>:Scale:XScale (?)
Sets or queries the horizontal axis full-scale to display a portion of the data.
Syntax
:View<x>:Scale:XScale <value>
:View<x>:Scale:XScale?
Arguments
Examples
Related Commands
<value>::=<NR3> ranges full-scale/256 to full-scale of the acquired data.
:View1:Scale:XScale 2.5M
sets the horizontal axis full-scale to 2.5 MHz.
:View<x>:Scale:XStart, :View<x>:Scale:YScale
:View<x>:Scale:XStart (?)
Sets or queries the value represented by the minimum (left) edge of the
horizontal axis.
Syntax
:View<x>:Scale:XStart <value>
:View<x>:Scale:XStart?
Arguments
Examples
Related Commands
<value>::=<NR3> ranges from the minimum to the maximum value on the
horizontal axis of the acquired data.
:View1:Scale:XStart 800M
sets the value represented by the left edge of the horizontal axis to 800 MHz.
:View<x>:Scale:XScale
3066 & 3086 3 GHz Real Time Spectrum Analyzer Programmer Manual
2-225
CDMA Waveform View Commands
:View<x>:Scale:YScale (?)
Sets or queries the vertical axis full-scale to display a portion of the data.
Syntax
:View<x>:Scale:YScale <value>
:View<x>:Scale:YScale?
Arguments
Examples
Related Commands
<value>::=<NR3> ranges full-scale/100 to full-scale of the acquired data.
:View1:Scale:YScale 20
sets the vertical axis full-scale to 20 dB.
:View<x>:Scale:XScale, :View<x>:Scale:YStart
:View<x>:Scale:YStart (?)
Sets or queries the value represented by the minimum (bottom) edge of the
vertical axis.
Syntax
:View<x>:Scale:YStart <value>
:View<x>:Scale:YStart?
Arguments
<value>::=<NR3> ranges from the reference level – 200 dB to the reference
level + 100 dB.
Examples
:View1:Scale:YStart -120
sets the value represented by the bottom edge of the vertical axis to –120 dB.
Related Commands
2-226
:View<x>:Scale:YScale
3066 & 3086 3 GHz Real Time Spectrum Analyzer Programmer Manual
CDMA Waveform View Commands
:View<x>:Source (?)
Selects or queries the display data source for the specified view.
Syntax
:View<x>:Source { None | Active | Average | Zoom | D1D2 |
D3D4 | D5D6 | D7D8 | D1 | D2 | D3 | D4 | D5 | D6 | D7 | D8 |
<file_name> }
:View<x>:Source?
Arguments
None specifies no source. The display area in the view will be emptied.
Active specifies the currently acquired data as the source.
Average specifies the averaged data as the source. When you select this item,
you have to set the average type and the number of averages using the
:View<x>:Average:Type and the :View<x>:Average:Times commands,
respectively.
Zoom specifies the zoomed data as the source.
D1D2 to D7D8 specify the register pair D1D2 to D7D8 as the source, respectively.
D1 to D8 specify the data register D1 to D8 as the source, respectively.
<file_name>::=<string> specifies the file as the source. The file name must
be “*.IQ” (the IQ format) or “*.AP” (the AP format).
Examples
Related Commands
:View1:Source Active
specifies the currently acquired data as the view source.
:Config:Mode, :View<x>:Average:Times, :View<x>:Average:Type
3066 & 3086 3 GHz Real Time Spectrum Analyzer Programmer Manual
2-227
CDMA Waveform View Commands
:View<x>:Version? (Query Only)
Queries the version of the CDMA Waveform View program.
Syntax
Returns
Examples
:View<x>:Version?
<NR2>
:View1:Version?
might return 1.1.
:View<x>:Z (?)
Specifies or queries the displayed frame number.
Syntax
:View<x>:Z <value>
:View<x>:Z?
Arguments
Examples
2-228
<value>::=<NR1> ranges from 0 to the number of frames – 1.
:View1:Z 199
specifies that the frame 199 displays.
3066 & 3086 3 GHz Real Time Spectrum Analyzer Programmer Manual
CDMA Polar View Commands
When you select CDMAPolar in the :Config:View<x> command, use the
commands in this section to control the CDMA Polar view.
For information on the Polar view, refer to the User Manual.
3066 & 3086 3 GHz Real Time Spectrum Analyzer Programmer Manual
2-229
CDMA Polar View Commands
:View<x>:AlphaBT (?)
Sets or queries the a/BT value.
Syntax
:View<x>:AlphaBT <value>
:View<x>:AlphaBT?
Arguments
Examples
<value>::=<NR2> ranges 0.0001 to 1.
:View1:AlphaBT 1
sets the a/BT value to 1.
:View<x>:AutoCarrier (?)
Determines whether to search the carrier automatically for each frame.
Syntax
:View<x>:AutoCarrier { On | Off }
:View<x>:AutoCarrier?
Arguments
On searches the carrier automatically for each frame, and displays the frequency
error in reference to the center frequency on screen at Freq Error.
Off sets the carrier frequency to the value set with the :View<x>:Carrier
command.
Examples
Related Commands
2-230
:View1:AutoCarrier On
searches the carrier automatically and displays the frequency error.
:View<x>:Carrier
3066 & 3086 3 GHz Real Time Spectrum Analyzer Programmer Manual
CDMA Polar View Commands
:View<x>:Burst:BlockSize (?)
Sets or queries the range for searching a burst signal in frames. The start frame is
set with the :View<x>:Z command. If the number of frames after the start frame
does not reach the specified number, the frames before the start frame are also
used. See Figure 2–8.
Syntax
:View<x>:Burst:BlockSize <value>
:View<x>:Burst:BlockSize?
Arguments
Examples
Related Commands
<value>::=<NR1> ranges 1 to 20 frames.
:View1:Burst:BlockSize 4
sets the range for the burst search to 4 frames.
:View<x>:Burst:NumberFrames, :View<x>:Burst:Offset,
:View<x>:Burst:Search, :View<x>:Burst:Threshold, :View<x>:Z
:View<x>:Burst:NumberFrames (?)
Sets or queries the range for acquiring burst data. See Figure 2–8.
Syntax
:View<x>:Burst:NumberFrames <value>
:View<x>:Burst:NumberFrames?
Arguments
Examples
Related Commands
<value>::=<NR1> is 1 or 2 frames.
:View1:Burst:NumberFrames 2
sets the range for burst data acquisition to 2 frames.
:View<x>:Burst:BlockSize, :View<x>:Burst:Offset,
:View<x>:Burst:Search, :View<x>:Burst:Threshold, :View<x>:Z
3066 & 3086 3 GHz Real Time Spectrum Analyzer Programmer Manual
2-231
CDMA Polar View Commands
:View<x>:Burst:BlockSize
:View<x>:Burst:NumberFrames
(Data to be analyzed)
:View<x>:Burst:Threshold
Burst
:View<x>:Burst:Offset
Figure 2-8: Settings for burst analysis
:View<x>:Burst:Offset (?)
Sets or queries the start point for acquiring burst data relative to the rising edge
of the burst signal. See Figure 2–8.
Syntax
:View<x>:Burst:Offset <value>
:View<x>:Burst:Offset?
Arguments
<value>::=<NR1> ranges –1024 to +1024 points. The minus values represent
the data points before the rising edge.
Examples
:View1:Burst:Offset -10
specifies that the analyzer acquires burst data from 10 points before the rising
edge.
Related Commands
2-232
:View<x>:Burst:BlockSize, :View<x>:Burst:NumberFrames,
:View<x>:Burst:Search, :View<x>:Burst:Threshold, :View<x>:Z
3066 & 3086 3 GHz Real Time Spectrum Analyzer Programmer Manual
CDMA Polar View Commands
:View<x>:Burst:Search (?)
Determines whether to search a burst signal.
Syntax
:View<x>:Burst:Search { On | Off }
:View<x>:Burst:Search?
Arguments
On searches a burst for analyzing.
Off analyzes the frame specified with the :View<x>:Z command.
Examples
Related Commands
:View1:Burst:Search On
searches a burst for analyzing.
:View<x>:Burst:BlockSize, :View<x>:Burst:NumberFrames,
:View<x>:Burst:Offset, :View<x>:Burst:Threshold, :View<x>:Z
:View<x>:Burst:Threshold (?)
Sets or queries the threshold for determining the rising edge of a burst signal.
See Figure 2–8.
Syntax
:View<x>:Burst:Threshold <value>
:View<x>:Burst:Threshold?
Arguments
Examples
Related Commands
<value>::=<NR1> ranges –100 to +10 dB. The value is the relative level from
the maximum within the burst search range.
:View1:Burst:Threshold -20
sets the threshold for determining the rising edge of a burst signal to –20 dB.
:View<x>:Burst:BlockSize, :View<x>:Burst:NumberFrames,
:View<x>:Burst:Offset, :View<x>:Burst:Search, :View<x>:Z
3066 & 3086 3 GHz Real Time Spectrum Analyzer Programmer Manual
2-233
CDMA Polar View Commands
:View<x>:Carrier (?)
Sets or queries the carrier frequency.
Syntax
:View<x>:Carrier <value>
:View<x>:Carrier?
Arguments
Examples
Related Commands
<value>::=<NR3> ranges 0 Hz to 3 GHz.
:View1:Carrier 1.2G
sets the carrier frequency to 1.2 GHz.
:View<x>:AutoCarrier
:View<x>:Display (?)
Selects or queries the display data source.
Syntax
:View<x>:Display { Measurement | Reference }
:View<x>:Display?
Arguments
Measurement displays the measurement data.
Reference displays the reference data.
Examples
Related Commands
2-234
:View1:Display Measurement
displays the measurement data.
:View<x>:MeasDestination, :View<x>:RefDestination
3066 & 3086 3 GHz Real Time Spectrum Analyzer Programmer Manual
CDMA Polar View Commands
:View<x>:Format (?)
Selects or queries the display format.
Syntax
:View<x>:Format { Vector | Constellation }
:View<x>:Format?
Arguments
Vector specifies the Vector format. It displays symbol-to-symbol movements
using vector.
Constellation specifies the Constellation format. It displays only symbols.
Examples
:View1:Format Vector
selects the Vector display format.
:View<x>:Marker:A? (Query Only)
Queries the amplitude at the marker position.
Syntax
Returns
Examples
Related Commands
:View<x>:Marker:A?
<NR3>
:View1:Marker:A?
might return 0.789.
:View<x>:Marker:P?
3066 & 3086 3 GHz Real Time Spectrum Analyzer Programmer Manual
2-235
CDMA Polar View Commands
:View<x>:Marker:DeltaT (?)
Sets or queries the delta-marker position on the time axis.
Syntax
:View<x>:Marker:DeltaT <value>
:View<x>:Marker:DeltaT?
Arguments
Examples
Related Commands
<value>::=<NR3> ranges the minimum to the maximum value on the time axis.
:View1:Marker:DeltaT 5.4u
positions the delta marker at 5.4 ms.
:View<x>:Marker:T
:View<x>:Marker:P? (Query Only)
Queries the phase at the marker position.
Syntax
Returns
Examples
Related Commands
:View<x>:Marker:P?
<NR3>
:View1:Marker:P?
might return 51.313, indicating that the marker is positioned at 51.313 degrees.
:View<x>:Marker:A?
:View<x>:Marker:T (?)
Sets or queries the marker position on the time axis.
Syntax
:View<x>:Marker:T <value>
:View<x>:Marker:T?
Arguments
2-236
<value>::=<NR3> ranges the minimum to the maximum value on the time axis.
3066 & 3086 3 GHz Real Time Spectrum Analyzer Programmer Manual
CDMA Polar View Commands
Examples
Related Commands
:View1:Marker:T 5.4u
positions the marker at 5.4 ms.
:View<x>:Marker:DeltaT?
:View<x>:Marker:X? (Query Only)
Queries the horizontal position of the marker.
Syntax
Returns
Examples
Related Commands
:View<x>:Marker:X?
<NR3>
1 represents the full-scale.
:View1:Marker:X?
might return 0.345.
:View<x>:Marker:Y?
:View<x>:Marker:Y? (Query Only)
Queries the vertical position of the marker.
Syntax
Returns
Examples
Related Commands
:View<x>:Marker:Y?
<NR3>
1 represents the full-scale.
:View1:Marker:Y?
might return 0.765.
:View<x>:Marker:X?
3066 & 3086 3 GHz Real Time Spectrum Analyzer Programmer Manual
2-237
CDMA Polar View Commands
:View<x>:MeasDestination (?)
Selects or queries the register pair to store the measurement data.
Syntax
:View<x>:MeasDestination { None | D1D2 | D3D4 | D5D6 | D7D8 }
:View<x>:MeasDestination?
Arguments
None specifies no destination.
D1D2 to D7D8 specify a register pair to store the measurement data.
Examples
Related Commands
:View1:MeasDestination D1D2
specifies the D1 and D2 register pair for storing data.
:View<x>:RefDestination
:View<x>:MeasFilter (?)
Selects or queries the filter to create the measurement data.
Syntax
:View<x>:MeasFilter { None | RootRaisedCosine | IS95 }
:View<x>:MeasFilter?
Arguments
None selects no filter.
RootRaisedCosine selects the root raised-cosine filter.
IS95 selects the filter specified under the IS-95 standard.
Examples
Related Commands
2-238
:View1:MeasFilter RootRaisedCosine
selects the root raised-cosine filter to create the measurement data.
:View<x>:RefFilter
3066 & 3086 3 GHz Real Time Spectrum Analyzer Programmer Manual
CDMA Polar View Commands
:View<x>:Modulation (?)
Selects or queries the digital modulation format.
Syntax
:View<x>:Modulation { PI4QPSK | BPSK | QPSK | PSK8 | QAM16 |
QAM64 | GMSK | CDMAOQPSK }
:View<x>:Modulation?
Arguments
PI4QPSK selects 1/4 p Shift QPSK (Quadrature Phase Shift Keying) modulation.
BPSK selects BPSK (Binary Phase Shift Keying) modulation.
QPSK selects QPSK (Quadrature Phase Shift Keying) modulation.
PSK8 selects 8PSK (Phase Shift Keying) modulation.
QAM16 selects 16QAM (Quadrature Amplitude Modulation) modulation.
QAM64 selects 64QAM (Quadrature Amplitude Modulation) modulation.
GMSK selects GMSK (Gaussian–filtered Minimum Shift Keying) modulation.
CDMAOQPSK selects CDMA OQPSK (Offset QPSK) used for the IS-95 standard.
Examples
:View1:Modulation PI4QPSK
selects the 1/4 p Shift QPSK modulation.
:View<x>:Position (?)
Specifies or queries which frame in a block to be displayed.
Syntax
:View<x>:Position <value>
:View<x>:Position?
Arguments
Examples
<value>::=<NR2> ranges 0 to 100 %. It specifies the display frame position
relative to the block size. 0 % specifies that the first frame in a block is
displayed. 100 % represents the last frame.
:View1:Position 100
displays the last frame in a block.
3066 & 3086 3 GHz Real Time Spectrum Analyzer Programmer Manual
2-239
CDMA Polar View Commands
:View<x>:RefDestination (?)
Selects or queries the register pair to store the reference data.
Syntax
:View<x>:RefDestination { None | D1D2 | D3D4 | D5D6 | D7D8 }
:View<x>:RefDestination?
Arguments
None specifies no destination.
D1D2 to D7D8 specify the register pair to store the reference data.
Examples
Related Commands
:View1:RefDestination D1D2
selects the D1 and D2 register pair to store the reference data.
:View<x>:MeasDestination
:View<x>:RefFilter (?)
Selects or queries the filter to create the reference data.
Syntax
:View<x>:RefFilter { None | RaisedCosine | Gaussian | IS95}
:View<x>:RefFilter?
Arguments
None selects no filter.
RaisedCosine selects the raised cosine filter.
Gaussian selects the Gaussian filter.
IS95 selects the filter specified in the IS-95 standard.
Examples
Related Commands
2-240
:View1:RefFilter RaisedCosine
selects the raised cosine filter to create the reference data.
:View<x>:MeasFilter
3066 & 3086 3 GHz Real Time Spectrum Analyzer Programmer Manual
CDMA Polar View Commands
:View<x>:Result<y>? (Query Only)
Queries the measurement result.
Syntax
Returns
:View<x>:Result<y>?
<NR3>
Result1 returns the carrier frequency error in reference to the center frequency.
Result2 returns the origin offset.
Result3 returns the full-scale in volts.
Examples
:View1:Result1?
might return 15.23, indicating that the carrier frequency error is 15.23 Hz.
:View<x>:Source (?)
Selects or queries the display data source for the specified view.
Syntax
:View<x>:Source { None | Active | Zoom | <file_name> }
:View<x>:Source?
Arguments
None specifies no source. The display area in the view will be emptied.
Active specifies the currently acquired data as the source.
Zoom specifies the zoomed data as the source.
<file_name>::=<string> specifies the file as the source. The file name must
be “*.IQ” (the IQ format).
Examples
Related Commands
:View1:Source Active
specifies the currently acquired data as the source.
:Config:Mode
3066 & 3086 3 GHz Real Time Spectrum Analyzer Programmer Manual
2-241
CDMA Polar View Commands
:View<x>:Standard:CDPD (No Query Form)
Configures the modulating system according to the CDPD (Cellular Digital
Packet Data) standard.
Syntax
Arguments
Examples
:View<x>:Standard:CDPD
None
:View1:Standard:CDPD
configures the modulating system according to the CPDP standard.
:View<x>:Standard:GSM (No Query Form)
Configures the modulating system according to the GMS (Global System for
Mobile Communication) standard.
Syntax
Arguments
Examples
:View<x>:Standard:GSM
None
:View1:Standard:GSM
configures the modulating system according to the GMS standard.
:View<x>:Standard:IS95 (No Query Form)
Configures the modulating system according to the IS-95 standard.
Syntax
Arguments
Examples
2-242
:View<x>:Standard:IS95
None
:View1:Standard:IS95
configures the modulating system according to the IS-95 standard.
3066 & 3086 3 GHz Real Time Spectrum Analyzer Programmer Manual
CDMA Polar View Commands
:View<x>:Standard:NADC (No Query Form)
Configures the modulating system according to the NADC (North American
Digital Cellular) standard.
Syntax
Arguments
Examples
:View<x>:Standard:NADC
None
:View1:Standard:NADC
configures the modulating system according to the NADC standard.
:View<x>:Standard:PDC (No Query Form)
Configures the modulating system according to the PDC (Personal Digital
Cellular System) standard.
Syntax
Arguments
Examples
:View<x>:Standard:PDC
None
:View1:Standard:PDC
configures the modulating system according to the PDC standard.
:View<x>:Standard:PHS (No Query Form)
Configures the modulating system according to the PHS (Personal Handy Phone
System) standard.
Syntax
Arguments
Examples
:View<x>:Standard:PHS
None
:View1:Standard:PHS
configures the modulating system according to the PHS standard.
3066 & 3086 3 GHz Real Time Spectrum Analyzer Programmer Manual
2-243
CDMA Polar View Commands
:View<x>:Standard:TETRA (No Query Form)
Configures the modulating system according to the TETRA (Trans-European
Trunked Radio) standard.
Syntax
Arguments
Examples
:View<x>:Standard:TETRA
None
:View1:Standard:TETRA
configures the modulating system according to the TETRA standard.
:View<x>:SymbolRate (?)
Sets or queries the symbol rate for the digital modulation.
Syntax
:View<x>:SymbolRate <value>
:View<x>:SymbolRate?
Arguments
Examples
<value>::=<NR3> ranges 1/s to 30 M/s.
:View1:SymbolRate 8M
sets the symbol rate to 8 M.
:View<x>:Version?
Queries the version of the CDMA Polar View program.
Syntax
Returns
Examples
2-244
:View<x>:Version?
<NR2>
:View1:Version?
might return 1.1.
3066 & 3086 3 GHz Real Time Spectrum Analyzer Programmer Manual
CDMA Polar View Commands
:View<x>:Z (?)
Specifies or queries the displayed frame number.
Syntax
:View<x>:Z <value>
:View<x>:Z?
Arguments
Examples
<value>::=<NR1> ranges from 0 to the number of frames – 1.
:View1:Z 199
specifies that the frame 199 displays.
3066 & 3086 3 GHz Real Time Spectrum Analyzer Programmer Manual
2-245
CDMA Polar View Commands
2-246
3066 & 3086 3 GHz Real Time Spectrum Analyzer Programmer Manual
CDMA Time View Commands
When you select CDMATime in the :Config:View<x> command, use the
commands in this section to control the CDMA Time view.
3066 & 3086 3 GHz Real Time Spectrum Analyzer Programmer Manual
2-247
CDMA Time View Commands
:View<x>:Average:Times (?)
Sets or queries the number of frames that make up an averaged waveform.
Syntax
:View<x>:Average:Times <value>
:View<x>:Average:Times?
Arguments
Examples
<value>::=<NR1> is the number of frames for averaging, from 1 to 1000.
:View1:Average:Times 1000
specifies that an averaged waveform will show the result of combining 1000
frames.
:View<x>:Block (?)
Sets or queries the block number.
Syntax
:View<x>:Block <value>
:View<x>:Block?
Arguments
Examples
<value>::=<NR1> ranges from 0 to the number of acquired blocks – 1.
:View1:Block 0
sets the block number to 0.
:View<x>:BreakMeasure (No Query Form)
Stops the Measure function executed with the :View<x>:Measure command.
Syntax
Arguments
Examples
Related Commands
2-248
:View<x>:BreakMeasure
None
:View1:BreakMeasure
stops the Measure function.
:View<x>:Measure
3066 & 3086 3 GHz Real Time Spectrum Analyzer Programmer Manual
CDMA Time View Commands
:View<x>:BreakMeasureData (No Query Form)
Stops the Measure Data function executed with the :View<x>:MeasureData
command.
Syntax
Arguments
Examples
Related Commands
:View<x>:BreakMeasureData
None
:View1:BreakMeasureData
stops the Measure Data function.
:View<x>:MeasureData
:View<x>:Executing? (Query Only)
Queries whether the analyzer is executing the :View<x>:Measure or
:View<x>:MeasureData command.
Syntax
Returns
:View<x>:Executing?
On indicates that the analyzer is executing the :View<x>:Measure or
:View<x>:MeasureData command.
Off indicates that the analyzer stops executing the :View<x>:Measure or
:View<x>:MeasureData command.
Examples
Related Commands
:View1:Executing?
might return On, indicating that the analyzer is executing the :View<x>:Measure
or :View<x>:MeasureData command.
:View<x>:Measure, :View<x>:MeasureData
3066 & 3086 3 GHz Real Time Spectrum Analyzer Programmer Manual
2-249
CDMA Time View Commands
:View<x>:Marker:DeltaMarker (?)
Turns the delta marker on or off.
Syntax
:View<x>:Marker:DeltaMarker { On | Off }
:View<x>:Marker:DeltaMarker?
Arguments
On turns the delta marker on.
Off turns the delta marker off.
Examples
Related Commands
:View1:Marker:DeltaMarker On
turns the delta marker on.
:View<x>:Marker:DeltaX, :View<x>:Marker:DeltaY?,
:View<x>:Marker:ResetDelta
:View<x>:Marker:DeltaX (?)
Sets or queries the horizontal position of the delta marker.
Syntax
:View<x>:Marker:DeltaX <value>
:View<x>:Marker:DeltaX?
Arguments
Examples
Related Commands
2-250
<value>::=<NR3> ranges from the minimum (left) edge to the maximum (right)
edge of the the horizontal axis.
:View1:Marker:DeltaX 5u
positions the delta marker at 5 ms.
:View<x>:Marker:DeltaY?
3066 & 3086 3 GHz Real Time Spectrum Analyzer Programmer Manual
CDMA Time View Commands
:View<x>:Marker:DeltaY? (Query Only)
Queries the vertical position of the delta marker.
Syntax
Returns
Examples
Related Commands
:View<x>:Marker:DeltaY?
<NR3>
:View1:Marker:DeltaY?
might return -50.23, indicating that the delta marker is positioned
at –50.23 dBm.
:View<x>:Marker:DeltaX
:View<x>:Marker:Peak (No Query Form)
Moves the marker to the adjacent peak in the specified direction. Note that the
adjacent peak is farther than the distance specified with the :View<x>:Marker
:SearchSeparation command.
Syntax
Arguments
:View<x>:Marker:Peak { 1 | -1 }
1 moves the marker to the adjacent peak on the left of the marker.
-1 moves the marker to the adjacent peak on the right of the marker.
Examples
Related Commands
:View1:Marker:Peak -1
moves the marker to the adjacent peak on the right of the marker.
:View<x>:Marker:SearchMax, :View<x>:Marker:SearchMin,
:View<x>:Marker:SearchSeparation
3066 & 3086 3 GHz Real Time Spectrum Analyzer Programmer Manual
2-251
CDMA Time View Commands
:View<x>:Marker:ResetDelta (No Query Form)
Moves the delta marker to the main marker position.
Syntax
Arguments
Examples
Related Commands
:View<x>:Marker:ResetDelta
None
:View1:Marker:ResetDelta
moves the delta marker to the main marker position.
:View<x>:Marker:DeltaMarker
:View<x>:Marker:SearchMax (No Query Form)
Positions the marker on the highest signal on screen.
Syntax
Arguments
Examples
Related Commands
2-252
:View<x>:Marker:SearchMax
None
:View1:Marker:SearchMax
positions the marker on the highest signal on screen.
:View<x>:Marker:SearchMin
3066 & 3086 3 GHz Real Time Spectrum Analyzer Programmer Manual
CDMA Time View Commands
:View<x>:Marker:SearchMin (No Query Form)
Positions the marker on the lowest signal on screen.
Syntax
Arguments
Examples
Related Commands
:View<x>:Marker:SearchMin
None
:View1:Marker:SearchMin
positions the marker on the lowest signal on screen.
:View<x>:Marker:SearchMax
:View<x>:Marker:SearchSeparation (?)
Sets or queries the minimum horizontal distance to separate two peaks.
Syntax
:View<x>:Marker:SearchSeparation <value>
Arguments
<value>::=<NR2> specifies the minimum horizontal distance to separate two
peaks. The range is 1 to 10 % relative to full-scale.
Examples
:View1:Marker:SearchSeparation 10
sets the minimum horizontal distance for peak separation to 10 % relative to
full-scale.
3066 & 3086 3 GHz Real Time Spectrum Analyzer Programmer Manual
2-253
CDMA Time View Commands
:View<x>:Marker:X (?)
Sets or queries the horizontal position of the marker.
Syntax
:View<x>:Marker:X <value>
:View<x>:Marker:X?
Arguments
Examples
Related Commands
<value>::=<NR3> ranges from the minimum (left) edge to the maximum (right)
edge of the the horizontal axis.
:View1:Marker:X 5u
positions the marker at 5 ms.
:View<x>:Marker:Y?
:View<x>:Marker:Y? (Query Only)
Queries the vertical position of the marker.
Syntax
Returns
Examples
Related Commands
2-254
:View<x>:Marker:Y?
<NR3>
:View1:Marker:Y?
might return -50.23, indicating that the marker is positioned at –50.23 dBm.
:View<x>:Marker:X
3066 & 3086 3 GHz Real Time Spectrum Analyzer Programmer Manual
CDMA Time View Commands
:View<x>:Mask:OffLeft (?)
Sets or queries the mask time just before the rising edge of waveform
(see Figure 2–9).
Syntax
:View<x>:Mask:OffLeft <value>
:View<x>:Mask:OffLeft?
Arguments
Examples
Related Commands
<value>::=<NR3> ranges 0 to 1.6 ms.
:View1:Mask:OffLeft 0.2m
sets the mask time just before the rising edge of waveform to 0.2 ms.
:View<x>:Mask:OffRight
:View<x>:Mask:OffLevel (?)
Sets or queries the mask level for the off state (see Figure 2–9).
Syntax
:View<x>:Mask:OffLevel <value>
:View<x>:Mask:OffLevel?
Arguments
Examples
Related Commands
<value>::=<NR3> ranges –100 dB to 0 dB.
:View1:Mask:OffLevel -60
sets the mask level for the off state to –60 dB.
:View<x>:Mask:OnLevel
3066 & 3086 3 GHz Real Time Spectrum Analyzer Programmer Manual
2-255
CDMA Time View Commands
:View<x>:Mask:OffRight (?)
Sets or queries the mask time just after the falling edge of waveform
(see Figure 2–9).
Syntax
:View<x>:Mask:OffRight <value>
:View<x>:Mask:OffRight?
Arguments
Examples
Related Commands
<value>::=<NR3> ranges 0 to 1.6 ms.
:View1:Mask:OffRight 1.2m
sets the mask time just after the falling edge of waveform to 1.2 ms.
:View<x>:Mask:OffLeft
:View<x>:Mask:OffLeft
:View<x>:Mask:OffRighft
:View<x>:Mask:OnLevel
:View<x>:Mask:OffLevel
:View<x>:Mask:OnLeft
:View<x>:Mask:OnRight
Figure 2-9: Setting the trigger mask
2-256
3066 & 3086 3 GHz Real Time Spectrum Analyzer Programmer Manual
CDMA Time View Commands
:View<x>:Mask:OnLeft (?)
Sets or queries the mask time just after the rising edge of waveform
(see Figure 2–9).
Syntax
:View<x>:Mask:OnLeft <value>
:View<x>:Mask:OnLeft?
Arguments
Examples
Related Commands
<value>::=<NR3> ranges 0 to 1.6 ms.
:View1:Mask:OnLeft 0.8m
sets the mask time just after the rising edge of waveform to 0.8 ms.
:View<x>:Mask:OnLeft
:View<x>:Mask:OnLevel (?)
Sets or queries the mask level for the on state (see Figure 2–9).
Syntax
:View<x>:Mask:OnLevel <value>
:View<x>:Mask:OnLevel?
Arguments
Examples
Related Commands
<value>::=<NR3> ranges –100 dB to 0 dB.
:View1:Mask:OnLevel -30
sets the mask level for the on state to –30 dB.
:View<x>:Mask:OffLevel
3066 & 3086 3 GHz Real Time Spectrum Analyzer Programmer Manual
2-257
CDMA Time View Commands
:View<x>:Mask:OnRight (?)
Sets or queries the mask time just before the falling edge of waveform
(see Figure 2–9).
Syntax
:View<x>:Mask:OnRight <value>
:View<x>:Mask:OnRight?
Arguments
Examples
Related Commands
2-258
<value>::=<NR3> ranges 0 to 1.6 ms.
:View1:Mask:OnRight 1.2m
sets the mask time just before the falling edge of waveform to 1.2 ms.
:View<x>:Mask:OnLeft
3066 & 3086 3 GHz Real Time Spectrum Analyzer Programmer Manual
CDMA Time View Commands
:View<x>:Measure (No Query Form)
Measures the CDMA time characteristics of the input signal. The Pass/Fail
decision is made by comparing the averaged waveform with the mask settings.
The analyzer executes this command on the background. Use the
:View<x>:Executing? query command to check if the :View<x>:Measure
command is in operation.
Syntax
Arguments
Examples
Related Commands
:View<x>:Measure
None
:View1:Measure
measures the input signal and performs the Pass/Fail test.
:View<x>:Average:Times, :View<x>:Mask command group,
:View<x>:MeasureData, :View<x>:Executing?
:View<x>:MeasureData (No Query Form)
Measures the CDMA time characteristics of the waveforms already stored in
memory, such as loaded from a file. The Pass/Fail decision is made by comparing the averaged waveform with the mask settings.
The analyzer executes this command on the background. Use the
:View<x>:Executing? query command to check if the :View<x>:Measure
command is in operation.
Syntax
Arguments
Examples
Related Commands
:View<x>:MeasureData
None
:View1:MeasureData
measures the stored waveforms and performs the Pass/Fail test.
:View<x>:Average:Times, :View<x>:Mask command group,
:View<x>:Measure, :View<x>:Executing?
3066 & 3086 3 GHz Real Time Spectrum Analyzer Programmer Manual
2-259
CDMA Time View Commands
:View<x>:Position (?)
Specifies or queries which frame in a block to be displayed.
Syntax
:View<x>:Position <value>
:View<x>:Position?
Arguments
Examples
<value>::=<NR2> ranges 0 to 100 %. It specifies the display frame position
relative to the block size. 0 % specifies that the first frame in a block is
displayed. 100 % represents the last frame.
:View1:Position 100
displays the last frame in a block.
:View<x>:Result<y>? (Query Only)
Queries the measurement result.
Syntax
Returns
:View<x>:Result<y>?
Result1::=<NR3> returns the number of averages.
Result2::=<NR3> returns the average power of the on state.
Result3::=<NR3> returns the average power of the off state.
Result4::=<NR3> returns the on/off power ratio.
Result5::={ Pass | Fail } returns the result of spurious test.
Examples
Related Commands
2-260
:View1:Result2?
returns -17.635, indicating the average power of the on state is –17.635 dB.
:View<x>:Measure, :View<x>:MeasureData
3066 & 3086 3 GHz Real Time Spectrum Analyzer Programmer Manual
CDMA Time View Commands
:View<x>:Scale:FallingEdge (No Query Form)
Expands the falling edge of the waveform on screen.
Syntax
Arguments
Examples
Related Commands
:View<x>:Scale:FallingEdge
None
:View1:Scale:FallingEdge
expands the falling edge of the waveform on screen.
:View<x>:Scale:RisingEdge
:View<x>:Scale:FullScale (No Query Form)
Displays the whole waveform.
Syntax
Arguments
Examples
Related Commands
:View<x>:Scale:FullScale
None
:View1:Scale:FullScale
displays the whole waveform.
:View<x>:Scale:RisingEdge, :View<x>:Scale:FallingEdge
3066 & 3086 3 GHz Real Time Spectrum Analyzer Programmer Manual
2-261
CDMA Time View Commands
:View<x>:Scale:HoldYScale (?)
Determines whether to hold or reset the vertical scale when you change the input
source.
Syntax
:View<x>:Scale:HoldYScale { On | Off }
:View<x>:Scale:HoldYScale?
Arguments
On holds the vertical scale setting when you change the input source.
Off resets the vertical scale to full-scale.
Examples
Related Commands
:View1:Scale:HoldYScale On
holds the vertical scale setting when you change the input source.
:View<x>:Scale:YScale, :View<x>:Scale:YStart, :View<x>:Source
:View<x>:Scale:RisingEdge (No Query Form)
Expands the rising edge of the waveform on screen.
Syntax
Arguments
Examples
Related Commands
2-262
:View<x>:Scale:RisingEdge
None
:View1:Scale:RisingEdge
expands the rising edge of the waveform on screen.
:View<x>:Scale:FallingEdge
3066 & 3086 3 GHz Real Time Spectrum Analyzer Programmer Manual
CDMA Time View Commands
:View<x>:Scale:XScale (?)
Sets or queries the horizontal axis full-scale to display a portion of the data.
Syntax
:View<x>:Scale:XScale <value>
:View<x>:Scale:XScale?
Arguments
Examples
Related Commands
<value>::=<NR3> ranges full-scale/256 to full-scale of the acquired data.
:View1:Scale:XScale 800u
sets the horizontal axis full-scale to 800 ms.
:View<x>:Scale:XStart, :View<x>:Scale:YScale
:View<x>:Scale:XStart (?)
Sets or queries the value represented by the minimum (left) edge of the
horizontal axis.
Syntax
:View<x>:Scale:XStart <value>
:View<x>:Scale:XStart?
Arguments
<value>::=<NR3> ranges from the minimum to the maximum value on the
horizontal axis of the acquired data.
Examples
:View1:Scale:XStart 100u
sets the value represented by the left edge of the horizontal axis to 100 ms.
Related Commands
:View<x>:Scale:XScale
3066 & 3086 3 GHz Real Time Spectrum Analyzer Programmer Manual
2-263
CDMA Time View Commands
:View<x>:Scale:YScale (?)
Sets or queries the vertical axis full-scale to display a portion of the data.
Syntax
:View<x>:Scale:YScale <value>
:View<x>:Scale:YScale?
Arguments
Examples
Related Commands
<value>::=<NR3> ranges full-scale/100 to full-scale of the acquired data.
:View1:Scale:YScale 20
sets the vertical axis full-scale to 20 dB.
:View<x>:Scale:XScale
:View<x>:Scale:YStart (?)
Sets or queries the value represented by the minimum (bottom) edge of the
vertical axis.
Syntax
:View<x>:Scale:YStart <value>
:View<x>:Scale:YStart?
Arguments
<value>::=<NR3> ranges from the reference level – 200 dB to the reference
level + 100 dB.
Examples
:View1:Scale:YStart -120
sets the value represented by the bottom edge of the vertical axis to –120 dB.
Related Commands
2-264
:View<x>:Scale:YScale
3066 & 3086 3 GHz Real Time Spectrum Analyzer Programmer Manual
CDMA Time View Commands
:View<x>:Source (?)
Selects or queries the display data source for the specified view.
Syntax
:View<x>:Source { None | Active | Zoom | <file_name> }
:View<x>:Source?
Arguments
None specifies no source. The display area in the view will be emptied.
Active specifies the currently acquired data as the source.
Zoom specifies the zoomed data as the source.
<file_name>::=<string> specifies the file as the source. The file name must
be “*.IQ” (the IQ format).
Examples
Related Commands
:View1:Source Active
specifies the currently acquired data as the source.
:Config:Mode
:View<x>:Trace2:TraceVisible (?)
Determines whether or not to display the Trace 2 (averaged waveform).
Syntax
:View<x>:Trace2:TraceVisible { On | Off }
:View<x>:Trace2:TraceVisible?
Arguments
On displays the Trace 2 (averaged waveform).
Off does not display the Trace 2.
Examples
Related Commands
:View1:Trace2:TraceVisible On
displays the Trace 2.
:View<x>:TraceVisible
3066 & 3086 3 GHz Real Time Spectrum Analyzer Programmer Manual
2-265
CDMA Time View Commands
:View<x>:TraceVisible (?)
Determines whether or not to display the Trace 1 (acquired waveform).
Syntax
:View<x>:TraceVisible { On | Off }
:View<x>:TraceVisible?
Arguments
On displays the Trace 1 (acquired waveform).
Off does not display the Trace 1.
Examples
Related Commands
:View1:TraceVisible On
displays the Trace 1.
:View<x>:Trace2:TraceVisible
:View<x>:Version? (Query Only)
Queries the version of the CDMA Time View program.
Syntax
Returns
Examples
2-266
:View<x>:Version?
<NR2>
:View1:Version?
might return 1.1.
3066 & 3086 3 GHz Real Time Spectrum Analyzer Programmer Manual
CodeSpectrogram View Commands
(3066 Option 15 and 3086 Option 16 Only)
When you select CodeSpectrogram in the Config:View<x> command, use the
commands in this section to control the code-domain power spectrogram view.
This view incorporates analysis functions for the cdmaOne standard.
3066 & 3086 3 GHz Real Time Spectrum Analyzer Programmer Manual
2-267
CodeSpectrogram View Commands (3066 Option 15 and 3086 Option 16 Only)
:View<x>:Marker:DeltaMarker (?)
Turns the delta marker on or off.
Syntax
:View<x>:Marker:DeltaMarker { On | Off }
:View<x>:Marker:DeltaMarker?
Arguments
On turns the delta marker on.
Off turns the delta marker off
Examples
Related Commands
:View1:Marker:DeltaMarker On
turns the delta marker on.
:View<x>:Marker:ResetDelta
:View<x>:Marker:ResetDelta (No Query Form)
Moves the delta marker to the main marker position.
Syntax
Arguments
Examples
Related Commands
2-268
:View<x>:Marker:ResetDelta
None
:View1:Marker:ResetDelta
:View<x>:Marker:DeltaMarker
3066 & 3086 3 GHz Real Time Spectrum Analyzer Programmer Manual
CodeSpectrogram View Commands (3066 Option 15 and 3086 Option 16 Only)
:View<x>:Marker:SearchMax (No Query Form)
Positions the marker on the highest signal on screen.
Syntax
Arguments
Examples
Related Commands
:View<x>:Marker:SearchMax
None
:View1:Marker:SearchMax
positions the marker on the highest signal on screen.
:View<x>:Marker:SearchMin
:View<x>:Marker:SearchMin (No Query Form)
Positions the marker on the lowest signal on screen.
Syntax
Arguments
Examples
Related Commands
:View<x>:Marker:SearchMin
None
:View1:Marker:SearchMin
positions the marker on the lowest signal on screen.
:View<x>:Marker:SearchMax
3066 & 3086 3 GHz Real Time Spectrum Analyzer Programmer Manual
2-269
CodeSpectrogram View Commands (3066 Option 15 and 3086 Option 16 Only)
:View<x>:Marker:SearchSeparation (?)
Sets or queries the minimum horizontal distance to separate two peaks.
Syntax
:View<x>:Marker:SearchSeparation <value>
Arguments
<value>::=<NR2> specifies the minimum horizontal distance to separate two
peaks. The range is 1 to 10 % relative to full-scale.
Examples
:View1:Marker:SearchSeparation 10
sets the minimum horizontal distance for peak separation to 10 % relative to
full-scale.
Related Commands
:View<x>:Scale:XScale
:View<x>:Marker:X (?)
Sets or queries the horizontal position of the marker.
Syntax
:View<x>:Marker:X <value>
:View<x>:Marker:X?
Arguments
Examples
Related Commands
2-270
<value>::=<NR3> ranges from the minimum (left) edge to the maximum (right)
edge of the the horizontal axis (channel).
:View1:Marker:X 32
positions the marker at channel 32.
:View<x>:Marker:Z, :View<x>:Scale:XScale, :View<x>:Scale:XStart
3066 & 3086 3 GHz Real Time Spectrum Analyzer Programmer Manual
CodeSpectrogram View Commands (3066 Option 15 and 3086 Option 16 Only)
:View<x>:Marker:Z (?)
Sets or queries the marker position on the vertical (symbol number) axis.
Syntax
:View<x>:Marker:Z <value>
:View<x>:Marker:Z?
Arguments
Examples
Related Commands
<value>::=<NR1> ranges 0 to the number of symbols – 1.
:View1:Marker:Z 199
positions the marker at the symbol number 199.
:View<x>:Marker:X, :View<x>:Scale:ZScale, :View<x>:Scale:ZStart
:View<x>:Monochrome (?)
Determines whether to display a spectrogram in monochrome.
Syntax
:View<x>:Monochrome { On | Off }
:View<x>:Monochrome?
Arguments
On displays a spectrogram in monochrome.
Off displays a spectrogram in color.
Examples
:View1:Monochrome On
displays a spectrogram in monochrome.
3066 & 3086 3 GHz Real Time Spectrum Analyzer Programmer Manual
2-271
CodeSpectrogram View Commands (3066 Option 15 and 3086 Option 16 Only)
:View<x>:NumberColors (?)
Selects or queries the number of display colors.
Syntax
:View<x>:NumberColors { 10 | 100 }
:View<x>:NumberColors?
Arguments
10 selects the 10-color display.
100 selects the 100-color display (default).
Examples
Related Commands
:View1:NumberColors 100
selects the 100-color display.
:View<x>:Scale:YScale, :View<x>:Scale:YStart
:View<x>:Scale:AutoScale (No Query Form)
Resets the Y (color) axis scale to the default setting.
Syntax
Arguments
Examples
Related Commands
2-272
:View<x>:Scale:AutoScale
None
:View1:Scale:AutoScale
resets the Y (color) axis scale to the default setting.
:View<x>:Scale:YScale
3066 & 3086 3 GHz Real Time Spectrum Analyzer Programmer Manual
CodeSpectrogram View Commands (3066 Option 15 and 3086 Option 16 Only)
:View<x>:Scale:XScale (?)
Sets or queries the horizontal axis (channel) full-scale to display a portion of
data.
Syntax
:View<x>:Scale:XScale <value>
:View<x>:Scale:XScale?
Arguments
Examples
Related Commands
<value>::=<NR1> ranges 16 to 64 channels.
:View1:Scale:XScale 64
sets the horizontal axis full-scale to 64 channels.
:View<x>:Scale:XStart, :View<x>:Scale:YScale, :View<x>:Scale:ZScale
:View<x>:Scale:XStart (?)
Sets or queries the value represented by the minimum (left) edge of the
horizontal axis (channel).
Syntax
:View<x>:Scale:XStart <value>
:View<x>:Scale:XStart?
Arguments
Examples
Related Commands
<value>::=<NR1> ranges from 0 to 64 – (the horizontal axis full-scale)
channels.
:View1:Scale:XStart 0
sets the value represented by the left edge of the horizontal axis to channel 0.
:View<x>:Scale:XScale
3066 & 3086 3 GHz Real Time Spectrum Analyzer Programmer Manual
2-273
CodeSpectrogram View Commands (3066 Option 15 and 3086 Option 16 Only)
:View<x>:Scale:YScale (?)
Sets or queries the Y (color) axis full-scale to display a portion of data.
Syntax
:View<x>:Scale:YScale <value>
:View<x>:Scale:YScale?
Arguments
Examples
Related Commands
<value>::=<NR3> is 10, 20, 50, or 100 dB.
:View1:Scale:YScale 50
sets the Y axis full-scale to 50 dB.
:View<x>:Scale:XScale, :View<x>:Scale:YStart, :View<x>:Scale:ZScale
:View<x>:Scale:YStart (?)
Sets or queries the value represented by the minimum (bottom) edge of the Y
(color) axis.
Syntax
:View<x>:Scale:YStart <value>
:View<x>:Scale:YStart?
Arguments
<value>::=<NR3> ranges from ref level – 200 dB to ref level + 100 dB
– horizontal axis full-scale.
Examples
:View1:Scale:YStart -50
sets the value represented by the bottom edge of the Y axis to –50 dBm.
Related Commands
2-274
:View<x>:Scale:YScale
3066 & 3086 3 GHz Real Time Spectrum Analyzer Programmer Manual
CodeSpectrogram View Commands (3066 Option 15 and 3086 Option 16 Only)
:View<x>:Scale:ZScale (?)
Sets or queries the symbol display interval. The spectrogram is displayed every
specified number of symbols.
Syntax
:View<x>:Scale:ZScale <value>
:View<x>:Scale:ZScale?
Arguments
Examples
Related Commands
<value>::=<NR1> ranges 1 to 32.
1 means every symbol is displayed. 32 means every 32th symbol is displayed.
:View1:Scale:ZScale 8
displays a spectrogram every 8th symbol.
:View<x>:Scale:XScale, :View<x>:Scale:YScale, :View<x>:Scale:ZStart
:View<x>:Scale:ZStart (?)
Sets or queries the value represented by the minimum (bottom) edge of the Z
(symbol number) axis, i.e. the first symbol to be displayed.
Syntax
:View<x>:Scale:ZStart <value>
:View<x>:Scale:ZStart?
Arguments
Examples
Related Commands
<value>::=<NR1> ranges 0 to the number of symbols – 1.
:View1:Scale:ZStart 20
sets the value represented by the bottom edge of the Z axis to 20.
:View<x>:Scale:ZScale
3066 & 3086 3 GHz Real Time Spectrum Analyzer Programmer Manual
2-275
CodeSpectrogram View Commands (3066 Option 15 and 3086 Option 16 Only)
:View<x>:Version? (Query Only)
Queries the version of the CodeSpectrogram View program.
Syntax
Returns
Examples
:View<x>:Version?
<NR2>
:View1:Version?
might return 1.1.
:View<x>:ZGap (?)
Sets or queries the display interval between two adjacent symbols on the Z
(symbol number) axis on screen.
Syntax
:View<x>:ZGap <value>
:View<x>:ZGap?
Arguments
Examples
2-276
<value>::=<NR1> ranges 1 to 10 pixels.
:View1:ZGap 10
sets the display interval between two adjacent symbols on the Z axis to 10
pixels.
3066 & 3086 3 GHz Real Time Spectrum Analyzer Programmer Manual
CodePolar View Commands
(3066 Option 15 and 3086 Option 16 Only)
When you select CodePolar in the :Config:View<x> command, use the
commands in this section to control the polar view. This view incorporates
analysis functions for the cdmaOne standard.
For information on the polar view, refer to the User Manual.
3066 & 3086 3 GHz Real Time Spectrum Analyzer Programmer Manual
2-277
CodePolar View Commands (3066 Option 15 and 3086 Option 16 Only)
:View<x>:AlphaBT (?)
Sets or queries the a/BT value.
Syntax
:View<x>:AlphaBT <value>
:View<x>:AlphaBT?
Arguments
Examples
<value>::=<NR2> ranges 0.0001 to 1.
:View1:AlphaBT 1
sets the a/BT value to 1.
:View<x>:Analysis:TimeSlot (?)
Specifies or queries the symbol number to display the constellation.
Syntax
:View<x>:Analysis:TimeSlot <value>
:View<x>:Analysis:TimeSlot?
Arguments
Examples
<value>::=<NR1> ranges 0 to the number of symbols – 1.
:View1:Analysis:TimeSlot 1
sets the symbol number to 1.
:View<x>:Analyze (No Query Form)
Performs analysis on the background for all symbols acquired.
Syntax
Arguments
Examples
Related Commands
2-278
:View<x>:Analyze
None
:View1:Analyze
performs analysis on the background for all symbols acquired.
:View<x>:BreakAnalyze
3066 & 3086 3 GHz Real Time Spectrum Analyzer Programmer Manual
CodePolar View Commands (3066 Option 15 and 3086 Option 16 Only)
:View<x>:AutoCarrier (?)
Determines whether to search the carrier automatically for each frame.
Syntax
:View<x>:AutoCarrier { On | Off }
:View<x>:AutoCarrier?
Arguments
On searches the carrier automatically for each frame, and displays the frequency
error in reference to the center frequency on screen at Freq Error.
Off sets the carrier frequency to the value specified with the :View<x>:Carrier
command.
Examples
Related Commands
:View1:AutoCarrier On
searches the carrier automatically and displays the frequency error.
:View<x>:Carrier
:View<x>:BreakAnalyze (No Query Form)
Breaks the analysis executed by the :View<x>:Analyze command.
Syntax
Arguments
:View<x>:BreakAnalyze
None
Examples
:View1:Analyze
breaks the analysis.
Related Commands
:View<x>:Analyze
3066 & 3086 3 GHz Real Time Spectrum Analyzer Programmer Manual
2-279
CodePolar View Commands (3066 Option 15 and 3086 Option 16 Only)
:View<x>:Carrier (?)
Sets or queries the carrier frequency.
Syntax
:View<x>:Carrier <value>
:View<x>:Carrier?
Arguments
Examples
Related Commands
<value>::=<NR3> ranges 0 Hz to 3 GHz.
:View1:Carrier 1.2G
sets the carrier frequency to 1.2 GHz.
:View<x>:AutoCarrier
:View<x>:Display (?)
Selects or queries the display data source.
Syntax
:View<x>:Display { Measurement | Reference }
:View<x>:Display?
Arguments
Measurement displays the measurement data.
Reference displays the reference data.
Refer to the User Manual on the measurement and reference data.
Examples
Related Commands
2-280
:View1:Display Measurement
displays the measurement data.
:View<x>:MeasFilter, :View<x>:RefFilter
3066 & 3086 3 GHz Real Time Spectrum Analyzer Programmer Manual
CodePolar View Commands (3066 Option 15 and 3086 Option 16 Only)
:View<x>:Format (?)
Selects or queries the waveform display format.
Syntax
:View<x>:Format { Vector | Constellation }
:View<x>:Format?
Arguments
Vector specifies the Vector format. It displays symbol-to-symbol movements
using vector.
Constellation specifies the Constellation format. It displays only symbols.
Examples
:View1:Format Vector
selects the Vector display format.
:View<x>:Marker:T (?)
Sets or queries the marker position on the time axis.
Syntax
:View<x>:Marker:T <value>
:View<x>:Marker:T?
Arguments
Examples
<value>::=<NR3> ranges 0 to the time length of the acquisition data.
:View1:Marker:T 5.4u
positions the marker at 5.4 ms.
3066 & 3086 3 GHz Real Time Spectrum Analyzer Programmer Manual
2-281
CodePolar View Commands (3066 Option 15 and 3086 Option 16 Only)
:View<x>:MeasFilter (?)
Selects or queries the filter to create the measurement data.
Syntax
:View<x>:MeasFilter { None | RootRaisedCosine }
:View<x>:MeasFilter?
Arguments
None selects no filter.
RootRaisedCosine selects the root raised-cosine filter.
Examples
Related Commands
:View1:MeasFilter RootRaisedCosine
selects the root raised-cosine filter to create the measurement data.
:View<x>:RefFilter
:View<x>:Modulation (?)
Selects or queries the modulation type.
Syntax
:View<x>:Modulation { IS95 | IS95+EQ }
:View<x>:Modulation?
Arguments
IS95 selects the modulation without the equalizer according to the IS-95
standard.
IS95+EQ selects the modulation with the equalizer according to the IS-95
standard.
Examples
2-282
:View1:Modulation IS95+EQ
selects the modulation with the equalizer according to the IS-95 standard.
3066 & 3086 3 GHz Real Time Spectrum Analyzer Programmer Manual
CodePolar View Commands (3066 Option 15 and 3086 Option 16 Only)
:View<x>:RefFilter (?)
Selects or queries the filter to create the reference data.
Syntax
:View<x>:RefFilter { None | RaisedCosine | Gaussian | IS95 }
:View<x>:RefFilter?
Arguments
None selects no filter.
RaisedCosine selects the raised cosine filter.
Gaussian selects the Gaussian filter.
IS95 selects the IS-95 filter.
Examples
Related Commands
:View1:RefFilter RaisedCosine
selects the raised cosine filter to create the reference data.
:View<x>:MeasFilter
:View<x>:Source (?)
Selects or queries the input data source for the view.
Syntax
:View<x>:Source { None | Active | Zoom | <file_name> }
:View<x>:Source?
Arguments
None specifies no source. The display area in the view will be emptied.
Active specifies the currently acquired data as the source.
Zoom specifies the zoomed data as the source.
<file_name>::=<string> specifies the data file as the source. The file name
must be “*.IQ” (the IQ format).
Examples
:View1:Source Active
specifies the currently acquired data as the source.
3066 & 3086 3 GHz Real Time Spectrum Analyzer Programmer Manual
2-283
CodePolar View Commands (3066 Option 15 and 3086 Option 16 Only)
:View<x>:Standard:IS95 (No Query Form)
Configures the modulating system without the equalizer according to the IS-95
standard.
Syntax
Arguments
Examples
Related Commands
:View<x>:Standard:IS95
None
:View1:Standard:IS95
configures the modulating system without the equalizer according to the IS-95
standard.
:View<x>:Standard:IS95EQ
:View<x>:Standard:IS95EQ (No Query Form)
Configures the modulating system with the equalizer according to the IS-95
standard.
Syntax
Arguments
Examples
Related Commands
2-284
:View<x>:Standard:IS95EQ
None
:View1:Standard:IS95EQ
configures the modulating system with the equalizer according to the IS-95
standard.
:View<x>:Standard:IS95
3066 & 3086 3 GHz Real Time Spectrum Analyzer Programmer Manual
CodePolar View Commands (3066 Option 15 and 3086 Option 16 Only)
:View<x>:SymbolRate (?)
Sets or queries the chip rate.
Syntax
:View<x>:SymbolRate <value>
:View<x>:SymbolRate?
Arguments
Examples
<value>::=<NR3> ranges 1/s to 30 M/s.
:View1:SymbolRate 8M
sets the chip rate to 8 M/s.
:View<x>:Version? (Query Only)
Queries the version of the CodePolar View program.
Syntax
Returns
Examples
:View<x>:Version?
<NR2>
:View1:Version?
might return 1.1.
3066 & 3086 3 GHz Real Time Spectrum Analyzer Programmer Manual
2-285
CodePolar View Commands (3066 Option 15 and 3086 Option 16 Only)
2-286
3066 & 3086 3 GHz Real Time Spectrum Analyzer Programmer Manual
CodePower View Commands
(3066 Option 15 and 3086 Option 16 Only)
When you select CodePower in the Config:View<x> command, use the
commands in this section to set the details for the code-domain power view.
This view incorporates analysis functions for the cdmaOne standard.
3066 & 3086 3 GHz Real Time Spectrum Analyzer Programmer Manual
2-287
CodePower View Commands (3066 Option 15 and 3086 Option 16 Only)
:View<x>:Average (?)
Determines whether or not to display the results of averaging on the analyzer
screen.
Syntax
:View<x>:Average { On | Off }
:View<x>:Average?
Arguments
On displays the results of averaging. The averaged power is displayed for each
channel with a bar graph.
Off hides the results of averaging.
Examples
Related Commands
:View1:Average On
displays the results of averaging.
:View<x>:Average:Execute
:View<x>:Average:AllFrames (No Query Form)
Specifies that all of the acquired symbol data are used for averaging.
Syntax
Arguments
Examples
Related Commands
2-288
:View<x>:AllFrames
None
:View1:AllFrames
specifies that all of acquired symbol data are used for averaging.
:View<x>:Average:BeginZ, :View<x>:Average:EndZ
3066 & 3086 3 GHz Real Time Spectrum Analyzer Programmer Manual
CodePower View Commands (3066 Option 15 and 3086 Option 16 Only)
:View<x>:Average:BeginZ (?)
Sets or queries the uppermost symbol in the average range.
Syntax
:View<x>:Average:BeginZ <value>
:View<x>:Average:BeginZ?
Arguments
Examples
Related Commands
<value>::=<NR1> ranges 0 to the number of symbols – 1.
:View1:Average:BeginZ 199
sets the uppermost symbol number to 199.
:View<x>:Average:EndZ
:View<x>:Average:EndZ (?)
Sets or queries the lowermost symbol in the average range.
Syntax
:View<x>:Average:EndZ <value>
:View<x>:Average:EndZ?
Arguments
Examples
Related Commands
<value>::=<NR1> ranges 0 to the number of symbols – 1.
:View1:Average:EndZ 100
sets the lowermost symbol number to 100.
:View<x>:Average:BeginZ
3066 & 3086 3 GHz Real Time Spectrum Analyzer Programmer Manual
2-289
CodePower View Commands (3066 Option 15 and 3086 Option 16 Only)
:View<x>:Average:Execute (No Query Form)
Performs averaging for each bin for symbols in the specified range.
Syntax
Arguments
Examples
Related Commands
:View<x>:Average:Execute
None
:View1:Average:Execute
performs averaging for each bin for symbols in the specified range.
:View<x>:Average:AllFrames, :View<x>:Average:BeginZ,
:View<x>:Average:EndZ
:View<x>:Average:MarkerToFrame (No Query Form)
Specifies that the symbols between the main marker and the delta marker are
averaged.
Syntax
Arguments
Examples
Related Commands
2-290
:View<x>:MarkerToFrame
None
:View<x>:MarkerToFrame
specifies that the symbols between the main marker and the delta marker are
averaged.
:View<x>:Average:BeginZ, :View<x>:Average:EndZ
3066 & 3086 3 GHz Real Time Spectrum Analyzer Programmer Manual
CodePower View Commands (3066 Option 15 and 3086 Option 16 Only)
:View<x>:Average:Times (?)
Sets or queries the number of waveform acquisitions that make up an averaged
waveform.
Syntax
:View<x>:Average:Times <value>
:View<x>:Average:Times?
Arguments
Examples
Related Commands
<value>::=<NR1> ranges 1 to 1,000,000.
:View1:Average:Times 1000
specifies that an averaged waveform will show the result of combining 1000
separately acquired waveforms.
:View<x>:Average:Type
:View<x>:Average:Type (?)
Selects or queries the average type. You can also select the peak hold mode.
For more information about averaging, refer to the User Manual.
Syntax
:View<x>:Average:Type { RMSExpo | RMS | MaxHold | MinHold }
:View<x>:Average:Type?
Arguments
RMSExpo averages with the RMS (root mean squared) exponential. This mode
weights older acquisition data so that they have a progressively smaller effect on
the average.
RMS averages with the RMS (root mean squared).
MaxHold holds the maximum value for each data point.
MinHold holds the minimum value for each data point.
Examples
Related Commands
:View1:Average:Type RMSExpo
averages the waveform with the exponential RMS.
:View<x>:Average:Time
3066 & 3086 3 GHz Real Time Spectrum Analyzer Programmer Manual
2-291
CodePower View Commands (3066 Option 15 and 3086 Option 16 Only)
:View<x>:Marker:DeltaMarker (?)
Turns the delta marker on or off.
Syntax
:View<x>:Marker:DeltaMarker { On | Off }
:View<x>:Marker:DeltaMarker?
Arguments
On turns the delta marker on.
Off turns the delta marker off.
Examples
Related Commands
:View1:Marker:DeltaMarker On
turns the delta marker on.
:View<x>:Marker:ResetDelta
:View<x>:Marker:ResetDelta (No Query Form)
Moves the delta marker to the main marker position.
Syntax
Arguments
Examples
Related Commands
:View<x>:Marker:ResetDelta
None
:View1:Marker:ResetDelta
moves the delta marker to the main marker position.
:View<x>:Marker:DeltaMarker
:View<x>:Marker:SearchMax (No Query Form)
Positions the marker on the highest signal on screen.
Syntax
Arguments
2-292
:View<x>:Marker:SearchMax
None
3066 & 3086 3 GHz Real Time Spectrum Analyzer Programmer Manual
CodePower View Commands (3066 Option 15 and 3086 Option 16 Only)
Examples
Related Commands
:View1:Marker:SearchMax
positions the marker on the highest signal on screen.
:View<x>:Marker:SearchMin
:View<x>:Marker:SearchMin (No Query Form)
Positions the marker on the lowest signal on screen.
Syntax
Arguments
Examples
Related Commands
:View<x>:Marker:SearchMin
None
:View1:Marker:SearchMin
positions the marker on the lowest signal on screen.
:View<x>:Marker:SearchMax
:View<x>:Marker:SearchSeparation (?)
Sets or queries the minimum horizontal distance to separate two peaks.
Syntax
:View<x>:Marker:SearchSeparation <value>
Arguments
<value>::=<NR2> specifies the minimum horizontal distance to separate two
peaks. The range is 1 to 10 % relative to full-scale.
Examples
:View1:Marker:SearchSeparation 10
sets the minimum horizontal distance for peak separation to 10 % relative to
full-scale.
Related Commands
:View<x>:Scale:XScale
3066 & 3086 3 GHz Real Time Spectrum Analyzer Programmer Manual
2-293
CodePower View Commands (3066 Option 15 and 3086 Option 16 Only)
:View<x>:Marker:X (?)
Sets or queries the horizontal position of the marker.
Syntax
:View<x>:Marker:X <value>
:View<x>:Marker:X?
Arguments
Examples
Related Commands
<value>::=<NR1> ranges from the minimum (left) edge to the maximum (right)
edge of the the horizontal axis (channel).
:View1:Marker:X 32
positions the marker at channel 32.
:View<x>:Scale:XScale, :View<x>:Scale:XStart
:View<x>:Scale:AutoScale (No Query Form)
Resets the vertical axis (power) to the default setting.
Syntax
Arguments
Examples
Related Commands
2-294
:View<x>:Scale:AutoScale
None
:View1:Scale:AutoScale
resets the vertical axis (power) to the default setting.
:View<x>:Scale:YScale
3066 & 3086 3 GHz Real Time Spectrum Analyzer Programmer Manual
CodePower View Commands (3066 Option 15 and 3086 Option 16 Only)
:View<x>:Scale:XScale (?)
Sets or queries the horizontal axis (channel) full-scale to display a portion of
data.
Syntax
:View<x>:Scale:XScale <value>
:View<x>:Scale:XScale?
Arguments
Examples
Related Commands
<value>::=<NR1> ranges 16 to 64 channels.
:View1:Scale:XScale 64
sets the horizontal axis full-scale to 64 channels.
:View<x>:Scale:XStart, :View<x>:Scale:YScale
:View<x>:Scale:XStart (?)
Sets or queries the value represented by the minimum (left) edge of the
horizontal axis (channel).
Syntax
:View<x>:Scale:XStart <value>
:View<x>:Scale:XStart?
Arguments
Examples
Related Commands
<value>::=<NR1> ranges from 0 to 64 – (the horizontal axis full-scale)
channels.
:View1:Scale:XStart 0
sets the value represented by the left edge of the horizontal axis to 0.
:View<x>:Scale:XScale
3066 & 3086 3 GHz Real Time Spectrum Analyzer Programmer Manual
2-295
CodePower View Commands (3066 Option 15 and 3086 Option 16 Only)
:View<x>:Scale:YScale (?)
Sets or queries the vertical axis (power) full-scale to display a portion of data.
Syntax
:View<x>:Scale:YScale <value>
:View<x>:Scale:YScale?
Arguments
<value>::=<NR3> ranges 1 to 100 dB.
Examples
:View1:Scale:YScale 50
sets the vertical axis full-scale to 50 dB.
Related Commands
:View<x>:Scale:XScale, :View<x>:Scale:YStart
:View<x>:Scale:YStart (?)
Sets or queries the value represented by the minimum (bottom) edge of the
vertical axis (power).
Syntax
:View<x>:Scale:YStart <value>
:View<x>:Scale:YStart?
Arguments
Examples
Related Commands
2-296
<value>::=<NR3> ranges from ref level – 200 dB to ref level + 100 dB
– horizontal axis full-scale.
:View1:Scale:YStart -50
sets the value represented by the bottom edge of the vertical axis to –50 dB.
:View<x>:Scale:YScale
3066 & 3086 3 GHz Real Time Spectrum Analyzer Programmer Manual
CodePower View Commands (3066 Option 15 and 3086 Option 16 Only)
:View<x>:Version? (Query Only)
Queries the version of the CodePower View program.
Syntax
Returns
Examples
:View<x>:Version?
<NR2>
:View1:Version?
might return 1.1.
:View<x>:Z (?)
Specifies or queries the displayed symbol number.
Syntax
:View<x>:Z <value>
:View<x>:Z?
Arguments
Examples
<value>::=<NR1> ranges from 0 to the number of symbols – 1.
:View1:Z 199
specifies that the symbol 199 displays.
3066 & 3086 3 GHz Real Time Spectrum Analyzer Programmer Manual
2-297
CodePower View Commands (3066 Option 15 and 3086 Option 16 Only)
2-298
3066 & 3086 3 GHz Real Time Spectrum Analyzer Programmer Manual
CodeWSpectrogram View Commands
(3086 Option 16 Only)
When you select CodeWSpectrogram in the Config:View<x> command, use the
commands in this section to control the code-domain power spectrogram view.
This view incorporates analysis functions for the W-CDMA standard.
3066 & 3086 3 GHz Real Time Spectrum Analyzer Programmer Manual
2-299
CodeWSpectrogram View Commands (3086 Option 16 Only)
:View<x>:Marker:DeltaMarker (?)
Turns the delta marker on or off.
Syntax
:View<x>:Marker:DeltaMarker { On | Off }
:View<x>:Marker:DeltaMarker?
Arguments
On turns the delta marker on.
Off turns the delta marker off
Examples
Related Commands
:View1:Marker:DeltaMarker On
turns the delta marker on.
:View<x>:Marker:ResetDelta
:View<x>:Marker:ResetDelta (No Query Form)
Moves the delta marker to the main marker position.
Syntax
Arguments
Examples
Related Commands
2-300
:View<x>:Marker:ResetDelta
None
:View1:Marker:ResetDelta
:View<x>:Marker:DeltaMarker
3066 & 3086 3 GHz Real Time Spectrum Analyzer Programmer Manual
CodeWSpectrogram View Commands (3086 Option 16 Only)
:View<x>:Marker:SearchMax (No Query Form)
Positions the marker on the highest signal on screen.
Syntax
Arguments
Examples
Related Commands
:View<x>:Marker:SearchMax
None
:View1:Marker:SearchMax
positions the marker on the highest signal on screen.
:View<x>:Marker:SearchMin
:View<x>:Marker:SearchMin (No Query Form)
Positions the marker on the lowest signal on screen.
Syntax
Arguments
Examples
Related Commands
:View<x>:Marker:SearchMin
None
:View1:Marker:SearchMin
positions the marker on the lowest signal on screen.
:View<x>:Marker:SearchMax
3066 & 3086 3 GHz Real Time Spectrum Analyzer Programmer Manual
2-301
CodeWSpectrogram View Commands (3086 Option 16 Only)
:View<x>:Marker:SearchSeparation (?)
Sets or queries the minimum horizontal distance to separate two peaks.
Syntax
:View<x>:Marker:SearchSeparation <value>
Arguments
<value>::=<NR2> specifies the minimum horizontal distance to separate two
peaks. The range is 1 to 10 % relative to full-scale.
Examples
:View1:Marker:SearchSeparation 10
sets the minimum horizontal distance for peak separation to 10 % relative to
full-scale.
Related Commands
:View<x>:Scale:XScale
:View<x>:Marker:X (?)
Sets or queries the horizontal position of the marker.
Syntax
:View<x>:Marker:X <value>
:View<x>:Marker:X?
Arguments
Examples
Related Commands
2-302
<value>::=<NR1> ranges from the minimum (left) edge to the maximum (right)
edge of the the horizontal axis (channel).
:View1:Marker:X 32
positions the marker at channel 32.
:View<x>:Marker:Z
3066 & 3086 3 GHz Real Time Spectrum Analyzer Programmer Manual
CodeWSpectrogram View Commands (3086 Option 16 Only)
:View<x>:Marker:Z (?)
Sets or queries the marker position on the vertical (time slot number) axis.
Syntax
:View<x>:Marker:Z <value>
:View<x>:Marker:Z?
Arguments
Examples
Related Commands
<value>::=<NR1> ranges 0 to the number of slots – 1.
:View1:Marker:Z 199
positions the marker at slot 199.
:View<x>:Marker:X
:View<x>:Monochrome (?)
Determines whether to display a spectrogram in monochrome.
Syntax
:View<x>:Monochrome { On | Off }
:View<x>:Monochrome?
Arguments
On displays a spectrogram in monochrome.
Off displays a spectrogram in color.
Examples
:View1:Monochrome On
displays a spectrogram in monochrome.
3066 & 3086 3 GHz Real Time Spectrum Analyzer Programmer Manual
2-303
CodeWSpectrogram View Commands (3086 Option 16 Only)
:View<x>:NumberColors (?)
Selects or queries the number of display colors.
Syntax
:View<x>:NumberColors { 10 | 100 }
:View<x>:NumberColors?
Arguments
10 selects the 10-color display.
100 selects the 100-color display (default).
Examples
Related Commands
:View1:NumberColors 100
selects the 100-color display.
:View<x>:Scale:YScale, :View<x>:Scale:YStart
:View<x>:Scale:AutoScale (No Query Form)
Resets the Y (color) axis to the default setting.
Syntax
Arguments
Examples
Related Commands
2-304
:View<x>:Scale:AutoScale
None
:View1:Scale:AutoScale
resets the Y (color) axis to the default setting.
:View<x>:Scale:YScale
3066 & 3086 3 GHz Real Time Spectrum Analyzer Programmer Manual
CodeWSpectrogram View Commands (3086 Option 16 Only)
:View<x>:Scale:XScale (?)
Sets or queries the horizontal axis (channel) full-scale to display a portion of
data.
Syntax
:View<x>:Scale:XScale <value>
:View<x>:Scale:XScale?
Arguments
<value>::=<NR3> ranges 16 to 1024 channels.
Examples
:View1:Scale:XScale 64
sets the horizontal axis full-scale to 64 channels.
Related Commands
:View<x>:Scale:XStart, :View<x>:Scale:YScale, :View<x>:Scale:ZScale
:View<x>:Scale:XStart (?)
Sets or queries the value represented by the minimum (left) edge of the
horizontal axis (channel).
Syntax
:View<x>:Scale:XStart <value>
:View<x>:Scale:XStart?
Arguments
Examples
Related Commands
<value>::=<NR3> ranges from 0 to 1024 – (the horizontal axis full-scale)
channels.
:View1:Scale:XStart 0
sets the value represented by the left edge of the horizontal axis to channel 0.
:View<x>:Scale:XScale
3066 & 3086 3 GHz Real Time Spectrum Analyzer Programmer Manual
2-305
CodeWSpectrogram View Commands (3086 Option 16 Only)
:View<x>:Scale:YScale (?)
Sets or queries the Y (color) axis full-scale to display a portion of the data.
Syntax
:View<x>:Scale:YScale <value>
:View<x>:Scale:YScale?
Arguments
Examples
Related Commands
<value>::=<NR3> is 10, 20, 50, or 100 dB.
:View1:Scale:YScale 50
sets the Y axis full-scale to 50 dB.
:View<x>:Scale:XScale, :View<x>:Scale:YStart, :View<x>:Scale:ZScale
:View<x>:Scale:YStart (?)
Sets or queries the value represented by the minimum (bottom) edge of the Y
(color) axis.
Syntax
:View<x>:Scale:YStart <value>
:View<x>:Scale:YStart?
Arguments
<value>::=<NR3> ranges from ref level – 200 dB to ref level + 100 dB
– horizontal axis full-scale.
Examples
:View1:Scale:YStart -50
sets the value represented by the bottom edge of the Y axis to –50 dBm.
Related Commands
2-306
:View<x>:Scale:YScale
3066 & 3086 3 GHz Real Time Spectrum Analyzer Programmer Manual
CodeWSpectrogram View Commands (3086 Option 16 Only)
:View<x>:Scale:ZScale (?)
Sets or queries the time slot display interval. The spectrogram is displayed every
specified number of slots.
Syntax
:View<x>:Scale:ZScale <value>
:View<x>:Scale:ZScale?
Arguments
Examples
Related Commands
<value>::=<NR1> ranges 1 to 32.
1 means every slot is displayed. 32 means every 32th slot is displayed.
:View1:Scale:ZScale 8
displays the spectrogram every 8th slot.
:View<x>:Scale:ZStart
:View<x>:Scale:ZStart (?)
Sets or queries the value represented by the minimum (bottom) edge of the Z
(slot number) axis, i.e. the first slot to be displayed.
Syntax
:View<x>:Scale:ZStart <value>
:View<x>:Scale:ZStart?
Arguments
Examples
Related Commands
<value>::=<NR1> ranges from 0 to the number of slots – 1.
:View1:Scale:ZStart 20
sets the value represented by the bottom edge of the Z axis to 20.
:View<x>:Scale:ZScale
3066 & 3086 3 GHz Real Time Spectrum Analyzer Programmer Manual
2-307
CodeWSpectrogram View Commands (3086 Option 16 Only)
:View<x>:SymbolRate (?)
Sets or queries the symbol rate to display the code-domain power.
Syntax
:View<x>:SymbolRate <value>
:View<x>:SymbolRate?
Arguments
Examples
<value>::={ 1024k | 512k | 256k | 128k | 64k | 32k| 16k |
Composite } selects the symbol rate. Composite corresponds to multi-rate.
:View1:SymbolRate 1024k
sets the symbol rate to 1024K.
:View<x>:Version? (Query Only)
Queries the version of the CodeWSpectrogram View program.
Syntax
Returns
Examples
:View<x>:Version?
<NR2>
:View1:Version?
might return 1.1.
:View<x>:ZGap (?)
Sets or queries the display interval between two adjacent time slots on the Z (slot
number) axis on screen.
Syntax
:View<x>:ZGap <value>
:View<x>:ZGap?
Arguments
Examples
2-308
<value>::=<NR1> ranges 1 to 10 pixels.
:View1:ZGap 10
sets the display interval between two adjacent slots on the Z axis to 10 pixels.
3066 & 3086 3 GHz Real Time Spectrum Analyzer Programmer Manual
CodeWPolar View Commands (3086 Option 16 Only)
When you select CodeWPolar in the :Config:View<x> command, use the
commands in this section to control the polar view. This view incorporates
analysis functions for the W-CDMA standard.
For information on the polar view, refer to the User Manual.
3066 & 3086 3 GHz Real Time Spectrum Analyzer Programmer Manual
2-309
CodeWPolar View Commands (3086 Option 16 Only)
:View<x>:AlphaBT (?)
Sets or queries the a/BT value.
Syntax
:View<x>:AlphaBT <value>
:View<x>:AlphaBT?
Arguments
Examples
<value>::=<NR2> ranges 0.0001 to 1.
:View1:AlphaBT 1
sets the a/BT value to 1.
:View<x>:Analysis:TimeSlot (?)
Specifies or queries the time slot number to display the constellation.
Syntax
:View<x>:Analysis:TimeSlot <value>
:View<x>:Analysis:TimeSlot?
Arguments
Examples
<value>::=<NR1> ranges 0 to the number of time slots –1.
:View1:Analysis:TimeSlot 1
sets the time slot number to 1.
:View<x>:Analyze (No Query Form)
Performs analysis on the background for all time slots acquired.
Syntax
Arguments
Examples
Related Commands
2-310
:View<x>:Analyze
None
:View1:Analyze
performs analysis for all slots.
:View<x>:BreakAnalyze
3066 & 3086 3 GHz Real Time Spectrum Analyzer Programmer Manual
CodeWPolar View Commands (3086 Option 16 Only)
:View<x>:AutoCarrier (?)
Determines whether to search the carrier automatically for each time slot.
Syntax
:View<x>:AutoCarrier { On | Off }
:View<x>:AutoCarrier?
Arguments
On searches the carrier automatically for each slot, and displays the frequency
error in reference to the center frequency on screen at Freq Error.
Off sets the carrier frequency to the value specified with the :View<x>:Carrier
command.
Examples
Related Commands
:View1:AutoCarrier On
searches the carrier automatically and displays the frequency error.
:View<x>:Carrier
:View<x>:BreakAnalyze (No Query Form)
Breaks the analysis executed by the :View<x>:Analyze command.
Syntax
Arguments
Examples
Related Commands
:View<x>:BreakAnalyze
None
:View1:BreakAnalyze
breaks the analysis.
:View<x>:Analyze
3066 & 3086 3 GHz Real Time Spectrum Analyzer Programmer Manual
2-311
CodeWPolar View Commands (3086 Option 16 Only)
:View<x>:Carrier (?)
Sets or queries the carrier frequency.
Syntax
:View<x>:Carrier <value>
:View<x>:Carrier?
Arguments
Examples
Related Commands
<value>::=<NR3> ranges 0 Hz to 3 GHz.
:View1:Carrier 1.2G
sets the carrier frequency to 1.2 GHz.
:View<x>:AutoCarrier
:View<x>:Display (?)
Selects or queries the display data source.
Syntax
:View<x>:Display { Measurement | Reference }
:View<x>:Display?
Arguments
Measurement displays the measurement data.
Reference displays the reference data. Only the symbol constellation can be
displayed.
Refer to the User Manual on the measurement and reference data.
Examples
Related Commands
2-312
:View1:Display Measurement
displays the measurement data.
:View<x>:MeasFilter, :View<x>:RefFilter
3066 & 3086 3 GHz Real Time Spectrum Analyzer Programmer Manual
CodeWPolar View Commands (3086 Option 16 Only)
:View<x>:Format (?)
Selects or queries the waveform display format.
Syntax
:View<x>:Format { Vector | Constellation }
:View<x>:Format?
Arguments
Vector selects the Vector format. It displays symbol-to-symbol movements
using vector.
Constellation selects the Constellation format. It displays only symbols.
Examples
:View1:Format Vector
selects the Vector display format.
:View<x>:Marker:T (?)
Sets or queries the marker position on the time axis.
Syntax
:View<x>:Marker:T <value>
:View<x>:Marker:T?
Arguments
Examples
<value>::=<NR3> ranges from 0 to the time length of the acquisition data.
:View1:Marker:T 5.4u
positions the marker at 5.4 ms.
3066 & 3086 3 GHz Real Time Spectrum Analyzer Programmer Manual
2-313
CodeWPolar View Commands (3086 Option 16 Only)
:View<x>:MeasFilter (?)
Selects or queries the filter to create the measurement data.
Syntax
:View<x>:MeasFilter { None | RootRaisedCosine }
:View<x>:MeasFilter?
Arguments
None selects no filter.
RootRaisedCosine selects the root raised-cosine filter.
Examples
Related Commands
:View1:MeasFilter RootRaisedCosine
selects the root raised-cosine filter to create the measurement data.
:View<x>:RefFilter
:View<x>:Modulation (?)
Selects or queries the modulation type.
Syntax
:View<x>:Modulation W-CDMA
:View<x>:Modulation?
Arguments
Examples
2-314
W-CDMA selects the W-CDMA modulation (this parameter only).
:View1:Modulation W-CDMA
selects the W-CDMA modulation.
3066 & 3086 3 GHz Real Time Spectrum Analyzer Programmer Manual
CodeWPolar View Commands (3086 Option 16 Only)
:View<x>:RefFilter (?)
Selects or queries the filter to create the reference data.
Syntax
:View<x>:RefFilter { None | RaisedCosine | Gaussian }
:View<x>:RefFilter?
Arguments
None selects no filter.
RaisedCosine selects the raised cosine filter.
Gaussian selects the Gaussian filter.
Examples
Related Commands
:View1:RefFilter RaisedCosine
selects the raised cosine filter to create the reference data.
:View<x>:MeasFilter
:View<x>:ShortCode (?)
Sets or queries the short code number to display the symbol constellation.
Syntax
:View<x>:ShortCode <value>
:View<x>:ShortCode?
Arguments
<value>::=<NR1> ranges 0 to 1023 of the channel number.
Examples
:View1:ShortCode 255
sets the short code to channel 255.
Related Commands
:View<x>:SymbolConstellation
3066 & 3086 3 GHz Real Time Spectrum Analyzer Programmer Manual
2-315
CodeWPolar View Commands (3086 Option 16 Only)
:View<x>:Source (?)
Selects or queries the display data source.
Syntax
:View<x>:Source { None | Active | Zoom | <file_name> }
:View<x>:Source?
Arguments
None specifies no source. The display area in the view will be emptied.
Active specifies the currently acquired data as the source.
Zoom specifies the zoomed data as the source.
<file_name>::=<string> specifies the data file as the source. The file name
must be “*.IQ” (the IQ format).
Examples
:View1:Source Active
specifies the currently acquired data as the source.
:View<x>:Standard:WCDMA16M (No Query Form)
Configures the modulating system according to the W-CDMA standard with the
chip rate of 16 M.
Syntax
Arguments
Examples
Related Commands
:View<x>:Standard:WCDMA16M
None
:View1:Standard:WCDMA16M
configures the modulating system according to the W-CDMA standard with the
chip rate of 16 M.
:View<x>:Standard:WCDMA4M, :View<x>:Standard:WCDMA8M
:View<x>:Standard:WCDMA4M (No Query Form)
Configures the modulating system according to the W-CDMA standard with the
chip rate of 4 M.
Syntax
2-316
:View<x>:Standard:WCDMA4M
3066 & 3086 3 GHz Real Time Spectrum Analyzer Programmer Manual
CodeWPolar View Commands (3086 Option 16 Only)
Arguments
Examples
Related Commands
None
:View1:Standard:WCDMA4M
configures the modulating system according to the W-CDMA standard with the
chip rate of 4 M.
:View<x>:Standard:WCDMA16M, :View<x>:Standard:WCDMA8M
:View<x>:Standard:WCDMA8M (No Query Form)
Configures the modulating system according to the W-CDMA standard with the
chip rate of 4 M.
Syntax
Arguments
Examples
Related Commands
:View<x>:Standard:WCDMA8M
None
:View1:Standard:WCDMA8M
configures the modulating system according to the W-CDMA standard with the
chip rate of 8 M.
:View<x>:Standard:WCDMA16M, :View<x>:Standard:WCDMA4M
:View<x>:SymbolConstellation (?)
Determines whether or not to display the symbol constellation.
Syntax
:View<x>:SymbolConstellation { On | Off }
:View<x>:SymbolConstellation?
Arguments
On displays the symbol constellation.
Off does not display the symbol constellation.
Examples
Related Commands
:View1:SymbolConstellation On
displays the symbol constellation.
:View<x>:ShortCode, :View<x>:TimeSlot
3066 & 3086 3 GHz Real Time Spectrum Analyzer Programmer Manual
2-317
CodeWPolar View Commands (3086 Option 16 Only)
:View<x>:SymbolRate (?)
Sets or queries the symbol rate.
Syntax
:View<x>:SymbolRate <value>
:View<x>:SymbolRate?
Arguments
Examples
<value>::={ 4M | 8M | 16M } selects the symbol rate.
:View1:SymbolRate 4M
sets the symbol rate to 4 M/s.
:View<x>:TimeSlot (?)
Specifies or queries the time slot number to display the symbol constellation.
Syntax
:View<x>:TimeSlot <value>
:View<x>:TimeSlot?
Arguments
Examples
Related Commands
<value>::=<NR1> ranges from 0 to the number of time slots –1.
:View1:TimeSlot 1
sets the slot number to 1.
:View<x>:SymbolConstellation
:View<x>:Version? (Query Only)
Queries the version of the CodeWPolar View program.
Syntax
Returns
Examples
2-318
:View<x>:Version?
<NR2>
:View1:Version?
might return 1.1.
3066 & 3086 3 GHz Real Time Spectrum Analyzer Programmer Manual
CodeWPower View Commands (3086 Option16 Only)
When you select CodeWPower in the Config:View<x> command, use the
commands in this section to set the details for the code-domain power view.
This view incorporates analysis functions for the W-CDMA standard.
3066 & 3086 3 GHz Real Time Spectrum Analyzer Programmer Manual
2-319
CodeWPower View Commands (3086 Option 16 Only)
:View<x>:Average (?)
Determines whether or not to display the results of averaging on the analyzer
screen.
Syntax
:View<x>:Average { On | Off }
:View<x>:Average?
Arguments
On displays the results of averaging. The averaged power is displayed for each
channel or symbol with a bar graph.
Off hides the results of averaging.
Examples
Related Commands
:View1:Average On
displays the results of averaging.
:View<x>:Average:Execute
:View<x>:Average:AllFrames (No Query Form)
Specifies that all of the acquired time slots are used for averaging.
Syntax
Arguments
Examples
Related Commands
2-320
:View<x>:Average:AllFrames
None
:View1:Average:AllFrames
specifies that all of the acquired time slots are used for averaging.
:View<x>:Average:BeginZ, :View<x>:Average:EndZ
3066 & 3086 3 GHz Real Time Spectrum Analyzer Programmer Manual
CodeWPower View Commands (3086 Option 16 Only)
:View<x>:Average:BeginZ (?)
Specifies or queries the uppermost time slot in the average range.
Syntax
:View<x>:Average:BeginZ <value>
:View<x>:Average:BeginZ?
Arguments
Examples
Related Commands
<value>::=<NR1> ranges from 0 to the number of slots – 1.
:View1:Average:BeginZ 199
sets the uppermost slot number to 199.
:View<x>:Average:EndZ
:View<x>:Average:EndZ (?)
Specifies or queries the lowermost time slot in the average range.
Syntax
:View<x>:Average:EndZ <value>
:View<x>:Average:EndZ?
Arguments
Examples
Related Commands
<value>::=<NR1> ranges from 0 to the number of slots – 1.
:View1:Average:EndZ 100
sets the lowermost slot number to 100.
:View<x>:Average:BeginZ
3066 & 3086 3 GHz Real Time Spectrum Analyzer Programmer Manual
2-321
CodeWPower View Commands (3086 Option 16 Only)
:View<x>:Average:Execute (No Query Form)
Performs averaging for each bin for the time slots in the specified range.
Syntax
Arguments
Examples
Related Commands
:View<x>:Average:Execute
None
:View1:Average:Execute
performs averaging for each bin for the time slots in the specified range.
:View<x>:Average:AllFrames, :View<x>:Average:BeginZ,
:View<x>:Average:EndZ
:View<x>:Average:MarkerToFrame (No Query Form)
Specifies that the time slots between the main marker and the delta marker are
averaged.
Syntax
Arguments
Examples
Related Commands
2-322
:View<x>:Average:MarkerToFrame
None
:View<x>:Average:MarkerToFrame
specifies that the time slots between the main marker and the delta marker are
averaged.
:View<x>:Average:BeginZ, :View<x>:Average:EndZ
3066 & 3086 3 GHz Real Time Spectrum Analyzer Programmer Manual
CodeWPower View Commands (3086 Option 16 Only)
:View<x>:Average:Times (?)
Sets or queries the number of waveform acquisitions that make up an averaged
waveform.
Syntax
:View<x>:Average:Times <value>
:View<x>:Average:Times?
Arguments
Examples
Related Commands
<value>::=<NR1> ranges 1 to 1,000,000.
:View1:Average:Times 1000
specifies that an averaged waveform will show the result of combining 1000
waveforms.
:View<x>:Average:Type
:View<x>:Average:Type (?)
Selects or queries the average type. You can also select the peak hold mode.
For more information about the averaging, refer to the User Manual.
Syntax
:View<x>:Average:Type { RMSExpo | RMS | MaxHold | MinHold }
:View<x>:Average:Type?
Arguments
RMSExpo averages with the RMS (root mean squared) exponential. This mode
weights older acquisition data so that they have a progressively smaller effect on
the average.
RMS averages with the RMS (root mean squared).
MaxHold holds the maximum value for each data point.
MinHold holds the minimum value for each data point.
Examples
Related Commands
:View1:Average:Type RMSExpo
averages waveform with the exponential RMS.
:View<x>:Average:Time
3066 & 3086 3 GHz Real Time Spectrum Analyzer Programmer Manual
2-323
CodeWPower View Commands (3086 Option 16 Only)
:View<x>:Marker:DeltaMarker (?)
Turns the delta marker on or off.
Syntax
:View<x>:Marker:DeltaMarker { On | Off }
:View<x>:Marker:DeltaMarker?
Arguments
On turns the delta marker on.
Off turns the delta marker off.
Examples
Related Commands
:View1:Marker:DeltaMarker On
turns the delta marker on.
:View<x>:Marker:ResetDelta
:View<x>:Marker:ResetDelta (No Query Form)
Moves the delta marker to the main marker position.
Syntax
Arguments
Examples
Related Commands
:View<x>:Marker:ResetDelta
None
:View1:Marker:ResetDelta
moves the delta marker to the main marker position.
:View<x>:Marker:DeltaMarker
:View<x>:Marker:SearchMax (No Query Form)
Positions the marker on the highest signal on screen.
Syntax
Arguments
2-324
:View<x>:Marker:SearchMax
None
3066 & 3086 3 GHz Real Time Spectrum Analyzer Programmer Manual
CodeWPower View Commands (3086 Option 16 Only)
Examples
Related Commands
:View1:Marker:SearchMax
positions the marker on the highest signal on screen.
:View<x>:Marker:SearchMin
:View<x>:Marker:SearchMin (No Query Form)
Positions the marker on the lowest signal on screen.
Syntax
Arguments
Examples
Related Commands
:View<x>:Marker:SearchMin
None
:View1:Marker:SearchMin
positions the marker on the lowest signal on screen.
:View<x>:Marker:SearchMax
:View<x>:Marker:SearchSeparation (?)
Sets or queries the minimum horizontal distance to separate two peaks.
Syntax
:View<x>:Marker:SearchSeparation <value>
Arguments
<value>::=<NR2> specifies the minimum horizontal distance to separate two
peaks. The range is 1 to 10 % relative to full-scale.
Examples
:View1:Marker:SearchSeparation 10
sets the minimum horizontal distance for peak separation to 10 % relative to
full-scale.
Related Commands
:View<x>:Scale:XScale
3066 & 3086 3 GHz Real Time Spectrum Analyzer Programmer Manual
2-325
CodeWPower View Commands (3086 Option 16 Only)
:View<x>:Marker:X (?)
Sets or queries the horizontal position of the marker.
Syntax
:View<x>:Marker:X <value>
:View<x>:Marker:X?
Arguments
Examples
Related Commands
<value>::=<NR1> ranges from the minimum (left) edge to the maximum (right)
edge of the the horizontal axis (channel or symbol).
:View1:Marker:X 32
positions the marker at channel 32.
:View<x>:Scale:XScale, :View<x>:Scale:XStart
:View<x>:Scale:AutoScale (No Query Form)
Resets the vertical axis (power) to the default setting.
Syntax
Arguments
Examples
Related Commands
2-326
:View<x>:Scale:AutoScale
None
:View1:Scale:AutoScale
resets the vertical axis to the default setting.
:View<x>:Scale:YScale
3066 & 3086 3 GHz Real Time Spectrum Analyzer Programmer Manual
CodeWPower View Commands (3086 Option 16 Only)
:View<x>:Scale:XScale (?)
Sets or queries the horizontal axis (channel or symbol) full-scale to display a
portion of data.
Syntax
:View<x>:Scale:XScale <value>
:View<x>:Scale:XScale?
Arguments
Examples
Related Commands
<value>::=<NR1> depends on the horizontal axis setting:
Horizontal axis
Value
Short code
16, 32, 64, 128, 256, 512, or 1024
Symbol
20, 40, 80, 160, 320, or 640
:View1:Scale:XScale 64
sets the horizontal axis full-scale to 64 channels.
:View<x>:Scale:XStart, :View<x>:Scale:YScale, :View<x>:XAxis
:View<x>:Scale:XStart (?)
Sets or queries the value represented by the minimum (left) edge of the
horizontal axis (channel or symbol).
Syntax
:View<x>:Scale:XStart <value>
:View<x>:Scale:XStart?
Arguments
Examples
Related Commands
<value>::=<NR1> ranges from 0 to 1024 – (the horizontal axis full-scale)
channels.
:View1:Scale:XStart 0
sets the value represented by the left edge of the horizontal axis to 0.
:View<x>:Scale:XScale
3066 & 3086 3 GHz Real Time Spectrum Analyzer Programmer Manual
2-327
CodeWPower View Commands (3086 Option 16 Only)
:View<x>:Scale:YScale (?)
Sets or queries the vertical axis (power) full-scale to display a portion of the data.
Syntax
:View<x>:Scale:YScale <value>
:View<x>:Scale:YScale?
Arguments
<value>::=<NR3> ranges 1 to 100 dB.
Examples
:View1:Scale:YScale 50
sets the vertical axis full-scale to 50 dB.
Related Commands
:View<x>:Scale:XScale, :View<x>:Scale:YStart
:View<x>:Scale:YStart (?)
Sets or queries the value represented by the minimum (bottom) edge of the
vertical axis (power).
Syntax
:View<x>:Scale:YStart <value>
:View<x>:Scale:YStart?
Arguments
Examples
Related Commands
<value>::=<NR3> ranges from ref level – 200 dB to ref level + 100 dB
– horizontal axis full-scale.
:View1:Scale:YStart -50
sets the value represented by the bottom edge of the vertical axis to –50 dB.
:View<x>:Scale:YScale
:View<x>:ShortCode (?)
Specifies or queries the short code to display the code-domain power when the
horizontal axis represents symbol.
2-328
3066 & 3086 3 GHz Real Time Spectrum Analyzer Programmer Manual
CodeWPower View Commands (3086 Option 16 Only)
Syntax
:View<x>:ShortCode <value>
:View<x>:ShortCode?
Arguments
Examples
Related Commands
<value>::=<NR1> ranges 0 to 1023 of the channel number.
:View1:ShortCode 255
sets the short code to channel 255.
:View<x>:XAxis
:View<x>:SymbolRate (?)
Sets or queries the symbol rate to display the code-domain power.
Syntax
:View<x>:SymbolRate <value>
:View<x>:SymbolRate?
Arguments
Examples
<value>::={ 1024k | 512k | 256k | 128k | 64k | 32k| 16k |
Composite } selects the symbol rate. Composite corresponds to multi-rate.
:View1:SymbolRate 1024k
sets the symbol rate to 1024K.
:View<x>:Version? (Query Only)
Queries the version of the CodeWPower View program.
Syntax
Returns
Examples
:View<x>:Version?
<NR2>
:View1:Version?
might return 1.1.
3066 & 3086 3 GHz Real Time Spectrum Analyzer Programmer Manual
2-329
CodeWPower View Commands (3086 Option 16 Only)
:View<x>:XAxis (?)
Specifies or queries the horizontal axis.
Syntax
:View<x>:XAxis { ShortCode | Symbol }
:View<x>:XAxis?
Arguments
ShortCode defines the horizontal axis as short code.
Symbol defines the horizontal axis as symbol.
Examples
Related Commands
:View1:XAxis ShortCode
defines the horizontal axis as short code.
:View<x>:ShortCode
:View<x>:Z (?)
Specifies or queries the displayed time slot number.
Syntax
:View<x>:Z <value>
:View<x>:Z?
Arguments
Examples
2-330
<value>::=<NR1> ranges from 0 to the number of slots – 1.
:View1:Z 199
specifies that the slot 199 displays.
3066 & 3086 3 GHz Real Time Spectrum Analyzer Programmer Manual
CCDF Commands (Option 20 Only)
When you select CCDF in the Config:View<x> command, use the commands in
this section to set details for the CCDF (Complementary Cumulative Distribution Function) measurement. The final results are displayed on CCDFView,
which is controlled with the CCDFView commands (refer to page 2–347).
For details on the CCDF measurement, refer to the User Manual.
3066 & 3086 3 GHz Real Time Spectrum Analyzer Programmer Manual
2-331
CCDF Commands (Option 20 Only)
:View<x>:AllFrames (No Query Form)
Specifies that CCDF is calculated for data in all frames acquired.
Syntax
Arguments
Examples
Related Commands
:View<x>:AllFrames
None
:View1:AllFrames
specifies that CCDF is calculated for data in all frames.
:View<x>:BeginZ, :View<x>:EndZ
:View<x>:Average:Reset (No Query Form)
Stops the current CCDF measurement and restarts the process.
Syntax
Arguments
Examples
Related Commands
2-332
:View<x>:Average:Reset
None
:View1:Average:Reset
stops the current CCDF measurement and restarts the process.
:View<x>:Execute
3066 & 3086 3 GHz Real Time Spectrum Analyzer Programmer Manual
CCDF Commands (Option 20 Only)
:View<x>:BeginZ (?)
Specifies or queries the uppermost frame in the CCDF calculation range.
Syntax
:View<x>:BeginZ <value>
:View<x>:BeginZ?
Arguments
Examples
Related Commands
<value>::=<NR1> ranges from 0 to the number of frames – 1.
:View1:BeginZ 199
sets the uppermost frame number to 199.
:View<x>:EndZ
:View<x>:Destination (?)
Selects or queries the destination to output the CCDF calculation results.
Syntax
:View<x>:Destination { D1 | D2 | D3 | D4 | D5 | D6 | D7 | D8 }
:View<x>:Destination?
Arguments
Examples
D1 to D8 selects one of the data registers to output the CCDF calculation results.
:View1:Destination D1
selects the D1 data register.
3066 & 3086 3 GHz Real Time Spectrum Analyzer Programmer Manual
2-333
CCDF Commands (Option 20 Only)
:View<x>:EndZ (?)
Specifies or queries the lowermost frame in the CCDF calculation range.
Syntax
:View<x>:EndZ <value>
:View<x>:EndZ?
Arguments
Examples
Related Commands
<value>::=<NR1> ranges from 0 to the number of frames – 1.
:View1:EndZ 100
sets the lowermost frame number to 100.
:View<x>:BeginZ
:View<x>:Execute (No Query Form)
Performs the CCDF calculation.
Syntax
Arguments
Examples
Related Commands
2-334
:View<x>:Execute
None
:View1:Execute
performs the CCDF calculation.
:View<x>:Average:Reset
3066 & 3086 3 GHz Real Time Spectrum Analyzer Programmer Manual
CCDF Commands (Option 20 Only)
:View<x>:Marker:DeltaMarker (?)
Turns the delta marker on or off.
Syntax
:View<x>:Marker:DeltaMarker { On | Off }
:View<x>:Marker:DeltaMarker?
Arguments
On turns the delta marker on.
Off turns the delta marker off.
Examples
Related Commands
:View1:Marker:DeltaMarker On
turns the delta marker on.
:View<x>:Marker:ResetDelta
:View<x>:Marker:ResetDelta (No Query Form)
Moves the delta marker to the main marker position.
Syntax
Arguments
Examples
Related Commands
:View<x>:Marker:ResetDelta
None
:View1:Marker:ResetDelta
moves the delta marker to the main marker position.
:View<x>:Marker:DeltaMarker
3066 & 3086 3 GHz Real Time Spectrum Analyzer Programmer Manual
2-335
CCDF Commands (Option 20 Only)
:View<x>:Marker:SearchMax (No Query Form)
Positions the marker on the highest signal on screen.
Syntax
Arguments
Examples
Related Commands
:View<x>:Marker:SearchMax
None
:View1:Marker:SearchMax
positions the marker on the highest signal on screen.
:View<x>:Marker:SearchMin
:View<x>:Marker:SearchMin (No Query Form)
Positions the marker on the lowest signal on screen.
Syntax
Arguments
Examples
Related Commands
2-336
:View<x>:Marker:SearchMin
None
:View1:Marker:SearchMin
positions the marker on the lowest signal on screen.
:View<x>:Marker:SearchMax
3066 & 3086 3 GHz Real Time Spectrum Analyzer Programmer Manual
CCDF Commands (Option 20 Only)
:View<x>:Marker:SearchSeparation (?)
Sets or queries the minimum horizontal distance to separate two peaks.
Syntax
:View<x>:Marker:SearchSeparation <value>
Arguments
<value>::=<NR2> specifies the minimum horizontal distance to separate two
peaks. The range is 1 to 10 % relative to full-scale.
Examples
:View1:Marker:SearchSeparation 10
sets the minimum horizontal distance for peak separation to 10 % relative to
full-scale.
Related Commands
:View<x>:Scale:XScale
:View<x>:Marker:X (?)
Sets or queries the horizontal position of the marker.
Syntax
:View<x>:Marker:X <value>
:View<x>:Marker:X?
Arguments
Examples
Related Commands
<value>::=<NR3> ranges from the minimum (left) edge to the maximum (right)
edge of the the horizontal (time) axis.
:View1:Marker:X 20u
positions the marker at –20 ms.
:View<x>:Scale:XScale, :View<x>:Scale:XStart,
:View<x>:Scale:XStartZero
3066 & 3086 3 GHz Real Time Spectrum Analyzer Programmer Manual
2-337
CCDF Commands (Option 20 Only)
:View<x>:MarkerToFrame (No Query Form)
Specifies that CCDF is calculated for the range between the main marker and the
delta marker.
Syntax
Arguments
Examples
Related Commands
:View<x>:MarkerToFrame
None
:View1:MarkerToFrame
specifies that CCDF is calculated for the range between the main marker and the
delta marker.
:View<x>:AllFrames, :View<x>:BeginZ, :View<x>:EndZ
:View<x>:OutputFormat (?)
Selects or queries the display format of the CCDF calculation results.
Syntax
:View<x>:OutputFormat { CCDF | Histogram }
:View<x>:OutputFormat?
Arguments
CCDF specifies that the CCDF calculation results are displayed with time along
the horizontal axis and power along the vertical axis.
Histogram transforms the CCDF calculation results to a histogram.
Examples
2-338
:View1:OutputFormat CCDF
selects the CCDF format.
3066 & 3086 3 GHz Real Time Spectrum Analyzer Programmer Manual
CCDF Commands (Option 20 Only)
:View<x>:Position (?)
Specifies or queries which frame in a block to be displayed.
Syntax
:View<x>:Position <value>
:View<x>:Position?
Arguments
Examples
<value>::=<NR2> ranges 0 to 100 %. It specifies the display frame position
relative to the block size. 0 % specifies that the first frame in a block is
displayed. 100 % represents the last frame.
:View1:Position 100
displays the last frame in a block.
:View<x>:Resolution (?)
Sets or queries the amplitude resolution of a histogram when the output format is
set to Histogram with the :View<x>:OutputFormat command.
Syntax
:View<x>:Resolution <value>
:View<x>:Resolution?
Arguments
Examples
Related Commands
<value>::=<NR3> ranges 0.01 to 10 dB.
:View1:Resolution 10
sets the resolution of a histogram to 10 dB.
:View<x>:OutputFormat
3066 & 3086 3 GHz Real Time Spectrum Analyzer Programmer Manual
2-339
CCDF Commands (Option 20 Only)
:View<x>:Result1? (Query Only)
Queries the crest factor (the maximum – average of amplitude).
Syntax
Returns
Examples
Related Commands
:View<x>:Result1?
<NR3>
:View1:Result1?
might return 11.916, indicating that the crest factor is 11.916 dB.
:View<x>:Result2?, :View<x>:Result3?
:View<x>:Result2? (Query Only)
Queries the maximum amplitude.
Syntax
Returns
Examples
Related Commands
2-340
:View<x>:Result2?
<NR3>
:View1:Result2?
might return -1.446, indicating that the maximum amplitude is –1.446 dBm.
:View<x>:Result1?, :View<x>:Result3?
3066 & 3086 3 GHz Real Time Spectrum Analyzer Programmer Manual
CCDF Commands (Option 20 Only)
:View<x>:Result3? (Query Only)
Queries the average amplitude.
Syntax
Returns
Examples
Related Commands
:View<x>:Result3?
<NR3>
:View1:Result3?
might return -13.363, indicating that the average amplitude is –13.363 dBm.
:View<x>:Result1?, :View<x>:Result2?
:View<x>:Scale:AutoScale (No Query Form)
Resets the vertical axis (amplitude) to full-scale.
Syntax
Arguments
Examples
Related Commands
:View<x>:Scale:AutoScale
None
:View1:Scale:AutoScale
resets the vertical axis to full-scale.
:View<x>:Scale:YScale
3066 & 3086 3 GHz Real Time Spectrum Analyzer Programmer Manual
2-341
CCDF Commands (Option 20 Only)
:View<x>:Scale:HoldYScale (?)
Determines whether to hold or reset the vertical scale when you change the input
source.
Syntax
:View<x>:Scale:HoldYScale { On | Off }
:View<x>:Scale:HoldYScale?
Arguments
On holds the vertical scale setting when you change the input source.
Off resets the vertical scale to full-scale.
Examples
Related Commands
:View1:Scale:HoldYScale On
holds the vertical scale setting when you change the input source.
:View<x>:Scale:YScale, :View<x>:Scale:YStart, :View<x>:Source
:View<x>:Scale:Origin (No Query Form)
Resets the horizontal and vertical axis scale to the default setting.
Syntax
Arguments
Examples
Related Commands
2-342
:View<x>:Scale:Origin
None
:View1:Scale:Origin
resets the horizontal and vertical axis scale to the default setting.
:View<x>:Scale:XScale, :View<x>:Scale:YScale
3066 & 3086 3 GHz Real Time Spectrum Analyzer Programmer Manual
CCDF Commands (Option 20 Only)
:View<x>:Scale:XScale (?)
Sets or queries the horizontal (time) axis full-scale to display a portion of data.
Syntax
:View<x>:Scale:XScale <value>
:View<x>:Scale:XScale?
Arguments
Examples
Related Commands
<value>::=<NR3> ranges from (time length of a frame)/256 to (time length of a
frame).
:View1:Scale:XScale 50u
sets the horizontal axis full-scale to 50 ms.
:View<x>:Scale:XStart, :View<x>:Scale:YScale
:View<x>:Scale:XStart (?)
Sets or queries the value represented by the minimum (left) edge of the
horizontal (time) axis.
Syntax
:View<x>:Scale:XStart <value>
:View<x>:Scale:XStart?
Arguments
Examples
Related Commands
<value>::=<NR3> ranges from the minimum to the maximum time of acquired
data – the horizontal axis full-scale setting.
:View1:Scale:XStart -50
sets the value represented by the left edge of the horizontal axis to –50 ms.
:View<x>:Scale:XScale, :View<x>:Scale:XStartZero
3066 & 3086 3 GHz Real Time Spectrum Analyzer Programmer Manual
2-343
CCDF Commands (Option 20 Only)
:View<x>:Scale:XStartZero (?)
Determines whether to put the time at the left edge of each frame to zero.
Syntax
:View<x>:Scale:XStartZero { On | Off }
:View<x>:Scale:XStartZero?
Arguments
On puts the time at the left edge of each frame to zero.
Off uses the normal time axis.
The difference between On and Off is illustrated in Figure 2–10 below.
.....
On
Off
Frame 2
Frame 1
Frame 0
0
0
0
-100 ms
-50 ms
0
Time
Time
Figure 2-10: :View<x>:Scale:XStartZero On and Off (example)
Examples
Related Commands
:View1:Scale:XStartZero On
puts the time at the left edge of each frame to zero.
:View<x>:Scale:XStart
:View<x>:Scale:YScale (?)
Sets or queries the vertical axis (amplitude) full-scale to display a portion of
data.
Syntax
:View<x>:Scale:YScale <value>
:View<x>:Scale:YScale?
Arguments
Examples
2-344
<value>::=<NR3> ranges from full-scale/100 to full-scale of acquired data.
:View1:Scale:YScale 100
sets the vertical axis full-scale to 100 dB.
3066 & 3086 3 GHz Real Time Spectrum Analyzer Programmer Manual
CCDF Commands (Option 20 Only)
Related Commands
:View<x>:Scale:XScale, :View<x>:Scale:YStart
:View<x>:Scale:YStart (?)
Sets or queries the value represented by the minimum (bottom) edge of the
vertical axis (amplitude).
Syntax
:View<x>:Scale:YStart <value>
:View<x>:Scale:YStart?
Arguments
<value>::=<NR3> ranges from the minimum of acquired data to the maximum
– full-scale setting.
Examples
:View1:Scale:YStart -90
sets the value represented by the bottom edge of the vertical axis to –90 dBm.
Related Commands
:View<x>:Scale:YScale
:View<x>:Source (?)
Selects or queries the data source for the view.
Syntax
:View<x>:Source { None | Active | Zoom | <file_name> }
:View<x>:Source?
Arguments
None specifies no source. The display area in the view will be emptied.
Active specifies the currently acquired data as the source.
Zoom specifies the zoomed data as the source.
<file_name>::=<string> specifies the file as the source. The file name must
be “*.IQ” (the IQ format).
Examples
:View1:Source Active
specifies the currently acquired data as the view source.
3066 & 3086 3 GHz Real Time Spectrum Analyzer Programmer Manual
2-345
CCDF Commands (Option 20 Only)
:View<x>:Version? (Query Only)
Queries the version of the CCDF program.
Syntax
Returns
Examples
:View<x>:Version?
<NR2>
:View1:Version?
might return 1.1.
:View<x>:Z (?)
Specifies or queries the displayed frame number.
Syntax
:View<x>:Z <value>
:View<x>:Z?
Arguments
Examples
2-346
<value>::=<NR1> ranges from 0 to the number of frames – 1.
:View1:Z 199
specifies that the frame 199 displays.
3066 & 3086 3 GHz Real Time Spectrum Analyzer Programmer Manual
CCDFView Commands (Option 20 Only)
When you select CCDFView in the Config:View<x> command, use the commands in this section to set details for the CCDF (Complementary Cumulative
Distribution Function) view. This view displays the final results of CCDF
measurement, which is controlled with the CCDF commands (refer to page
2–331).
For details on the CCDF measurement, refer to the User Manual.
3066 & 3086 3 GHz Real Time Spectrum Analyzer Programmer Manual
2-347
CCDFView Commands (Option 20 Only)
:View<x>:CopyFrom (No Query Form)
Copies display data from a data register or text file to the data register specified
with the :View<x>:Source command.
Syntax
Arguments
:View<x>:CopyFrom { D1 | D2 | D3 | D4 | D5 | D6 | D7 | D8 |
<file_name> }
D1 to D8 selects one of the data registers.
<file_name>::=<string> is “*.TXT” (ASCII text file).
The register or file is the one to which the display data has been stored with the
:View<x>:CopyTo command. The data of the register or file is copied to the
register specified with the :View<x>:Source command.
Examples
Related Commands
:View1:CopyFrom D2
copies display data from the data register D2.
:View<x>:CopyTo, :View<x>:Source
:View<x>:CopyTo (No Query Form)
Stores the display data to a file or data register. This command is effective only
for the data acquired in the Vector mode.
Syntax
Arguments
:View<x>:CopyTo { Clipboard | D1 | D2 | D3 | D4 | D5 | D6 | D7 |
D8 | <file_name> }
Clipboard copies the display data to the Windows clipboard in the ASCII text
format. You can use the data in your application.
D1 to D8 are the data register 1 to 8, respectively.
<file_name>::=<string> is “*.TXT” (ASCII text file). The extension is set to
“.TXT” automatically.
Examples
Related Commands
2-348
:View1:CopyTo Clipboard
stores the display data to the clipboard.
:View<x>:CopyFrom
3066 & 3086 3 GHz Real Time Spectrum Analyzer Programmer Manual
CCDFView Commands (Option 20 Only)
:View<x>:Marker:DeltaMarker (?)
Turns the delta marker on or off.
Syntax
:View<x>:Marker:DeltaMarker { On | Off }
:View<x>:Marker:DeltaMarker?
Arguments
On turns the delta marker on.
Off turns the delta marker off.
Examples
Related Commands
:View1:Marker:DeltaMarker On
turns the delta marker on.
:View<x>:Marker:ResetDelta
:View<x>:Marker:ResetDelta (No Query Form)
Moves the delta marker to the main marker position.
Syntax
Arguments
Examples
Related Commands
:View<x>:Marker:ResetDelta
None
:View1:Marker:ResetDelta
moves the delta marker to the main marker position.
:View<x>:Marker:DeltaMarker
3066 & 3086 3 GHz Real Time Spectrum Analyzer Programmer Manual
2-349
CCDFView Commands (Option 20 Only)
:View<x>:Marker:SearchMax (No Query Form)
Positions the marker on the highest signal on screen.
Syntax
Arguments
Examples
Related Commands
:View<x>:Marker:SearchMax
None
:View1:Marker:SearchMax
positions the marker on the highest signal on screen.
:View<x>:Marker:SearchMin
:View<x>:Marker:SearchMin (No Query Form)
Positions the marker on the lowest signal on screen.
Syntax
Arguments
Examples
Related Commands
2-350
:View<x>:Marker:SearchMin
None
:View1:Marker:SearchMin
positions the marker on the lowest signal on screen.
:View<x>:Marker:SearchMax
3066 & 3086 3 GHz Real Time Spectrum Analyzer Programmer Manual
CCDFView Commands (Option 20 Only)
:View<x>:Marker:SearchSeparation (?)
Sets or queries the minimum horizontal distance to separate two peaks.
Syntax
:View<x>:Marker:SearchSeparation <value>
Arguments
<value>::=<NR2> specifies the minimum horizontal distance to separate two
peaks. The range is 1 to 10 % relative to full-scale.
Examples
:View1:Marker:SearchSeparation 10
sets the minimum horizontal distance for peak separation to 10 % relative to
full-scale.
Related Commands
:View<x>:Scale:XScale
:View<x>:Marker:X (?)
Sets or queries the horizontal position of the marker.
Syntax
:View<x>:Marker:X <value>
:View<x>:Marker:X?
Arguments
Examples
Related Commands
<value>::=<NR3> ranges from the minimum (left) edge to the maximum (right)
edge of the the horizontal axis (amplitude).
:View1:Marker:X 5
positions the marker at 5 dB.
:View<x>:Scale:XScale, :View<x>:Scale:XStart
3066 & 3086 3 GHz Real Time Spectrum Analyzer Programmer Manual
2-351
CCDFView Commands (Option 20 Only)
:View<x>:Scale:AutoScale (No Query Form)
Adjusts scaling of the vertical axis automatically to best display the data.
Syntax
Arguments
Examples
Related Commands
:View<x>:Scale:AutoScale
None
:View1:Scale:AutoScale
adjusts scaling of the vertical axis automatically to best display the data.
:View<x>:Scale:YScale
:View<x>:Scale:LYStart (?)
Sets or queries the value represented by the minimum (bottom) edge of the
vertical axis (CCDF).
Syntax
:View<x>:Scale:LYStart <value>
:View<x>:Scale:LYStart?
Arguments
<value>::=<NR3> ranges 1/108 to 100 %.
The value must be smaller than the one set with the :View<x>:Scale:LYStop
command.
Examples
Related Commands
2-352
:View1:Scale:LYStart 1m
sets the value represented by the bottom edge of the vertical axis to 1/1000 %.
:View<x>:Scale:LYStop
3066 & 3086 3 GHz Real Time Spectrum Analyzer Programmer Manual
CCDFView Commands (Option 20 Only)
:View<x>:Scale:LYStop (?)
Sets or queries the value represented by the maximum (top) edge of the vertical
axis (CCDF).
Syntax
:View<x>:Scale:LYStop <value>
:View<x>:Scale:LYStop?
Arguments
<value>::=<NR3> ranges 1/108 to 100 %.
The value must be greater than the one set with the :View<x>:Scale:LYStart
command.
Examples
Related Commands
:View1:Scale:LYStop 100
sets the value represented by the top edge of the vertical axis to 100 %.
:View<x>:Scale:LYStart
:View<x>:Scale:Origin (No Query Form)
Resets the horizontal and vertical scale to the default setting.
Syntax
Arguments
Examples
Related Commands
:View<x>:Scale:Origin
None
:View1:Scale:Origin
resets the horizontal and vertical scale to the default setting.
:View<x>:Scale:LYStart, :View<x>:Scale:LYStop,
:View<x>:Scale:XScale
3066 & 3086 3 GHz Real Time Spectrum Analyzer Programmer Manual
2-353
CCDFView Commands (Option 20 Only)
:View<x>:Scale:XScale (?)
Sets or queries the horizontal axis (amplitude) full-scale to display a portion of
data.
Syntax
:View<x>:Scale:XScale <value>
:View<x>:Scale:XScale?
Arguments
Examples
Related Commands
<value>::=<NR3> ranges full-scale/256 to full-scale of the acquired data.
:View1:Scale:XScale 10
sets the horizontal axis full-scale to 10 dB.
:View<x>:Scale:LYStart, :View<x>:Scale:LYStop,
:View<x>:Scale:XStart
:View<x>:Scale:XStart (?)
Sets or queries the value represented by the minimum (left) edge of the
horizontal axis (amplitude).
Syntax
:View<x>:Scale:XStart <value>
:View<x>:Scale:XStart?
Arguments
Examples
Related Commands
2-354
<value>::=<NR3> ranges from the minimum to the maximum amplitude of
acquired data – the horizontal axis full-scale setting.
:View1:Scale:XStart 0
sets the value represented by the left edge of the horizontal axis to 0 dB.
:View<x>:Scale:XScale
3066 & 3086 3 GHz Real Time Spectrum Analyzer Programmer Manual
CCDFView Commands (Option 20 Only)
:View<x>:Source (?)
Selects or queries the data source for the view.
Syntax
:View<x>:Source { None | D1 | D2 | D3 | D4 | D5 | D6 | D7 | D8 }
:View<x>:Source?
Arguments
None specifies no source. The display area in the view will be emptied.
D1 to D8 specify the data register D1 to D8 as the source, respectively.
Examples
:View1:Source D1
specifies the data register D1 as the view source.
:View<x>:Version? (Query Only)
Queries the version of the CCDFView program.
Syntax
Returns
Examples
:View<x>:Version?
<NR2>
:View1:Version?
might return 1.1.
3066 & 3086 3 GHz Real Time Spectrum Analyzer Programmer Manual
2-355
CCDFView Commands (Option 20 Only)
2-356
3066 & 3086 3 GHz Real Time Spectrum Analyzer Programmer Manual
Self GainĆCalibration Commands
The Util1 command group calibrates the amplifier gain based on the signal
generator within the analyzer. This calibration should be run when the analyzer is
started or during operation.
If you perform this calibration when the analyzer is started, carry out warm-up
for 20 minutes or more after the power is turned on. This causes the analyzer
electrical performance to be stable. Then, run the calibration.
When the ambient temperature varies by "3 °C or more relative to that at the
previous calibration when the analyzer is in operation, UNCAL is displayed in
red in the hardware status display area on screen. This means that the analyzer
prompts you to run the calibration.
NOTE. If you executes the calibration during signal acquisition, the analyzer
stops the acquisition and then performs the calibration.
3066 & 3086 3 GHz Real Time Spectrum Analyzer Programmer Manual
2-357
Self Gain-Calibration Commands
:Util1:Execute (No Query Form)
Executes the self gain-calibration.
Syntax
Arguments
Examples
Related Commands
:Util1:Execute
None
:Util1:Execute
executes the self gain-calibration.
:Util1:Gain:Execute, :Util1:Result<x>?
:Util1:Gain:Auto (No Query Form)
Determines whether to perform the self gain-calibration automatically when the
analyzer is in uncal state. The calibration starts after data acquisition completes.
Syntax
Arguments
Examples
Related Commands
2-358
:Util1:Gain:Auto
None
:Util1:Gain:Auto
executes the self gain-calibration automatically after data acquisition when the
analyzer is in uncal state.
:Util1:Execute, :Util1:Gain:Execute
3066 & 3086 3 GHz Real Time Spectrum Analyzer Programmer Manual
Self Gain-Calibration Commands
:Util1:Gain:Execute (No Query Form)
Executes the self gain-calibration. This command is the same as the
:Util1:Execute command and exists for compatibility.
Syntax
Arguments
Examples
Related Commands
:Util1:Gain:Execute
None
:Util1:Gain:Execute
executes the self gain-calibration.
:Util1:Execute, :Util1:Result<x>?
:Util1:IQOffset:Execute (No Query Form)
3086 Only
Compensates the offset of the I and Q input signals.
NOTE. Set the level of the I and Q input signals to zero before executing the
command.
Syntax
Arguments
Examples
:Util1:IQOffset:Execute
None
:Util1:IQOffset:Execute
compensates the offset of the I and Q input signals.
3066 & 3086 3 GHz Real Time Spectrum Analyzer Programmer Manual
2-359
Self Gain-Calibration Commands
:Util1:Result<x>? (Query Only)
Queries the calibration result.
Syntax
:Util1:Result<x>?
Returns
Result1::={ Pass | Fail } indicates the result of the self gain-calibration.
Examples
:Util1:Result1?
might return Pass, indicating the self gain-calibration completes successfully.
Related Commands
:Util1:Execute, :Util1:Gain:Execute
:Util1:Version? (Query Only)
Queries the version of the self gain-calibration program.
Syntax
Returns
Examples
:Util1:Version?
<NR2>
:Util1:Version?
might return 1.1.
:Util1:WideOffset:Request (No Query Form)
3086 Only
Compensates the offset in the Wideband mode at the next data acquisition. The
analyzer turns off signal input automatically.
Syntax
Arguments
Examples
2-360
:Util1:WidebandOffset:Request
None
:Util1:WidebandOffset:Request
compensates the offset of the Wideband mode at the next data acquisition.
3066 & 3086 3 GHz Real Time Spectrum Analyzer Programmer Manual
Save/Load Commands
The Util2 command group allows you to save/load acquisition data to/from the
hard disk or floppy disk.
Remember that the data file is composed of the following parts.
Header
Frame data
Calibration data
Date and Time
Figure 2-11: Data file structure
3066 & 3086 3 GHz Real Time Spectrum Analyzer Programmer Manual
2-361
Save/Load Commands
:Util2:AllFrames (No Query Form)
Specifies that acquisition data in all frames are saved. Use the :Util2:Data:
SaveAP or :Util2:Data:SaveIQ command to save the data.
Syntax
Arguments
Examples
Related Commands
:Util2:AllFrames
None
:Util2:AllFrames
specifies that acquisition data in all frames are saved.
:Util2:BeginZ, :Util2:Data:SaveIQ, :Util2:Data:SaveAP, :Util2:EndZ
:Util2:BeginZ (?)
Specifies or queries the first frame in the save range. This setting is used by the
:Util2:Data:SaveAP and :Util2:Data:SaveIQ commands to save data.
Use the :Util2:EndZ command to specify the last frame.
Syntax
:Util2:BeginZ <value>
:Util2:BeginZ?
Arguments
Examples
Related Commands
<value>::=<NR1> ranges 0 to the number of frames – 1.
:Util2:BeginZ 199
specifies that the save starts from the frame 199.
:Util2:Data:SaveAP, :Util2:Data:SaveIQ, :Util2:EndZ
:Util2:Buffer:<header> (?)
Sets or queries the file header in the buffer area read from the data source with
the :Util2:Buffer:CopyHeader command. You can save the header with the
:Util2:Buffer:SaveHeader command.
2-362
3066 & 3086 3 GHz Real Time Spectrum Analyzer Programmer Manual
Save/Load Commands
Syntax
:Util2:Buffer:<header> <value>
:Util2:Buffer:<header>?
Arguments
Examples
Related Commands
The following list shows the <header> items, <value>, and their meanings.
<header>
<value>
Meaning
Bins
<NRf>
The number of bins
BlockSize
<NRf>
Block size
CenterFrequency
<NRf>
Center frequency
DateTime
<NRf>
Date and time
FFTPoints
<NRf>
The number of FFT points
FFTWindow
<string>
FFT window type
FrameLength
<NRf>
Frame length
FramePadding
<string>
The position of an invalid frame: Before or After
FramePeriod
<NRf>
Frame period
FrameReverse
<string>
Frame sequence: On (reverse) or Off (normal)
FrequencyOffset
<NRf>
Frequency offset
GainOffset
<NRf>
Gain offset
LevelOffset
<NRf>
Level offset
MaxInputLevel
<NRf>
Maximum input level
MultiAddr
<NRf>
The the last frame address in the multiĆframe mode
MultiFrames
<NRf>
The number of frames in the multiĆframe mode
Span
<NRf>
Span
Type
<string>
File type: IQ or AP format
UnitPeriod
<NRf>
Unit frame update period
ValidFrames
<NRf>
The number of all frames in the file
:Util2:Buffer:MultiFrames 2
sets the number of frames in the multi-frame mode to two in the file header.
:Util2:Buffer:CopyHeader, :Util2:Buffer:SaveHeader
3066 & 3086 3 GHz Real Time Spectrum Analyzer Programmer Manual
2-363
Save/Load Commands
:Util2:Buffer:CopyHeader (No Query Form)
Copies the file header from the specified data source to the buffer area. You can
set the header with the :Util2:Buffer:<header> command, and save the
header with the :Util2:Buffer:SaveHeader command.
Syntax
Arguments
:Util2:Buffer:CopyHeader <source>,<beginZ>,<endZ>
<source>::={ Active | Zoom | D1 | D2 | D3 | D4 | D5 | D6 | D7 |
D8 | <file_name> } specifies the data source.
Active specifies the currently acquired data as the source.
Zoom specifies the zoomed data as the source.
D1 to D8 specify the data register D1 to D8, respectively.
<file_name>::=<string> specifies the data file as the source. The file
name must be “*.IQ” (the IQ format) or “*.AP” (the AP format).
<beginZ>::=<NR1> specifies the first frame. It ranges 0 to the number of
frames – 1.
<endZ>::=<NR1> specifies the last frame. It ranges 0 to the number of
frames – 1, or –1. –1 represents variable record length.
Examples
:Util2:Buffer:CopyHeader Active,199,0
copies the file header from the active memory for the frame 199 to 0.
The larger frame number represents the older frame. However, you can specify
the frame range by changing <beginZ> and <endZ>. In this example, both
“199,0” and “0,199” are possible.
Related Commands
2-364
:Util2:Buffer:<header>, :Util2:Buffer:SaveHeader
3066 & 3086 3 GHz Real Time Spectrum Analyzer Programmer Manual
Save/Load Commands
:Util2:Buffer:SaveHeader (No Query Form)
Saves the file header from the buffer memory to a file. You can load the header
data with the :Util2:Buffer:CopyHeader command to the buffer, and set the
header with the :Util2:Buffer:<header> command.
Syntax
Arguments
:Util2:Buffer:SaveHeader <source>,<destination>
<source>::={ Active | Zoom | D1 | D2 | D3 | D4 | D5 | D6 | D7 |
D8 | <file_name> } specifies the data source for the header.
Active specifies the currently acquired data as the source.
Zoom specifies the zoomed data as the source.
D1 to D8 specify the data register D1 to D8, respectively.
<file_name>::=<string> specifies the data file as the source. The file
name must be “*.IQ” (the IQ format) or “*.AP” (the AP format).
<destination>::=<file_name>
<file_name>::=<string> specifies the file to save the header data. The file
name must be “*.IQ” (the IQ format) or “*.AP” (the AP format).
Examples
Related Commands
:Util2:Buffer:SaveHeader Active,"SAMPLE1.IQ"
saves the header for data on active memory to the file SAMPLE1.IQ.
:Util2:Buffer:<header>, :Util2:Buffer:CopyHeader
:Util2:Data:Load (No Query Form)
Loads the data from the file in the IQ format to the active memory.
Syntax
Arguments
Examples
Related Commands
:Util2:Data:Load <file_name>
<file_name>::=<string> must be “*.IQ”.
:Util2:Data:Load "SAMPLE1.IQ"
loads the data from the file SAMPLE1.IQ to the active memory.
:Util2:Data:Save
3066 & 3086 3 GHz Real Time Spectrum Analyzer Programmer Manual
2-365
Save/Load Commands
:Util2:Data:Save (No Query Form)
Saves the data from the specified data source to a file. All of the data including
header, frame data, calibration data, date and time are saved.
Syntax
Arguments
:Util2:Data:Save <source>,<beginZ>,<endZ>,<destination>
<source>::={ Active | Zoom | D1 | D2 | D3 | D4 | D5 | D6 | D7 |
D8 | <file_name> } specifies the data source.
Active specifies the currently acquired data as the source.
Zoom specifies the zoomed data as the source.
D1 to D8 specify the data register D1 to D8, respectively.
<file_name>::=<string> specifies the data file as the source. The file
name must be “*.IQ” (the IQ format) or “*.AP” (the AP format).
<beginZ>::=<NR1> specifies the first frame. It ranges 0 to the number of
frames – 1.
<endZ>::=<NR1> specifies the last frame. It ranges 0 to the number of
frames – 1.
<destination>::=<string> specifies the file to save the data. The file name
must be “*.IQ” (the IQ format) or “*.AP” (the AP format).
Examples
:Util2:Data:Save Active,199,0,"SAMPLE1.IQ"
saves the data from the active memory for the frame 199 to 0 to the file
SAMPLE1.IQ.
The larger frame number represents the older frame. However, you can specify
the frame range by changing <beginZ> and <endZ>. In this example, both
“199,0” and “0,199” are possible.
Related Commands
2-366
:Util2:Data:Load
3066 & 3086 3 GHz Real Time Spectrum Analyzer Programmer Manual
Save/Load Commands
:Util2:Data:SaveAP (No Query Form)
Saves data to a file in the AP format. All of the data including header, frame
data, calibration data, date and time are saved. You can specify the data source
with the :Util2:Source command, and the frame range with the :Util2:ALLĆ
Frames or the :Util2:BeginZ and :Util2:EndZ commands. The data saved in
the AP format is unavailable for the modulation analysis or the zoom.
Syntax
Arguments
Examples
Related Commands
:Util2:Data:SaveAP <file_name>
<file_name>::=<string> must be “*.AP”.
:Util2:Data:SaveAP "SAMPLE1.AP"
saves the data to the file SAMPLE1.AP.
:Util2:ALLFrames, :Util2:BeginZ, :Util2:EndZ, :Util2:Source,
:Util2:Data:Save, :Util2:Data:SaveIQ
:Util2:Data:Saved (No Query Form)
Informs the other programs of Utility, Configuration, Setup, and View that a file
has been updated.
Syntax
Arguments
Examples
:Util2:Data:Saved [<file_name>]
<file_name>::=<string> specifies the updated file to be informed. The file
name must be “*.IQ” (the IQ format) or “*.AP” (the AP format). If you omit the
argument, the analyzer uses the file name specified with other command
previously.
:Util2:Data:Saved "SAMPLE1.IQ"
informs the other programs that the file SAMPLE1.IQ is updated.
3066 & 3086 3 GHz Real Time Spectrum Analyzer Programmer Manual
2-367
Save/Load Commands
:Util2:Data:SaveIQ (No Query Form)
Saves data to a file in the IQ format. All of the data including header, frame data,
calibration data, date and time are saved. You can specify the data source with
the :Util2:Source command, and the frame range with the :Util2:ALLFrames
or the :Util2:BeginZ and :Util2:EndZ commands.
Syntax
Arguments
Examples
Related Commands
2-368
:Util2:Data:SaveIQ <file_name>
<file_name>::=<string> must be “*.IQ”.
:Util2:Data:SaveIQ "SAMPLE1.IQ"
saves the data to the file SAMPLE1.IQ.
:Util2:ALLFrames, :Util2:BeginZ, :Util2:EndZ, :Util2:Source,
:Util2:Data:SaveAP, :Util2:Data:Save
3066 & 3086 3 GHz Real Time Spectrum Analyzer Programmer Manual
Save/Load Commands
:Util2:Data:SaveDateTime (No Query Form)
Adds the date and time to the file for the specified data source. Use this
command only for files with variable record length.
Syntax
Arguments
:Util2:Data:SaveDateTime [<source>,]<endZ>[,<destination>]
<source>::={ Active | Zoom | D1 | D2 | D3 | D4 | D5 | D6 | D7 |
D8 | <file_name> } specifies the data source. If you omit the <source>, the
value specified in the :Util2:Buffer:SaveHeader command is used.
Active specifies the currently acquired data as the source.
Zoom specifies the zoomed data as the source.
D1 to D8 specify the data register D1 to D8, respectively.
<file_name>::=<string> specifies the data file as the source. The file
name must be “*.IQ” (the IQ format) or “*.AP” (the AP format).
<endZ>::=<NR1> specifies the last frame. It ranges 0 to the number of
frames – 1.
<destination>::=<string> specifies the file to save the data. The file name
must be “*.IQ” (the IQ format) or “*.AP” (the AP format). If you omit the
<destination>, the value specified in the :Util2:Data:SaveHeader command
is used.
Examples
Related Commands
:Util2:Data:SaveDateTime Active,0,"SAMPLE1.IQ"
adds the date and time for data on active memory to the file SAMPLE1.IQ.
:Util2:Buffer:SaveHeader, :Util2:Data:SaveHeader
3066 & 3086 3 GHz Real Time Spectrum Analyzer Programmer Manual
2-369
Save/Load Commands
:Util2:Data:SaveFlatness (No Query Form)
Adds the calibration data for the specified source to the file.
Syntax
Arguments
:Util2:Data:SaveFlatness [<source>],[<destination>]
<source>::={ Active | Zoom | D1 | D2 | D3 | D4 | D5 | D6 | D7 |
D8 | <file_name> } specifies the data source. If you omit <source>, the value
specified in the :Util2:Buffer:SaveHeader command is used.
Active specifies the currently acquired data as the source.
Zoom specifies the zoomed data as the source.
D1 to D8 specify the data register D1 to D8, respectively.
<file_name>::=<string> specifies the data file as the source. The file
name must be “*.IQ” (the IQ format) or “*.AP” (the AP format).
<destination>::=<string> specifies the file to save the data. The file name
must be “*.IQ” (the IQ format) or “*.AP” (the AP format). If you omit
<destination>, the value specified in the :Util2:Data:SaveHeader command
is used.
Examples
Related Commands
2-370
:Util2:Data:SaveFlatness Active,"SAMPLE1.IQ"
adds the calibration data for currently acquired data to the file SAMPLE1.IQ.
:Util2:Buffer:SaveHeader, :Util2:Data:SaveHeader
3066 & 3086 3 GHz Real Time Spectrum Analyzer Programmer Manual
Save/Load Commands
:Util2:Data:SaveFrame (No Query Form)
Adds frame data for the specified source to the file.
Syntax
Arguments
:Util2:Data:SaveFrame [<source>,]<beginZ>,<endZ>
[,<destination>]
<source>::={ Active | Zoom | D1 | D2 | D3 | D4 | D5 | D6 | D7 |
D8 | <file_name> } specifies the data source. If you omit the <source>, the
value specified in the :Util2:Buffer:SaveHeader command is used.
Active specifies the currently acquired data as the source.
Zoom specifies the zoomed data as the source.
D1 to D8 specify the data register D1 to D8, respectively.
<file_name>::=<string> specifies the data file as the source. The file
name must be “*.IQ” (the IQ format) or “*.AP” (the AP format).
<beginZ>::=<NR1> specifies the first frame. It ranges 0 to the number of
frames – 1.
<endZ>::=<NR1> specifies the last frame. It ranges 0 to the number of
frames – 1.
<destination>::=<string> specifies the file to save the data. The file name
must be “*.IQ” (the IQ format) or “*.AP” (the AP format). If you omit the
<destination>, the value specified in the :Util2:Data:SaveHeader command
is used.
Examples
:Util2:Data:SaveFrame Active,199,0,"SAMPLE1.IQ"
saves the frame 199 to 0 from the active memory to the file SAMPLE1.IQ.
The larger frame number represents the older frame. However, you can specify
the frame range by changing <beginZ> and <endZ>. In this example, both
“199,0” and “0,199” are possible.
Related Commands
:Util2:Buffer:SaveHeader, :Util2:Data:SaveHeader
3066 & 3086 3 GHz Real Time Spectrum Analyzer Programmer Manual
2-371
Save/Load Commands
:Util2:Data:SaveHeader (No Query Form)
Saves the header to a file for the specified data source.
Syntax
Arguments
:Util2:Data:SaveHeader <source>,<beginZ>,<endZ>,<destination>
<source>::={ Active | Zoom | D1 | D2 | D3 | D4 | D5 | D6 | D7 |
D8 | <file_name> } specifies the data source.
Active specifies the currently acquired data as the source.
Zoom specifies the zoomed data as the source.
D1 to D8 specify the data register D1 to D8, respectively.
<file_name>::=<string> specifies the data file as the source. The file
name must be “*.IQ” (the IQ format) or “*.AP” (the AP format).
<beginZ>::=<NR1> specifies the first frame. It ranges 0 to the number of
frames –1.
<endZ>::=<NR1> specifies the last frame. It is 0 to the number of frames – 1,
or –1. –1 represents variable record length.
<destination>::=<string> specifies the file to save the header. The file name
must be “*.IQ” (the IQ format) or “*.AP” (the AP format).
Examples
:Util2:Data:SaveHeader Active,199,0,"SAMPLE1.IQ"
saves the header for the frame 199 to 0 on the active memory to the file
SAMPLE1.IQ.
The larger frame number represents the older frame. However, you can specify
the frame range by changing <beginZ> and <endZ>. In this example, both
“199,0” and “0,199” are possible.
Related Commands
2-372
:Util2:Data:SaveFrame, :Util2:Data:SaveFlatness,
:Util2:Data:SaveDateTime
3066 & 3086 3 GHz Real Time Spectrum Analyzer Programmer Manual
Save/Load Commands
:Util2:EndZ (?)
Specifies or queries the last frame in the save range. This setting is used by the
:Util2:Data:SaveAP and :Util2:Data:SaveIQ commands to save data.
Use the :Util2:BeginZ command to specify the first frame.
Syntax
:Util2:EndZ <value>
:Util2:EndZ?
Arguments
Examples
Related Commands
<value>::=<NR1> ranges from 0 to the number of frames – 1.
:Util2:EndZ 100
sets the number of the last frame to 100.
:Util2:BeginZ, :Util2:Data:SaveAP, :Util2:Data:SaveIQ
:Util2:MarkerToFrame (No Query Form)
Specifies that the frames between the main marker and the delta marker are
saved. This setting is used by the :Util2:Data:SaveAP and :Util2:Data:
SaveIQ commands to save data.
Syntax
Arguments
Examples
Related Commands
:Util2:MarkerToFrame
None
:Util2:MarkerToFrame
specifies that the frames between the main marker and the delta marker are
saved.
:Util2:BeginZ, :Util2:EndZ, :Util2:Data:SaveAP, :Util2:Data:SaveIQ
3066 & 3086 3 GHz Real Time Spectrum Analyzer Programmer Manual
2-373
Save/Load Commands
:Util2:Source (?)
Specifies or queries the data to be saved. Use the :Util2:Data:SaveAP or
:Util2:Data:SaveIQ command to save the data.
Syntax
:Util2:Source { None | Active | Zoom | D1 | D2 | D3 | D4 | D5 |
D6 | D7 | D8 | <file_name> }
:Util2:Source?
Arguments
None specifies no source (no operation).
Active specifies the currently acquired data as the source.
Zoom specifies the zoomed data as the source.
D1 to D8 specify the data register D1 to D8 as the source, respectively.
<file_name>::=<string> specifies the data file as the source. The file name
must be “*.IQ” (the IQ format) or “*.AP” (the AP format).
Examples
Related Commands
:Util2:Source Active
specifies the currently acquired data as the source.
:Util2:Data:SaveAP, :Util2:Data:SaveIQ
:Util2:Version? (Query Only)
Queries the version of the Save/Load program.
Syntax
Returns
Examples
2-374
:Util2:Version?
<NR2>
:Util2:Version?
might return 1.1.
3066 & 3086 3 GHz Real Time Spectrum Analyzer Programmer Manual
Average Commands
The Util3 command group controls averaging for the existing in-memory or
-file data in the specified range.
3066 & 3086 3 GHz Real Time Spectrum Analyzer Programmer Manual
2-375
Average Commands
:Util3:AllFrames (No Query Form)
Specifies that data in all frames are processed.
Syntax
Arguments
Examples
Related Commands
:Util3:AllFrames
None
:Util3:AllFrames
specifies that data in all frames are processed.
:Util3:RMS, :Util3:PeakHold
:Util3:BeginZ (?)
Sets or queries the first frame in the process range.
Syntax
:Util3:BeginZ <value>
:Util3:BeginZ?
Arguments
Examples
Related Commands
<value>::=<NR1> ranges 0 to the number of frames – 1.
:Util2:BeginZ 199
sets the first frame number to 199.
:Util3:EndZ, :Util3:RMS, :Util3:PeakHold
:Util3:Destination (?)
Selects or queries the destination to which the process result is output.
Syntax
:Util3:Destination { D1 | D2 | D3 | D4 | D5 | D6 | D7 | D8 }
:Util3:Destination?
Arguments
D1 to D8 selects the data register D1 to D8, respectively.
The default is D1.
2-376
3066 & 3086 3 GHz Real Time Spectrum Analyzer Programmer Manual
Average Commands
Examples
Related Commands
:Util3:Destination D1
selects the D1 register as the destination.
:Util3:RMS, :Util3:PeakHold
:Util3:EndZ (?)
Sets or queries the last frame in the process range.
Syntax
:Util3:EndZ <value>
:Util3:EndZ?
Arguments
Examples
Related Commands
<value>::=<NR1> ranges 0 to the number of frames – 1.
:Util3:EndZ 100
sets the last frame number to 100.
:Util3:BeginZ, :Util3:RMS, :Util3:PeakHold
:Util3:MarkerToFrame (No Query Form)
Specifies that the frames between the main marker and the delta marker are
processed.
Syntax
Arguments
Examples
Related Commands
:Util3:MarkerToFrame
None
:Util3:MarkerToFrame
specifies that the frames between the main marker and the delta marker are
processed.
:Util3:BeginZ, :Util3:EndZ, :Util3:RMS, :Util3:PeakHold
3066 & 3086 3 GHz Real Time Spectrum Analyzer Programmer Manual
2-377
Average Commands
:Util3:PeakHold (No Query Form)
Holds peak for each bin in the specified frame range.
Syntax
:Util3:PeakHold [[<source>],[<beginZ>],[<endZ>],[<destination>]]
Arguments
<source>::={ Active | Zoom | <file_name> } specifies the data source.
If you specify no argument, the value set with the :Util3:Source command is
used.
Active specifies the currently acquired data as the source.
Zoom specifies the zoomed data as the source.
<file_name>::=<string> specifies the data file as the source. The file
name must be “*.IQ” (the IQ format) or “*.AP” (the AP format).
<beginZ>::=<NR1> specifies the first frame. It ranges 0 to the number of
frames – 1. If you specify no argument, the value set with the :Util3:BeginZ
command is used.
<endZ>::=<NR1> specifies the last frame. It ranges 0 to the number of
frames – 1. If you specify no argument, the value set with the :Util3:EndZ
command is used.
<destination>::={ D1 | D2 | D3 | D4 | D5 | D6 | D7 | D8 }
specifies the register to store the results. If you specify no argument, the value
set with the :Util3:Destination command is used.
Examples
:Util3:PeakHold Active,199,0,D1
holds peak for each bin in the frame 199 to 0, and stores the results in the
register D1.
The larger frame number represents the older frame. However, you can specify
the frame range by changing <beginZ> and <endZ>. In this example, both
“199,0” and “0,199” are possible.
Related Commands
2-378
:Config:Mode, :Util3:BeginZ, :Util3:EndZ, :Util3:Destination,
:Util3:Source
3066 & 3086 3 GHz Real Time Spectrum Analyzer Programmer Manual
Average Commands
:Util3:RMS (No Query Form)
Calculates RMS (root mean square) for each bin in the specified frame range.
Syntax
Arguments
:Util3:RMS [[<source>],[<beginZ>],[<endZ>],[<destination>]]
<source>::={ Active | Zoom | <file_name> } specifies the data source.
If you specify no argument, the value set with the :Util3:Source command is
used.
Active specifies the currently acquired data as the source.
Zoom specifies the zoomed data as the source.
<file_name>::=<string> specifies the data file as the source. The file
name must be “*.IQ” (the IQ format) or “*.AP” (the AP format).
<beginZ>::=<NR1> specifies the first frame. It ranges 0 to the number of
frames – 1. If you specify no argument, the value set with the :Util3:BeginZ
command is used.
<endZ>::=<NR1> specifies the last frame. It ranges 0 to the number of
frames – 1. If you specify no argument, the value set with the :Util3:EndZ
command is used.
<destination>::={ D1 | D2 | D3 | D4 | D5 | D6 | D7 | D8 }
specifies the register to store the results. If you specify no argument, the value
set with the :Util3:Destination command is used.
Examples
:Util3:RMS Active,199,0,D1
calculates RMS for each bin in the frame 199 to 0, and stores the results in the
register D1.
The larger frame number represents the older frame. However, you can specify
the frame range by changing <beginZ> and <endZ>. In this example, both
“199,0” and “0,199” are possible.
Related Commands
:Config:Mode, :Util3:BeginZ, :Util3:EndZ, :Util3:Destination,
:Util3:Source
3066 & 3086 3 GHz Real Time Spectrum Analyzer Programmer Manual
2-379
Average Commands
:Util3:Source (?)
Specifies or queries the data source for averaging or peak hold.
Syntax
:Util3:Source { None | Active | Zoom | <file_name> }
:Util3:Source?
Arguments
None specifies no source. The display area in the view will be emptied.
Active specifies the currently acquired data as the source.
Zoom specifies the zoomed data as the source.
D1D2 to D7D8 specify the register pair D1D2 to D7D8 as the source, respectively.
<file_name>::=<string> specifies the data file as the source. The file name
must be “*.IQ” (the IQ format) or “*.AP” (the AP format).
Examples
Related Commands
:Util3:Source Active
specifies the currently acquired data as the source.
:Config:Mode, :Util3:RMS, :Util3:PeakHold
:Util3:Version? (Query Only)
Queries the version of the Average program.
Syntax
Returns
Examples
2-380
:Util3:Version?
<NR2>
:Util3:Version?
might return 1.1.
3066 & 3086 3 GHz Real Time Spectrum Analyzer Programmer Manual
Remote Commands
Use the Remote command group to set up the GPIB and TCP/IP interfaces.
3066 & 3086 3 GHz Real Time Spectrum Analyzer Programmer Manual
2-381
Remote Commands
:Clipboard? (Query Only)
Queries the contents of the Windows clipboard. Use this command to read the
clipboard after executing the command :View<x>:CopyTo Clipboard.
Syntax
Arguments
Returns
:Clipboard?
None
<NR1>
The line feed character (LF) will be replaced by “, ” (comma and space).
Examples
Related Commands
:Clipboard?
a partial response might look like this:
0: 00111001 00001001 01101001 11001000, 16: 10001011
01001100 11000100 01010101, 32: 01100110 00000000 10101011
11111100, 48: 00000111 11110111 11101111 11001111
:View<x>:CopyTo Clipboard
:Set? (Query Only)
Returns a string listing the analyzer settings, except for configuration information for the calibration values. You can use this string to return the analyzer to
the state it was in when you made the :Set? query. This command is equivalent
to the IEEE 488.2 command *LRN?.
Syntax
Arguments
:Set?
None
NOTE. The :Set? query always returns a string including command headers,
regardless of the setting of the [:Util8]:Header command. This is because the
returned string is intended to be sent back to the analyzer as a command string.
2-382
3066 & 3086 3 GHz Real Time Spectrum Analyzer Programmer Manual
Remote Commands
Examples
:Set?
a partial response might look like this:
:Config:Util1 SelfGainCal;:Config:Util2 SaveLoad;:Config:Util3
Average;:Config:Util4 None;:Config:Util5 None;:Config:Util6
None;:Config:Util7 None;:Config:Util8 Remote;
[:Util8]:Dev<x>:<command> (No Query Form)
Sends the specified command to the GPIB device. The analyzer as the controller
receives this [:Util8]:Dev<x>:<command> command from the PC via TCP/IP,
and sends the <command> to the other device through GPIB interface. You can
not use this command through the GPIB interface.
Syntax
[:Util8]:Dev<x>:<command> [<value>]
where
<x>::=<NR1> is the GPIB address of the device.
<command> is the GPIB command to be sent.
Arguments
Examples
<value> is the argument of the specified command.
:Util8:Dev1:*IDN?
sends the command *IDN? to the GPIB device with the address 1.
[:Util8]:Error? (Query Only)
Returns error code and message.
Syntax
[:UTIL8]:Error?
Returns
<NR1>,<message>
Refer to page 3–4 for the error codes and messages.
Examples
:UTIL8:Error?
might return 0,"No error".
3066 & 3086 3 GHz Real Time Spectrum Analyzer Programmer Manual
2-383
Remote Commands
[:Util8]:Event:<message> (No Query Form)
Specifies that the analyzer generates the event with the specified message. For
example, when you save a file using the Save/Load commands (refer to 2–361
page) along with this command, you can determine when the process completes.
Syntax
[:Util8]:Event:<message>
where <message> specifies the event message.
Arguments
Examples
None
:Util2:Data:Save Active,199,0,SAMPLE1.IQ"
:Util8:Event:Saved
sends the message “Saved” to the Event port when the file save operation
completes.
[:Util8]:Format (?)
Selects or queries the waveform display format. This setting is necessary to
execute the [:Util8]:Source:<item>? command.
Syntax
[:Util8]:Format { FreqAmpl | FreqPhase | FreqI | FreqQ | TimeAmpl
| TimePhase | TimeI | TimeQ }
[:Util8]:Format?
Arguments
2-384
Defines the parameters associated with the horizontal and vertical axes:
Argument
Horizontal axis
Vertical axis
FreqAmpl
Frequency (span)
Amplitude
FreqPhase
Frequency (span)
Phase
FreqI
Frequency (span)
I (In-Phase)
FreqQ
Frequency (span)
Q (QuadratureĆPhase)
TimeAmpl
Time
Amplitude
TimePhase
Time
Phase
TimeI
Time
I (In-Phase)
TimeQ
Time
Q (QuadratureĆphase)
3066 & 3086 3 GHz Real Time Spectrum Analyzer Programmer Manual
Remote Commands
Examples
Related Commands
:View1:Format FreqAmpl
shows the waveform with frequency along the horizontal axis and amplitude
along the vertical axis.
[:Util8]:Source:<item>?
[:Util8]:GPIB:Interface (?)
Selects or queries the GPIB configuration. You can not use this command
through the GPIB interface.
Syntax
[:Util8]:GPIB:Interface { Off | Talker/Listener | Controller }
[:Util8]:GPIB:Interface?
Arguments
Off disables all communication with the controller.
Talker/Listener sets the analyzer to Talker and Listener.
Controller sets the analyzer to Controller.
Examples
:Util8:GPIB:Interface Talker/Listener
sets the analyzer to Talker and Listener.
[:Util8]:GPIB:PrimaryAddress (?)
Sets or queries the GPIB primary address of the analyzer. You can not use this
command through the GPIB interface.
Syntax
[:Util8]:GPIB:PrimaryAddress <value>
[:Util8]:GPIB:PrimaryAddress?
Arguments
Examples
<value>::=<NR1> ranges 1 to 30.
:Util8:GPIB:PrimaryAddress 1
sets the GPIB primary address of the analyzer to 1.
3066 & 3086 3 GHz Real Time Spectrum Analyzer Programmer Manual
2-385
Remote Commands
[:Util8]:Header (?)
Determines whether to include or omit headers on query responses.
Syntax
[:Util8]:Header { On | Off }
[:Util8]:Header?
Arguments
On specifies that the analyzer includes headers on applicable query responses.
You can then use the query response as a command.
Off specifies that the analyzer omit headers on query responses, so that only the
argument is returned.
Examples
:Util8:Header On
adds header to the response.
[:Util8]:Id? (Query Only)
Returns the analyzer identification code. This command is equivalent to the
IEEE 488.2 command *IDN?.
Syntax
Returns
[:Util8]:Id?
The instrument ID in the following format:
SONY/Tektronix,30X6,FV:<firmware_version_number>,SV:
<software_version_number>
Examples
2-386
:Util8:Id?
might return SONY/Tektronix,3066,FV:1.3,SV:2.0.
3066 & 3086 3 GHz Real Time Spectrum Analyzer Programmer Manual
Remote Commands
[:Util8]:Key (No Query Form)
This command is equivalent to pressing the specified front-panel button.
Syntax
Arguments
Examples
[:Util8]:Key <button>
<button> specifies the front-panel button. The following table lists the
arguments and their corresponding buttons.
Argument
Button
Argument
Button
Roll
ROLL
ViewSearch
VIEW:SRCH
Block
BLOCK
View1X1 to View2X2
View 1X1 to 2X2
PrintScreen
PRINT
0 to 9, ., -
Numeric keys
Mode
MODE
Enter
ENTER/dBm
Setup
CONFIG:SETUP
MHz
MHz/s
View
VIEW
kHz
kHz/ms
Util
UTILITY
Hz
Hz/ms
SetupMain
SETUP:MAIN
Clear
CLEAR
SetupFreq
SETUP:FREQ
BackSpace
BS
SetupSpan
SETUP:SPAN
Up/Down
SetupRef
SETUP:REF
Up/Down arrow
b tton in ENTRY
button
ViewA to ViewD
VIEW:A to D
StepUp/StepDown
ViewMain
VIEW:MAIN
Step up/down button
beside the knob
k ob
ViewScale
VIEW:SCALE
F1 to F8
Side buttons
ViewMarker
VIEW:MARKER
:Util8:Key Roll
is equivalent to pressing the front-panel ROLL button.
3066 & 3086 3 GHz Real Time Spectrum Analyzer Programmer Manual
2-387
Remote Commands
[:Util8]:NewLine (?)
Selects or queries the new-line character of query responses through TCP/IP.
Syntax
[:Util8]:NewLine { CR | LF | CRLF }
[:Util8]:NewLine?
Arguments
CR sets the new-line character to Carriage Return.
LF sets the new-line character to Line Feed.
CRLF sets the new-line character to Carriage Return and Line Feed.
Examples
:Util8:NewLine CR
sets the new-line character to Carriage Return.
[:Util8]:NumericOutput (?)
Sets or queries the numeric format of the returned value.
Syntax
:NumericOutput { EXP | SubUnit }
:NumericOutput?
Arguments
EXP specifies that returned-values are expressed by the scaled explicit point
format, such as 1.0E–6 and 1.0E+6.
SubUnit specifies that returned-values are expressed by the SI units (which
conform to the Systeme International d’Unites standard), such as 1m and 1M.
For more information about the unit, refer to page 2–5.
Examples
2-388
:NumericOutput SubUnit
specifies that returned-values are expressed by the SI units.
3066 & 3086 3 GHz Real Time Spectrum Analyzer Programmer Manual
Remote Commands
[:Util8]:Register:Data (No Query Form)
Writes a value to the specified location in the data register.
Syntax
Arguments
[:Util8]:Register:Data <register>,<location>,<value>
<register>::={ D1 | D2 | D3 | D4 | D5 | D6 | D7 | D8 }
selects the data register D1 to D8, respectively.
<location>::=<NR1> is the location in the data register to write the value on.
It ranges 0 to the number of data points on the horizontal axis – 1.
<value>::=<NRf> is the value to be written.
Examples
Related Commands
:Util8:Register:Data D1,5,0.9
sets the sixth point in the data register D1 to 0.9.
[:Util8]:Register:Header
3066 & 3086 3 GHz Real Time Spectrum Analyzer Programmer Manual
2-389
Remote Commands
[:Util8]:Register:Header (No Query Form)
Specifies axis scaling and labeling for the data register.
Syntax
Arguments
[:Util8]:Register:Header <register>,<item>,<value>
<register>::={ D1 | D2 | D3 | D4 | D5 | D6 | D7 | D8 }
selects the data register D1 to D8, respectively.
The following table lists the <item> and <value>.
Examples
Related Commands
2-390
<item>
<value>
Meaning
XNum
<NRf>
The number of data points on the horizontal axis.
It must be less than 8142.
XStart
<NRf>
The minimum (left) edge of the horizontal axis
XScale
<NRf>
FullĆscale of the horizontal axis
XUnit
<string>
The unit for the horizontal axis, e.g. Hz, s
XLeftLabel
<string>
The label displayed on the left side under the horizontal
axis. Start" displays the start value, Center" displays the
center value, otherwise displays the specified string.
XRightLabel
<string>
The label displayed on the right side under the horizontal
axis. Stop" displays the stop value, Span" displays the
span, otherwise displays the specified string.
YStart
<NRf>
The minimum (bottom) edge of the vertical axis
YScale
<NRf>
FullĆscale of the vertical axis
YUnit
<string>
The unit for the vertical axis, e.g. dB, V
YMiddleUnit
<string>
The unit displayed at middle for the vertical axis, e.g. dBm
ZNum
<NRf>
The number of frames of the register: 0 or 1.
0 indicates the frame is unavailable.
:Util8:Register:Header D1,XNum,1000
sets the number of data points on the horizontal axis for the D1 register to 1000.
[:Util8]:Register:Data
3066 & 3086 3 GHz Real Time Spectrum Analyzer Programmer Manual
Remote Commands
[:Util8]:Source (?)
Selects or queries the data source for the [:Util8]:Source:<item>? command.
Syntax
[:Util8]:Source { None | Active | Average | Zoom | D1D2 |
D3D4 | D5D6 | D7D8 | D1 | D2 | D3 | D4 | D5 | D6 | D7 | D8 |
<file_name> }
[:Util8]:Source?
Arguments
None specifies no source. The display area in the view will be emptied.
Active specifies the currently acquired data as the source.
Average specifies the averaged data as the source. When you select this item,
you have to set the average type and the number of averages using the
:View<x>:Average:Type and the :View<x>:Average:Times commands,
respectively.
Zoom specifies the zoomed data as the source.
D1D2 to D7D8 specify the register pair D1D2 to D7D8 as the source, respectively.
D1 to D8 specify the data register D1 to D8 as the source, respectively.
<file_name>::=<string> specifies the data file as the source. The file name
must be “*.IQ” (the IQ format) or “*.AP” (the AP format).
Examples
Related Commands
:Util8:Source Active
specifies the currently acquired data as the source.
:Config:Mode, [:Util8]:Source:<item>?
3066 & 3086 3 GHz Real Time Spectrum Analyzer Programmer Manual
2-391
Remote Commands
[:Util8]:Source:<item>? (Query Only)
Queries the settings for the data source specified with the [:Util8]:Source
command. You need to set the display format with the [:Util8]:Format
command before executing this command.
Syntax
Returns
2-392
[:Util8]:Source:<item>?
The following table lists the <item> and parameter type.
<item>
Returns
Meaning
Bins
<NR1>
The number of bins
BlockSize
<NRf>
Block size
CenterFrequency
<NRf>
Center frequency
DateTime
<NRf>
Date and time
FFTPoints
<NR1>
The number of FFT points
FFTWindow
<string>
FFT window type
FrameLength
<NR1>
Frame length
FramePeriod
<NRf>
Frame period
FrameReverse
<string>
Frame sequence: On (reverse) or Off (normal)
Frames
<NR1>
The number of frames
FrequencyOffset
<NRf>
Frequency offset
FrequencyDomain
On/Off
Indicates whether the frequency domain data exists or not
GainOffset
<NRf>
Gain offset
LevelOffset
<NRf>
Level offset
MaxInputLeve
<NRf>
Maximum input level
MultiAddr
<NR1>
The last frame address in the multi-frame mode
MultiFrames
<NR1>
The number of frames in the multi-frame mode
ReferenceLevel
<NRf>
Reference level
Span
<NRf>
Span
3066 & 3086 3 GHz Real Time Spectrum Analyzer Programmer Manual
Remote Commands
Examples
<item>
Returns
Meaning
Ticks
<NR1>
The count for timeĆstamping
TimeDomain
On/Off
Indicates whether the time domain data exists or not
UnitPeriod
<NRf>
Unit period for timeĆstamping
ValidFrames
<NRf>
The number of all frames in the file
XNum
<NR1>
The number of data points on the horizontal axis
XScale
<NRf>
FullĆscale of the horizontal axis
XStart
<NRf>
The start point of the horizontal axis
XUnit
<string>
The unit of data for the horizontal axis
XLeftLabel
<string>
The label displayed on the left under the horizontal axis
XRightLabel
<string>
The label displayed on the right under the horizontal axis
YScale
<NRf>
FullĆscale of the vertical axis
YStart
<NRf>
The start point of the vertical axis
YUnit
<string>
The unit of data for the vertical axis
YMiddleUnit
<string>
The unit displayed in the middle of the vertical axis
ZNum
<NR1>
The number of data points on the Z (frame) axis
:Util8:Source:ReferenceLevel?
might return -30, indicating the reference level is 30 dBm.
:Util8:Source:TimeDomain?
might return Off.
:Util8:Source:FFTWindow?
might return Blackman.
Related Commands
[:Util8]:Format, [:Util8]:Source
3066 & 3086 3 GHz Real Time Spectrum Analyzer Programmer Manual
2-393
Remote Commands
[:Util8]:Status? (Query Only)
Queries the status of the analyzer.
Syntax
Returns
Examples
2-394
[:Util8]:Status?
The following table lists the responses and their meanings:
Response
Meaning
Active:Start
Data acquisition has started
Active:Stop
Data acquisition has stopped
Active:Restart
Data acquisition has restarted
Active:Block
A block data has been acquired
Active:ChangeBlock
A block data has been acquired after you changed some settings
during data acquisition
Active:EndRoll
A block data has been acquired in the Roll mode
Active:ZoomStart
Zoom has started
Active:ZoomBlock
Data has been acquired for zoom
Active:ZoomStop
Zoom has stopped
Active:Quick
Data acquisition has completed in the Quick trigger mode
Active:Prepare
Data acquisition is ready
PowerOn
The analyzer is on and ready for operation
Util8:Status?
might return Active:Stop.
3066 & 3086 3 GHz Real Time Spectrum Analyzer Programmer Manual
Remote Commands
[:Util8]:TCPIP:Port:Command (?)
Sets or queries the TCP/IP command port number. You can not use this
command via TCP/IP. Refer to page 1–6 for information about the TCP/IP ports.
Syntax
[:Util8]:TCPIP:Port:Command <value>
[:Util8]:TCPIP:Port:Command?
Arguments
Examples
Related Commands
<value>::=<NR1> ranges 1024 to 32767. It must not be the same as the event
port number.
:Util8:TCPIP:Port:Command 3000
sets the command port number to 3000.
[:Util8]:TCPIP:Port:Command:Reset, [:Util8]:TCPIP:Port:Event
[:Util8]:TCPIP:Port:Command:Reset (No Query Form)
Disconnects the TCP/IP command port from the network, and closes command
input and response output. You can not use this command via TCP/IP. Refer to
page 1–6 for information about the TCP/IP ports.
Syntax
Arguments
Examples
Related Commands
[:Util8]:TCPIP:Port:Command:Reset
None
:Util8:TCPIP:Port:Command:Reset
closes the TCP/IP command port.
[:Util8]:TCPIP:Port:Command
3066 & 3086 3 GHz Real Time Spectrum Analyzer Programmer Manual
2-395
Remote Commands
[:Util8]:TCPIP:Port:Event (?)
Sets or queries the TCP/IP event port number. You can not use this command via
TCP/IP. Refer to page 1–6 for information about the TCP/IP ports.
Syntax
[:Util8]:TCPIP:Port:Event <value>
[:Util8]:TCPIP:Port:Event?
Arguments
Examples
Related Commands
<value>::=<NR1> ranges 1024 to 32767. It must not be the same as the
command port number.
:Util8:TCPIP:Port:Event 3001
sets the TCP/IP event port number to 3001.
[:Util8]:TCPIP:Port:Command
[:Util8]:TCPIP:Port:Event:Reset (No Query Form)
Disconnects the TCP/IP event port from the network, and closes event output.
You can not use this command via TCP/IP. Refer to page 1–6 for information
about the TCP/IP ports.
Syntax
Arguments
Examples
Related Commands
2-396
[:Util8]:TCPIP:Port:Event:Reset
None
:Util8:TCPIP:Port:Event:Reset
closes the TCP/IP event port.
[:Util8]:TCPIP:Port:Event
3066 & 3086 3 GHz Real Time Spectrum Analyzer Programmer Manual
Remote Commands
[:Util8]:Version? (Query Only)
Queries the version of the Remote program.
Syntax
Returns
Examples
[:Util8]:Version?
<NR2>
:Util8:Version?
might return 1.1.
[:Util8]:ViewName? (Query Only)
Queries the name of the Remote program.
Syntax
Returns
Examples
[:Util8]:ViewName?
<string>::=Util<X>"
:Util8:ViewName?
might return Util8.
[:Util8]:Z (?)
Specifies or queries the frame number for the [:Util8]:Z:<item>? command.
Syntax
[:Util8]:Z <value>
[:Util8]:Z?
Arguments
Examples
Related Commands
<value>::=<NR1> ranges from 0 to the number of frames – 1.
:Util8:Z 199
sets the frame number to 199.
[:Util8]:Z:<item>?
3066 & 3086 3 GHz Real Time Spectrum Analyzer Programmer Manual
2-397
Remote Commands
[:Util8]:Z:<item>? (Query Only)
Queries the time stamp or the status of the frame specified with the [:Util8]:Z
command.
Syntax
Returns
[:Util8]:Z:<item>?
The following table lists the <item>, the returned values, and their meanings:
<item>
Returned value
Meaning
TimeStamp
<NRf>
Time stamp for the frame
Status
NORMAL
The frame is normal.
INVALID
The frame has no data.
MISSFRAME
The frame was not acquired within the specified period.
OVERLOAD
The analyzer's A/D converter overloads.
TRIGGERED
The analyzer has been triggered.
LASTFRAME
The frame is the last one.
The time stamp is zero when the last frame is acquired.
Examples
:Util8:Z:TimeStamp?
might return -1.6e-4, indicating that the frame was acquired 160 ms before the
last frame.
:Util8:Z:Status?
might return OVERLOAD,TRIGGERED.
Related Commands
2-398
[:Util8]:Z
3066 & 3086 3 GHz Real Time Spectrum Analyzer Programmer Manual
Retrieving Response Message
When a query command is sent from the external controller, the analyzer puts the
response message on the output buffer. This response message cannot be
retrieved unless you perform a retrieval operation through the external controller.
For example, call IBRD subroutine with the National Instruments drivers.
Controller
ÎÎÎÎÎÎÎ
ÎÎÎÎÎÎÎ
ÎÎÎÎÎÎÎ
ÎÎÎÎÎ
ÎÎÎÎÎ
ÎÎÎÎÎ
ÎÎÎÎÎ
3066/3086
Query
:Setup:Trigger?
Retrieve operation
CALL IBRD
Response message
Auto
Command execution
controller
Buffering
Output buffer
Figure 2-12: Retrieving response message
Current response message overwrites the previous response message, if any.
When you send a chained queries to the analyzer, such as :Setup:Span?;
ReferenceLevel?;Trigger?, all the response messages will be written in the
output buffer. These messages remain in the buffer until the next query responses
overwrite them.
3066 & 3086 3 GHz Real Time Spectrum Analyzer Programmer Manual
2-399
Remote Commands
2-400
3066 & 3086 3 GHz Real Time Spectrum Analyzer Programmer Manual
Status and Events
Status and Events
The analyzer provides a status and event reporting system for the GPIB and
TCP/IP Ethernet interface. This system informs you of certain significant events
that occur within the analyzer.
Obtaining Event and Error Messages
Event and error messages can be obtained by using the following queries:
H
Status? query returns the latest event.
H
Error? query returns the error code and message in the following format:
<error code>,"<error message>"
Also, you can use the status port in TCP/IP environment. Refer to the next topic
below.
Table 3–2 to 3–7 on page 3–3 to 3–5 show all event and error messages.
TCP/IP Event Port
In TCP/IP environment, the analyzer always sends the event message to the
Event port. Access this port from your program to get the latest event. Refer to
page 1–7 for setting the port.
3066/3086
Controller
Command
port
Event
port
Event
TCP/IP Ethernet network
Figure 3-1: Obtaining event on the TCP/IP Ethernet
3066 & 3086 3 GHz Real Time Spectrum Analyzer Programmer Manual
3-1
Status and Events
Status Byte Register (SBR)
The analyzer has one 8-bit register, called Status Byte Register (SBR) to handle
the status. Only the bit 7 is used to indicate whether the analyzer is acquiring
data.
You can read the SBR register from your program. For example, call IBRSP
subroutine with the National Instruments drivers.
7
6
Ċ
5
Ċ
4
Ċ
3
Ċ
2
Ċ
1
Ċ
0
Ċ
Operation status bit
Figure 3-2: The Status Byte Register (SBR)
Table 3-1: SBR bit functions
3-2
Bit
Function
7
Operation Status Bit. This bit is set when acquiring data.
6-0
Not used.
3066 & 3086 3 GHz Real Time Spectrum Analyzer Programmer Manual
Status and Events
Messages
Tables 3–2 to 3–7 list all the programming interface messages the analyzer
generates in response to commands and queries.
Event Messages
These are certain types of events that may occur while the analyzer is in use. You
can get these messages with the Status? command. You can also access to the
status port via TCP/IP (option) to obtain events.
Table 3-2: Event message
Returned value
Meaning
Active:Start
Data acquisition has started
Active:Stop
Data acquisition has stopped
Active:Restart
Data acquisition has restarted
Active:Block
A block data has been acquired
Active:ChangeBlock
A block data has been acquired after you changed some settings
during data acquisition
Active:EndRoll
A block data has been acquired in the Roll mode
Active:ZoomStart
Zoom has started
Active:ZoomBlock
Data has been acquired for zoom
Active:ZoomStop
Zoom has stopped
Active:Quick
Data acquisition has completed in the Quick trigger mode
Active:Prepare
Data acquisition is ready
PowerOn
The analyzer is on and ready for operation
3066 & 3086 3 GHz Real Time Spectrum Analyzer Programmer Manual
3-3
Status and Events
Error Messages
You can get these messages with the Error? command.
No Error. Table 3–7 shows the messages when the system has no error.
Table 3-3: No error
Code
Message
0
No error
Command Error. Command error is returned when there is a syntax error in the
command.
Table 3-4: Command error
Code
Message
-100
Command error
Execution Error. These error codes and messages are returned when an error is
detected while a command is being executed.
Table 3-5: Execution error
3-4
Code
Message
-200
Execution error
-220
Parameter error
-225
Out of memory
-250
Mass storage error
-254
Media full
-256
File name not found
-257
File name error
-258
Media protected
3066 & 3086 3 GHz Real Time Spectrum Analyzer Programmer Manual
Status and Events
Device Specific Error. These error codes and messages are returned when an
internal instrument error is detected. This type of error may indicate a hardware
problem.
Table 3-6: Device specific error
Code
Message
-300
Device specific error
GPIB Error. These error codes are returned when a GPIB error is detected.
Table 3-7: GPIB error
Code
Message
2000
System error
Function requires GPIB board to be CIC
Write function detected no Listeners
Interface board not addressed correctly
Invalid argument to function call
Function requires GPIB board to be SAC
I/O operation aborted
NonĆexistent interface board
Error performing DMA
I/O operation started before previous
(Operation completed) No capability for intended operation
(Operation completed) File system operation error
(Operation completed) Serial poll status byte lost
(Operation completed) SRQ remains asserted
(Operation completed) The return buffer is full
(Operation completed) Address or board is locked
3066 & 3086 3 GHz Real Time Spectrum Analyzer Programmer Manual
3-5
Status and Events
3-6
3066 & 3086 3 GHz Real Time Spectrum Analyzer Programmer Manual
Programming Examples
Programming Examples
This section lists two example programs that illustrate methods you can use to
control the analyzer from your application over the TCP/IP Ethernet network.
These programs are written in the PERL (a freeware).
Example 1
H
Example 1 acquires a block of data and averages them.
H
Example 2 writes peak-hold data of 30 frames to a file every 3 seconds.
#
# Acquire a block of data and average them.
#
# Load the TCP/IP library
use lib 'c:\Program Files\SONY Tektronix\3066\Perl';
use TCPIP;
# Refer to "TCP/IP setup program" on page 4-4.
# End process routine
sub signal_handler
{
shutdown(SS, 2);
print S "Config:Pause Off\n";
shutdown(S, 2);
die @_;
}
$SIG{'INT'} = 'signal_handler';
$SIG{'BREAK'} = 'signal_handler';
#
# Main
#
tcp_client(S, '', '3000');
tcp_client(SS, '', '3001');
print
print
print
print
print
if
print
print
S "NewLine LF\n";
S "Config:Pause On\n";
S "Config:View1 Waveform\n";
S "View1:Trace2:Source D1\n";
S "Setup:Span?\n"; chomp($tmp = <S>);
($tmp > 50e6) {print S "Setup:Span 50e6\n";}
S "Setup:BlockSize 20\n";
S "Setup:TriggerCount Off\n";
print "Press BLOCK button \n";
3066 & 3086 3 GHz Real Time Spectrum Analyzer Programmer Manual
4-1
Programming Examples
while (<SS>)
{
print;
chomp;
if (/^Active:/)
{
if (/Block/) {print S "Util3:RMS Active,19,0,D1\n";}
print S "Config:Continue\n";
}
}
signal_handler;
Example 2
#
# Write peakĆhold data of 30 frames to a file every 3 seconds.
# See the figure below.
#
# Load the TCP/IP library
use lib 'c:\Program Files\SONY Tektronix\3066\Perl';
use TCPIP;
# Refer to "TCP/IP setup program" on page 4-4.
# End process routine
sub signal_handler
{
shutdown(SS, 2);
print S "Config:Pause Off\n";
shutdown(S, 2);
die @_;
3s
}
$SIG{'INT'} = 'signal_handler';
$SIG{'BREAK'} = 'signal_handler';
#
# Main
#
tcp_client(S, '', '3000');
tcp_client(SS, '', '3001');
print
print
print
print
print
if
print
4-2
Input data
Peak hold
File
30 frames
30 frames
30 frames
S "NewLine LF\n";
S "Config:Pause On\n";
S "Config:View1 Waveform\n";
S "View1:Source Active\n";
S "Setup:Span?\n"; chomp($tmp = <S>);
($tmp > 50e6) {print S "Setup:Span 50e6\n";}
S "Setup:BlockSize 30\n";
3066 & 3086 3 GHz Real Time Spectrum Analyzer Programmer Manual
Programming Examples
print
print
print
print
S
S
S
S
"Setup:Trigger Interval\n";
"Setup:TriggerCount On\n";
"Setup:TriggerTimes 10\n";
"Setup:TriggerInterval 3\n";
print "Press BLOCK button \n";
$file = 'IntBlock.ap';
$c = 0; # The number of acquisitions
while (<SS>)
{
print;
chomp;
if (/^Active:/)
{
if (/Block/)
{
print S "Util3:PeakHold Active,29,0,D1\n";
# If you clear the UnitPeriod value in the header, it is
# automatically set to 100 ms by the Util2:Data:SaveHeader
# command.
#print S "Register:Header D1,UnitPeriod,\"\"\n";
if ($c == 0)
{
print S "Util2:Data:SaveHeader D1,0,-1,$file\n";
}
print S "Util2:Data:SaveFrame D1,0,0\n";
$c++;
}
if (/Stop/)
{
if ($c > 0)
{
print S "Util2:Data:SaveFlatness D1\n";
print S "Util2:Data:SaveDateTime D1,0\n";
print S "Util2:Data:Saved\n";
$c = 0;
}
}
print S "Config:Continue\n";
}
}
signal_handler;
3066 & 3086 3 GHz Real Time Spectrum Analyzer Programmer Manual
4-3
Programming Examples
#
# TCP/IP setup program
#
package TCPIP;
use strict "subs";
use Socket;
use Exporter;
@ISA = qw(Exporter);
@EXPORT = qw(tcp_server tcp_client);
#
# Usage: tcp_server(handle[, port=3066])
#
sub tcp_server ($$)
{
my ($H, $port) = @_;
my $p = caller;
# Specify the caller
$H = $p . "::" . $H; # Declare the caller
$port = $port || 3066;
$proto = getprotobyname('tcp');
$port = getservbyname($port, 'tcp') unless $port =~ /^\d+/;
}
socket($H, PF_INET, SOCK_STREAM, $proto) || die "socket: $!";
$ent = sockaddr_in($port, INADDR_ANY);
bind($H, $ent) || die "bind: $!";
listen($H, 5) || die "listen: $!";
#
# Usage: tcp_client handle[, host[, port=3066]]
#
sub tcp_client ($;$$)
{
my ($H, $host, $port) = @_;
my $p = caller;
# Specify the caller
$H = $p . "::" . $H; # Declare the caller
$host = $host || "localhost";
$port = $port || 3066;
}
1;
4-4
my $proto = getprotobyname('tcp');
socket($H, PF_INET, SOCK_STREAM, $proto);
$port = getservbyname($port, 'tcp') unless $port =~ /^\d+/;
$ent = sockaddr_in($port, inet_aton($host));
connect($H, $ent) || die "connect : $!";
select($H); $| = 1; select(STDOUT);
# Inhibit buffuring
3066 & 3086 3 GHz Real Time Spectrum Analyzer Programmer Manual
Appendices
Appendix A: Character Charts
Table A-1: The 3066 character set
0
0
NUL
1
2
0
16
1
17
2
18
3
19
4
20
5
21
6
22
7
23
8
24
9
25
10
26
1
2
3
4
5
6
7
8
9
A
HT
LF
B
11
ESC
27
C
D
CR
12
28
13
29
14
30
15
31
E
F
space
!
"
#
$
%
&
'
(
)
*
+
,
Ċ
.
/
3
32
33
34
35
36
37
38
39
40
41
42
43
44
45
46
47
0
1
2
3
4
5
6
7
8
9
:
;
<
=
>
?
4
48
49
50
51
52
53
54
55
56
57
58
59
60
61
62
63
@
A
B
C
D
E
F
G
H
I
J
K
L
M
N
O
5
64
65
66
67
68
69
70
71
72
73
74
75
76
77
78
79
3066 & 3086 3 GHz Real Time Spectrum Analyzer Programmer Manual
P
Q
R
S
T
U
V
W
X
Y
Z
[
\
]
^
_
6
80
81
82
83
84
85
86
87
88
89
90
91
92
93
94
95
`
a
b
c
d
e
f
g
h
i
j
k
l
m
n
o
7
96
97
98
99
100
101
102
103
104
105
106
107
p
q
r
s
t
u
v
w
x
y
z
{
108
109
110
111
112
113
114
115
116
117
118
119
120
121
122
123
124
}
~
125
126
rubout
127
A-1
Appendix A: Character Charts
Table A-2: ASCII & GPIB code chart
B7
B6
0
B5
BITS
B4 B3 B2 B1
0 0 0 0
0 0 0 1
0 0 1 0
0 0 1 1
0 1 0 0
0 1 0 1
0 1 1 0
0 1 1 1
1 0 0 0
1 0 0 1
1 0 1 0
1 0 1 1
1 1 0 0
1 1 0 1
1 1 1 0
1 1 1 1
0
0
0
A-2
1
1
0
20
NUL
0
1
SOH
1
2
0
10
GTL
21
1
11
STX
2
3
2
4
EOT
4
5
13
SDC
24
4
14
PPC
25
5
15
6
7
6
10
BS
8
11
HT
9
12
LF
A
13
VT
B
14
FF
C
15
CR
D
16
SO
E
17
SI
F
DC4
NAK
7
17
GET
30
8
18
TCT
31
9
19
CAN
EM
1D
octal
5
hex
5
19
23
DCL
44
20
24
PPU
45
21
25
46
22
23
27
SPE
50
24
28
SPD
51
25
29
52
26
2A
53
27
2B
54
28
2C
55
29
2D
56
30
2E
57
31
UNIVERSAL
COMMANDS
ENQ
26
47
US
1F
22
43
RS
1E
37
15
18
GS
36
14
42
FS
1C
35
13
21
ESC
1B
34
12
17
SUB
1A
33
11
41
ETB
32
10
LL0
SYN
16
27
BEL
7
20
DC3
26
ACK
6
16
DC2
12
3
ENQ
5
DC1
23
ETX
3
40
DLE
22
0
0
1
1
1
NUMBERS
SYMBOLS
CONTROL
ADDRESSED
COMMANDS
KEY
0
0
PPC
5
2F
SP
!
"
#
$
%
&
'
(
)
*
+
,
-
.
/
LA0
60
32
30
LA1
61
33
31
LA2
62
34
32
LA3
63
35
33
LA4
64
36
34
LA5
65
37
35
LA6
66
38
36
LA7
67
39
37
LA8
70
40
38
LA9
71
41
39
LA10
72
42
3A
LA11
73
43
3B
LA12
74
44
3C
LA13
75
45
3D
LA14
76
46
3E
LA15
77
47
3F
0
1
0
0
1
1
UPPER CASE
0
1
2
3
4
5
6
7
8
9
:
;
<
=
>
?
LA16
48
LA17
49
LA18
50
LA19
51
LA20
52
LA21
53
LA22
54
LA23
55
LA24
56
LA25
57
LA26
58
LA27
59
100
40
101
41
102
42
103
43
104
44
105
45
106
46
107
47
110
48
111
49
112
4A
113
4B
LA28
114
60
4C
LA29
115
61
4D
LA30
116
62
UNL
63
LISTEN
ADDRESSES
GPIB code (with ATN asserted)
ASCII character
decimal
4E
117
4F
@
A
B
C
D
E
F
G
H
I
J
K
L
M
N
O
TA0
120
64
50
TA1
121
65
51
TA2
122
66
52
TA3
123
67
53
TA4
124
68
54
TA5
125
69
55
TA6
126
70
56
TA7
127
71
57
TA8
130
72
58
TA9
131
73
59
TA10
74
TA11
75
TA12
76
TA13
77
TA14
78
TA15
79
132
5A
133
5B
134
5C
135
5D
136
5E
137
5F
TALK
ADDRESSES
1
1
1
0
1
LOWER CASE
P
Q
R
S
T
U
V
W
X
Y
Z
[
\
]
^
-
TA16
80
TA17
81
TA18
82
TA19
83
TA20
84
TA21
85
TA22
86
TA23
87
TA24
88
TA25
89
TA26
90
TA27
91
TA28
92
TA29
93
TA30
94
UNT
95
140
SA0
160
60
96
70
141
SA1
161
61
142
62
143
63
144
64
145
65
146
66
147
67
150
68
151
69
152
6A
153
6B
154
6C
155
6D
156
6E
157
6F
a
b
c
d
e
f
g
h
i
j
k
l
m
n
o
97
SA2
98
SA3
99
71
162
72
163
73
SA4
164
100
74
SA5
165
101
75
SA6
166
102
76
SA7
167
103
77
SA8
170
104
78
SA9
171
105
79
SA10
106
SA11
107
SA12
108
SA13
109
SA14
110
SA15
111
172
7A
173
7B
p
q
r
s
t
u
v
w
x
y
z
{
174
7D
176
7E
177
7F
112
SA17
113
SA18
114
SA19
115
SA20
116
SA21
117
SA22
118
SA23
119
SA24
120
SA25
121
SA26
122
SA27
123
SA28
7C
175
SA16
124
}
~
SA29
125
SA30
126
RUBOUT
(DEL)
127
SECONDARY ADDRESSES
OR COMMANDS
Tektronix
REF: ANSI STD X3.4Ć1977
IEEE STD 488.1Ć1987
ISO STD 646Ć2973
3066 & 3086 3 GHz Real Time Spectrum Analyzer Programmer Manual
Appendix B: Factory Initialization Settings
The factory initialization settings provide you a known state for the analyzer.
Factory initialization sets the values as shown in Table B–1 to B–26 for each
command group. Table B–27 and B–28 present those values for the :Config:
Mode command by its arguments.
Configuration Commands
Table B-1: Factory initialization settings Ċ Configuration commands
Header
Default settings
Config:Setup
Standard
Config:BackgroundColor
Black
Config:MarkerLink
On
Config:Util<x>
Util1
Self GainĆCalibration
Util2
Save/Load
Util3
Average
Util8
Remote
Config:View:Style
1 1
Config:View<x>
View1
3066 & 3086 3 GHz Real Time Spectrum Analyzer Programmer Manual
Waveform
B-1
Appendix B: Factory Initialization Settings
Setup Commands
Table B-2: Factory initialization settings Ċ Setup commands
B-2
Header
Default settings - Standard
Default settings - CDMA
:Setup:BlockSize
Max. 200 (depends on span)
200
:Setup:CDMA:Channel
-
1
:Setup:CDMA:Standard
-
IS95
:Setup:CDMA:TriggerLevel
-
-30 dBm
:Setup:CenterFrequency
1.5 GHz
-
:Setup:FFTPoints
1024
-
:Setup:FFTWindow
Blackman
-
:Setup:FramePeriod
80 ms
-
:Setup:FrequencyOffset
0
-
:Setup:InputCoupling
AC
-
:Setup:InputMode
RF
-
:Setup:LevelOffset
0
-
:Setup:MemoryMode
Frequency
-
:Setup:ReferenceLevel
0 dBm
0 dBm
:Setup:ReferenceOsc
Internal
Internal
:Setup:Span
3 GHz
5 MHz
:Setup:Trigger
Auto
Auto
:Setup:TriggerCount
On
On
:Setup:TriggerDelayed
0
0
:Setup:TriggerDomain
Frequency
Frequency
:Setup:TriggerInterval
60
60
:Setup:TriggerPosition
50 %
50 %
:Setup:TriggerSlope
Rise
Rise
:Setup:TriggerSource
Internal
Internal
:Setup:TriggerTimeout
0
0
:Setup:TriggerTimes
1
1
:Setup:Zoom:Frequency
0
-
:Setup:Zoom:Mag
2
-
3066 & 3086 3 GHz Real Time Spectrum Analyzer Programmer Manual
Appendix B: Factory Initialization Settings
View Commands
Table B-3: Factory initialization settings Ċ Waveform View commands
Header
Default settings
:View<x>:Average:Times
10
:View<x>:Average:Type
RMSExpo
:View<x>:Compression
Max
:View<x>:Edit
Off
:View<x>:Format
FreqAmpl
:View<x>:Marker:Band:Left
0
:View<x>:Marker:Band:Right
0
:View<x>:Marker:Band:Width
0
:View<x>:Marker:DeltaMarker
Off
:View<x>:Marker:DeltaX
0
:View<x>:Marker:SearchSeparation
2%
:View<x>:Marker:Trace
Trace1
:View<x>:Marker:X
0
:View<x>:MaskVisible
Off
:View<x>:Measurement
Off
:View<x>:Measurement:ACP:BW
0
:View<x>:Measurement:ACP:Marker
Center
:View<x>:Measurement:ACP:SP
0
:View<x>:Measurement:OBW
99 %
:View<x>:Position
100 %
:View<x>:Scale:XScale
1
:View<x>:Scale:XStart
0
:View<x>:Scale:YScale
0
:View<x>:Scale:YStart
0
:View<x>:Source
Active
:View<x>:Trace2:Compression
Max
:View<x>:Trace2:Format
FreqAmpl
:View<x>:Trace2:Source
None
:View<x>:Trace2:Z
0
:View<x>:Z
0
3066 & 3086 3 GHz Real Time Spectrum Analyzer Programmer Manual
B-3
Appendix B: Factory Initialization Settings
Table B-4: Factory initialization settings Ċ Analog View commands
Header
Default settings
:View<x>:Format
AM
:View<x>:Marker:DeltaMarker
Off
:View<x>:Marker:DeltaX
0
:View<x>:Marker:SearchSeparation
2%
:View<x>:Marker:X
0
:View<x>:Scale:XScale
1
:View<x>:Scale:XStart
0
:View<x>:Scale:YScale
200
:View<x>:Scale:YStart
-200
:View<x>:Source
Active
:View<x>:Z
0
Table B-5: Factory initialization settings Ċ FSK View commands
Header
Default settings
:View<x>:Marker:DeltaMarker
Off
:View<x>:Marker:DeltaX
0
:View<x>:Marker:X
0
:View<x>:Scale:XScale
1
:View<x>:Scale:XStart
0
:View<x>:Scale:YScale
0
:View<x>:Scale:YStart
0
:View<x>:Source
Active
:View<x>:Z
0
Table B-6: Factory initialization settings Ċ Spectrogram View commands
B-4
Header
Default settings
:View<x>:Compression
Max
:View<x>:Format
FreqAmpl
:View<x>:Marker:DeltaMarker
Off
:View<x>:Marker:DeltaX
0
3066 & 3086 3 GHz Real Time Spectrum Analyzer Programmer Manual
Appendix B: Factory Initialization Settings
Table B-6: Factory initialization settings Ċ Spectrogram View commands (Cont.)
Header
Default settings
:View<x>:Marker:DeltaZ
0
:View<x>:Marker:SearchSeparation
2%
:View<x>:Marker:X
0
:View<x>:Marker:Z
0
:View<x>:Monochrome
Off
:View<x>:NumberColors
100
:View<x>:Scale:XScale
1
:View<x>:Scale:XStart
0
:View<x>:Scale:YScale
20
:View<x>:Scale:YStart
0
:View<x>:Scale:ZScale
0
:View<x>:Scale:ZStart
0
:View<x>:Source
Active
:View<x>:ZGap
1 pixel
Table B-7: Factory initialization settings Ċ Waterfall View commands
Header
Default settings
:View<x>:Compression
Max
:View<x>:Format
FreqAmpl
:View<x>:Marker:DeltaMarker
Off
:View<x>:Marker:DeltaX
0
:View<x>:Marker:DeltaZ
0
:View<x>:Marker:SearchSeparation
2%
:View<x>:Marker:X
0
:View<x>:Marker:Z
0
:View<x>:Scale:XScale
1
:View<x>:Scale:XStart
0
:View<x>:Scale:YScale
20
:View<x>:Scale:YStart
0
:View<x>:Scale:ZScale
0
:View<x>:Scale:ZStart
0
3066 & 3086 3 GHz Real Time Spectrum Analyzer Programmer Manual
B-5
Appendix B: Factory Initialization Settings
Table B-7: Factory initialization settings Ċ Waterfall View commands (Cont.)
Header
Default settings
:View<x>:Source
Active
:View<x>:YHeight
20
:View<x>:ZGap
5
Table B-8: Factory initialization settings Ċ Polar View commands
B-6
Header
Default settings
:View<x>:AlphaBT
0.5
:View<x>:AutoCarrier
On
:View<x>:Burst:BlockSize
4
:View<x>:Burst:NumberFrames
1
:View<x>:Burst:Offset
0
:View<x>:Burst:Search
Off
:View<x>:Burst:Threshold
-20 dB
:View<x>:Carrier
0
:View<x>:Display
Measurement
:View<x>:Format
Vector
:View<x>:Marker:T
0
:View<x>:MeasDestination
D5D6
:View<x>:MeasFilter
RootRaisedCosine
:View<x>:Modulation
1/4 p QPSK
:View<x>:Position
100 %
:View<x>:RefDestination
D7D8
:View<x>:RefFilter
RaisedCosine
:View<x>:Source
Active
:View<x>:SymbolRate
21 k
:View<x>:Z
0
3066 & 3086 3 GHz Real Time Spectrum Analyzer Programmer Manual
Appendix B: Factory Initialization Settings
Table B-9: Factory initialization settings Ċ Eye diagram View commands
Header
Default settings
:View<x>:EyeLength
2
:View<x>:Format
I
:View<x>:Marker:T
0
:View<x>:Source
Measurement
Table B-10: Factory initialization settings Ċ Symbol View commands
Header
Default settings
:View<x>:Marker:T
0
:View<x>:Radix
Bin
:View<x>:Rotate
0
:View<x>:Source
Measurement
Table B-11: Factory initialization settings Ċ EVM View commands
Header
Default settings
:View<x>:Format
EVM
:View<x>:Marker:DeltaMarker
Off
:View<x>:Marker:DeltaX
0
:View<x>:Marker:X
0
:View<x>:MaskArea
5%
:View<x>:Scale:XScale
1
:View<x>:Scale:XStart
0
:View<x>:Scale:YScale
100
:View<x>:Scale:YStart
0
3066 & 3086 3 GHz Real Time Spectrum Analyzer Programmer Manual
B-7
Appendix B: Factory Initialization Settings
Table B-12: Factory initialization settings Ċ CDMA Waveform View
commands
B-8
Header
Default settings
:View<x>:Average:Times
10
:View<x>:Average:Type
RMSExpo
:View<x>:CDMA:Channel
1
:View<x>:CDMA:Standard
IS95
:View<x>:Compression
Max
:View<x>:Format
FreqAmpl
:View<x>:Marker:DeltaMarker
Off
:View<x>:Marker:DeltaX
0
:View<x>:Marker:SearchSeparation
2%
:View<x>:Marker:X
0
:View<x>:Mask:RBW1M:Frequency
1.385 MHz
:View<x>:Mask:RBW1M:Level
-60
:View<x>:Mask:RBW30k:Frequency1
900 k
:View<x>:Mask:RBW30k:Frequency2
1.98 MHz
:View<x>:Mask:RBW30k:Level1
-42
:View<x>:Mask:RBW30k:Level2
-54
:View<x>:Measurement
Off
:View<x>:Measurement:OBW
99
:View<x>:Measurement:Separation
2
:View<x>:Measurement:SortedBy
Frequency
:View<x>:Measurement:SpuriousSearch
Off
:View<x>:Measurement:Threshold
-100
:View<x>:Position
100 %
:View<x>:RBW
30 kHz
:View<x>:Scale:XScale
1
:View<x>:Scale:XStart
0
:View<x>:Scale:YScale
0
:View<x>:Scale:YStart
0
:View<x>:Source
Active
:View<x>:Z
0
3066 & 3086 3 GHz Real Time Spectrum Analyzer Programmer Manual
Appendix B: Factory Initialization Settings
Table B-13: Factory initialization settings Ċ CDMA Polar View commands
Header
Default settings
:View<x>:AlphaBT
0.2
:View<x>:AutoCarrier
On
:View<x>:Burst:BlockSize
5
:View<x>:Burst:NumberFrames
2
:View<x>:Burst:Offset
0
:View<x>:Burst:Search
Off
:View<x>:Burst:Threshold
-20 dB
:View<x>:Carrier
0
:View<x>:Display
Measurement
:View<x>:Format
Constellation
:View<x>:Marker:T
0
:View<x>:MeasDestination
D5D6
:View<x>:MeasFilter
RootRaisedCosine
:View<x>:Modulation
1/4 p QPSK
:View<x>:Position
100 %
:View<x>:RefDestination
D7D8
:View<x>:RefFilter
RaisedCosine
:View<x>:Source
Active
:View<x>:SymbolRate
1.2288 MHz
:View<x>:Z
0
Table B-14: Factory initialization settings Ċ CDMA Time View commands
Header
Default settings
:View<x>:Average:Times
10
:View<x>:Block
0
:View<x>:Marker:DeltaMarker
Off
:View<x>:Marker:DeltaX
0
:View<x>:Marker:SearchSeparation
2%
:View<x>:Marker:X
0
:View<x>:Mask:OffLeft
169 ms
:View<x>:Mask:OffLevel
-20
3066 & 3086 3 GHz Real Time Spectrum Analyzer Programmer Manual
B-9
Appendix B: Factory Initialization Settings
Table B-14: Factory initialization settings Ċ CDMA Time View commands (Cont.)
Header
Default settings
:View<x>:Mask:OffRight
1.431 ms
:View<x>:Mask:OnLeft
175 ms
:View<x>:Mask:OnLevel
-3
:View<x>:Mask:OnRight
1.425 ms
:View<x>:Position
0
:View<x>:Scale:XScale
1
:View<x>:Scale:XStart
0
:View<x>:Scale:YScale
0
:View<x>:Scale:YStart
0
:View<x>:Source
Active
:View<x>:Trace:TraceVisible
On
:View<x>:Trace2:TraceVisible
Off
Table B-15: Factory initialization settings Ċ CodeSpectrogram View commands
(3066 option 15 and 3086 option 16 only)
B-10
Header
Default settings
:View<x>:Marker:DeltaMarker
Off
:View<x>:Marker:SearchSeparation
2%
:View<x>:Marker:X
0
:View<x>:Marker:Z
0
:View<x>:Monochrome
Off
:View<x>:NumberColors
100
:View<x>:Scale:XScale
1
:View<x>:Scale:XStart
0
:View<x>:Scale:YScale
20
:View<x>:Scale:YStart
0
:View<x>:Scale:ZScale
0
:View<x>:Scale:ZStart
0
:View<x>:ZGap
3 pixels
3066 & 3086 3 GHz Real Time Spectrum Analyzer Programmer Manual
Appendix B: Factory Initialization Settings
Table B-16: Factory initialization settings Ċ CodePolar View commands
(3066 option 15 and 3086 option 16 only)
Header
Default settings
:View<x>:AlphaBT
0.2
:View<x>:Analysis:TimeSlot
0
:View<x>:AutoCarrier
On
:View<x>:Carrier
0
:View<x>:Display
Measurement
:View<x>:Format
Vector
:View<x>:Marker:T
0
:View<x>:MeasFilter
RootRaisedCosine
:View<x>:Modulation
ISĆ95+EQ
:View<x>:RefFilter
RaisedCosine
:View<x>:Source
Active
:View<x>:SymbolRate
1.2288 MHz
:View<x>:Z
0
Table B-17: Factory initialization settings Ċ CodePower View commands
(3066 option 15 and 3086 option 16 only)
Header
Default settings
:View<x>:Average
Off
:View<x>:Average:BeginZ
0
:View<x>:Average:EndZ
0
:View<x>:Average:Times
10
:View<x>:Average:Type
RMSExpo
:View<x>:Marker:DeltaMarker
Off
:View<x>:Marker:SearchSeparation
2%
:View<x>:Marker:X
0
:View<x>:Scale:XScale
1
:View<x>:Scale:XStart
0
:View<x>:Scale:YScale
0
:View<x>:Scale:YStart
0
:View<x>:Z
0
3066 & 3086 3 GHz Real Time Spectrum Analyzer Programmer Manual
B-11
Appendix B: Factory Initialization Settings
Table B-18: Factory initialization settings Ċ CodeWSpectrogram View commands
(3086 option 16 only)
Header
Default settings
:View<x>:Marker:DeltaMarker
Off
:View<x>:Marker:SearchSeparation
2%
:View<x>:Marker:X
0
:View<x>:Marker:Z
0
:View<x>:Monochrome
Off
:View<x>:NumberColors
100
:View<x>:Scale:XScale
1
:View<x>:Scale:XStart
0
:View<x>:Scale:YScale
20
:View<x>:Scale:YStart
0
:View<x>:Scale:ZScale
0
:View<x>:Scale:ZStart
0
:View<x>:SymbolRate
Composite
:View<x>:ZGap
3 pixels
Table B-19: Factory initialization settings Ċ CodeWPolar View commands
(3086 option 16 only)
B-12
Header
Default settings
:View<x>:AlphaBT
0.22
:View<x>:Analysis:TimeSlot
0
:View<x>:AutoCarrier
On
:View<x>:Carrier
0
:View<x>:Display
Measurement
:View<x>:Format
Vector
:View<x>:Marker:T
0
:View<x>:MeasFilter
RootRaisedCosine
:View<x>:Modulation
WĆCDMA
:View<x>:RefFilter
RaisedCosine
:View<x>:ShortCode
0
:View<x>:Source
Active
:View<x>:SymbolConstellation
Off
3066 & 3086 3 GHz Real Time Spectrum Analyzer Programmer Manual
Appendix B: Factory Initialization Settings
Table B-19: Factory initialization settings Ċ CodeWPolar View commands
(3086 option 16 only) (Cont.)
Header
Default settings
:View<x>:SymbolRate
4.096 MHz
:View<x>:TimeSlot
0
Table B-20: Factory initialization settings Ċ CodeWPower View commands
(3086 option 16 only)
Header
Default settings
:View<x>:Average
Off
:View<x>:Average:BeginZ
0
:View<x>:Average:EndZ
0
:View<x>:Average:Times
10
:View<x>:Average:Type
RMSExpo
:View<x>:Marker:DeltaMarker
Off
:View<x>:Marker:SearchSeparation
2%
:View<x>:Marker:X
0
:View<x>:Scale:XScale
1
:View<x>:Scale:XStart
0
:View<x>:Scale:YScale
50
:View<x>:Scale:YStart
-50
:View<x>:ShortCode
0
:View<x>:SymbolRate
Composite
:View<x>:ZAxis
ShortCode
:View<x>:Z
0
Table B-21: Factory initialization settings Ċ CCDF commands
(option 20 only)
Header
Default settings
:View<x>:BeginZ
0
:View<x>:Destination
D1
:View<x>:EndZ
0
:View<x>:Marker:DeltaMarker
Off
3066 & 3086 3 GHz Real Time Spectrum Analyzer Programmer Manual
B-13
Appendix B: Factory Initialization Settings
Table B-21: Factory initialization settings Ċ CCDF commands
(option 20 only) (Cont.)
Header
Default settings
:View<x>:Marker:SearchSeparation
2%
:View<x>:Marker:X
0
:View<x>:OutputFormat
CCDF
:View<x>:Position
100 %
:View<x>:Resolution
0.1
:View<x>:Scale:HoldYScale
Off
:View<x>:Scale:XScale
1
:View<x>:Scale:XStart
0
:View<x>:Scale:XStartZero
Off
:View<x>:Scale:YScale
0
:View<x>:Scale:YStart
0
:View<x>:Source
Active
:View<x>:Z
0
Table B-22: Factory initialization settings Ċ CCDFView commands
(option 20 only)
B-14
Header
Default settings
:View<x>:Marker:DeltaMarker
Off
:View<x>:Marker:SearchSeparation
2%
:View<x>:Marker:X
0
:View<x>:Scale:XScale
1
:View<x>:Scale:XStart
0
:View<x>:Source
Active
3066 & 3086 3 GHz Real Time Spectrum Analyzer Programmer Manual
Appendix B: Factory Initialization Settings
Utility Commands
Table B-23: Factory initialization settings Ċ Self gainĆcalibration commands
Header
Default settings
:Util1:Gain:Auto
On
Table B-24: Factory initialization settings Ċ Save/Load commands
Header
Default settings
:Util2:BeginZ
0
:Util2:EndZ
0
:Util2:Source
Active
Table B-25: Factory initialization settings Ċ Average commands
Header
Default settings
:Util3:BeginZ
0
:Util3:Destination
D1
:Util3:EndZ
0
:Util3:Source
Active
Table B-26: Factory initialization settings Ċ Remote commands
Header
Default settings
:Util8:Format
FreqAmpl
:Util8:GPIB:Interface
Off
:Util8:GPIB:PrimaryAddress
1
:Util8:Header
Off
:Util8:NewLine
CRLF
[:Util8]:NumericOutput
Exp
[:Util8]:Source
Active
[:Util8]:TCPIP:Port:Command
3066
[:Util8]:TCPIP:Port:Event
3067
[:Util8]:Z
0
3066 & 3086 3 GHz Real Time Spectrum Analyzer Programmer Manual
B-15
Appendix B: Factory Initialization Settings
:Config:Mode Command
The :Config:Mode command (refer to page 2–40) overwrites the above default
values as shown in Table B–27 and B–28, depending on its arguments.
Table B-27: Factory initialization settings Ċ :Config:Mode command - 1
Freq1
Freq2
Dual
View style
1
1
1
Setup
Standard
Standard
Standard
Standard
View1
Waveform
Waveform
Waveform
Waveform
View2
-
Spectrogram
Spectrogram
Spectrogram
View3
-
-
Waveform
(Time vs I)
Waveform
Waveform
(Time vs Q)
Spectrogram
1
2
View4
B-16
Zoom
4
2
2
View5 - View8
None
None
None
None
Trigger mode
Auto
Auto
Auto
Auto
Memory mode
Frequency
Frequency
Dual
Zoom
3066 & 3086 3 GHz Real Time Spectrum Analyzer Programmer Manual
Appendix B: Factory Initialization Settings
Table B-28: Factory initialization settings Ċ :Config:Mode command - 2
opCDMA1
opCDMA2
opCDMA3
opCDMA4
opCDMA5
opCDMA6
opDemod1
View style
2
1
1
2
1
1
2
Setup
CDMA
CDMA
CDMA
CDMA
CDMA
CDMA
Standard
View1
CDMA
Waveform
CDMA
Waveform
CDMA Time
CDMA
Waveform
CDMA
Waveform
CDMA Time
Waveform
2
2
2
2
2
Hor. Start
0
Position
50 %
50 %
50 %
50 %
Measurement
Power
Spurious
Power
Spurious
Spectrogram
CDMA
Waveform
Spectrogram
CDMA
Waveform
View2
0
CDMA Time
CDMA Time
Spectrogram
None
None
Polar
50 %
50 %
Measurement
Spurious
Spurious
Position
CDMA Polar
None
None
50 %
CDMA Polar
2
0
Position
View3
2
50 %
View4
EVM
None
None
EVM
None
None
Eye diagram
View5 - View8
None
None
None
None
None
None
None
Standard
ISĆ95
ISĆ95
ISĆ95
TĆ53
TĆ53
TĆ53
Span
5 MHz
30 MHz
5 MHz
5 MHz
30 MHz
5 MHz
Trigger mode
Auto
Normal
Auto
Normal
Memory mode
Input mode
Dual
RF
RF
RF
RF
3066 & 3086 3 GHz Real Time Spectrum Analyzer Programmer Manual
RF
RF
B-17
Appendix B: Factory Initialization Settings
Table B-29: Factory initialization settings Ċ
:Config:Mode command
(3066 option 15 and 3086 option 16 only)
opCode1 1
opCodeW1 2
View style
2
2
Setup
Standard
Standard
View1
Waveform
Waveform
View2
CodeSpectrogram
CodeWSpectrogram
View3
CodePolar
CodeWPolar
View4
CodePower
CodeWPower
View5 - View8
None
None
Span
5 MHz
10 MHz
Trigger mode
Auto
Auto
Memory mode
Zoom
Input mode
RF
2
2
Wideband
1
3066 option 15 and 3086 option 16 only.
2
3066 option 15 only.
Table B-30: Factory initialization settings Ċ
:Config:Mode command (option 20 only)
opCCDF
B-18
View7
CCDF
View8
CCDFView
3066 & 3086 3 GHz Real Time Spectrum Analyzer Programmer Manual
Glossary and Index
Glossary
Amplitude Modulation (AM)
The process, or result of a process, in which the amplitude of a sine wave
(the carrier) is varied in accordance with the instantaneous voltage of a
second electrical signal (the modulating signal).
Bin
A sample point in frequency domain. The frequency bandwidth of a bin is
the span divided by the number of bins.
BNF (Backus-Naur Form)
A standard notation system for command syntax.
Block
A group of the specified number of frames.
Carrier Frequency
The frequency of the carrier signal.
Carrier-to-Noise Ratio (C/N)
The ratio of carrier signal power to average noise power in a given bandwidth surrounding the carrier; usually expressed in decibels.
Center Frequency
That frequency which corresponds to the center of a frequency span,
expressed in hertz.
dBm
A unit of expressed power level in decibels referenced to 1 milliwatt.
Decibel (dB)
Ten times the logarithm of the ratio of one electrical power to another.
Display Reference Level
A designated vertical position representing a specified input level. The level
may be expressed in dBm, volts, or any other units.
EVM
Acronym for the Error Vector Magnitude.
Frame
An area reserved in memory with the length represented by the number of
FFT points. The analyzer acquires data in one frame by one scan in realtime
mode.
3066 & 3086 3 GHz Real Time Spectrum Analyzer Programmer Manual
Glossary-1
Glossary
Filter
A circuit which separates electrical signals or signal components based on
their frequencies.
Frequency Band
The continuous range of frequencies extending between two limiting
frequencies, expressed in hertz.
Frequency Domain Representation
The portrayal of a signal in the frequency domain; representing a signal by
displaying its sine wave components; the signal spectrum.
Frequency Modulation (FM)
The process, or result of a process, in which the frequency of an electrical
signal (the carrier) is varied in accordance with some characteristic of a
second electrical signal (the modulating signal or modulation).
Frequency Range
That range of frequencies over which the performance of the instrument is
specified.
Frequency Response
The unwanted variation in the displayed amplitude over a specified center
frequency range, measured at the center frequency expressed in decibels.
Frequency Span (Dispersion)
The magnitude of the frequency band displayed; expressed in hertz or hertz
per division.
Full Span (Maximum Span)
A mode of operation in which the spectrum analyzer scans an entire
frequency band.
Markers
When the Marker function is enabled, it provides a movable cursor with
readout of frequency and amplitude at the marker position. When the delta
marker mode is enabled, a second marker allows operations and readout
between the two marker positions.
Peak Hold
Digitally stored display mode which, at each frequency address, compares
the incoming signal level to the stored level and retains the greater. In this
mode, the display indicates the peak level at each frequency after several
successive sweeps.
MAX/MIN
A display mode on the spectrum analyzer that shows the maximum and
minimum signal levels at alternate frequency points; its advantage is its
resemblance to an analog display.
Glossary-2
3066 & 3086 3 GHz Real Time Spectrum Analyzer Programmer Manual
Glossary
MIN Hold
A spectrum analyzer feature which captures the minimum signal amplitude
at all displayed frequencies over a series of sweeps.
Modulate
To regulate or vary a characteristic of a signal.
Modulating Signal
The signal which modulates a carrier. The signal which varies or regulates
some characteristic of another signal.
Modulation
The process of varying some characteristic of a signal with a second signal.
Peak Detection
A detection scheme wherein the peak amplitude of a signal is measured and
displayed. In spectrum analysis, 20 log (peak) is often displayed.
Reference Level
The signal level required to deflect the CRT display to the top graticule line.
Resolution Bandwidth (RBW)
The width of the narrowest filter in the IF stages of a spectrum analyzer. The
RBW determines how well the analyzer can resolve or separate two or more
closely spaced signal components.
Span Per Division, Span/Div
Frequency difference represented by each major horizontal division of the
graticule.
Spurious Response
A response to a spectrum analyzer wherein the displayed frequency is not
related to the input frequency.
Vertical Scale Factor, Vertical Display Factor
The number of dB, volts, etc., represented by one vertical division of a
spectrum analyzer display screen.
View (Display)
Enables viewing of contents of the chosen memory section (e.g., “View A”
displays the contents of memory A; “View B” displays the contents of
memory B).
3066 & 3086 3 GHz Real Time Spectrum Analyzer Programmer Manual
Glossary-3
Glossary
Glossary-4
3066 & 3086 3 GHz Real Time Spectrum Analyzer Programmer Manual
Index
A
abbreviations, commands, queries, and parameters, 2–4
Analog View commands
:View<x>:CopyTo, 2–120
:View<x>:Format (?), 2–120
:View<x>:Marker:DeltaMarker (?), 2–121
:View<x>:Marker:DeltaX?, 2–121
:View<x>:Marker:DeltaY?, 2–122
:View<x>:Marker:Peak, 2–122
:View<x>:Marker:ResetDelta, 2–123
:View<x>:Marker:SearchMax, 2–123
:View<x>:Marker:SearchMin, 2–124
:View<x>:Marker:SearchSeparation (?), 2–124
:View<x>:Marker:X (?), 2–125
:View<x>:Marker:Y?, 2–125
:View<x>:Scale:AutoScale, 2–126
:View<x>:Scale:HoldYScale (?), 2–126
:View<x>:Scale:XScale (?), 2–127
:View<x>:Scale:XStart (?), 2–127
:View<x>:Scale:YScale (?), 2–128
:View<x>:Scale:YStart (?), 2–128
:View<x>:Source (?), 2–129
:View<x>:Version?, 2–129
:View<x>:Z (?), 2–130
Average commands
:Util3:AllFrames, 2–376
:Util3:BeginZ (?), 2–376
:Util3:Destination (?), 2–376
:Util3:EndZ (?), 2–377
:Util3:MarkerToFrame, 2–377
:Util3:PeakHold, 2–378
:Util3:RMS, 2–379
:Util3:Source (?), 2–380
:Util3:Version?, 2–380
B
Backus-Naur Form (BNF), 2–1
C
case sensitivity, 2–5
CCDF commands
:View<x>:AllFrames (?), 2–332
:View<x>:Average:Reset, 2–332
:View<x>:BeginZ (?), 2–333
:View<x>:Destination (?), 2–333
:View<x>:EndZ (?), 2–334
:View<x>:Execute, 2–334
:View<x>:Marker:DeltaMarker (?), 2–335
:View<x>:Marker:ResetDelta, 2–335
:View<x>:Marker:SearchMax, 2–336
:View<x>:Marker:SearchMin, 2–336
:View<x>:Marker:SearchSeparation (?), 2–337
:View<x>:Marker:X (?), 2–337
:View<x>:MarkerToFrame, 2–338
:View<x>:OutputFormat (?), 2–338
:View<x>:Position (?), 2–339
:View<x>:Resolution (?), 2–339
:View<x>:Result1?, 2–340
:View<x>:Result2?, 2–340
:View<x>:Result3?, 2–341
:View<x>:Scale:AutoScale, 2–341
:View<x>:Scale:HoldYScale (?), 2–342
:View<x>:Scale:Origin (?), 2–342
:View<x>:Scale:XScale (?), 2–343
:View<x>:Scale:XStart (?), 2–343
:View<x>:Scale:XStartZero (?), 2–344
:View<x>:Scale:YScale (?), 2–344
:View<x>:Scale:YStart (?), 2–345
:View<x>:Source (?), 2–345
:View<x>:Version?, 2–346
:View<x>:Z (?), 2–346
CCDFView commands
:View<x>:CopyFrom, 2–348
:View<x>:CopyTo, 2–348
:View<x>:Marker:DeltaMarker (?), 2–349
:View<x>:Marker:ResetDelta, 2–349
:View<x>:Marker:SearchMax, 2–350
:View<x>:Marker:SearchMin, 2–350
:View<x>:Marker:SearchSeparation (?), 2–351
:View<x>:Marker:X (?), 2–351
:View<x>:Scale:AutoScale, 2–352
:View<x>:Scale:LYStart (?), 2–352
:View<x>:Scale:LYStop (?), 2–353
:View<x>:Scale:XScale (?), 2–353, 2–354
:View<x>:Scale:XStart (?), 2–354
:View<x>:Source (?), 2–355
:View<x>:Version?, 2–355
CDMA Polar View commands
:View<x>:AlphaBT (?), 2–230
:View<x>:AutoCarrier (?), 2–230
:View<x>:Burst:BlockSize (?), 2–231
:View<x>:Burst:NumberFrames (?), 2–231
:View<x>:Burst:Offset (?), 2–232
:View<x>:Burst:Search (?), 2–233
:View<x>:Burst:Threshold (?), 2–233
:View<x>:Carrier (?), 2–234
3066 & 3086 3 GHz Real Time Spectrum Analyzer Programmer Manual
Index-1
Index
:View<x>:Display (?), 2–234
:View<x>:Format (?), 2–235
:View<x>:Marker:A?, 2–235
:View<x>:Marker:DeltaT (?), 2–236
:View<x>:Marker:P?, 2–236
:View<x>:Marker:T (?), 2–236
:View<x>:Marker:X?, 2–237
:View<x>:Marker:Y?, 2–237
:View<x>:MeasDestination (?), 2–238
:View<x>:MeasFilter (?), 2–238
:View<x>:Modulation (?), 2–239
:View<x>:Position (?), 2–239
:View<x>:RefDestination (?), 2–240
:View<x>:RefFilter (?), 2–240
:View<x>:Result<y>?, 2–241
:View<x>:Source (?), 2–241
:View<x>:Standard:CDPD, 2–242
:View<x>:Standard:GSM, 2–242
:View<x>:Standard:IS95, 2–242
:View<x>:Standard:NADC, 2–243
:View<x>:Standard:PDC, 2–243
:View<x>:Standard:PHS, 2–243
:View<x>:Standard:TETRA, 2–244
:View<x>:SymbolRate (?), 2–244
:View<x>:Version?, 2–244
:View<x>:Z (?), 2–245
CDMA Setup commands
:Setup:BlockSize (?), 2–78
:Setup:CDMA:Channel (?), 2–79
:Setup:CDMA:Span30M, 2–79
:Setup:CDMA:Span50M, 2–80
:Setup:CDMA:Span5MAuto, 2–80
:Setup:CDMA:Span5MNormal, 2–81
:Setup:CDMA:Standard (?), 2–81
:Setup:CDMA:TriggerLevel (?), 2–82
:Setup:MarkerToFreq, 2–82
:Setup:MaxSpan, 2–82
:Setup:ReferenceLevel (?), 2–83
:Setup:ReferenceOsc (?), 2–83
:Setup:Span (?), 2–84
:Setup:Trigger (?), 2–85
:Setup:TriggerCount (?), 2–86
:Setup:TriggerDelayed (?), 2–86
:Setup:TriggerDomain (?), 2–87
:Setup:TriggerInterval (?), 2–87
:Setup:TriggerPosition (?), 2–88
:Setup:TriggerSlope (?), 2–88
:Setup:TriggerSource (?), 2–89
:Setup:TriggerTimeout (?), 2–89
:Setup:TriggerTimes (?), 2–90
:Setup:Version?, 2–90
CDMA Time View commands
:View<x>:Average:Times (?), 2–248
Index-2
:View<x>:Block (?), 2–248
:View<x>:BreakMeasure, 2–248
:View<x>:BreakMeasureData, 2–249
:View<x>:Executing?, 2–249
:View<x>:Marker:DeltaMarker (?), 2–250
:View<x>:Marker:DeltaX (?), 2–250
:View<x>:Marker:DeltaY?, 2–251
:View<x>:Marker:Peak, 2–251
:View<x>:Marker:ResetDelta, 2–252
:View<x>:Marker:SearchMax, 2–252
:View<x>:Marker:SearchMin, 2–253
:View<x>:Marker:SearchSeparation (?), 2–253
:View<x>:Marker:X (?), 2–254
:View<x>:Marker:Y?, 2–254
:View<x>:Mask:OffLeft (?), 2–255
:View<x>:Mask:OffLevel (?), 2–255
:View<x>:Mask:OffRight (?), 2–256
:View<x>:Mask:OnLeft (?), 2–257
:View<x>:Mask:OnLevel (?), 2–257
:View<x>:Mask:OnRight (?), 2–258
:View<x>:Measure, 2–259
:View<x>:MeasureData, 2–259
:View<x>:Position (?), 2–260
:View<x>:Result<y>?, 2–260
:View<x>:Scale:FallingEdge, 2–261
:View<x>:Scale:FullScale, 2–261
:View<x>:Scale:HoldYScale (?), 2–262
:View<x>:Scale:RisingEdge, 2–262
:View<x>:Scale:XScale (?), 2–263
:View<x>:Scale:XStart (?), 2–263
:View<x>:Scale:YScale (?), 2–264
:View<x>:Scale:YStart (?), 2–264
:View<x>:Source (?), 2–265
:View<x>:Trace2:TraceVisible (?), 2–265
:View<x>:TraceVisible (?), 2–266
:View<x>:Version?, 2–266
CDMA Waveform View commands
:View<x>:Average:Times (?), 2–208
:View<x>:Average:Type (?), 2–208
:View<x>:CDMA:Channel (?), 2–208
:View<x>:Compression (?), 2–209
:View<x>:CopyFrom, 2–210
:View<x>:CopyTo, 2–210
:View<x>:Format (?), 2–210
:View<x>:Marker:DeltaMarker (?), 2–211
:View<x>:Marker:DeltaX (?), 2–212
:View<x>:Marker:DeltaY?, 2–212
:View<x>:Marker:Peak, 2–213
:View<x>:Marker:ResetDelta, 2–213
:View<x>:Marker:SearchMax, 2–214
:View<x>:Marker:SearchMin, 2–214
:View<x>:Marker:SearchSeparation (?), 2–214
:View<x>:Marker:X (?), 2–215
3066 & 3086 3 GHz Real Time Spectrum Analyzer Programmer Manual
Index
:View<x>:Marker:Y?, 2–215
:View<x>:Mask:RBW1M:Frequency (?), 2–216
:View<x>:Mask:RBW1M:Level (?), 2–216
:View<x>:Mask:RBW30k:Frequency1 (?), 2–217
:View<x>:Mask:RBW30k:Frequency2 (?), 2–217
:View<x>:Mask:RBW30k:Level1 (?), 2–218
:View<x>:Mask:RBW30k:Level2 (?), 2–218
:View<x>:Measurement (?), 2–219
:View<x>:Measurement:OBW (?), 2–219
:View<x>:Measurement:Separation (?), 2–220
:View<x>:Measurement:SortedBy (?), 2–220
:View<x>:Measurement:SpuriousSearch (?), 2–221
:View<x>:Measurement:Threshold (?), 2–221
:View<x>:Position (?), 2–222
:View<x>:RBW (?), 2–222
:View<x>:Result<y>?, 2–223
:View<x>:Scale:AutoScale, 2–224
:View<x>:Scale:HoldYScale (?), 2–224
:View<x>:Scale:XScale (?), 2–225
:View<x>:Scale:XStart (?), 2–225
:View<x>:Scale:YScale (?), 2–226
:View<x>:Scale:YStart (?), 2–226
:View<x>:Source (?), 2–227
:View<x>:Version?, 2–228
:View<x>:Z (?), 2–228
chaining commands and queries, 2–4
character chart, A–1
:Clipboard?, 2–382
CodePolar View commands
:View<x>:AlphaBT (?), 2–278
:View<x>:Analysis:TimeSlot (?), 2–278
:View<x>:Analyze (?), 2–278
:View<x>:AutoCarrier (?), 2–279
:View<x>:BreakAnalyze (?), 2–279
:View<x>:Carrier (?), 2–280
:View<x>:Display (?), 2–280
:View<x>:Format (?), 2–281
:View<x>:Marker:T (?), 2–281
:View<x>:MeasFilter (?), 2–282
:View<x>:Modulation (?), 2–282
:View<x>:RefFilter (?), 2–283
:View<x>:Source (?), 2–283
:View<x>:Standard:IS95EQ, 2–284
:View<x>:SymbolRate (?), 2–285
:View<x>:Version?, 2–285
CodePower View commands
:View<x>:Average (?), 2–288
:View<x>:Average:AllFrames (?), 2–288
:View<x>:Average:BeginZ (?), 2–289
:View<x>:Average:EndZ (?), 2–289
:View<x>:Average:Execute, 2–290
:View<x>:AverageMarkerToFrame, 2–290
:View<x>:Average:Times (?), 2–291
:View<x>:Average:Type (?), 2–291
:View<x>:Marker:DeltaMarker (?), 2–292
:View<x>:Marker:ResetDelta, 2–292
:View<x>:Marker:SearchMax, 2–292
:View<x>:Marker:SearchMin, 2–293
:View<x>:Marker:SearchSeparation (?), 2–293
:View<x>:Marker:X (?), 2–294
:View<x>:Scale:AutoScale, 2–294
:View<x>:Scale:XScale (?), 2–295
:View<x>:Scale:XStart (?), 2–295
:View<x>:Scale:YScale (?), 2–296
:View<x>:Scale:YStart (?), 2–296
:View<x>:Version?, 2–297
:View<x>:Z (?), 2–297
CodeSpectrogram View commands
:View<x>:Marker:DeltaMarker (?), 2–268
:View<x>:Marker:ResetDelta, 2–268
:View<x>:Marker:SearchMax, 2–269
:View<x>:Marker:SearchMin, 2–269
:View<x>:Marker:SearchSeparation (?), 2–270
:View<x>:Marker:X (?), 2–270
:View<x>:Marker:Z (?), 2–271
:View<x>:Monochrome (?), 2–271
:View<x>:NumberColors (?), 2–272
:View<x>:Scale:AutoScale, 2–272
:View<x>:Scale:XScale (?), 2–273
:View<x>:Scale:XStart (?), 2–273
:View<x>:Scale:YScale (?), 2–274
:View<x>:Scale:YStart (?), 2–274
:View<x>:Scale:ZScale (?), 2–275
:View<x>:Scale:ZStart (?), 2–275
:View<x>:Version?, 2–276
:View<x>:ZGap (?), 2–276
CodeWPolar View commands
:View<x>:AlphaBT (?), 2–310
:View<x>:Analysis:TimeSlot (?), 2–310
:View<x>:Analyze (?), 2–310
:View<x>:AutoCarrier (?), 2–311
:View<x>:BreakAnalyze (?), 2–311
:View<x>:Carrier (?), 2–312
:View<x>:Display (?), 2–312
:View<x>:Format (?), 2–313
:View<x>:Marker:T (?), 2–313
:View<x>:MeasFilter (?), 2–314
:View<x>:Modulation (?), 2–314
:View<x>:RefFilter (?), 2–315
:View<x>:ShortCode (?), 2–315
:View<x>:Source (?), 2–316
:View<x>:Standard:WCDMA16M, 2–316
:View<x>:Standard:WCDMA4M, 2–316
:View<x>:Standard:WCDMA8M, 2–317
:View<x>:SymbolConstellation (?), 2–317
:View<x>:SymbolRate (?), 2–318
3066 & 3086 3 GHz Real Time Spectrum Analyzer Programmer Manual
Index-3
Index
:View<x>:TimeSlot (?), 2–318
:View<x>:Version?, 2–318
CodeWPower View commands
:View<x>:Average (?), 2–320
:View<x>:Average:AllFrames (?), 2–320
:View<x>:Average:BeginZ (?), 2–321
:View<x>:Average:EndZ (?), 2–321
:View<x>:Average:Execute, 2–322
:View<x>:AverageMarkerToFrame, 2–322
:View<x>:Average:Times (?), 2–323
:View<x>:Average:Type (?), 2–323
:View<x>:Marker:DeltaMarker (?), 2–324
:View<x>:Marker:ResetDelta, 2–324
:View<x>:Marker:SearchMax, 2–324
:View<x>:Marker:SearchMin, 2–325
:View<x>:Marker:SearchSeparation (?), 2–325
:View<x>:Marker:X (?), 2–326
:View<x>:Scale:AutoScale, 2–326
:View<x>:Scale:XScale (?), 2–327
:View<x>:Scale:XStart (?), 2–327
:View<x>:Scale:YScale (?), 2–328
:View<x>:Scale:YStart (?), 2–328
:View<x>:ShortCode (?), 2–328
:View<x>:SymbolRate (?), 2–329
:View<x>:Version?, 2–329
:View<x>:XAxis (?), 2–330
:View<x>:Z (?), 2–330
CodeWSpectrogram View commands
:View<x>:Marker:DeltaMarker (?), 2–300
:View<x>:Marker:ResetDelta, 2–300
:View<x>:Marker:SearchMax, 2–301
:View<x>:Marker:SearchMin, 2–301
:View<x>:Marker:SearchSeparation (?), 2–302
:View<x>:Marker:X (?), 2–302
:View<x>:Marker:Z (?), 2–303
:View<x>:Monochrome (?), 2–303
:View<x>:NumberColors (?), 2–304
:View<x>:Scale:AutoScale, 2–304
:View<x>:Scale:XScale (?), 2–305
:View<x>:Scale:XStart (?), 2–305
:View<x>:Scale:YScale (?), 2–306
:View<x>:Scale:YStart (?), 2–306
:View<x>:Scale:ZScale (?), 2–307
:View<x>:Scale:ZStart (?), 2–307
:View<x>:SymbolRate (?), 2–308
:View<x>:Version?, 2–308
:View<x>:ZGap (?), 2–308
command
chaining, 2–4
creating, 2–2
groups, 2–7
parts, 1–2
port, 1–6
Index-4
syntax, 2–1
communication
ports, 1–5
setting parameters, 1–7
:Config:Block, 2–38
:Config:Continue, 2–38
:Config:Label, 2–39
:Config:Message, 2–39
:Config:Mode, 2–40
:Config:Mode:Load, 2–41
:Config:Mode:Save, 2–41
:Config:Next, 2–42
:Config:Pause (?), 2–42
:Config:PrintScreen, 2–43
:Config:PrintScreen:Printer, 2–43
:Config:PrintScreen:Printer:Items, 2–44
:Config:PrintScreen:Save, 2–44
:Config:Roll, 2–45
:Config:Setup (?), 2–45
:Config:Setup:Items, 2–46
:Config:Setup:Show, 2–46
:Config:Start, 2–47
:Config:StartAgain, 2–47
:Config:Status:Overload?, 2–48
:Config:Status:Pause?, 2–48
:Config:Status:Triggered?, 2–49
:Config:Status:Uncal?, 2–49
:Config:Stop, 2–50
:Config:System?, 2–50
:Config:Util:Items?, 2–51
:Config:Util<x> (?), 2–51
:Config:Util<x>:Show, 2–52
:Config:Version?, 2–52
:Config:View:BackgroundColor (?), 2–53
:Config:View:Items?, 2–53
:Config:View:MarkerLink (?), 2–54
:Config:View:Style (?), 2–54
:Config:View<x> (?), 2–54
:Config:View<x>:Show (?), 2–56
Configuration commands
:Config:Block, 2–38
:Config:Continue, 2–38
:Config:Label, 2–39
:Config:Message, 2–39
:Config:Mode, 2–40
:Config:Mode:Load, 2–41
:Config:Mode:Save, 2–41
:Config:Next, 2–42
:Config:Pause (?), 2–42
:Config:PrintScreen, 2–43
:Config:PrintScreen:Printer (?), 2–43
:Config:PrintScreen:Printer:Items, 2–44
:Config:PrintScreen:Save, 2–44
3066 & 3086 3 GHz Real Time Spectrum Analyzer Programmer Manual
Index
:Config:Roll, 2–45
:Config:Setup (?), 2–45
:Config:Setup:Items, 2–46
:Config:Setup:Show, 2–46
:Config:Start, 2–47
:Config:StartAgain, 2–47
:Config:Status:Overload?, 2–48
:Config:Status:Pause?, 2–48
:Config:Status:Triggered?, 2–49
:Config:Status:Uncal?, 2–49
:Config:Stop, 2–50
:Config:System?, 2–50
:Config:Util:Items?, 2–51
:Config:Util<x> (?), 2–51
:Config:Util<x>:Show, 2–52
:Config:Version?, 2–52
:Config:View:BackgroundColor (?), 2–53
:Config:View:Items?, 2–53
:Config:View:MarkerLink (?), 2–54
:Config:View:Style (?), 2–54
:Config:View<x> (?), 2–54
:Config:View<x>:Show (?), 2–56
connecting the interface, 1–4
constructed mnemonics, 2–6
creating commands, 2–2
creating queries, 2–2
D
Difference between the 3066 and 3086, 1–1
E
error, messages, 3–4
Ethernet interface, 1–4
event, 3–1
messages, 3–3
port, 1–6, 3–1
EVM View commands
:View<x>:Symbol (?), 2–206
:View<x>:CopyTo, 2–198
:View<x>:Format (?), 2–198
:View<x>:Marker:DeltaMarker (?), 2–199
:View<x>:Marker:DeltaX (?), 2–199
:View<x>:Marker:DeltaY?, 2–200
:View<x>:Marker:ResetDelta, 2–200
:View<x>:Marker:SearchMax, 2–200
:View<x>:Marker:SearchMin, 2–201
:View<x>:Marker:X (?), 2–201
:View<x>:Marker:Y?, 2–202
:View<x>:MaskArea (?), 2–202
:View<x>:Result<y>?, 2–203
:View<x>:Scale:AutoScale, 2–203
:View<x>:Scale:XScale (?), 2–204
:View<x>:Scale:XStart (?), 2–204
:View<x>:Scale:YScale (?), 2–205
:View<x>:Scale:YStart (?), 2–205
:View<x>:Version?, 2–206
examples, programming, 4–1
Eye Diagram View commands
:View<x>:EyeLength (?), 2–188
:View<x>:Format (?), 2–188
:View<x>:Marker:T (?), 2–189
:View<x>:Marker:Y?, 2–189
:View<x>:Source (?), 2–190
:View<x>:Version?, 2–190
F
factory initialization settings, B–1
FSK View commands
:View<x>:CopyTo, 2–132
:View<x>:Marker:DeltaMarker (?), 2–132
:View<x>:Marker:DeltaX (?), 2–133
:View<x>:Marker:DeltaY?, 2–133
:View<x>:Marker:Peak, 2–134
:View<x>:Marker:ResetDelta, 2–134
:View<x>:Marker:SearchMax, 2–134
:View<x>:Marker:SearchMin, 2–135
:View<x>:Marker:SearchSeparation (?), 2–135
:View<x>:Marker:X (?), 2–136
:View<x>:Marker:Y?, 2–136
:View<x>:Scale:AutoScale, 2–136
:View<x>:Scale:HoldYScale (?), 2–137
:View<x>:Scale:XScale (?), 2–137
:View<x>:Scale:XStart (?), 2–138
:View<x>:Scale:YScale (?), 2–138
:View<x>:Scale:YStart (?), 2–139
:View<x>:Source (?), 2–139
:View<x>:Version?, 2–140
:View<x>:Z (?), 2–140
functional groups, 2–8
G
GPIB
configurations, 1–6
connection rules, 1–6
interface, 1–4
port, 1–5
setting parameters, 1–8
3066 & 3086 3 GHz Real Time Spectrum Analyzer Programmer Manual
Index-5
Index
H
:View<x>:Standard:GSM, 2–184
:View<x>:Standard:IS95, 2–284
:View<x>:Standard:NADC, 2–184
:View<x>:Standard:PDC, 2–185
:View<x>:Standard:PHS, 2–185
:View<x>:Standard:TETRA, 2–185
:View<x>:SymbolRate (?), 2–186
:View<x>:Version?, 2–186
:View<x>:Z (?), 2–186
port
command, 1–6
event, 1–6
GPIB, 1–5
TCP/IP, 1–6
programming examples, 4–1
headers in query responses, 2–3
I
initialization settings, B–1
interface
connections, 1–4
Ethernet, 1–4
GPIB, 1–4
M
messages, 3–3
error, 3–4
event, 3–3
obtaining, 3–1
mnemonics, constructed, 2–6
Q
quotes, 2–5
R
P
parameter types, 2–3
Parameter types used in syntax descriptions, 2–3
Polar View commands
:View<x>:AlphaBT (?), 2–172
:View<x>:AutoCarrier (?), 2–172
:View<x>:Burst:BlockSize (?), 2–173
:View<x>:Burst:NumberFrames (?), 2–173
:View<x>:Burst:Offset (?), 2–174
:View<x>:Burst:Search (?), 2–175
:View<x>:Burst:Threshold (?), 2–175
:View<x>:Carrier (?), 2–176
:View<x>:Display (?), 2–176
:View<x>:Format (?), 2–177
:View<x>:Marker:A?, 2–177
:View<x>:Marker:DeltaT (?), 2–178
:View<x>:Marker:P?, 2–178
:View<x>:Marker:T (?), 2–178
:View<x>:Marker:X?, 2–179
:View<x>:Marker:Y?, 2–179
:View<x>:MeasDestination (?), 2–180
:View<x>:MeasFilter (?), 2–180
:View<x>:Modulation (?), 2–181
:View<x>:Position (?), 2–181
:View<x>:RefDestination (?), 2–182
:View<x>:RefFilter (?), 2–182
:View<x>:Result<y>?, 2–183
:View<x>:Source (?), 2–183
:View<x>:Standard:CDPD, 2–184
Index-6
Remote commands
:Clipboard?, 2–382
:Set?, 2–382
[:Util8]:Dev<x>:<command>, 2–383
[:Util8]:Error?, 2–383
[:Util8]:Event:<message>, 2–384
[:Util8]:Format (?), 2–384
[:Util8]:GPIB:Interface (?), 2–385
[:Util8]:GPIB:PrimaryAddress (?), 2–385
[:Util8]:Header (?), 2–386
[:Util8]:Id?, 2–386
[:Util8]:Key, 2–387
[:Util8]:NewLine (?), 2–388
[:Util8]:NumericOutput (?), 2–388
[:Util8]:Register:Data, 2–389
[:Util8]:Register:Header, 2–390
[:Util8]:Source (?), 2–391
[:Util8]:Source:<item>?, 2–392
[:Util8]:Status?, 2–394
[:Util8]:TCPIP:Port:Command (?), 2–395
[:Util8]:TCPIP:Port:Command:Reset, 2–395
[:Util8]:TCPIP:Port:Event (?), 2–396
[:Util8]:TCPIP:Port:Event:Reset, 2–396
[:Util8]:Version?, 2–397
[:Util8]:ViewName?, 2–397
[:Util8]:Z (?), 2–397
[:Util8]:Z:<item>?, 2–398
retrieving response message, 2–399
3066 & 3086 3 GHz Real Time Spectrum Analyzer Programmer Manual
Index
rules, for using commands, 2–5
S
Save/Load commands
:Util2:Buffer:<header> (?), 2–362
:Util2:AllFrames, 2–362
:Util2:BeginZ (?), 2–362
:Util2:Buffer:CopyHeader, 2–364
:Util2:Buffer:SaveHeader, 2–365
:Util2:Data:Load, 2–365
:Util2:Data:Save, 2–366
:Util2:Data:SaveAP, 2–367
:Util2:Data:Saved, 2–367
:Util2:Data:SaveDateTime, 2–369
:Util2:Data:SaveFlatness, 2–370
:Util2:Data:SaveFrame, 2–371
:Util2:Data:SaveHeader, 2–372
:Util2:Data:SaveIQ, 2–368
:Util2:EndZ (?), 2–373
:Util2:MarkerToFrame, 2–373
:Util2:Source (?), 2–374
:Util2:Version?, 2–374
Self Gain-Calibration commands
:Util1:Execute, 2–358
:Util1:Gain:Auto, 2–358
:Util1:Gain:Execute, 2–359
:Util1:IQOffset:Execute, 2–359
:Util1:Result<x>?, 2–360
:Util1:Version?, 2–360
:Util1:WidebandOffset:Request, 2–360
:Set?, 2–382
setting communication parameters, 1–7
:Setup:BlockSize (?)
CDMA Setup, 2–78
Standard Setup, 2–58
:Setup:CDMA:Channel (?), 2–79
:Setup:CDMA:Span30M, 2–79
:Setup:CDMA:Span50M, 2–80
:Setup:CDMA:Span5MAuto, 2–80
:Setup:CDMA:Span5MNormal, 2–81
:Setup:CDMA:Standard (?), 2–81
:Setup:CDMA:TriggerLevel (?), 2–82
:Setup:CenterFrequency (?), 2–59
:Setup:FFTPoints (?), 2–60
:Setup:FFTWindow (?), 2–60
:Setup:FramePeriod (?), 2–61
:Setup:FrequencyOffset (?), 2–61
:Setup:InputCoupling (?), 2–62
:Setup:InputMode (?), 2–63
:Setup:LevelOffset (?), 2–63
:Setup:Load, Standard Setup, 2–64
:Setup:MarkerToFreq
CDMA Setup, 2–82
Standard Setup, 2–64
:Setup:MaxSpan
CDMA Setup, 2–82
Standard Setup, 2–65
:Setup:MemoryMode (?), 2–65
:Setup:ReferenceLevel (?)
CDMA Setup, 2–83
Standard Setup, 2–66
:Setup:ReferenceOsc (?)
CDMA Setup, 2–83
Standard Setup, 2–67
:Setup:Save, Standard Setup, 2–67
:Setup:Span (?)
CDMA Setup, 2–84
Standard Setup, 2–68
:Setup:Trigger (?)
CDMA Setup, 2–85
Standard Setup, 2–68
:Setup:TriggerCount (?)
CDMA Setup, 2–86
Standard Setup, 2–70
:Setup:TriggerDelayed (?)
CDMA Setup, 2–86
Standard Setup, 2–70
:Setup:TriggerDomain (?)
CDMA Setup, 2–87
Standard Setup, 2–71
:Setup:TriggerInterval (?)
CDMA Setup, 2–87
Standard Setup, 2–71
:Setup:TriggerPosition (?)
CDMA Setup, 2–88
Standard Setup, 2–72
:Setup:TriggerSlope (?)
CDMA Setup, 2–88
Standard Setup, 2–72
:Setup:TriggerSource (?)
CDMA Setup, 2–89
Standard Setup, 2–73
:Setup:TriggerTimeout (?)
CDMA Setup, 2–89
Standard Setup, 2–73
:Setup:TriggerTimes (?)
CDMA Setup, 2–90
Standard Setup, 2–74
:Setup:Version?
CDMA Setup, 2–90
Standard Setup, 2–74
:Setup:Zoom:Execute, 2–75
:Setup:Zoom:Frequency (?), 2–75
3066 & 3086 3 GHz Real Time Spectrum Analyzer Programmer Manual
Index-7
Index
:Setup:Zoom:Mag (?), 2–76
SI prefix and unit, 2–5
special characters, 2–3
Spectrogram View commands
:View<x>:Compression (?), 2–142
:View<x>:Format (?), 2–142
:View<x>:Marker:DeltaMarker (?), 2–143
:View<x>:Marker:DeltaT?, 2–143
:View<x>:Marker:DeltaX?, 2–144
:View<x>:Marker:DeltaY?, 2–144
:View<x>:Marker:DeltaZ (?), 2–144
:View<x>:Marker:Peak, 2–145
:View<x>:Marker:ResetDelta, 2–145
:View<x>:Marker:SearchMax, 2–146
:View<x>:Marker:SearchMin, 2–146
:View<x>:Marker:SearchSeparation (?), 2–146
:View<x>:Marker:T?, 2–147
:View<x>:Marker:X (?), 2–147
:View<x>:Marker:Y?, 2–148
:View<x>:Marker:Z (?), 2–148
:View<x>:Monochrome (?), 2–148
:View<x>:NumberColors (?), 2–149
:View<x>:Scale:AutoScale, 2–149
:View<x>:Scale:HoldYScale (?), 2–150
:View<x>:Scale:XScale (?), 2–150
:View<x>:Scale:XStart (?), 2–151
:View<x>:Scale:YScale (?), 2–151
:View<x>:Scale:YStart (?), 2–152
:View<x>:Scale:ZScale (?), 2–152
:View<x>:Scale:ZStart (?), 2–153
:View<x>:Source (?), 2–153
:View<x>:Version?, 2–154
:View<x>:ZGap (?), 2–154
Standard Setup commands
:Setup:FFTWindow (?), 2–60
:Setup:BlockSize (?), 2–58
:Setup:CenterFrequency (?), 2–59
:Setup:FFTPoints (?), 2–60
:Setup:FramePeriod (?), 2–61
:Setup:FrequencyOffset (?), 2–61
:Setup:InputCoupling (?), 2–62
:Setup:InputMode (?), 2–63
:Setup:LevelOffset (?), 2–63
:Setup:Load, 2–64
:Setup:MarkerToFreq, 2–64
:Setup:MaxSpan, 2–65
:Setup:MemoryMode (?), 2–65
:Setup:ReferenceLevel (?), 2–66
:Setup:ReferenceOsc (?), 2–67
:Setup:Save, 2–67
:Setup:Span (?), 2–68
:Setup:Trigger (?), 2–68
:Setup:TriggerCount (?), 2–70
Index-8
:Setup:TriggerDelayed (?), 2–70
:Setup:TriggerDomain (?), 2–71
:Setup:TriggerInterval (?), 2–71
:Setup:TriggerPosition (?), 2–72
:Setup:TriggerSlope (?), 2–72
:Setup:TriggerSource (?), 2–73
:Setup:TriggerTimeout (?), 2–73
:Setup:TriggerTimes (?), 2–74
:Setup:Version?, 2–74
:Setup:Zoom:Execute, 2–75
:Setup:Zoom:Frequency (?), 2–75
:Setup:Zoom:Mag (?), 2–76
status, 3–1
Status Byte Register, 3–2
Symbol Table View commands
:View<x>:Symbol (?), 2–195
:View<x>:CopyTo, 2–192
:View<x>:Marker:Data?, 2–192
:View<x>:Marker:Symbol?, 2–193
:View<x>:Marker:T (?), 2–193
:View<x>:Radix (?), 2–194
:View<x>:Rotate (?), 2–194
:View<x>:Source (?), 2–195
:View<x>:Version?, 2–196
syntax, command, 2–1
T
TCP/IP
event port, 3–1
port, 1–6
setting parameters, 1–9
U
unit and SI prefix, 2–5
:Util1:Execute, 2–358
:Util1:Gain:Auto, 2–358
:Util1:Gain:Execute, 2–359
:Util1:IQOffset:Execute, 2–359
:Util1:Result<x>?, 2–360
:Util1:Version?, 2–360
:Util1:WideOffset:Request, 2–360
:Util2:AllFrames, 2–362
:Util2:BeginZ (?), 2–362
:Util2:Buffer:<header> (?), 2–362
:Util2:Buffer:CopyHeader, 2–364
:Util2:Buffer:SaveHeader, 2–365
:Util2:Data:Load, 2–365
:Util2:Data:Save, 2–366
:Util2:Data:SaveAP, 2–367
:Util2:Data:Saved, 2–367
3066 & 3086 3 GHz Real Time Spectrum Analyzer Programmer Manual
Index
:Util2:Data:SaveDateTime, 2–369
:Util2:Data:SaveFlatness, 2–370
:Util2:Data:SaveFrame, 2–371
:Util2:Data:SaveHeader, 2–372
:Util2:Data:SaveIQ, 2–368
:Util2:EndZ (?), 2–373
:Util2:MarkerToFrame, 2–373
:Util2:Source (?), 2–374
:Util2:Version?, 2–374
:Util3:AllFrames, 2–376
:Util3:BeginZ (?), 2–376
:Util3:Destination (?), 2–376
:Util3:EndZ (?), 2–377
:Util3:MarkerToFrame, 2–377
:Util3:PeakHold, 2–378
:Util3:RMS, 2–379
:Util3:Source (?), 2–380
:Util3:Version?, 2–380
[:Util8]:Dev<x>:<command>, 2–383
[:Util8]:Error?, 2–383
[:Util8]:Event:<message>, 2–384
[:Util8]:Format (?), 2–384
[:Util8]:GPIB:Interface (?), 2–385
[:Util8]:GPIB:PrimaryAddress (?), 2–385
[:Util8]:Header (?), 2–386
[:Util8]:Id?, 2–386
[:Util8]:Key, 2–387
[:Util8]:NewLine (?), 2–388
[:Util8]:NumericOutput (?), 2–388
[:Util8]:Register:Data, 2–389
[:Util8]:Register:Header, 2–390
[:Util8]:Source (?), 2–391
[:Util8]:Source:<item>?, 2–392
[:Util8]:Status?, 2–394
[:Util8]:TCPIP:Port:Command (?), 2–395
[:Util8]:TCPIP:Port:Command:Reset, 2–395
[:Util8]:TCPIP:Port:Event (?), 2–396
[:Util8]:TCPIP:Port:Event:Reset, 2–396
[:Util8]:Version?, 2–397
[:Util8]:ViewName?, 2–397
[:Util8]:Z (?), 2–397
[:Util8]:Z:<item>?, 2–398
V
:View<x>:Symbol (?)
EVM View, 2–206
Symbol Table View, 2–195
:View<x>:AllFrames (?), CCDF, 2–332
:View<x>:AlphaBT (?)
CDMA Polar View, 2–230
CodePolar View, 2–278
CodeWPolar View, 2–310
Polar View, 2–172
:View<x>:Analysis:TimeSlot (?)
CodePolar View, 2–278
CodeWPolar View, 2–310
:View<x>:Analyze (?)
CodePolar View, 2–278
CodeWPolar View, 2–310
:View<x>:AutoCarrier (?)
CDMA Polar View, 2–230
CodePolar View, 2–279
CodeWPolar View, 2–311
Polar View, 2–172
:View<x>:Average (?)
CodePower View, 2–288
CodeWPower View, 2–320
:View<x>:Average:AllFrames (?)
CodePower View, 2–288
CodeWPower View, 2–320
:View<x>:Average:BeginZ (?)
CodePower View, 2–289
CodeWPower View, 2–321
:View<x>:Average:EndZ (?)
CodePower View, 2–289
CodeWPower View, 2–321
:View<x>:Average:Execute
CodePower View, 2–290
CodeWPower View, 2–322
:View<x>:Average:MarkerToFrame
CodePower View, 2–290
CodeWPower View, 2–322
:View<x>:Average:Reset, CCDF, 2–332
:View<x>:Average:Times (?)
CDMA Time View, 2–248
CDMA Waveform View, 2–208
CodePower View, 2–291
CodeWPower View, 2–323
Waveform View, 2–92
:View<x>:Average:Type (?)
CDMA Waveform View, 2–208
CodePower View, 2–291
CodeWPower View, 2–323
Waveform View, 2–92
:View<x>:BeginZ (?), CCDF, 2–333
:View<x>:Block (?), CDMA Time View, 2–248
:View<x>:BreakAnalyze (?)
CodePolar View, 2–279
CodeWPolar View, 2–311
:View<x>:BreakMeasure, CDMA Time View, 2–248
:View<x>:BreakMeasureData, CDMA Time View,
2–249
:View<x>:Burst:BlockSize (?)
3066 & 3086 3 GHz Real Time Spectrum Analyzer Programmer Manual
Index-9
Index
CDMA Polar View, 2–231
Polar View, 2–173
:View<x>:Burst:NumberFrames (?)
CDMA Polar View, 2–231
Polar View, 2–173
:View<x>:Burst:Offset (?)
CDMA Polar View, 2–232
Polar View, 2–174
:View<x>:Burst:Search (?)
CDMA Polar View, 2–233
Polar View, 2–175
:View<x>:Burst:Threshold (?)
CDMA Polar View, 2–233
Polar View, 2–175
:View<x>:Carrier (?)
CDMA Polar View, 2–234
CodePolar View, 2–280
CodeWPolar View, 2–312
Polar View, 2–176
:View<x>:CDMA:Channel (?), CDMA Waveform
View, 2–208
:View<x>:Compression (?)
CDMA Waveform View, 2–209
Spectrogram View, 2–142
Waterfall View, 2–156
Waveform View, 2–93
:View<x>:CopyFrom
CCDFView, 2–348
CDMA Waveform View, 2–210
Waveform View, 2–93
:View<x>:CopyTo
Analog View, 2–120
CCDFView, 2–348
CDMA Waveform View, 2–210
EVM View, 2–198
FSK View, 2–132
Symbol Table View, 2–192
Waveform View, 2–94
:View<x>:Destination (?), CCDF, 2–333
:View<x>:Display (?)
CDMA Polar View, 2–234
CodePolar View, 2–280
CodeWPolar View, 2–312
Polar View, 2–176
:View<x>:Edit (?), Waveform View, 2–94
:View<x>:Edit:DrawHorizontal, Waveform View, 2–95
:View<x>:Edit:DrawLine, Waveform View, 2–95
:View<x>:Edit:DrawMax, Waveform View, 2–96
:View<x>:Edit:DrawMin, Waveform View, 2–96
:View<x>:Edit:Y (?), Waveform View, 2–96
:View<x>:EndZ (?), CCDF, 2–334
:View<x>:Execute, CCDF, 2–334
:View<x>:Executing?, CDMA Time View, 2–249
Index-10
:View<x>:EyeLength (?), Eye Diagram View, 2–188
:View<x>:Format (?)
Analog View, 2–120
CDMA Polar View, 2–235
CDMA Waveform View, 2–210
CodePolar View, 2–281
CodeWPolar View, 2–313
EVM View, 2–198
Eye Diagram View, 2–188
Polar View, 2–177
Spectrogram View, 2–142
Waterfall View, 2–157
Waveform View, 2–97
:View<x>:Marker:A?
CDMA Polar View, 2–235
Polar View, 2–177
:View<x>:Marker:Band:Center (?), Waveform View,
2–98
:View<x>:Marker:Band:Left (?), Waveform View, 2–98
:View<x>:Marker:Band:Right (?), Waveform View,
2–99
:View<x>:Marker:Band:Width (?), Waveform View,
2–99
:View<x>:Marker:Data?, Symbol Table View, 2–192
:View<x>:Marker:DeltaMarker (?)
Analog View, 2–121
CCDF, 2–335
CCDFView, 2–349
CDMA Time View, 2–250
CDMA Waveform View, 2–211
CodePower View, 2–292
CodeSpectrogram View, 2–268
CodeWPower View, 2–324
CodeWSpectrogram View, 2–300
EVM View, 2–199
FSK View, 2–132
Spectrogram View, 2–143
Waterfall View, 2–158
Waveform View, 2–100
:View<x>:Marker:DeltaT (?)
CDMA Polar View, 2–236
Polar View, 2–178
:View<x>:Marker:DeltaT?
Spectrogram View, 2–143
Waterfall View, 2–158
:View<x>:Marker:DeltaX (?)
CDMA Time View, 2–250
CDMA Waveform View, 2–212
EVM View, 2–199
FSK View, 2–133
Waterfall View, 2–159
Waveform View, 2–100
:View<x>:Marker:DeltaX?
3066 & 3086 3 GHz Real Time Spectrum Analyzer Programmer Manual
Index
Spectrogram View, 2–144
Waveform View, 2–121
:View<x>:Marker:DeltaY?
CDMA Time View, 2–251
CDMA Waveform View, 2–212
EVM View, 2–200
FSK View, 2–133
Spectrogram View, 2–144
Waterfall View, 2–159
Waveform View, 2–101, 2–122
:View<x>:Marker:DeltaZ (?)
Spectrogram View, 2–144
Waterfall View, 2–160
:View<x>:Marker:P?
CDMA Polar View, 2–236
Polar View, 2–178
:View<x>:Marker:Peak
Analog View, 2–122
CDMA Time View, 2–251
CDMA Waveform View, 2–213
FSK View, 2–134
Spectrogram View, 2–145
Waterfall View, 2–160
Waveform View, 2–101
:View<x>:Marker:ResetDelta
Analog View, 2–123
CCDF, 2–335
CCDFView, 2–349
CDMA Time View, 2–252
CDMA Waveform View, 2–213
CodePower View, 2–292
CodeSpectrogram View, 2–268
CodeWPower View, 2–324
CodeWSpectrogram View, 2–300
EVM View, 2–200
FSK View, 2–134
Spectrogram View, 2–145
Waterfall View, 2–161
Waveform View, 2–102
:View<x>:Marker:SearchMax
Analog View, 2–123
CCDF, 2–336
CCDFView, 2–350
CDMA Time View, 2–252
CDMA Waveform View, 2–214
CodePower View, 2–292
CodeSpectrogram View, 2–269
CodeWPower View, 2–324
CodeWSpectrogram View, 2–301
EVM View, 2–200
FSK View, 2–134
Spectrogram View, 2–146
Waterfall View, 2–161
Waveform View, 2–102
:View<x>:Marker:SearchMin
Analog View, 2–124
CCDF, 2–336
CCDFView, 2–350
CDMA Time View, 2–253
CDMA Waveform View, 2–214
CodePower View, 2–293
CodeSpectrogram View, 2–269
CodeWPower View, 2–325
CodeWSpectrogram View, 2–301
EVM View, 2–201
FSK View, 2–135
Spectrogram View, 2–146
Waterfall View, 2–162
Waveform View, 2–103
:View<x>:Marker:SearchSeparation (?)
Analog View, 2–124
CCDF, 2–337
CCDFView, 2–351
CDMA Time View, 2–253
CDMA Waveform View, 2–214
CodePower View, 2–293
CodeSpectrogram View, 2–270
CodeWPower View, 2–325
CodeWSpectrogram View, 2–302
FSK View, 2–135
Spectrogram View, 2–146
Waterfall View, 2–162
Waveform View, 2–103
:View<x>:Marker:Symbol?, Symbol Table View, 2–193
:View<x>:Marker:T (?)
CDMA Polar View, 2–236
CodePolar View, 2–281
CodeWPolar View, 2–313
Eye Diagram View, 2–189
Polar View, 2–178
Symbol Table View, 2–193
:View<x>:Marker:T?
Spectrogram View, 2–147
Waterfall View, 2–163
:View<x>:Marker:Trace (?), Waveform View, 2–104
:View<x>:Marker:X (?)
Analog View, 2–125
CCDF, 2–337
CCDFView, 2–351
CDMA Time View, 2–254
CDMA Waveform View, 2–215
CodePower View, 2–294
CodeSpectrogram View, 2–270
CodeWPower View, 2–326
CodeWSpectrogram View, 2–302
EVM View, 2–201
3066 & 3086 3 GHz Real Time Spectrum Analyzer Programmer Manual
Index-11
Index
FSK View, 2–136
Spectrogram View, 2–147
Waterfall View, 2–163
Waveform View, 2–104
:View<x>:Marker:X?
CDMA Polar View, 2–237
Polar View, 2–179
:View<x>:Marker:Y?
Analog View, 2–125
CDMA Polar View, 2–237
CDMA Time View, 2–254
CDMA Waveform View, 2–215
EVM View, 2–202
Eye Diagram View, 2–189
FSK View, 2–136
Polar View, 2–179
Spectrogram View, 2–148
Waterfall View, 2–164
Waveform View, 2–105
:View<x>:Marker:Z (?)
CodeSpectrogram View, 2–271
CodeWSpectrogram View, 2–303
Spectrogram View, 2–148
Waterfall View, 2–164
:View<x>:MarkerToFrame, CCDF, 2–338
:View<x>:Mask:OffLeft (?), CDMA Time View, 2–255
:View<x>:Mask:OffLevel (?), CDMA Time View,
2–255
:View<x>:Mask:OffRight (?), CDMA Time View,
2–256
:View<x>:Mask:OnLeft (?), CDMA Time View, 2–257
:View<x>:Mask:OnLevel (?), CDMA Time View,
2–257
:View<x>:Mask:OnRight (?), CDMA Time View,
2–258
:View<x>:Mask:RBW1M:Frequency (?), CDMA
Waveform View, 2–216
:View<x>:Mask:RBW1M:Level (?), CDMA Waveform
View, 2–216
:View<x>:Mask:RBW30k:Frequency1 (?), CDMA
Waveform View, 2–217
:View<x>:Mask:RBW30k:Frequency2 (?), CDMA
Waveform View, 2–217
:View<x>:Mask:RBW30k:Level1 (?), CDMA
Waveform View, 2–218
:View<x>:Mask:RBW30k:Level2 (?), CDMA
Waveform View, 2–218
:View<x>:MaskArea (?), EVM View, 2–202
:View<x>:MaskVisible (?), Waveform View, 2–105
:View<x>:MeasDestination (?)
CDMA Polar View, 2–238
Polar View, 2–180
Index-12
:View<x>:MeasFilter (?)
CDMA Polar View, 2–238
CodePolar View, 2–282
CodeWPolar View, 2–314
Polar View, 2–180
:View<x>:Measure, CDMA Time View, 2–259
:View<x>:MeasureData, CDMA Time View, 2–259
:View<x>:Measurement (?)
CDMA Waveform View, 2–219
Waveform View, 2–106
:View<x>:Measurement:ACP:BW (?), Waveform View,
2–107
:View<x>:Measurement:ACP:Marker (?), Waveform
View, 2–107
:View<x>:Measurement:ACP:SP (?), Waveform View,
2–108
:View<x>:Measurement:OBW (?)
CDMA Waveform View, 2–219
Waveform View, 2–108
:View<x>:Measurement:Separation (?), CDMA
Waveform View, 2–220
:View<x>:Measurement:SortedBy (?), CDMA
Waveform View, 2–220
:View<x>:Measurement:SpuriousSearch (?), CDMA
Waveform View, 2–221
:View<x>:Measurement:Threshold (?), CDMA
Waveform View, 2–221
:View<x>:Modulation (?)
CDMA Polar View, 2–239
CodePolar View, 2–282
CodeWPolar View, 2–314
Polar View, 2–181
:View<x>:Monochrome (?)
CodeSpectrogram View, 2–271
CodeWSpectrogram View, 2–303
Spectrogram View, 2–148
:View<x>:NumberColors (?)
CodeSpectrogram View, 2–272
CodeWSpectrogram View, 2–304
Spectrogram View, 2–149
:View<x>:OutputFormat (?), CCDF, 2–338
:View<x>:Position (?)
CCDF, 2–339
CDMA Polar View, 2–239
CDMA Time View, 2–260
CDMA Waveform View, 2–222
Polar View, 2–181
Waveform View, 2–109
:View<x>:Radix (?), Symbol Table View, 2–194
:View<x>:RBW (?), CDMA Waveform View, 2–222
:View<x>:RefDestination (?)
CDMA Polar View, 2–240
3066 & 3086 3 GHz Real Time Spectrum Analyzer Programmer Manual
Index
Polar View, 2–182
:View<x>:RefFilter (?)
CDMA Polar View, 2–240
CodePolar View, 2–283
CodeWPolar View, 2–315
Polar View, 2–182
:View<x>:Resolution (?), CCDF, 2–339
:View<x>:Result<y>?
CDMA Polar View, 2–241
CDMA Time View, 2–260
CDMA Waveform View, 2–223
EVM View, 2–203
Polar View, 2–183
Waveform View, 2–109
:View<x>:Result1?, CCDF, 2–340
:View<x>:Result2?, CCDF, 2–340
:View<x>:Result3?, CCDF, 2–341
:View<x>:Rotate (?), Symbol Table View, 2–194
:View<x>:Scale:AutoScale
Analog View, 2–126
CCDF, 2–341
CCDFView, 2–352
CDMA Waveform View, 2–224
CodePower View, 2–294
CodeSpectrogram View, 2–272
CodeWPower View, 2–326
CodeWSpectrogram View, 2–304
EVM View, 2–203
FSK View, 2–136
Spectrogram View, 2–149
Waterfall View, 2–165
Waveform View, 2–110
:View<x>:Scale:FallingEdge, CDMA Time View,
2–261
:View<x>:Scale:FullScale, CDMA Time View, 2–261
:View<x>:Scale:HoldYScale (?)
Analog View, 2–126
CCDF, 2–342
CDMA Time View, 2–262
CDMA Waveform View commands, 2–224
FSK View, 2–137
Spectrogram View, 2–150
Waterfall View, 2–165
Waveform View, 2–110
:View<x>:Scale:LYStart (?), CCDFView, 2–352
:View<x>:Scale:LYStop (?), CCDFView, 2–353
:View<x>:Scale:Origin (?)
CCDF, 2–342
CCDFView, 2–353
:View<x>:Scale:RisingEdge, CDMA Time View,
2–262
:View<x>:Scale:XScale (?)
Analog View, 2–127
CCDF, 2–343
CCDFView, 2–354
CDMA Time View, 2–263
CDMA Waveform View, 2–225
CodePower View, 2–295
CodeSpectrogram View, 2–273
CodeWPower View, 2–327
CodeWSpectrogram View, 2–305
EVM View, 2–204
FSK View, 2–137
Spectrogram View, 2–150
Waterfall View, 2–166
Waveform View, 2–111
:View<x>:Scale:XStart (?)
Analog View, 2–127
CCDF, 2–343
CCDFView, 2–354
CDMA Time View, 2–263
CDMA Waveform View, 2–225
CodePower View, 2–295
CodeSpectrogram View, 2–273
CodeWPower View, 2–327
CodeWSpectrogram View, 2–305
EVM View, 2–204
FSK View, 2–138
Spectrogram View, 2–151
Waterfall View, 2–166
Waveform View, 2–111
:View<x>:Scale:XStartZero (?), CCDF, 2–344
:View<x>:Scale:YScale (?)
Analog View, 2–128
CCDF, 2–344
CDMA Time View, 2–264
CDMA Waveform View, 2–226
CodePower View, 2–296
CodeSpectrogram View, 2–274
CodeWPower View, 2–328
CodeWSpectrogram View, 2–306
EVM View, 2–205
FSK View, 2–138
Spectrogram View, 2–151
Waterfall View, 2–167
Waveform View, 2–112
:View<x>:Scale:YStart (?)
Analog View, 2–128
CCDF, 2–345
CDMA Time View, 2–264
CDMA Waveform View, 2–226
CodePower View, 2–296
CodeSpectrogram View, 2–274
CodeWPower View, 2–328
CodeWSpectrogram View, 2–306
EVM View, 2–205
3066 & 3086 3 GHz Real Time Spectrum Analyzer Programmer Manual
Index-13
Index
FSK View, 2–139
Spectrogram View, 2–152
Waterfall View, 2–167
Waveform View, 2–112
:View<x>:Scale:ZScale (?)
CodeSpectrogram View, 2–275
CodeWSpectrogram View, 2–307
Spectrogram View, 2–152
Waterfall View, 2–168
:View<x>:Scale:ZStart (?)
CodeSpectrogram View, 2–275
CodeWSpectrogram View, 2–307
Spectrogram View, 2–153
Waterfall View, 2–168
:View<x>:ShortCode (?)
CodeWPolar View, 2–315
CodeWPower View, 2–328
:View<x>:Source (?)
Analog View, 2–129
CCDF, 2–345
CCDFView, 2–355
CDMA Polar View, 2–241
CDMA Time View, 2–265
CDMA Waveform View, 2–227
CodePolar View, 2–283
CodeWPolar View, 2–316
Eye Diagram View, 2–190
FSK View, 2–139
Polar View, 2–183
Spectrogram View, 2–153
Symbol Table View, 2–195
Waterfall View, 2–169
Waveform View, 2–113
:View<x>:Standard:CDPD
CDMA Polar View, 2–242
Polar View, 2–184
:View<x>:Standard:GSM
CDMA Polar View, 2–242
Polar View, 2–184
:View<x>:Standard:IS95
CDMA Polar View, 2–242
CodePolar View, 2–284
:View<x>:Standard:IS95EQ, CodePolar View, 2–284
:View<x>:Standard:NADC
CDMA Polar View, 2–243
Polar View, 2–184
:View<x>:Standard:PDC
CDMA Polar View, 2–243
Polar View, 2–185
:View<x>:Standard:PHS
CDMA Polar View, 2–243
Polar View, 2–185
:View<x>:Standard:TETRA
Index-14
CDMA Polar View, 2–244
Polar View, 2–185
:View<x>:Standard:WCDMA16M, CodeWPolar View,
2–316
:View<x>:Standard:WCDMA4M, CodeWPolar View,
2–316
:View<x>:Standard:WCDMA8M, CodeWPolar View,
2–317
:View<x>:SymbolConstellation (?), CodeWPolar View,
2–317
:View<x>:SymbolRate (?)
CDMA Polar View, 2–244
CodePolar View, 2–285
CodeWPolar View, 2–318
CodeWPower View, 2–329
CodeWSpectrogram View, 2–308
Polar View, 2–186
:View<x>:TimeSlot (?), CodeWPolar View, 2–318
:View<x>:Trace2:Compression (?), Waveform View,
2–114
:View<x>:Trace2:Format (?), Waveform View, 2–115
:View<x>:Trace2:Source (?), Waveform View, 2–116
:View<x>:Trace2:TraceVisible (?), CDMA Time View,
2–265
:View<x>:Trace2:Z (?), Waveform View, 2–116
:View<x>:TraceVisible (?), CDMA Time View, 2–266
:View<x>:Version?
Analog View, 2–129
CCDF, 2–346
CCDFView, 2–355
CDMA Polar View, 2–244
CDMA Time View, 2–266
CDMA Waveform View, 2–228
CodePolar View, 2–285
CodePower View, 2–297
CodeSpectrogram View, 2–276
CodeWPolar View, 2–318
CodeWPower View, 2–329
CodeWSpectrogram View, 2–308
EVM View, 2–206
Eye Diagram View, 2–190
FSK View, 2–140
Polar View, 2–186
Spectrogram View, 2–154
Symbol Table View, 2–196
Waterfall View, 2–169
Waveform View, 2–117
:View<x>:XAxis (?), CodeWPower View, 2–330
:View<x>:YHeight (?), Waterfall View, 2–170
:View<x>:Z (?)
Analog View, 2–130
CCDF, 2–346
CDMA Polar View, 2–245
3066 & 3086 3 GHz Real Time Spectrum Analyzer Programmer Manual
Index
CDMA Waveform View, 2–228
CodePower View, 2–297
CodeWPower View, 2–330
FSK View, 2–140
Polar View, 2–186
Waveform View, 2–117
:View<x>:ZGap (?)
CodeSpectrogram View, 2–276
CodeWSpectrogram View, 2–308
Spectrogram View, 2–154
Waterfall View, 2–170
W
Waterfall View commands
:View<x>:Compression (?), 2–156
:View<x>:Format (?), 2–157
:View<x>:Marker:DeltaMarker (?), 2–158
:View<x>:Marker:DeltaT?, 2–158
:View<x>:Marker:DeltaX (?), 2–159
:View<x>:Marker:DeltaY?, 2–159
:View<x>:Marker:DeltaZ (?), 2–160
:View<x>:Marker:Peak, 2–160
:View<x>:Marker:ResetDelta, 2–161
:View<x>:Marker:SearchMax, 2–161
:View<x>:Marker:SearchMin, 2–162
:View<x>:Marker:SearchSeparation (?), 2–162
:View<x>:Marker:T?, 2–163
:View<x>:Marker:X (?), 2–163
:View<x>:Marker:Y?, 2–164
:View<x>:Marker:Z (?), 2–164
:View<x>:Scale:AutoScale, 2–165
:View<x>:Scale:HoldYScale (?), 2–165
:View<x>:Scale:XScale (?), 2–166
:View<x>:Scale:XStart (?), 2–166
:View<x>:Scale:YScale (?), 2–167
:View<x>:Scale:YStart (?), 2–167
:View<x>:Scale:ZScale (?), 2–168
:View<x>:Scale:ZStart (?), 2–168
:View<x>:Source (?), 2–169
:View<x>:Version?, 2–169
:View<x>:YHeight (?), 2–170
:View<x>:ZGap (?), 2–170
Waveform View commands
:View<x>:Average:Times (?), 2–92
:View<x>:Average:Type (?), 2–92
:View<x>:Compression (?), 2–93
:View<x>:CopyFrom, 2–93
:View<x>:CopyTo, 2–94
:View<x>:Edit (?), 2–94
:View<x>:Edit:DrawHorizontal, 2–95
:View<x>:Edit:DrawLine, 2–95
:View<x>:Edit:DrawMax, 2–96
:View<x>:Edit:DrawMin, 2–96
:View<x>:Edit:Y (?), 2–96
:View<x>:Format (?), 2–97
:View<x>:Marker:Band:Center (?), 2–98
:View<x>:Marker:Band:Left (?), 2–98
:View<x>:Marker:Band:Right (?), 2–99
:View<x>:Marker:Band:Width (?), 2–99
:View<x>:Marker:DeltaMarker (?), 2–100
:View<x>:Marker:DeltaX (?), 2–100
:View<x>:Marker:DeltaY?, 2–101
:View<x>:Marker:Peak, 2–101
:View<x>:Marker:ResetDelta, 2–102
:View<x>:Marker:SearchMax, 2–102
:View<x>:Marker:SearchMin, 2–103
:View<x>:Marker:SearchSeparation (?), 2–103
:View<x>:Marker:Trace (?), 2–104
:View<x>:Marker:X (?), 2–104
:View<x>:Marker:Y?, 2–105
:View<x>:MaskVisible (?), 2–105
:View<x>:Measurement (?), 2–106
:View<x>:Measurement:ACP:BW (?), 2–107
:View<x>:Measurement:ACP:Marker (?), 2–107
:View<x>:Measurement:ACP:SP (?), 2–108
:View<x>:Measurement:OBW (?), 2–108
:View<x>:Position (?), 2–109
:View<x>:Result<y>?, 2–109
:View<x>:Scale:AutoScale, 2–110
:View<x>:Scale:HoldYScale (?), 2–110
:View<x>:Scale:XScale (?), 2–111
:View<x>:Scale:XStart (?), 2–111
:View<x>:Scale:YScale (?), 2–112
:View<x>:Scale:YStart (?), 2–112
:View<x>:Source (?), 2–113
:View<x>:Trace2:Compression (?), 2–114
:View<x>:Trace2:Format (?), 2–115
:View<x>:Trace2:Source (?), 2–116
:View<x>:Trace2:Z (?), 2–116
:View<x>:Version?, 2–117
:View<x>:Z (?), 2–117
Where to find other information, vii
3066 & 3086 3 GHz Real Time Spectrum Analyzer Programmer Manual
Index-15
Index
Index-16
3066 & 3086 3 GHz Real Time Spectrum Analyzer Programmer Manual