1
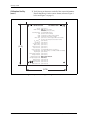
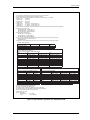
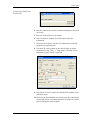
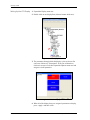
GE
Sensing & Inspection Technologies
Sentinel™
Flow Measurement System
Setup & Calibration Guide
GE
Sensing & Inspection Technologies
Sentinel™
Flow Measurement System
Setup & Calibration Guide
916-114A
January 2009
January 2009
Table of Contents
Scope . . . . . . . . . . . . . . . . . . . . . . . . . . . . . . . . . . . . . . . . . . . . . . . . . . . . . . . . . . . . . . . . . . . . . . . . . . . . . . . . . . . . . . . 1
Calibration Facility . . . . . . . . . . . . . . . . . . . . . . . . . . . . . . . . . . . . . . . . . . . . . . . . . . . . . . . . . . . . . . . . . . . . . . . . . . . 1
Decoding the IGM878N Model Number . . . . . . . . . . . . . . . . . . . . . . . . . . . . . . . . . . . . . . . . . . . . . . . . . . . . 9
Establishing PC Communications. . . . . . . . . . . . . . . . . . . . . . . . . . . . . . . . . . . . . . . . . . . . . . . . . . . . . . . . . . 9
Initial Check of the FHII Option Card . . . . . . . . . . . . . . . . . . . . . . . . . . . . . . . . . . . . . . . . . . . . . . . . . . . . . . 13
Saving A Site File . . . . . . . . . . . . . . . . . . . . . . . . . . . . . . . . . . . . . . . . . . . . . . . . . . . . . . . . . . . . . . . . . . . . . . . . 14
Setting up the Meter For Natural Gas Calibrations. . . . . . . . . . . . . . . . . . . . . . . . . . . . . . . . . . . . . . . . . 15
Setting the SkanTO Values . . . . . . . . . . . . . . . . . . . . . . . . . . . . . . . . . . . . . . . . . . . . . . . . . . . . . . . . . . . . . . . 17
Checking the Meter Reported Soundspeed . . . . . . . . . . . . . . . . . . . . . . . . . . . . . . . . . . . . . . . . . . . . . . . 18
Checking the Δt Offset . . . . . . . . . . . . . . . . . . . . . . . . . . . . . . . . . . . . . . . . . . . . . . . . . . . . . . . . . . . . . . . . . . . 21
Setting the Antecedent Factor . . . . . . . . . . . . . . . . . . . . . . . . . . . . . . . . . . . . . . . . . . . . . . . . . . . . . . . . . . . 22
Data Reduction . . . . . . . . . . . . . . . . . . . . . . . . . . . . . . . . . . . . . . . . . . . . . . . . . . . . . . . . . . . . . . . . . . . . . . . . . 23
Programming Meter K-Factor Tables . . . . . . . . . . . . . . . . . . . . . . . . . . . . . . . . . . . . . . . . . . . . . . . . . . . . . 31
Converting a Site File to Excel . . . . . . . . . . . . . . . . . . . . . . . . . . . . . . . . . . . . . . . . . . . . . . . . . . . . . . . . . . . . 32
Setting Up the LCD Display. . . . . . . . . . . . . . . . . . . . . . . . . . . . . . . . . . . . . . . . . . . . . . . . . . . . . . . . . . . . . . . 34
Upgrading Old Software . . . . . . . . . . . . . . . . . . . . . . . . . . . . . . . . . . . . . . . . . . . . . . . . . . . . . . . . . . . . . . . . . 35
Viewing the SkanTO Settings . . . . . . . . . . . . . . . . . . . . . . . . . . . . . . . . . . . . . . . . . . . . . . . . . . . . . . . . . . . . . 35
Resetting the SkanTO Values After Erasing the Meter Memory . . . . . . . . . . . . . . . . . . . . . . . . . . . . . 36
Checking the Analog Inputs . . . . . . . . . . . . . . . . . . . . . . . . . . . . . . . . . . . . . . . . . . . . . . . . . . . . . . . . . . . . . . 36
Checking the Frequency Output. . . . . . . . . . . . . . . . . . . . . . . . . . . . . . . . . . . . . . . . . . . . . . . . . . . . . . . . . . 38
Customer Site. . . . . . . . . . . . . . . . . . . . . . . . . . . . . . . . . . . . . . . . . . . . . . . . . . . . . . . . . . . . . . . . . . . . . . . . . . . . . . . 39
Sealing Procedure. . . . . . . . . . . . . . . . . . . . . . . . . . . . . . . . . . . . . . . . . . . . . . . . . . . . . . . . . . . . . . . . . . . . . . . . . . . 39
iii
January 2009
Scope
This procedure documents the steps required in calibrating a Sentinel
flowmeter at a third party calibration facility. This is geared towards
the facility's personnel and/or the GE Sensing Field Service
Representative assisting or witnessing the calibration.
The calibration will be done in such a way as to properly calibrate
each path independently while the calibration facility will record only
the averaged channel. By logging individual path data using
PanaView, the absolute best correction factors can be calculated
without problems that can arise when using the IGM analog outputs,
as they are not as accurate as the true serial data from the meter
processor itself.
A special data reduction program was developed to be used
specifically with the Sentinel and the PanaView data files to quickly
go through the data and provide an summarized Excel spread sheet, as
well as the k-factor tables for both channels 1 and 2. The averaged
channel will then, by default, be corrected to pass the final calibration
verification points.
Neither gas composition nor active P and T inputs affect the actual
volumetric flow rate calculations used for the calibration. This is why
these can all be set up at the factory well ahead of time.
The GE Sensing Field Service Representative should keep a hand
written (or electronically typed) log file during the entire calibration
to make note of events as the calibration progresses. Keeping such a
log is beneficial if questions come about after the calibration is
completed, or even when the unit is installed at the customer site. The
more details kept in the log, the easier it will be to recreate the events
during the calibration day even long after it is over.
Calibration Facility
1. The meter and meter body should be in thermal equilibrium with
the lab. To accomplish this, the meter should be located in the
facility the day prior to the calibration.
2. Ensure the meter calibration set-up is appropriate
•
Undisturbed, upstream and downstream straight pipe run is
required. At least 15f up stream from the CPA-50E and 5f
down stream of the Sentinel flowcell is required. 30f and 10f
would be better, and more is always preferred.
•
CPA-50E installed in correct location between the 10f upstream
section and the facility inlet piping.
Note: The pipe upstream of the CPA must be the same diameter. No
reducers shall be installed immediately upstream of the CPA.
•
Sentinel Setup and Calibration Guide
Record the serial numbers of the CPA-50E and the 10f
upstream section to be included on the calibration certificate.
1
January 2009
Calibration Facility
(cont.)
3. Verify the tag on the meter reads all of the correct information.
Ensure that the tag is in the correct format (reference Figure 1
below and Figure 2 on page 3).
- Reverse Flow
(3.75)
Forward Flow +
Tag #.: [see Note 2]
SENin per order]
Order String: SEN-[fill
IGM878NIGM878N-[fill
in per order]
Assembly Date: [YYYY-MM-DD format]
S/N: [flowcell serial number]
PO#: [customer purchase order number]
SO#: [customer sales order number]
Meter Size: [see Note 3, nominal pipe OD and schedule]
ID: [to three decimal places based on CMM]
Q min/Q t/Q max: [see Table 1]
HF Output: [see Table 2]
Storage Temp: [see Note 4]
Oper. Temp:: [see Note 5]
Oper. Pressure: [see Note 6]
Test Pressure: [see Note 7]
Hydro Test Date: [YYYY-MM-DD format , see Note 7]
Flange Class: [see flange rating; i.e. 300lbs, 600lbs or 900lbs]
Dry Weight: [see Table 3]
Meter Body Material: [see Note 8]
Flange Material: [see Note 9]
Body Design Code: DOT 49 CFR PART 192
Flange Design Code: ANSI B16.5
Dispensation: [see Note 10]
Flow Cell Mfg: [see Note 11]
Mfg Serial No. [see Note 11]
NoBo ident . No: [see Note 11]
(3.75)
Figure 1: Specification Tag (ref. dwg #442-959B)
2
Sentinel Setup and Calibration Guide
January 2009
NOTES:
1. For US orders, use English units; for any other country, use metric units.
2. Leave blank unless customer requested a specific number.
3. Fill in nominal OD and pipe schedule on line based on order string, i.e. 6” SCH80
4. English units:
-40 to 140F
Metric Units:
-40 to 60C
5. English units:
-22 to 140F
Metric Units:
-30 to 60C
6. 300# system:
1 to 51bar – if order string is 30
600# system:
1 to 102bar – if order string is 60
900# system:
1 to 153bar – if order string is 90
7. Fill in with actual hydrostatic test pressure and the date the test was performed by the flow cell fabricator.
8. Depends on the order string
ASTM A106 GR.B - if order string is 1
ASTM A333 GR.6 - if order string is 2
See the drawing for special materials
9. Depends on the order string
ASTM A105 - if order string is 1
ASTM A350 LF2 - if order string is 2
See the drawing for special materials
10. Fill in country name and dispensation number based on which country the flow meter is sold
to; leave blank if country is not on the list:
Netherlands B37
11. Depends on who fabricates the flow cell section of the flow meter; Only include the CE mark
for PED certified fabricators
Fabricator Name
Triad-Measurement
Kooiman Apparatenbouw
Mfg Serial No.
NoBo Ident. No.
051582-1
0343
Table 1 – Maximum, Minimum, and Transition Flow Rates
English / Metric Units (See Note 1)
Entry Format Example ### / #### / ##### ACFM
Pipe
Qmin
Qt
Diameter
4”
20ACFM / 34m3/h
94ACFM / 160m3/h
6”
29ACFM / 44m3/h
213ACFM / 362m3/h
8”
50ACFM / 76m3/h
369ACFM / 627m3/h
10”
79ACFM / 120m3/h
582 ACFM / 989m3/h
12”
70ACFM / 106m3/h
623ACFM / 1053m3/h
14”
85ACFM / 128m3/h
752ACFM / 1272m3/h
16”
110ACFM / 168m3/h
983ACFM / 1662m3/h
18”
140ACFM / 213m3/h
1244ACFM / 2104m3/h
20”
174ACFM / 264m3/h
1546ACFM / 2614m3/h
24”
251ACFM / 382m3/h
2236ACFM / 3781m3/h
Table 2 – HF Output
English / Metric Units (See Note 1)
Entry Format Example: ###.###pulses/ACF
Pipe Diameter
pulses/ACF
pulses/ m3
4”
872.093
30743.0
6”
384.123
13549.1
8”
221.729
7824.39
10”
140.680
4963.46
12”
131.406
4662.61
14”
108.735
3858.11
16”
83.2408
2953.24
18”
65.7606
2333.12
20”
52.9194
1877.64
24”
36.5898
1298.23
CE Mark?
NO
YES
Qmax
626ACFM / 1064m3/h
1420ACFM / 2416m3/h
2460ACFM / 4183m3/h
3877ACFM / 6593m3/h
4151ACFM / 7019m3/h
5017ACFM / 8483m3/h
6553ACFM / 11082m3/h
8295ACFM / 14027m3/h
10307ACFM / 17430m3/h
14908ACFM / 25209m3/h
Table 3 – Pipe Weights
English / Metric Units (See Note 1)
Entry Format Example ###lbs
Pipe Diameter
300# Flanges
4”
236lbs / 107kg
6”
387lbs / 176kg
8”
470lbs / 213kg
10”
581lbs / 264kg
12”
731lbs / 332kg
14”
905lbs / 411kg
16”
1067lbs / 484kg
18”
1259lbs / 571kg
20”
1528lbs / 693kg
24”
2255lbs / 1023kg
600# Flanges
270lbs / 122kg
473lbs / 215kg
593lbs / 269kg
832lbs / 377kg
1014lbs / 460kg
1331lbs / 604kg
1747lbs / 792kg
2031lbs / 921kg
2557lbs / 1160kg
3691lbs / 1674kg
12. Remove all burrs and break sharp edges.
13. Finish: Fine Texture Matt (Mill Finish)
14. All areas shown in black to be etched to 0.010+/-0.001 deep.
15. All etched areas to be black baked enamel filled (Process Black)
16. Artwork per Adobe Illustrator file 442-959_B.ai
17. Make from 421-1645
18. Font: GE Inspira
Reverse Flow....
11 pt, Bold
Tag #...
7.75 pt, Regular
900# Flanges
304lbs / 138kg
568lbs / 258kg
794lbs / 360kg
1048lbs / 475kg
1401lbs / 635kg
1881lbs / 853kg
2302lbs / 1044kg
3003lbs / 1362kg
3765lbs / 1708kg
6386lbs / 2897kg
~
//
Figure 2: Specification Tag Notes (ref. dwg #442-959B)
Sentinel Setup and Calibration Guide
3
January 2009
Calibration Facility
(cont.)
4. Connect power to the meter
•
Use the label on the IGM878N electronics to determine AC or
DC power. See Decoding the IGM878N Model Number on
page 9.
•
Connect the appropriate power to the meter. Once power is
applied, the meter will go through the power-up cycle.
•
Observe the boot-up cycle for any issues. Watch for the node ID
number.
•
Once the power-up cycle is complete, the meter should be
operational with a green light and no errors (if the pipeline is
pressurized with natural gas at this point, there may be a sound
speed error because the meter may still be programmed for air)
5. Connect a laptop running the latest version of PanaView to the
meter using the RS232 or RS485 (depends on the customer
selected option and is given in the model number). See
Establishing PC Communications on page 9.
6. Immediately save a site file before doing anything to the meter.
See Saving a Site File on page 14.
7. Check to ensure the meter is setup for a natural gas calibration by
following the Setting up the Meter For Natural Gas Calibrations
section on page 15. Enter the kinematic viscosity as closely as
known so that the Reynolds corrections work out better. The error
incurred is not very large, but every effort to minimize calibrations
errors should be made.
8. Check to ensure there are no pre-programmed calibration factors
already entered into the meter. Follow Programming Meter
K-factor Tables on page 31 and check channels 1, 2, and 5. Clear
any tables that have values in them (do not use 0's).
9. Connect the frequency output of the meter to the facilities
frequency counter. Be sure the facility can handle the high speed
of the output (10kHz).
4
•
See the Sentinel User's Manual, or the Sentinel Field Service
Manual for the proper way to wire the frequency output.
•
The frequency output should have been setup at the factory
prior to shipping the meter to the calibration facility. The face
plate tag lists the output meter factor on it in pulses/volumetric
flow rate. Units depend on the destination country. It is the max
output, 10kHz, scaled to a value of the maximum meter flow
from the averaged channel (channel 5).
Sentinel Setup and Calibration Guide
January 2009
Calibration Facility
(cont.)
•
If the frequency output needs to be adjusted to suit the facility
data acquisition system, note any changes that are made so they
can be changed back after the calibration is complete.
•
Ensure the frequency output is functioning by forcing values of
the frequency output of the IGM through PanaView and
comparing the forced frequency to that being read by the
facility.
10.Have the facility completely fill the line with natural gas and allow
time for the temperature to stabilize. If they can flow gas through
the line to stabilize the temperature, this is preferred.
11.Once the temperature is stabilized, have the facility completely
close the pipe section in which the Sentinel is installed. Both
upstream and downstream valves should be closed to completely
stop flow in the pipe.
12.Set up and start a general log file for the entire calibration and
collect the following parameters. Be sure the log is running prior
to doing the next steps. Setting up the logs while waiting for the
temperature to stabilize is a good way to save a bit of time. Allow
the log to run continuously for the entire calibration. There is no
need to start and stop this file until after the calibration verification
points are finished. A log file name should be used to ensure there
is no confusion when the calibration is completed. Collect the
following parameters:
• Ch1 Vel - Vinst_Ft/S
• Ch1 Diag - SkanTO samples
• Ch2 Diag - Meas Mode
• Ch1 Vel - Vel_Ft/S
• Ch1 Diag - SkanTO delta samples • Ch2 Diag - Delta T usecs
• Ch1 SndSp - SOS_Ft/S
• Ch2 Vel - Vinst_Ft/S
• Ch2 Diag - SkanTO samples
• Ch1 Diag - ReynoldsNum
• Ch2 SndSp - SOS_Ft/S
• Average Vel - Vel_Ft/S
• Ch1 Diag - ReynoldsK
• Ch2 ActEngVol - ACF/M
• Average SndSp - SOS_Ft/S
• Ch1 Diag - Meas Mode
• Ch2 Diag - ReynoldsNum
• Average ActEngVol - ACF/M
• Ch1 Diag - Delta T usecs
• Ch2 Diag - ReynoldsK
Note: English units are not required, metric is acceptable.
13.Set up a second log which will be used just to log data during the
calibration points. Do not start this log yet. This log will run only
when the calibration points are running. A log file name should be
used to ensure there is no confusion when the calibration is
completed. Collect the following parameters:
• Ch1 Vel - Vel_Ft/S
• Ch2 ActEngVol - ACF/M
• Ch1 SndSp - SOS_Ft/S
• Average Vel - Vel_Ft/S
• Ch1 ActEngVol - ACF/M
• Average SndSp - SOS_Ft/S
• Ch2 Vel - Vel_Ft/S
• Average ActEngVol - ACF/M
• Ch2 SndSp - SOS_Ft/S
Sentinel Setup and Calibration Guide
5
January 2009
Calibration Facility
(cont.)
Note: English units are not required. Metric is acceptable as long as
a parameter from either ActEngVol or ActMetVol is used
consistently across channels 1, 2, and average.
14.Once the temperature is stabilized, have the facility completely
close the pipe section in which the Sentinel is installed. Both
upstream and downstream valves should be closed to completely
stop flow in the pipe.
15.Perform the SkanTO adjustment by following Setting the SkanTO
Values on page 17. Record this value from PanaView for each
channel and have it added to the calibration certificate (the values
need to be communicated to the calibration facility and added as
part of the meter programming section).
Issues with this step can be identified in the next step of adjusting
the tw. If there are problems in the next step, this step will need to
be redone.
16.Check the sound speed at zero flow and adjust the Time Delay
(tw) values for each channel as needed in order to get the
measured sound speed to match the theoretical soundspeed of the
calibration fluid within 1ft/sec. See Checking the Meter Reported
Soundspeed on page 18. If the tw are different by 10ms, the
SkanTO setup was not successful. It must be done again until the
tw for both channels are not 10ms different (difference of 1 or 2
micros are acceptable).
17.Check the Δt at zero flow and adjust Δt offset as needed. See
Checking the Δt Offset on page 21 for details.
18.Have the facility set the flow rate to about 50% qmax. If the
difference between Adjust the antecedent factor for each channel.
See Setting the Antecedent Factor on page 22 for calculating the
individual channel corrections.
6
Sentinel Setup and Calibration Guide
January 2009
Calibration Facility
(cont.)
19.Run the calibration at 6 flow points.
•
Start the second "start/stop" log (the one with fewer logged
parameters) at the beginning of each calibration point; a
calibration point is defined as the time during which the
calibration facility is collecting data from both the flow meter
and the reference. Usually there are three of these repeat
calibration points per velocity condition. Be sure to click the
<NO> button when prompted by PanaView to erase the log you want to append to the existing log. There are usually three
to five points at each flow condition. Start and stop the log at
the beginning and end of each point. Coordinate with the
calibration leader so the log starts and stops are consistent with
the calibration data point that the facility is collecting. The
timing does not need to be perfectly synchronized, but it should
be close.
•
Allow for at least 30seconds between each calibration point
(between repeat points) at a given flow condition. This is
critical for fast data reduction after the calibration run is
completed.
•
The facility will still be recording the average channel
frequency output through their data acquisition system. No
intervention is needed for this data.
•
The following flow conditions should be run for the calibration.
At least three repeat points (sometimes even five, depending on
the calibration facility) should be run for each condition. (These
are the start / stop points for the log file.) Each repeat point
should run for at least 120 seconds.
Table 1: Flow Conditions
Velocity Setpoint (ft/sec)
Sentinel Setup and Calibration Guide
Flow Rate
4” - 10”
Diam. Meters
12” - 24”
Diam. Meters
Minimum
2.4
1.5
10% max
12
8.9
25% max
30
22
40% max
47
36
70% max
83
62
Maximum
118
89
7
January 2009
Calibration Facility
(cont.)
20.Reduce the data from the calibration and enter the k-factor tables
for channels 1 and 2 into the meter. See Data Reduction on
page 23 for the procedure. In summary:
•
Export the start/stop log file from PanaView.
•
Run the data reduction program.
•
Examine the reduced data.
•
Enter the reference data from the facility.
•
Review the calculated individual channel k-factors.
•
Extrapolate down to 0 and up to 140ft/sec.
21.Program the k-factors into the meter by following the procedure in
Programming Meter K-factor Tables on page 31.
22.Save a site file with the calibration data entered.
23.Run the verification points to ensure calibration is correct.
•
There should be no need to utilize the start/stop log for the
verification points
•
Keep the main log running though, for backup data
•
The following flow conditions should be run for the calibration;
at least three repeat points should be run for each condition;
each point should run for at least 120seconds.
•
50ft/sec
•
75ft/sec
24.Reconfigure any of the outputs changed for the calibration back to
the original settings as per customer expectations.
25.Save the site file as the meter is ready to leave the calibration
facility. See Converting a Site File to Excel on page 32 on how to
provide the calibration facility, an easily readable site file that
should be included in the calibration report.
26.Export the general log file (the log with the longer list of
parameters) and name it YYYYMMDD_general_log_meterSN,
where YYYYMMDD is the calibration data, and the meterSN is the
serial number for the meter being calibrated. Save it as the default
.txt file format. This file can also be copied into and saved with the
reduced data to keep all of the data from the calibration in one
single file.
8
Sentinel Setup and Calibration Guide
January 2009
Decoding the IGM878N
Model Number
The IGM878N electronics has a model number which describes the
combination of options that make up the meter. This model number
can be found on one of the several tags attached to the electronics
enclosures. The number format and associated options are:
IGM878N-BCD-E-F-G-Z
B - POWER
1 – 100-264VAC
2 – 15-28VDC
D - RECEIVER FREQUENCY
F - OUTPUT OPTION CARD
1 – BROADBAND (100KHz-200KHz) 1-Frequency, Hermetic Alarm, Dual Inputs
2 – 100KHz NARROWBAND
2–Redundant Frequency, Dual Alarms
3 – 200KHz NARROWBAND
C - COMMUNICATIONS E - AGA8 CALCULATIONS
1 – RS232
0 – No AGA8 Equations
2 – RS485
1 – AGA8 Equations Enabled
G - AX/EX
Ax – American Explosion Proof
Ex – European Explosion Proof
Z - SPECIAL
0 – No Special
S – Special
Establishing PC
Communications
1. Connect to the meter using a laptop running PanaView. If the
output is RS232, using a long cable may prohibit communications.
If the output is RS485, a long cable can be used, but a converter
box is needed to allow communications directly to a laptop.
The Sentinel User's Manual, or the Sentinel Field Service Manual
lays out the proper connections for wiring up the RS232 or RS485
communications lines.
2. Open the latest version of PanaView.
3. Select <File> - <New Meter Browser>.
Figure 3: New Meter Browser
Sentinel Setup and Calibration Guide
9
January 2009
Establishing PC
Communications (cont.)
4. Set up the communications port (if not already set up) by selecting
(single left click) on, then right clicking on <My Computer> and
then selecting <New> → <Communications Port>.
g
y
p
g
Figure 4: Communications Port Selection
5. Set up the communications port as shown in Figure 5 below. Be
sure the baud rate is correct.
Figure 5: Settings for COM 1
6. Select <Network> - <My Computer> - <Untitled (Com 1)>. The
menu tree can be expanded by either single clicking the "+" button
next to an item, or double clicking the text for that item.
g
Figure 6: Untitled (Com 1)
10
Sentinel Setup and Calibration Guide
January 2009
Establishing PC
Communications (cont.)
7. Select (single left click) on <Untitled (Com 1)> , then right click,
select <New> → <Meter>.
g
Figure 7: New Meter Selection
8. Select <I know the node ID…> from the pop-up box and click
<OK>.
9. Click <OK> on next pop-up box giving the instructions.
10.Enter "16" in the <ID> field under the <Node ID> section.
Figure 8: ID Section Location
Sentinel Setup and Calibration Guide
11
January 2009
Establishing PC
Communications (cont.)
11.Click <OK> and if the communications lines are correct, the meter
should communicate with the laptop. If the communications are
working, you should see something like this (the Sent and Rcvd
counters should quickly count upward).
y
p
Figure 9: Click OK Button
Note: If there is a communications problem, PanaView will give a
timeout error like this:
p
,
g
Figure 10: Timeout Error
Check the communications lines. There may be a case where the node
ID number programmed into the meter is different from 16; the node
ID number can be verified by unplugging and powering the meter
back up. The node ID number will be displayed during meter boot up.
12.When asked to configure the path properties, select <No>.
13.Synchronize the Sentinel clock with the laptop.
•
Left click then right click on <New Meter> to bring up
<Properties>
Figure 11: Properties Selection
12
Sentinel Setup and Calibration Guide
January 2009
Establishing PC
Communications (cont.)
•
Click the <Sync to PC> button under the Clock: section.
Figure 12: Sync to PC Button
•
Initial Check of the FHII
Option Card
Click the <OK> button.
If none of the inputs or output have been previously assigned to
particular I/O.
1. With the meter connected to PanaView, navigate the menu tree to
the section marked Unassigned I/O.
2. Click the "+" button to expand the Unassigned I/O menu tree.
The following items should be visible:
Sentinel Setup and Calibration Guide
•
Unassigned Recorder IO1
•
Unassigned Recorder IO2
•
Unassigned Frequency IO5
•
Unassigned ADC IO7
•
Unassigned ADC IO8
13
January 2009
Initial Check of the FHII
Option Card (cont.)
Figure 13: Unassigned I/O List
If these items are not visible, the card is more than likely
malfunctioning and needs to be replaced by another card. The
malfunctioning card could be refreshed by reinitializing it in an XMT
meter.
Saving A Site File
1. First be sure the LED display is set up to have four items shown,
even if they are all the same item. There is a known bug that will
cause PanaView to fail while saving the site file if fewer than four
items have been selected to be displayed. See Setting Up the LED
Display on page 34
2. From the meter browser window, click on and then right click on
New Meter (Sentinel) and select Site File.
Figure 14: Site File Option Location
14
Sentinel Setup and Calibration Guide
January 2009
Saving a Site File (cont.)
3. In the Site Files dialog box, be sure Create a site file from the
meter is selected and the press <OK>.
Figure 15: Site File Selection
4. The Save As dialog box appears. Give the site file a useful name
and save the file.
5. See Converting a Site File to Excel on page 32 for the method to
reformat the site file into something easier to read.
Setting up the Meter For
Natural Gas Calibrations
1. From the Meter Browser screen, select <New Meter> →
<Properties> to bring up the properties dialog box for the meter.
Click the <Signal Setup…> button at the bottom left.
2. Select the <Channel 1> tab and the <Fluids> tab.
Figure 16: Signal Setup Screen
Sentinel Setup and Calibration Guide
15
January 2009
Setting up the Meter For
Natural Gas Calibrations
(cont.)
If the meter is defaulted for air. It must be changed to natural gas
while doing a natural gas calibration. To change the fluid type, the
meter must first be put into Program Mode, and to do that, the user
name and password must be entered for security reasons.
3. Press the <Set User> button near the top right to log into the meter.
4. The user name is PanaService, and the password is PanaIGM.
These are case sensitive.
5. Press the <Program> button at the top right to put the meter into
program mode.
6. Select Natural Gas under the Fluids dropdown menu. Then fill in
the facility parameters for:
•
Cnst. P (the gas pressure in mega Pascals)
•
Cnst. T (the gas temperature in degrees Celsius)
•
K Viscosity (the gas kinematic viscosity in feet2 / second)
•
Be sure the Reynolds On/Off box for Reynolds correction is
checked
y
y
Figure 17: Signal Setup Screen
7. Click the <Apply> button to save the new values.
8. Repeat this procedure for Channel 2 then press <Apply>.
9. Press the <Run> button to return the meter to run mode.
16
Sentinel Setup and Calibration Guide
January 2009
Setting the SkanTO Values
1. The pipeline must be full of natural gas and as close to the process
pressure of the final customer's pipeline (or the process fluid of the
customer).
2. Bring up the Signal Setup dialog box.
3. Use the <Set User> button to log into the meter
USERNAME: PanaService
PASSWORD: PanaIGM
Figure 18: Signal Setup Screen
4. This needs to be done for only one channel and both will be set, so
use Channel 1.
5. Press the <Program> button.
6. In the <Fine/Coarse Sw Pt:> box enter 8000 (this clears the value).
7. Press <Apply>.
8. Wait 15 seconds.
9. Press <Run>.
10.Wait 15 seconds.
11.Press <Program>.
12.In the <Fine/Coarse Sw Pt:> box enter 9000 (this sets the value).
13.Press <Apply>.
14.Wait 15 seconds.
15.Press <Run>.
Sentinel Setup and Calibration Guide
17
January 2009
Setting the SkanTO Values
(cont.)
16.Wait 15 seconds.
17.Press <Program>.
18.In the <Fine/Coarse Sw Pt:> box enter 9999 (this puts it into
standard mode).
19.Press <Apply>.
20.Wait 15 seconds.
21.Press <Run>.
22.Check the settings by following the Viewing the SkanTO Settings
procedure.
Checking the Meter
Reported Soundspeed
To check the meter soundspeed, the pipeline must first be filled and
pressurized with natural gas, but not flowing. Have the facility
operator pressurize the pipe to design pressure as stated by the
application data sheet, and then close the facility valves around the
meter locking in the pressure and shutting off any potential flow.
1. In the Signal Setup dialog box, select the <Channel 1> tab and
then the <Diagnostics> tab.
2. Check the <Auto Refresh> check box and observe the live
readings from the meter.
g
Figure 19: Signal Setup Screen
3. First be sure there are no errors listed in the Errors box. If there
are, they need to be addressed first.
18
Sentinel Setup and Calibration Guide
January 2009
Checking the Meter
Reported Soundspeed
(cont.)
4. Next, observe the Sound Speed. The facility operators should be
able to give the fluid sound speed based on their gas conditions.
SonicWare can also be used. Note that in the above screen shot,
the sound speed shown is that for air, not natural gas - the sound
speed for high pressure natural gas should be on the order of
1390 ft/sec.
If the reported sound speed does not match within 1ft/sec of the actual
gas sound speed, transducer time delay, tw, needs to be adjusted to
compensate for the difference. When the sound speed reported from
the meter is lower than the sound speed calculated based on the gas
properties, the tw must be increased, and vice versa. The adjustments
to tw do not need to be large; only fractional changes should be
necessary. There are calculators that make doing this easier, but the
results must be understood, rather than blindly followed.
5. Click the <Channel 1> / <General> tab.
6. Click the <Set User> and log into the meter as before if user
PanaService is not already logged in.
7. Change the Time Delay tw by half a microsecond and click
<Apply>
y
y
pp y
Figure 20: Signal Setup Screen
8. Click <Run> and return to the <Diagnostics> tab and after
checking the <Auto Refresh> check box, observer the measured
sound speed.
9. Repeat the above steps as needed until the measured sound speed
is within 1ft/sec.
Sentinel Setup and Calibration Guide
19
January 2009
Checking the Meter
Reported Soundspeed
(cont.)
10.Repeat this procedure for Channel 2.
11.Return to the <Diagnostics> tab, checking the <Auto Refresh>
check box, for both <Channel 1> and <Channel 2> and observe
for any "jumps" in the sound speed. Jumps are defined as changes
of 10ft/sec or more in the sound speed under static conditions. If
jumps are observed, the skan-t offset needs to be checked.
12.When finished, the tw values between each channel should be
close to one another (within 3ms) and they should be between 20
and 40ms.
20
Sentinel Setup and Calibration Guide
January 2009
Checking the Δt Offset
On the <Diagnostics> tab for each channel, with the meter in run
mode and no flow through the meter, check the <Auto Refresh>
check box and observe the Flow V and ΔT values. The velocity should
be less than 0.040ft/sec for both channels. If the velocity is greater,
the Delta T Offset value must be changed. This can be done through
trial and error by changing the Delta T Offset value until the velocity
on each channel is less than 0.040ft/sec, or by saving log files for 30
seconds or so and averaging the ΔT to come up with the correct value
(if a log file is created, first set the ΔT to 0, then start the log file).
1. Within the Signal Setup click the <Channel 1> / <Diagnostics>
tab.
2. Press the <Set User> button near the top right to log into the meter.
3. The user name is PanaService, and the password is Pana/GM.
These are case sensitive.
4. Press the <Program> button at the top right to put the meter into
program mode.
5. Change the value of Delta T Offset to the necessary value.
6. Press the <Run> button to continue meter operations.
7. Check the <Auto Refresh> box.
8. Observe the new Flow V and ΔT values.
9. Repeat as needed.
10.Repeat for <Channel 2>.
Figure 21: Signal Setup Screen
Sentinel Setup and Calibration Guide
21
January 2009
Setting the Antecedent
Factor
The antecedent factor is a pre-calibration correction parameter for
each channel which acts to remove any incorrect flow bias errors due
to geometric inaccuracies. This is a number calculated the same way
as a k-factor and it is based on the reference flowrate. The goal of this
step is get the channel flowrates to within ±1% or better of the
reference flowrate.
1. Calculate the antecedent factor for Channel 1 and Channel 2
•
Set the facility flow rate to 50% qmax.
•
Open a text display in PanaView and show "Ch1 ActEngVol ACF/M" and "Ch2 ActEngVol - ACF/M" with an update rate of
5 seconds.
•
Start an Excel spreadsheet.
•
Fill in the Excel spreadsheet with the values of channel 1 and 2
flowrates for 120seconds.
•
During that 120 seconds, have the calibration facility keep a
running average of the reference actual flow rate at the Sentinel
meter. This step may be eliminated if the facility flow rate is
extremely stable and if the facility can provide a quick and
accurate flowrate. This step may be seen as an additional
calibration point which may add to the cost of the calibration.
•
When finished, average the individual channel flowrates.
•
Calculate the antecedent factors using.
ACFM ref
K – Factor ch1 = ------------------------ACFM ch1
•
ACFM ref
K – Factor ch2 = ------------------------ACFM ch2
These values will be entered into the meter.
2. From the Signal Setup, login with the PanaService user ID, click
the <Service> button at the bottom of the window.
Figure 22: Service Button Location
22
Sentinel Setup and Calibration Guide
January 2009
Setting the Antecedent
Factor (cont.)
3. Select the <K-Factor> tab to find the K-Factors for Channel 1 and
Channel 2.
Figure 23: K-Factors Screen
4. Enter the two numbers calculated above for each channel
5. Click <OK> to close the Service dialog box
6. Finally, press <OK> to close the Signal Setup dialog box and press
<OK> again to close the meter properties dialog box. The only
thing that should now be open is the Meter Browser window.
Data Reduction
A simple to use and quick to execute program is available to read in a
PanaView log file and average out the individual channel calibration
data. Once the averages for each test point are available, they can be
used to calculate a k-factor table for each channel yielding a very
precise calibration for the Sentinel.
There is a README.TXT file that comes along with the program
which contains some important notes.
Export the start/stop log
from PanaView
Export the log that was started and stopped at the beginning and end
of each calibration point.
1. Select File → Export
2. Uncheck the <Use unit descriptor format> option
3. Save the file to the desktop using the file name format
YYYYMMDD_asfound_log_meterSN, where YYYYMMDD is
the calibration data, and the meterSN is the serial number for the
meter being calibrated. Save it as the default .txt file format.
Sentinel Setup and Calibration Guide
23
Run the data reduction
program
Launch the program called Data Reduction 2-4-5.exe to read in the
data average each test point. This program also checks for errors and
will alert the user if too many are found in the log.
1. When the program starts, two windows will be displayed; a
system console window which will display progress, and the user
interface which gives all of the functionality.
Figure 24: System Console Window and User Interface Screen
2. Select the PanaView log file by pressing the <Browse for
PanaView file> button. Find the file on the desktop and open it.
3. If the log file was set up per this document, the default value of
"5" for Approximate seconds between Data Points should be fine;
this is the PanaView log interval. The program reviews the time
stamp of every data point (each time PanaView adds a row of data
to the log file) and checks for its time proximity to the points
around it. This is how the program knows which data points make
up a single calibration point in order to do the average and
standard deviation calculations.
4. If the calibration was done as specified in this document, with
about 30 seconds between each repeat calibration point (and
obviously more time between changing condition points), update
the Approximate seconds between Test Points to be 30. This is the
time between the end of one calibration point (when the log file is
stopped) and the start of the next calibration point (when the log is
restarted). The calibration points are either the repeat points at the
same velocity, or at the next velocity condition.
5. Leave Maximum allowable errors per Test Point to the default of
1. If there are more errors in a given test point, the point is
probably bad. Even one bad point could cause a reason for
concern about the validity of the point and the integrity of the flow
meter.
January 2009
Run the data reduction
program (cont.)
6. Press the <Perform Data Reduction> button. The system console
will show the progress of the program as it goes through the data
file. Excel should open up and a worksheet should start to fill in
with data. The unnamed worksheet is called Default1.
7. The original .txt log file with all of the raw data is also opened up
in Excel for reference.
8. If everything works as it should, a confirmation box will pop-up.
Press <OK>.
,
p p p
Figure 25: Success Screen
9. The program will then ask if the K-factor calculations should be
performed. Move that pop-up box to the side and out of the way
(do not click <Yes> or <No>, or close the pop-up box).
Examine the reduced data
Review the newly generated Excel worksheet. The calibration points
are listed in the order they were collected.
Condition Data tab: • Displays each group of test points averaged together as they make
up a single test condition, such as 0.25qmax. Be sure the number of
conditions displayed matches the actual number of conditions run
during the calibration. If they do not, something is wrong with the
time stamps and the log file will need to be reviewed in more
detail.
•
The number of test points that make up each condition is
displayed. Be sure that matches the number of test points that were
run.
•
The number of errors is shown. Any point with too many errors
will be ignored in the final k-factor calculations.
•
Averages and standard deviations are shown for each parameter in
the log. This helps to see if there are any major problems during
the calibration.
Test Point Data tab: • Displays each test point at each condition. Be sure the number of
test points displayed matches the actual number of test points for
the calibration. If they do not, something is wrong with the time
stamps and the log file will need to be reviewed in more detail.
•
Sentinel Setup and Calibration Guide
The number of errors for each test point is shown, so any problem
points can easily be identified.
25
January 2009
Test Point Data tab: • Similar data is shown as in the Condition Data tab with averages
(cont.)
and standard deviations.
•
Look down the column that counts how many data points make up
a single calibration point. They should all be about the same. If one
is excessively low and one is excessively high, the points did not
get averaged correctly. This will need to be rectified by reviewing
the PanaView log in more detail.
Error Log tab: This tab shows the errors for a test point whose total number of errors
exceeded the maximum number of allowable errors entered. The
error type is shown.
Warning Log tab: This tab lists warning associated with timing. If the times of the
beginnings and ends of test points are not quite right, the program will
make a logical assumption about where to put a particular data point.
A scan down this list will show if there is any major problems.
Enter the reference data
from the facility
Be sure to have the reference volumetric flow rate for each calibration
point available for this next step. That reference information will be
entered into the data reduction program.
The reference volumetric flow rate must be entered in the same units
as the flow rates in the log file. The program is smart enough to look
for either the English or metric flow rate equivalents, it does not do
unit conversions. If the flow rates logged are in m3/hr, then the
reference data must be entered in m3/hr; if the flow rates logged are in
ACF/M, then the reference data must be entered in ACF/M. If this is
not done correctly, the output will not be correct. If a typo error is
made, the program must be aborted and restarted from the beginning.
1. Move the pop-up box from the data reduction program back into
focus and press <Yes> to perform the K-factor calculations.
Figure 26: K-Factor Calibrations?
2. The user is then prompted to enter the reference flow rate data into
the system console window. Click <OK>.
Figure 27: Procedure Instructions
26
Sentinel Setup and Calibration Guide
January 2009
Enter the reference data
from the facility (cont.)
3. The system console window will now display all of the calibration
points that make up the first calibration condition. The start time
and the number of errors will be displayed. The user is prompted if
any of the points must be removed (if for instance there are too
many errors). In this example, none of the points have errors so
each point is a good point. Since no points are to be removed,
typing <0> followed by <Enter> is the way to continue.
Figure 28: Sentinel Cal Procedure Screen
4. The next step is entering the reference flow rate for each test point
for a given condition. In this example, the reference flow rate was
about 25ACF/M for each of the points. The better the precision
(i.e. more decimal places), the better the final calculated k-factors,
so be sure to use all of the data provided by the calibration facility.
p
y
y
Figure 29: Sentinel Cal Procedure Screen
Sentinel Setup and Calibration Guide
27
January 2009
Enter the reference data
from the facility (cont.)
5. This is how to handle calibration points with many errors, or ones
during which time the calibration facility encountered a problem
and had to stop the point short.
•
For this condition, there was a point which had many meter
reported errors (17 in all). This point obviously had issues and
should not be used when calculating the k-factors for the meter.
Figure 30: Sentinel Cal Procedure Screen
•
The answer to the first question is "1" because only one point
needs to be removed from the list.
•
The index is the number of the test point at the far left. In this
case, index "1" is the point to remove from the list.
•
This time, only two reference values are entered, as the middle
calibration point, Test Point 8, for this condition is skipped.
Figure 31: Sentinel Cal Procedure Screen
28
Sentinel Setup and Calibration Guide
January 2009
Enter the reference data
from the facility (cont.)
y
More than one calibration point can be skipped per condition. Simply
enter that number and the index numbers of the points to skip. All
points at a given condition can be skipped by entering the number of
points for that condition.
g
p
Figure 32: Sentinel Cal Procedure Screen
6. When the program is finished calculating the k-factors, the system
console will display a message indicating that all calculations have
been completed and the program is finished.
Figure 33: Sentinel Cal Procedure Screen
7. End the data reduction program by pressing the <X> in the top
right corner of the user interface window, or by selecting
<File> → < Exit> in the top left corner of the user interface.
IMPORTANT:
If a user error occurs during the execution of the
data reduction program, the entire process must be
restarted, as there is no <Back> button to press.
IMPORTANT:
If the program encounters an issue and starts in an
apparent infinite loop, press <Ctrl> - <C> in the
system console window to abort the program
execution.
Sentinel Setup and Calibration Guide
29
January 2009
Review the calculated
individual channel
k-factors
The calculated k-factor tables can now be reviewed by returning to
the Default1 Excel file which has been regenerated to include the
original tabs, as well as two new ones.
K-Factor Data tab: This tab lists the k-factor table for each channel (1, 2, and averaged)
for each calibration condition, specifically against the uncorrected
channel velocity. The values for channels 1 and 2 (boxed in blue in
Figure 34 below) are the values that will ultimately be programmed
into the meter. Plotting the k-factors vs. uncorrected channel
velocities is advised, as doing so can show potential problems with
the meter calibration (for instance, in this example, in Figure 34
below, there is a large spike for the third calibration point - this could
be suspect).
Figure 34: K-Factor Data Tab
IMPORTANT:
If the trends appear to be abnormal, consult with
Technology prior to continuing the calibration
verification.
K-Factor Log tab: This tab lists all of the test points, their associated condition number,
how many errors were encountered in the raw data file, the user
entered reference flow rate, and if the point was skipped by the user.
IMPORTANT:
30
Double check the reference values against those
provided by the calibration facility. If an error was
made entering the values, the program must be rerun
to eliminate any errors in the calculated k-factors.
Sentinel Setup and Calibration Guide
January 2009
Extrapolate down to 0 and
up to 140ft/sec
Since the meter cannot extrapolate the k-factor table on its own, know
that the value for the k-factor for 0 ft/sec (0 m/s) will be entered as
that at the minimum calibration velocities for channels 1 and 2.
Likewise, the value at 140 ft/sec (43 m/s) will be entered the same as
that at the maximum calibration velocities for channels 1 and 2. These
rows can be inserted into the Excel tables for future reference, as seen
in Figure 34 on page 30.
Save the Excel file to the desktop using the file name format
YYYYMMDD_reduced_meterSN, where YYYYMMDD is the
calibration data, and the meterSN is the serial number for the meter
being calibrated. The raw data log sheet can also be copied into this
file so all the data can be saved together in one single file.
Programming Meter KFactor Tables
The values to be entered are obtained using the method described in
the Data Reduction section. Both channels 1 and 2 will have data
entered into the k-factor tables. Channel 5 (the average of channels 1
and 2) will be correct because the individual paths will now be
corrected.
1. Open the table for channel 1 and program the table.
a. In PanaView, in the Meter Browser window, open up <New
Meter> → <Channel 1>.
b. Left click on <Vel(Vel on Channel1)>.
c. Right click on <Vel(Vel on Channel1)>.
d. Click on <Properties>.
Figure 35: Programming the Table
Sentinel Setup and Calibration Guide
31
January 2009
Programming Meter KFactor Tables (cont.)
2. The Reynolds Correction table for channel 1 will pop-up.
p p p
Figure 36: Velocity/K-Factor Table
3. Fill in the table with the un-corrected velocities and k-factors
starting at 0 ft/sec and going in ascending order.
IMPORTANT:
Be sure to note the units for velocity (it depends on
how the meter was initially set up at the factory). Do
not confuse metric and English units, and convert if
necessary.
4. Click <Apply> and then click <OK>. (A log-in prompt may
appear. Log in as needed.)
5. Repeat this process for <New Meter> → <Channel 2> → <Vel(Vel
on Channel2)>.
6. There is no need to program channel 5 (the averaged channel).
7. Provide the k-factor tables to the calibration facility to include in
the calibration report. Even though the facility records the channel
average data of channels 1 and 2, the real calibration data comes
from the individual channels.
Converting a Site File to
Excel
Another simple-to-use tool reads in the .xml site file from a Sentinel
and converts it to an Excel worksheet, which can be easily printed out
to include in a calibration report.
1. Save the meter site file to a convenient location, such as the
desktop. Be sure it has a unique name that is easy to identify later.
2. Launch the program Sentinel XML parser ver 2-0.exe.
3. The user interface appears.
32
Sentinel Setup and Calibration Guide
January 2009
Converting a Site File to
Excel (cont.)
Figure 37: User Interface
4. Press the <Browse for .xml file> button and find the site file saved
previously.
5. Press the <Export file to Excel> button.
6. Once execution is complete, Excel will open to show the
information.
7. The format is not perfect, and the cell widths must be manually
adjusted to get optimal layout.
8. The entire file can be printed on one sheet of paper in portrait
orientation by using <File> → <Page Setup>, selecting <Fit to:>
and entering 1 page wide by 1 page tall.
g
g p g
y p g
Figure 38: Page Setup Screen
9. Print the file. It will be small, but it should still be readable in the
calibration report.
10.The Excel site sheet should be saved in the same file as the log and
reduced data to keep everything together in one single file. Do this
prior to quitting the parser program.
Sentinel Setup and Calibration Guide
33
January 2009
Setting Up the LCD Display 1. Expand the Display menu tree.
2. Double click on one display Box (it doesn't matter which one).
Figure 39: The Display Menu Tree
3. The parameters through which the display cycles are shown. Be
sure none of them say "Unassigned". If any one of them does,
click on it (to turn it red), then expand the adjacent menu tree and
assign it a useful parameter.
p
Figure 40: Meter Display Screen
4. When all of the display boxes are assigned a parameter to display,
press <Apply> and then <OK>.
34
Sentinel Setup and Calibration Guide
January 2009
Upgrading Old Software
When upgrading to new software, the meter memory will be
completely erased. Following this procedure will ensure that the
meter programming is returned to the previous state, which will keep
the flow calibration intact.
1. Save a site file using the Saving a Site File procedure on page 14.
2. Record the SkanTO for each channel from PanaView before doing
anything else (unless going from version 1.D of the INST which
does not have SkanTO). See Viewing the SkanTO Setting below.
3. Upload new software (version 1.G of the INST for the IGM, or the
AGA8 calculations).
4. Reload the site file.
5. Reset the SkanTO (unless the upgrade was from 1.D, in which
case, there is nothing to reset, nor should it be set at all). See How
to Set the SkanTO Values.
6. Ensure the I/O card is still functioning.
7. Review the meter programming for correctness.
Viewing the SkanTO
Settings
Note: The state of the pipeline does not matter for this. It can be full
of air, natural gas, or even at vacuum.
1. In PanaView, start a text display (main menu <Output> à <Text
Display>.
2. Display the following parameters:
•
Ch1 Diag - SkanTO samples
•
Ch1 Diag - SkanTO delta samples
•
Ch2 Diag - SkanTO samples
•
Ch2 Diag - SkanTO delta samples
3. Press the <Continuous> button.
4. Observe the SkanTO sample values and record them on a sheet of
paper. The numbers for SkanTO samples should be negative and
they should not change with time.
Sentinel Setup and Calibration Guide
35
January 2009
Resetting the SkanTO
Values After Erasing the
Meter Memory
If anything will be done to the meter which will completely erase the
memory of the meter, the following procedure should be performed to
reprogram the SkanTO values. The values are not saved in a site file.
1. Save a site file following the Saving a Site File procedure on
page 14.
2. Observe the current settings for the SkanTO samples using the
Viewing the SkanTO Settings procedure on page 35.
3. Calculate the average of the numbers from channels 1 and 2. They
should not be too different from each other (±20 counts).
4. Calculate the new switch point by taking the average number and
adding it (it's a negative number) to 8000. You will get a number
between 7000 and 8000. Write this number down!
5. Erase the meter's memory.
6. With the meter back up and running, go to the Signal Setup
through PanaView. Look for the "Fine?Coarse Sw Pt" box (switch
point) for Channel 1. Be sure the meter is in Program mode. Enter
the switch point number in that box. Press “Apply”, wait a few
seconds, and press the "Run" button.
7. Wait a few seconds, then press the "program" button again, and
enter 9999 into the Sw Pt box. Press “Apply”, wait a few seconds,
and press the "Run" button.
8. Now bring up a text display in PanaView and check the SkanTO
value for both channels 1 and 2. It should be the negative number
calculated from the average of the original numbers.
9. Reload the site file.
Checking the Analog
Inputs
This section applies to checking the functionality of both ADC IO7
and ADC IO8. Pin-outs are
Pin Number
Pin Description
ADC 107
Input C
ADC 108
Input D
OUT - +24V
I/O7
I/O10
INPUT - +
I/O8
I/O11
INPUT - RTN
I/O9
I/O12
IMPORTANT:
This section assumes use of an Altek Loop Calibrator
Model 334A which can simulate both a powered and
an unpowered two-wire transmitter.
1. Right click on Unassigned ADC IO7 and select <Configure As>
→ <Temperature Sensor>.
36
Sentinel Setup and Calibration Guide
January 2009
Checking the Analog
Inputs (cont.)
2. Select <Channel:> - <1> on the <General> tab.
3. Click on the <Calibration> tab (log into the meter if prompted).
4. In the spaces under °C, use 4 and 20 for the zero and span. Doing
so makes testing the input easier.
5. Click the <Apply> button.
6. Connect the + cable from the simulator to the "OUT - +24V" pin.
7. Connect the – cable from the simulator to the "INPUT - +" pin.
8. Select 2 WIRE Transmitter Simulator on the Altek toggle.
9. Slide the Altek power switch to mA.
10.Select the 4.00mA toggle on the Altek.
11.Press the <Cal. 4mA> button in PanaView. A value around 12500
should appear in the <Counts> box.
12.Select the 20.00mA toggle on the Altek
13.Press the <Cal. 20mA> button in PanaView. A value around
62500 should appear in the <Counts> box.
14.Press the <Apply> button
15.Set the Altek to something other than 4 or 20mA by moving the
toggle switch to Adjust mA·% and then rotating the Dial Output
knob.
16.Press the <Test> button - the set value of the Altek should appear
in the <Test Value:> box.
17.Click <Ok> in PanaView.
18.Expand the <Channel 1> menu tree.
19.Double click on the <Temp (Temp on Channel 1)> item.
20.Click on the <Calibration> tab.
21.Connect the + cable from the simulator to the "INPUT - +" pin.
22.Connect the – cable from the simulator to the "INPUT - RTN" pin.
23.Select Power 2 Wire Transmitter Source on the Altek.
24.Select the 4.00mA toggle on the Altek.
25.Press the <Cal. 4mA> button in PanaView. A value around 12500
should appear in the <Counts> box.
26.Select the 20.00mA toggle on the Altek.
27.Press the <Cal. 20mA> button in PanaView. A value around
62500 should appear in the <Counts> box.
28.Press the <Apply> button (logon if necessary).
Sentinel Setup and Calibration Guide
37
January 2009
Checking the Analog
Inputs (cont.)
29.If the <Apply> button is not grayed out, press it again.
30.Set the Altek to something other than 4 or 20mA by moving the
toggle switch to Adjust mA·% and then rotating the Dial Output
knob.
31.Press the <Test> button. The set value of the Altek should appear
in the <Test Value:> box.
At this point, both the powered and passive inputs have been checked.
If the <Test Value:> does not match the Altek set value, the card is
malfunctioning and it should be replaced.
The input will now be cleared out.
32.Click on the <General> tab.
33.Click on the <Constant:> check box. (A value is not needed, as it
will default.)
34.Click <Apply>. (Logon if necessary.)
35.Click <Ok>.
The input should now reappear in the Unassigned I/O menu tree.
36.Repeat by right clicking on Unassigned ADC IO8 and select
<Configure As> → <Temperature Sensor>.
Checking the Frequency
Output
1. Connect leads from a DMM that has the capability to measure
frequency to the I/O1 and I/O2 pins.
2. Right click on Unassigned Frequency IO5 and select
<Properties>.
3. Enter the following values in the <Input Settings> section on the
<General> tab.
Min:
0
Hz
Zero:
0
Max:
10000
Hz
Span:
10000
4. Enter the following values in the <Frequency Unit> section.
Channel:
Sensor/Class:
Unit:
Channel 1
Vel
Vinst_M/S (defaults)
5. Click <Apply>.
6. Click the <Test…> button.
7. Press <Yes> when prompted about suspending the frequency.
8. Slide the pointer to 50%; the DMM should read 5kHz.
9. Slide the pointer to 100%; the DMM should read 10kHz.
38
Sentinel Setup and Calibration Guide
January 2009
Checking the Frequency
Output (cont.)
10.If the difference for either set point is more than ±1Hz, the board is
malfunctioning and it should be replaced.
11.Press <Ok> to close the <Test Frequency> box.
12.Select "None" for the <Channel:> to clear the output.
13.Click <Yes> to assign the frequency as unconfigured.
14.Click <Ok>.
15.Click <Yes> to write the changes to the meter.
16.Click <Ok> once more.
The output should now reappear in the Unassigned I/O menu tree.
Customer Site
1. Customer installs the meter in their line.
2. Customer makes all electrical connections back to the DAC
system.
3. Customer makes all electrical connections with pressure and
temperature sensors into the meter.
4. Customer makes all communications and power connections into
the meter.
5. Customer and field TA trim the 4-20 output, end-to-end, back to
the DAC system.
6. Customer and field TA trim the 4-20 inputs, end-to-end, from the
P and T sensors into the Sentinel.
7. Field TA checks the pipe installation to ensure the components are
in the correct locations.
8. Field TA checks meter reported sound speed against Sonic Ware
and gas composition from the gas chromatograph (assuming one is
present).
9. Field TA checks gas composition as entered into the meter against
gas chromatograph - report any discrepancies to the customer and
adjust if desired.
10.Field TA will check other meter setup items and provide the
customer with a completed checklist.
11.Field TA will be available when the meter is in a situation where
the measured flow can be checked against another flow reference
of some type (be it an energy balance across a turbine, or against
another meter in the same line).
Sealing Procedure
Figure 41 on page 40 displays how to seal the Sentinel for security. A
typical seal is shown in Figure 42 on page 40.
Sentinel Setup and Calibration Guide
39
January 2009
Figure 41: Sentinel Flowcell Security Seals (ref. dwg #752-254)
Figure 42: NMI Lead Seal - Typical
40
Sentinel Setup and Calibration Guide
USA
1100 Technology Park Drive
Billerica, MA 01821-4111
Web: www.gesensing.com
Ireland
Sensing House
Shannon Free Zone East
Shannon, County Clare
Ireland