1
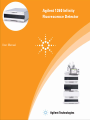
Agilent 1260 Infinity
Fluorescence Detector
User Manual
Agilent Technologies
Notices
© Agilent Technologies, Inc. 2010-2012
Warranty
No part of this manual may be reproduced
in any form or by any means (including electronic storage and retrieval or translation
into a foreign language) without prior agreement and written consent from Agilent
Technologies, Inc. as governed by United
States and international copyright laws.
The material contained in this document is provided “as is,” and is subject to being changed, without notice,
in future editions. Further, to the maximum extent permitted by applicable
law, Agilent disclaims all warranties,
either express or implied, with regard
to this manual and any information
contained herein, including but not
limited to the implied warranties of
merchantability and fitness for a particular purpose. Agilent shall not be
liable for errors or for incidental or
consequential damages in connection
with the furnishing, use, or performance of this document or of any
information contained herein. Should
Agilent and the user have a separate
written agreement with warranty
terms covering the material in this
document that conflict with these
terms, the warranty terms in the separate agreement shall control.
Manual Part Number
G1321-90012 Rev. C
Edition
10/2012
Printed in Germany
Agilent Technologies
Hewlett-Packard-Strasse 8
76337 Waldbronn
This product may be used as a component of an in vitro diagnostic system if the system is registered with
the appropriate authorities and complies with the relevant regulations.
Otherwise, it is intended only for general laboratory use.
receive no greater than Restricted Rights as
defined in FAR 52.227-19(c)(1-2) (June
1987). U.S. Government users will receive
no greater than Limited Rights as defined in
FAR 52.227-14 (June 1987) or DFAR
252.227-7015 (b)(2) (November 1995), as
applicable in any technical data.
Safety Notices
CAUTION
A CAUTION notice denotes a
hazard. It calls attention to an
operating procedure, practice, or
the like that, if not correctly performed or adhered to, could
result in damage to the product
or loss of important data. Do not
proceed beyond a CAUTION
notice until the indicated conditions are fully understood and
met.
Technology Licenses
The hardware and/or software described in
this document are furnished under a license
and may be used or copied only in accordance with the terms of such license.
Restricted Rights Legend
If software is for use in the performance of a
U.S. Government prime contract or subcontract, Software is delivered and licensed as
“Commercial computer software” as
defined in DFAR 252.227-7014 (June 1995),
or as a “commercial item” as defined in FAR
2.101(a) or as “Restricted computer software” as defined in FAR 52.227-19 (June
1987) or any equivalent agency regulation
or contract clause. Use, duplication or disclosure of Software is subject to Agilent
Technologies’ standard commercial license
terms, and non-DOD Departments and
Agencies of the U.S. Government will
WA R N I N G
A WARNING notice denotes a
hazard. It calls attention to an
operating procedure, practice,
or the like that, if not correctly
performed or adhered to, could
result in personal injury or
death. Do not proceed beyond a
WARNING notice until the indicated conditions are fully understood and met.
Agilent 1260 FLD User Manual
In This Guide
In This Guide
This manual covers
• the Agilent 1260 Infinity Fluorescence Detector (G1321B).
• the Agilent 1200 Series Fluorescence Detector (G1321A) (obsolete).
1 Introduction to the Fluorescence Detector
This chapter gives an introduction to the detector and instrument overview.
2 Site Requirements and Specifications
This chapter provides information on environmental requirements, physical
and performance specifications.
3 Installing the Module
This chapter gives information about the preferred stack setup for your
system and the installation of the module.
4 Using the Fluorescence Detector
This chapter guides you how to start the work with the detector.
5 Optimizing the Detector
This chapter provides information on how to optimize the detector.
6 Troubleshooting and Diagnostics
This chapter gives an overview about the troubleshooting and diagnostic
features and the different user interfaces.
7 Error Information
This chapter describes the meaning of error messages, and provides
information on probable causes and suggested actions how to recover from
error conditions.
Agilent 1260 FLD User Manual
3
In This Guide
8 Test Functions
This chapter describes the detector’s built in test functions.
9 Maintenance
This chapter provides general information on maintenance of the detector.
10 Parts for Maintenance
This chapter provides information on parts for maintenance.
11 Identifying Cables
This chapter provides information on cables used with the 1290 series of
HPLC modules.
12 Hardware Information
This chapter describes the detector in more detail on hardware and
electronics.
13 Appendix
This chapter provides safetey and other general information.
4
Agilent 1260 FLD User Manual
Contents
Contents
1 Introduction to the Fluorescence Detector
Introduction to the Detector 10
How the Detector Operates 11
Raman Effect 14
Optical Unit 15
Analytical Information From Primary Data
Bio-inert Materials 28
2 Site Requirements and Specifications
9
23
31
Site Requirements 32
Physical Specifications 35
Performance Specifications 36
3 Installing the Module
43
Unpacking the Module 44
Optimizing the Stack Configuration 46
Installing the Module 51
Flow Connections to the Module 54
4 Using the Fluorescence Detector
59
Before You Start 60
Getting Started and Checkout 61
Method Development 65
Example: Optimization for Multiple Compounds
Solvent Information 93
Agilent 1260 FLD User Manual
83
5
Contents
5 Optimizing the Detector
97
Optimization Overview 98
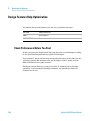
Design Features Help Optimization 100
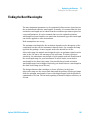
Finding the Best Wavelengths 101
Finding the Best Signal Amplification 103
Changing the Xenon Flash Lamp Frequency 109
Selecting the Best Response Time 111
Reducing Stray Light 114
6 Troubleshooting and Diagnostics
117
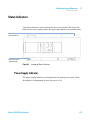
Overview of the Module’s Indicators and Test Functions
Status Indicators 119
User Interfaces 121
Agilent Lab Advisor Software 122
7 Error Information
118
123
What Are Error Messages 124
General Error Messages 125
Detector Error Messages 131
8 Test Functions
137
Introduction 138
Diagram of Light Path 139
Lamp Intensity Test 140
Raman ASTM Signal-to-Noise Test 142
Using the Built-in Test Chromatogram 149
Wavelength Verification and Calibration 151
Wavelength Accuracy Test 154
Wavelength Calibration Procedure 160
6
Agilent 1260 FLD User Manual
Contents
9 Maintenance
165
Introduction to Maintenance 166
Warnings and Cautions 167
Overview of Maintenance 169
Cleaning the Module 170
Exchanging a Flow Cell 171
How to use the Cuvette 175
Flow Cell Flushing 176
Correcting Leaks 177
Replacing Leak Handling System Parts
Replacing the Interface Board 179
Replacing Module Firmware 180
Tests and Calibrations 181
10 Parts for Maintenance
183
Overview of Maintenance Parts
Cuvette Kit 185
Accessory Kit 186
11 Identifying Cables
178
184
189
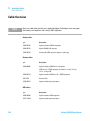
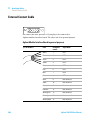
Cable Overview 190
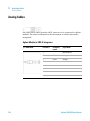
Analog Cables 192
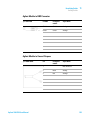
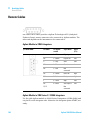
Remote Cables 194
BCD Cables 197
CAN/LAN Cables 199
External Contact Cable 200
Agilent Module to PC 201
12 Hardware Information
203
Firmware Description 204
Optional Interface Boards 207
Electrical Connections 211
Interfaces 214
Setting the 8-bit Configuration Switch (without On-board LAN)
Early Maintenance Feedback 225
Instrument Layout 226
Agilent 1260 FLD User Manual
221
7
Contents
13 Appendix
227
General Safety Information 228
The Waste Electrical and Electronic Equipment (WEEE) Directive
(2002/96/EC) 231
Lithium Batteries Information 232
Radio Interference 233
Sound Emission 234
UV-Radiation (UV-lamps only) 235
Solvent Information 236
Agilent Technologies on Internet 238
8
Agilent 1260 FLD User Manual
Agilent 1260 FLD User Manual
1
Introduction to the Fluorescence
Detector
Introduction to the Detector
10
How the Detector Operates
11
Raman Effect
14
Optical Unit 15
Reference System
22
Analytical Information From Primary Data
Fluorescence Detection 23
Phosphorescence Detection 24
Processing of Raw Data 24
Bio-inert Materials
23
28
This chapter gives an introduction to the detector and instrument overview.
Agilent Technologies
9
1
Introduction to the Fluorescence Detector
Introduction to the Detector
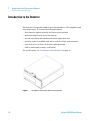
Introduction to the Detector
The detector is designed for highest optical performance, GLP compliance and
easy maintenance. It includes the following features:
• flash lamp for highest intensity and lowest detection limit
• multi-wavelength mode for on-line spectra
• spectra acquisition and simultaneous multi-signal detection
• optional cuvette is available and can be used for off-line measurements
• easy front access to flow cell for fast replacement and
• built-in wavelength accuracy verification.
For specifications, see “Performance Specifications” on page 36
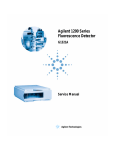
Figure 1
10
The Agilent 1260 Infinity Fluorescence Detector
Agilent 1260 FLD User Manual
Introduction to the Fluorescence Detector
How the Detector Operates
1
How the Detector Operates
Luminescence Detection
Luminescence, the emission of light, occurs when molecules change from an
excited state to their ground state. Molecules can be excited by different forms
of energy, each with its own excitation process. For example, when the
excitation energy is light, the process is called photoluminescence.
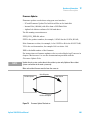
In basic cases, the emission of light is the reverse of absorption, see Figure 2
on page 11. With sodium vapor, for example, the absorption and emission
spectra are a single line at the same wavelength. The absorption and emission
spectra of organic molecules in solution produce bands instead of lines.
VWhdgei^dc
ZcZg\naZkZa'
]ν
ZcZg\naZkZa&
ajb^cZhXZcXZ
ZcZg\naZkZa'
]ν
ZcZg\naZkZa&
Figure 2
Agilent 1260 FLD User Manual
Absorption of Light Versus Emission of Light
11
1
Introduction to the Fluorescence Detector
How the Detector Operates
When a more complex molecule transforms from its ground energy state into
an excited state, the absorbed energy is distributed into various vibrational
and rotational sub-levels. When this, same molecule returns to the ground
state, this vibrational and rotational energy is first lost by relaxation without
any radiation. Then the molecule transforms from this energy level to one of
the vibrational and rotational sub-levels of its ground state, emitting light, see
Figure 3 on page 12. The characteristic maxima of absorption for a substance
is its λEX, and for emission its λEM.
VWhdgei^dc
Zb^hh^dc
λ
H1
gVY^Vi^dcaZhh
igVch^i^dc
S0
Figure 3
Relationship of Excitation and Emission Wavelengths
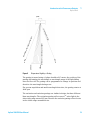
Photoluminescence is the collective name for two phenomena, fluorescence
and phosphorescence, which differ from each other in one characteristic
way--the delay of emission after excitation. If a molecule emits light 10-9 to
10-5 seconds after it was illuminated then the process was fluorescence. If a
molecule emits light longer than 10-3 seconds after illumination then the
process was phosphorescence.
Phosphorescence is a longer process because one of the electrons involved in
the excitation changes its spin, during a collision with a molecule of solvent,
for example. The excited molecule is now in a so-called triplet state, T, see
Figure 4 on page 13.
12
Agilent 1260 FLD User Manual
Introduction to the Fluorescence Detector
How the Detector Operates
1
he^cX]Vc\Z
H&
I1
E]dhe]dgZhXZcXZ
H%
Figure 4
Phosphorescence Energy Transitions
The molecule must change its spin back again before it can return to its
ground state. Since the chance of colliding with another molecule with the
necessary spin for change is slight, the molecule remains in its triplet state for
some time. During the second spin change the molecule loses more energy by
relaxing without radiation. The light which is emitted during phosphorescence
therefore has less energy and is at a longer wavelength than fluorescence.
Formula: E = h x λ-1
In this equation:
E is energy
h is Planck's constant
λ is the wavelength
Agilent 1260 FLD User Manual
13
1
Introduction to the Fluorescence Detector
Raman Effect
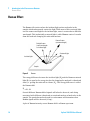
Raman Effect
The Raman effect arises when the incident light excites molecules in the
sample which subsequently scatter the light. While most of this scattered light
is at the same wavelength as the incident light, some is scattered at a different
wavelength. This inelastically scattered light is called Raman scatter. It results
from the molecule changing it's molecular motions.
GVaZ^\]HXViiZg
hVbZlVkZaZc\i]
Vh^cX^YZcia^\]i
GVbVcHXViiZg
cZllVkZaZc\i]
HXViiZgZYA^\]i
>cX^YZciA^\]i
HVbeaZ
Figure 5
Raman
The energy difference between the incident light (Ei) and the Raman scattered
light (Es) is equal to the energy involved in changing the molecule's vibrational
state (i.e. getting the molecule to vibrate, Ev). This energy difference is called
the Raman shift.
E v = Ei - E s
Several different Raman shifted signals will often be observed; each being
associated with different vibrational or rotational motions of molecules in the
sample. The particular molecule and its environment will determine what
Raman signals will be observed (if any).
A plot of Raman intensity versus Raman shift is a Raman spectrum.
14
Agilent 1260 FLD User Manual
Introduction to the Fluorescence Detector
Optical Unit
1
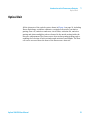
Optical Unit
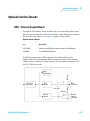
All the elements of the optical system, shown in Figure 6 on page 16, including
Xenon flash lamp, excitation condenser, excitation slit, mirror, excitation
grating, flow cell, emission condenser, cut-off filter, emission slit, emission
grating and photo-multiplier tube are housed in the metal casting inside the
detector compartment. The fluorescence detector has grating/grating optics,
enabling the selection of both excitation and emission wavelengths. The flow
cell can be accessed from the front of the fluorescence detector.
Agilent 1260 FLD User Manual
15
1
Introduction to the Fluorescence Detector
Optical Unit
;aVh]aVbeWdVgY
:B<gVi^c\
VhhZbWan
Ig^\\ZgEVX`
MZcdc;aVh]aVbe
Ha^i:B
8dcYZchZg:M
8jid[[[^aiZg
Ha^i:M
E]did
Bjai^ea^ZgIjWZ
B^ggdg
8dcYZchZg:B
:M<gVi^c\VhhZbWan
G:;9^dYZ
;adl8Zaa
9^[[jhZg
Figure 6
Optical Unit
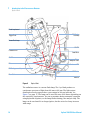
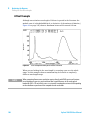
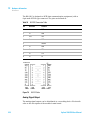
The radiation source is a xenon flash-lamp. The 3 μs flash produces a
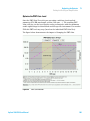
continuous spectrum of light from 200 nm to 900 nm. The light output
distribution can be expressed as a percentage in 100 nm intervals, see
Figure 7 on page 17. The lamp can be used for some 1000 hours depending on
the sensitivity requirements. You can economize during automatic operation
using keyboard setpoints, so the lamp flashes during your analysis only. The
lamp can be used until it no longer ignites, but the noise level may increase
with usage.
16
Agilent 1260 FLD User Manual
1
Introduction to the Fluorescence Detector
Optical Unit
UV degradation, especially below 250 nm is significantly higher compared to
Visible wavelength range. Generally the "LAMP ON during run" - setting or
using "economy mode" will increase lamp life by a magnitude.
GZaVi^kZ>ciZch^in
LVkZaZc\]iPcbR
Figure 7
Lamp Energy Distribution (vendor data)
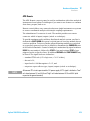
The radiation emitted by the lamp is dispersed and reflected by the excitation
monochromator grating onto the cell entrance slit.
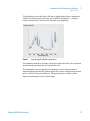
The holographic concave grating is the main part of the monochromator,
dispersing and reflecting the incident light. The surface contains many minute
grooves, 1200 of them per millimeter. The grating carries a blaze to show
improved performance in the visible range.
Agilent 1260 FLD User Manual
17
1
Introduction to the Fluorescence Detector
Optical Unit
<gVi^c\:M^ch^YZ
B^ggdg
Figure 8
Mirror Assembly
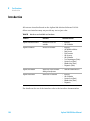
The geometry of the grooves is optimized to reflect almost all of the incident
light, in the 1st order and disperse it with about 70 % efficiency in the
ultra-violet range. Most of the remaining 30 % of the light is reflected at zero
order, with no dispersion. Figure 9 on page 19 illustrates the light path at the
surface of the grating.
18
Agilent 1260 FLD User Manual
1
Introduction to the Fluorescence Detector
Optical Unit
e^kdi
^cX^
i
YZc
heZ
ghZ
Y
-%%cb
gZ[aZXiZY&hidgYZgY^heZghZYa^\]i
'%%cb
l]^i
Z
l]^i
Z
gZ[a
ZXi
ZY%
dgY
Zgj
cY^
i
a^\]
a^\]
i
^iZ
l]
Figure 9
Dispersion of Light by a Grating
The grating is turned using a 3-phase brushless DC motor, the position of the
grating determining the wavelength or wavelength range of the light falling
onto the flow cell. The grating can be programmed to change its position and
therefore the wavelength during a run.
For spectra acquisition and multi-wavelength detection, the grating rotates at
4000 rpm.
The excitation and emission gratings are similar in design, but have different
blaze wavelengths. The excitation grating reflects most 1st order light in the
ultra-violet range around 250 nm, whereas the emission grating reflects better
in the visible range around 400 nm.
Agilent 1260 FLD User Manual
19
1
Introduction to the Fluorescence Detector
Optical Unit
The flow cell is a solid fused silica body with a maximum back pressure of
20 bar. Excessive back pressure will result in destruction of the cell. Operating
the detector close to waste with low back pressure is recommended. A slit is
integrated to the body.
Figure 10
Cross-Section of Flow Cell
The luminescence from the sample in the flow cell is collected at right angles
to the incident light by a second lens, and passes through a second slit. Before
the luminescence reaches the emission monochromator, a cut-off filter
removes light below a certain wavelength, to reduce noise from 1st order
scatter and 2nd order stray light, see Figure 9 on page 19.
The selected wavelength of light is reflected onto the slit in the wall of the
photo-multiplier compartment of the optical unit. The bandwidth of the
emitted light is 20 nm.
20
Agilent 1260 FLD User Manual
Introduction to the Fluorescence Detector
Optical Unit
1
On the photocathode, Figure 11 on page 21, incident photons generate
electrons. These electrons are accelerated by an electrical field between
several arc-shaped dynodes. Depending on the voltage difference between any
pair of dynodes, an incident electron may spark-off further electrons which
accelerate onto the next dynode. An avalanche effect results: finally so many
electrons are generated that a current can be measured. The amplification is a
function of the voltage at the dynodes and is microprocessor controlled. You
can set the amplification using the PMTGAIN function.
DeVfjZ
e]didXVi]dYZ
6cdYZ
>cX^YZcia^\]i
>cX^YZcia^\]i
6gXh]VeZYYncdYZh
Figure 11
Photo-multiplier Tube
This type of so-called side-on photo-multiplier is compact ensuring fast
response, conserving the advantages of the short optical path shown in
Figure 6 on page 16.
PMTs are designed for specific wavelength ranges. The standard PMT offers
optimum sensitivity from 200 to 600 nm. In the higher wavelength range a
red-sensitive PMT can improve performance.
Agilent 1260 FLD User Manual
21
1
Introduction to the Fluorescence Detector
Optical Unit
Reference System
A reference diode, located behind the flow cell, measures the excitation (EX)
light transmitted by the flow cell and corrects flash lamp fluctuations and
long-term intensity drift. Because of a non-linear output of the diode
(depending on the EX-wavelength), the measured data are normalized.
A diffuser is located in front of the reference diode (see Figure 6 on page 16).
This diffuser is made of quartz, reduces light and allows integral measurement
of the light.
22
Agilent 1260 FLD User Manual
Introduction to the Fluorescence Detector
Analytical Information From Primary Data
1
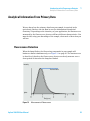
Analytical Information From Primary Data
We now know how the primary data from your sample is acquired in the
optical unit. But how can the data be used as information in analytical
chemistry? Depending on the chemistry of your application, the luminescence
measured by the fluorescence detector will have different characteristics. You
must decide, using your knowledge of the sample, what mode of detection you
will use.
Fluorescence Detection
When the lamp flashes, the fluorescing compounds in your sample will
luminesce almost simultaneously, see Figure 12 on page 23. The luminescence
is short-lived, therefore the fluorescence detector need only measure over a
short period of time after the lamp has flashed.
>ciZch^in
IgVX`VcY=daY
>\c^iZ
I^bZP¥hZXR
Figure 12
Agilent 1260 FLD User Manual
Measurement of Fluorescence
23
1
Introduction to the Fluorescence Detector
Analytical Information From Primary Data
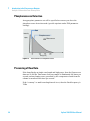
Phosphorescence Detection
An appropriate parameter set will be specified as soon as you chose the
phosphorescence detection mode (special setpoints under FLD parameter
settings).
;aVh]
>ciZch^in
E]dhe]dgZhXZcXZ
BZVhjgZbZci
I^bZP¥hZXR
Figure 13
Measurement of Phosphorescence
Processing of Raw Data
If the lamp flashes at single wavelength and high-power, then the fluorescence
data rate is 296 Hz. That means that your sample is illuminated 296 times per
second, and any luminescence generated by the components eluted from the
column is measured 296 times per second.
If the “economy” or multi-wavelength mode is set, then the flash frequency is
74 Hz.
24
Agilent 1260 FLD User Manual
1
Introduction to the Fluorescence Detector
Analytical Information From Primary Data
;aVh]
AVbe
;ajdgZhXZchZ
E]dhe]dgZhXZcXZ
I^bZ
Figure 14
LAMP: Frequency of Flash, Fluorescence, and Phosphorescence
You can improve the signal-to-noise characteristics by disabling the “economy”
mode.
NOTE
Disabling the “economy” mode will shorten the lifetime of the lamp significantly. Consider
lifetime saving by switching off the lamp after the run is completed.
The data resolution is 20 bit at a response time of 4 s (default, which is
equivalent to a time constant of 1.8 s and appropriate for standard
chromatographical conditions). Weak signals may cause errors in
quantification because of insufficient resolution. Check your proposed
PMTGAIN. If it is significantly distant from your setting, change your method
or check the purity of your solvent.
You can amplify the signal using PMTGAIN. Depending on the PMTGAIN you
have set, a multiple of electrons is generated for every photon falling on the
photomultiplier. You can quantify large and small peaks in the same
chromatogram by adding PMTGAIN changes during the run into a timetable.
Agilent 1260 FLD User Manual
25
1
Introduction to the Fluorescence Detector
Analytical Information From Primary Data
EBI<6>C
E]dhe]dgZhXZcXZ
;ajdgZhXZchZ
Figure 15
PMTGAIN: Amplification of Signal
Check proposed PMTGAIN. Deviations of more than 2 PMT gains should be
corrected in the method.
Each PMTGAIN step is increased approximately by a factor of 2 (range 0 - 18).
To optimize your amplification for the peak with the highest emission, raise
the PMTGAIN setting until the best signal-to-noise is achieved.
After the photons are converted and multiplied into an electronic signal, the
signal (at present analog) is tracked and held beyond the photo-multiplier.
After being held, the signal is converted by an A-to-D converter to give one raw
data point (digital). Eleven of these data points are bunched together as the
first step of data processing. Bunching improves your signal-to-noise ratio.
The bunched data, shown as larger black dots in Figure 16 on page 27, is then
filtered using a boxcar filter. The data is smoothed, without being reduced, by
taking the mean of a number of points. The mean of the same points minus the
first plus the next, and so on, is calculated so that there are the same number
of bunched and filtered points as the original bunched points. You can define
the length of the boxcar element using the RESPONSETIME function: the
longer the RESPONSETIME, the greater the number of data points averaged. A
four-fold increase in RESPONSETIME (for example, 1 sec to 4 sec) doubles the
signal-to-noise ratio.
26
Agilent 1260 FLD User Manual
Introduction to the Fluorescence Detector
Analytical Information From Primary Data
1
HbVaaH$CgVi^d
7jcX]ZYYViV
ed^cih
7dmXVg
[^aiZg
;^aiZgZY
YViVed^cih
Figure 16
Agilent 1260 FLD User Manual
G:HEDCH:I>B:2&'*
\^kZh(ed^cih
eZgWdmXVg
=^\]H$CgVid
RESPONSETIME: Signal-to-Noise Ratio
27
1
Introduction to the Fluorescence Detector
Bio-inert Materials
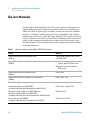
Bio-inert Materials
For the Agilent 1260 Infinity Bio-inert LC system, Agilent Technologies uses
highest quality materials in the flow path (also referred to as wetted parts),
which are widely accepted by life scientists, as they are known for optimum
inertness to biological samples and ensure best compatibility with common
samples and solvents over a wide pH range. Explicitly, the complete flow path
is free of stainless steel and free of other alloys containing metals such as iron,
nickel, cobalt, chromium, molybdenum or copper, which can interfere with
biological samples. The flow downstream of the sample introduction contains
no metals whatsoever.
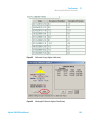
Table 1
Bio-inert materials used in Agilent 1260 Infinity Systems
Module
Materials
Agilent 1260 Infinity Bio-inert Quaternary Pump
(G5611A)
Titanium, gold, platinum-iridium, ceramic,
ruby, PTFE, PEEK
Agilent 1260 Infinity Bio-inert High-Performance Autosampler
(G5667A)
Upstream of sample introduction:
• Titanium, gold, PTFE, PEEK, ceramic
Downstream of sample introduction:
• PEEK, ceramic
Agilent 1260 Infinity Bio-inert Manual Injector
(G5628A)
PEEK, ceramic
Agilent 1260 Infinity Bio-inert Analytical Fraction Collector
(G5664A)
PEEK, ceramic, PTFE
Bio-inert Flow Cells:
Standard flow cell bio-inert, (G5615-60022)
(for Agilent 1260 Infinity Diode Array Detectors DAD G1315C/D)
PEEK, ceramic, sapphire, PTFE
Max-Light Cartridge Cell Bio-inert ( (G5615-60018) and
Max-Light Cartridge Cell Bio-inert ( (G5615-60017)
(for Agilent 1200 Infinity Series Diode Array Detectors DAD G4212A/B)
PEEK, fused silica
Bio-inert flow cell, (G5615-60005)
(for Agilent 1260 Infinity Fluorescence Detector FLD G1321B)
PEEK, fused silica, PTFE
28
Agilent 1260 FLD User Manual
Introduction to the Fluorescence Detector
Bio-inert Materials
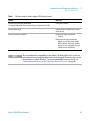
Table 1
1
Bio-inert materials used in Agilent 1260 Infinity Systems
Module
Materials
Bio-inert heat-exchanger G5616-60050
(for Agilent 1290 Infinity Thermostatted Column Compartment G1316C)
PEEK (steel-cladded)
Bio-inert Valve heads
G4235A, G5631A, G5639A: PEEK, ceramic
(Al2O3 based)
Bio-inert Connection capillaries
Upstream of sample introduction:
• Titanium
Downstream of sample introduction:
• Agilent uses stainless-steel-cladded
PEEK capillaries, which keep the flow
path free of steel and provide pressure
stability to more than 600 bar.
NOTE
To ensure optimum bio-compatibility of your Agilent 1260 Infinity Bio-inert LC system, do
not include non-inert standard modules or parts to the flow path. Do not use any parts that
are not labeled as Agilent “Bio-inert”. For solvent compatibility of these materials, see
“Solvent information for parts of the 1260 Infinity Bio-inert LC system” on page 93.
Agilent 1260 FLD User Manual
29
1
30
Introduction to the Fluorescence Detector
Bio-inert Materials
Agilent 1260 FLD User Manual
Agilent 1260 FLD User Manual
2
Site Requirements and Specifications
Site Requirements
32
Physical Specifications
35
Performance Specifications
36
This chapter provides information on environmental requirements, physical and
performance specifications.
Agilent Technologies
31
2
Site Requirements and Specifications
Site Requirements
Site Requirements
A suitable environment is important to ensure optimal performance of the
instrument.
Power Considerations
The module power supply has wide ranging capability. It accepts any line
voltage in the range described in Table 2 on page 35. Consequently there is no
voltage selector in the rear of the module. There are also no externally
accessible fuses, because automatic electronic fuses are implemented in the
power supply.
WA R N I N G
Hazard of electrical shock or damage of your instrumentation
can result, if the devices are connected to a line voltage higher than specified.
➔ Connect your instrument to the specified line voltage only.
WA R N I N G
The module is partially energized when switched off, as long as the power cord is
plugged in.
Repair work at the module can lead to personal injuries, e.g. electrical shock, when
the cover is opened and the module is connected to power.
➔ Always unplug the power cable before opening the cover.
➔ Do not connect the power cable to the instrument while the covers are removed.
CAUTION
Inaccessible power plug.
In case of emergency it must be possible to disconnect the instrument from the power
line at any time.
➔ Make sure the power connector of the instrument can be easily reached and
unplugged.
➔ Provide sufficient space behind the power socket of the instrument to unplug the
cable.
32
Agilent 1260 FLD User Manual
2
Site Requirements and Specifications
Site Requirements
Power Cords
Different power cords are offered as options with the module. The female end
of all power cords is identical. It plugs into the power-input socket at the rear.
The male end of each power cord is different and designed to match the wall
socket of a particular country or region.
WA R N I N G
Absence of ground connection or use of unspecified power cord
The absence of ground connection or the use of unspecified power cord can lead to
electric shock or short circuit.
➔ Never operate your instrumentation from a power outlet that has no ground
connection.
➔ Never use a power cord other than the Agilent Technologies power cord designed
for your region.
WA R N I N G
Use of unsupplied cables
Using cables not supplied by Agilent Technologies can lead to damage of the
electronic components or personal injury.
➔ Never use cables other than the ones supplied by Agilent Technologies to ensure
proper functionality and compliance with safety or EMC regulations.
WA R N I N G
Unintended use of supplied power cords
Using power cords for unintended purposes can lead to personal injury or damage of
electronic equipment.
➔ Never use the power cords that Agilent Technologies supplies with this instrument
for any other equipment.
Agilent 1260 FLD User Manual
33
2
Site Requirements and Specifications
Site Requirements
Bench Space
The module dimensions and weight (see Table 2 on page 35) allow you to place
the module on almost any desk or laboratory bench. It needs an additional
2.5 cm (1.0 inches) of space on either side and approximately 8 cm
(3.1 inches) in the rear for air circulation and electric connections.
If the bench shall carry a complete HPLC system, make sure that the bench is
designed to bear the weight of all modules.
The module should be operated in a horizontal position.
Condensation
CAUTION
Condensation within the module
Condensation will damage the system electronics.
➔ Do not store, ship or use your module under conditions where temperature
fluctuations could cause condensation within the module.
➔ If your module was shipped in cold weather, leave it in its box and allow it to warm
slowly to room temperature to avoid condensation.
34
Agilent 1260 FLD User Manual
2
Site Requirements and Specifications
Physical Specifications
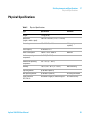
Physical Specifications
Table 2
Physical Specifications
Type
Specification
Weight
11.5 kg (26 lbs)
Dimensions
(height × width × depth)
140 x 345 × 435 mm (7 x 13.5 × 17 inches)
Line voltage
100 – 240 VAC, ± 10 %
Line frequency
50 or 60 Hz, ± 5 %
Power consumption
180 VA / 70 W / 239 BTU
Ambient operating
temperature
0 - 40 °C (32 - 104 °F)
Ambient non-operating
temperature
-40 – 70 °C (-4 – 158 °F)
Humidity
< 95 %, at 25 – 40 °C (77 – 104 °F)
Operating altitude
Up to 2000 m (6562 ft)
Non-operating altitude
Up to 4600 m (15091 ft)
For storing the module
Safety standards:
IEC, CSA, UL
Installation category II, Pollution degree 2
For indoor use only.
Agilent 1260 FLD User Manual
Comments
Wide-ranging
capability
Maximum
Non-condensing
35
2
Site Requirements and Specifications
Performance Specifications
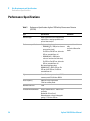
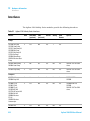
Performance Specifications
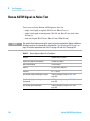
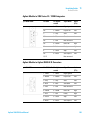
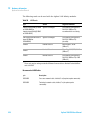
Table 3
Performance Specifications Agilent 1260 Infinity Fluorescence Detector
(G1321B)
Type
Specification
Detection type
Multi-signal fluorescence detector with
rapid on-line scanning capabilities and
spectral data analysis
Performance specifications
Single wavelength operation:
• RAMAN (H2O) > 500 (noise reference
measured at signal)
•
Comments
Ex=350 nm, Em=397 nm, dark value
450 nm, standard flow cell
RAMAN (H2O) > 3000 (noise
reference measured at dark value)
see note below this
table
see Service Manual for
details
Ex=350 nm, Em=397 nm, dark value
450 nm, standard flow cell
Dual wavelength operation:
RAMAN (H2O) > 300 Ex 350 nm, Em
397 nm and Ex 350 nm, Em 450 nm,
standard flow cell.
36
Light source
Xenon Flash Lamp, normal mode 20 W,
economy mode 5 W, lifetime 4000 h
Pulse frequency
296 Hz for single signal mode
74 Hz for economy mode
Maximum data rate
74 Hz
Excitation monochromator
Range: settable 200 nm - 1200 nm and
zero-order
Bandwidth: 20 nm (fixed)
Monochromator: concave holographic
grating, F/1.6, blaze: 300 nm
Agilent 1260 FLD User Manual
Site Requirements and Specifications
Performance Specifications
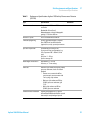
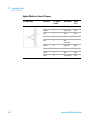
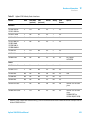
Table 3
2
Performance Specifications Agilent 1260 Infinity Fluorescence Detector
(G1321B)
Type
Specification
Emission monochromator
Range: settable 200 nm - 1200 nm and
zero-order
Bandwidth: 20 nm (fixed)
Monochromator: concave holographic
grating, F/1.6, blaze: 400 nm
Reference system
in-line excitation measurement
Timetable programing
up to 4 signal wavelengths, response
time, PMT Gain, baseline behavior
(append, free, zero), spectral parameters
Spectrum acquisition
Excitation or Emission spectra
Scan speed: 28 ms per datapoint (e.g.
0.6 s/spectrum 200 – 400 nm, 10 nm
step)
Step size: 1 – 20 nm
Spectra storage: All
Wavelength characteristic
Repeatability +/- 0.2 nm
Accuracy +/- 3 nm setting
Flow cells
Standard: 8 µL volume and 20 bar (2 MPa)
pressure maximum, fused silica block
Comments
Optional:
• Fluorescence cuvette for offline
spectroscopic measurements with
1 mL syringe, 8 µL volume
• Bio-inert: 8 µL volume and 20 bar
(2 MPa) pressure maximum, (pH
1–12)
• Micro: 4 µL volume and 20 bar
(2 MPa) pressure maximum
Control and data evaluation
Agilent 1260 FLD User Manual
Agilent ChemStation for LC, Agilent
Instant Pilot G4208A with limited spectral
data analysis and printing of spectra
37
2
Site Requirements and Specifications
Performance Specifications
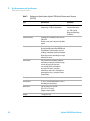
Table 3
38
Performance Specifications Agilent 1260 Infinity Fluorescence Detector
(G1321B)
Type
Specification
Comments
Analog outputs
Recorder/integrator: 100 mV or 1 V,
output range > 100 LU, two outputs
100 LU is the
recommended range,
see "FLD Scaling
Range and Operating
Conditions"
Communications
Controller-area network (CAN), RS-232C,
LAN, APG
Remote: ready, start, stop and shut-down
signals
Safety and maintenance
Extensive diagnostics, error detection and
display (through Instant Pilot G4208A and
ChemStation), leak detection, safe leak
handling, leak output signal for shutdown
of pumping system. Low voltages in major
maintenance areas.
GLP features
Early maintenance feedback (EMF) for
continuous tracking of instrument usage
in terms of lamp burn time with
user-settable limits and feedback
messages. Electronic records of
maintenance and errors. Verification of
wavelength accuracy, using the Raman
band of water.
Housing
All materials recyclable.
Environment
0 – 40 °C constant temperature at <95 %
humidity (non-condensing)
Dimensions
140 mm x 345 mm x 435 mm
(5.5 x 13.5 x 17 inches)
(height x width x depth)
Weight
11.5 kg (25.5 lbs)
Agilent 1260 FLD User Manual
2
Site Requirements and Specifications
Performance Specifications
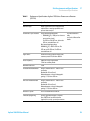
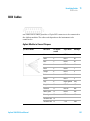
Table 4
Performance Specifications Agilent 1200 Series Fluorescence Detector
(G1321A)
Type
Specification
Detection type
Multi-signal fluorescence detector with
rapid on-line scanning capabilities and
spectral data analysis
Performance specifications
Single wavelength operation:
• RAMAN (H2O) > 500 (noise reference
measured at signal)
Ex=350 nm, Em=397 nm, dark value
450 nm, standard flow cell
Dual wavelength operation:
RAMAN (H2O) > 300 Ex 350 nm, Em
397 nm and Ex 350 nm, Em 450 nm,
standard flow cell.
Light source
Xenon Flash Lamp, normal mode 20 W,
economy mode 5 W, lifetime 4000 h
Pulse frequency
296 Hz for single signal mode
74 Hz for economy mode
Maximum data rate
18 Hz
Excitation monochromator
Range: settable 200 nm - 1200 nm and
zero-order
Bandwidth: 20 nm (fixed)
Monochromator: concave holographic
grating, F/1.6, blaze: 300 nm
Emission monochromator
Range: settable 200 nm - 1200 nm and
zero-order
Bandwidth: 20 nm (fixed)
Monochromator: concave holographic
grating, F/1.6, blaze: 400 nm
Reference system
in-line excitation measurement
Timetable programing
up to 4 signal wavelengths, response
time, PMT Gain, baseline behavior
(append, free, zero), spectral parameters
Agilent 1260 FLD User Manual
Comments
see note below this
table
see Service Manual for
details
39
2
Site Requirements and Specifications
Performance Specifications
Table 4
Performance Specifications Agilent 1200 Series Fluorescence Detector
(G1321A)
Type
Specification
Comments
Spectrum acquisition
Excitation or Emission spectra
Scan speed: 28 ms per datapoint (e.g.
0.6 s/spectrum 200 – 400 nm, 10 nm
step)
Step size: 1 – 20 nm
Spectra storage: All
Wavelength characteristic
Repeatability +/- 0.2 nm
Accuracy +/- 3 nm setting
Flow cells
Standard: 8 µL volume and 20 bar (2 MPa)
pressure maximum, fused silica block
Optional:
• Fluorescence cuvette for offline
spectroscopic measurements with
1 mL syringe, 8 µL volume
• Bio-inert: 8 µL volume and 20 bar
(2 MPa) pressure maximum, (pH
1–12)
• Micro: 4 µL volume and 20 bar
(2 MPa) pressure maximum
40
Control and data evaluation
Agilent ChemStation for LC, Agilent
Instant Pilot G4208A with limited spectral
data analysis and printing of spectra
Analog outputs
Recorder/integrator: 100 mV or 1 V,
output range > 100 LU, two outputs
Communications
Controller-area network (CAN), RS-232C,
LAN, APG
Remote: ready, start, stop and shut-down
signals
100 LU is the
recommended range,
see "FLD Scaling
Range and Operating
Conditions"
Agilent 1260 FLD User Manual
Site Requirements and Specifications
Performance Specifications
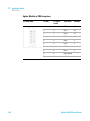
Table 4
Performance Specifications Agilent 1200 Series Fluorescence Detector
(G1321A)
Type
Specification
Safety and maintenance
Extensive diagnostics, error detection and
display (through Instant Pilot G4208A and
ChemStation), leak detection, safe leak
handling, leak output signal for shutdown
of pumping system. Low voltages in major
maintenance areas.
GLP features
Early maintenance feedback (EMF) for
continuous tracking of instrument usage
in terms of lamp burn time with
user-settable limits and feedback
messages. Electronic records of
maintenance and errors. Verification of
wavelength accuracy, using the Raman
band of water.
Housing
All materials recyclable.
Environment
0 – 40 °C constant temperature at <95 %
humidity (non-condensing)
Dimensions
140 mm x 345 mm x 435 mm
(5.5 x 13.5 x 17 inches)
(height x width x depth)
Weight
11.5 kg (25.5 lbs)
Agilent 1260 FLD User Manual
2
Comments
41
2
42
Site Requirements and Specifications
Performance Specifications
Agilent 1260 FLD User Manual
Agilent 1260 FLD User Manual
3
Installing the Module
Unpacking the Module
44
Optimizing the Stack Configuration
One Stack Configuration 47
Two Stack Configuration 49
Installing the Module
46
51
Flow Connections to the Module
54
This chapter gives information about the preferred stack setup for your system
and the installation of the module.
Agilent Technologies
43
3
Installing the Module
Unpacking the Module
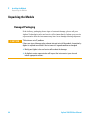
Unpacking the Module
Damaged Packaging
If the delivery packaging shows signs of external damage, please call your
Agilent Technologies sales and service office immediately. Inform your service
representative that the instrument may have been damaged during shipment.
CAUTION
"Defective on arrival" problems
If there are signs of damage, please do not attempt to install the module. Inspection by
Agilent is required to evaluate if the instrument is in good condition or damaged.
➔ Notify your Agilent sales and service office about the damage.
➔ An Agilent service representative will inspect the instrument at your site and
initiate appropriate actions.
44
Agilent 1260 FLD User Manual
Installing the Module
Unpacking the Module
3
Delivery Checklist
Ensure all parts and materials have been delivered with your module. The
delivery checklist is shown below.
For parts identification please check the illustrated parts breakdown in “Parts
for Maintenance” on page 183
Please report any missing or damaged parts to your local Agilent Technologies
sales and service office.
Table 5
Detector Checklist
Description
Quantity
Detector
1
Power cable
1
CAN cable
1
Flow cell
1 (built-in)
Optional flow cell/cuvette
as ordered
User Manual
on Documentation CD (part of the shipment not module specific)
Accessory kit (see “Standard Accessory Kit” on
page 186)
1
Agilent 1260 FLD User Manual
45
3
Installing the Module
Optimizing the Stack Configuration
Optimizing the Stack Configuration
If your module is part of a complete Agilent 1260 Infinity Liquid
Chromatograph, you can ensure optimum performance by installing the
following configurations. These configurations optimize the system flow path,
ensuring minimum delay volume.
46
Agilent 1260 FLD User Manual
Installing the Module
Optimizing the Stack Configuration
3
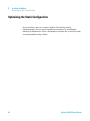
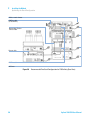
One Stack Configuration
HdakZciXVW^cZi
KVXjjbYZ\VhhZg
>chiVciE^adi
Ejbe
6jidhVbeaZg
8dajbcXdbeVgibZci
9ZiZXidg
Figure 17
Agilent 1260 FLD User Manual
Recommended Stack Configuration (Front View)
47
3
Installing the Module
Optimizing the Stack Configuration
GZbdiZXVWaZ
86C7jhXVWaZid
adXVajhZg^ciZg[VXZ
86C7jhXVWaZ
68edlZg
6cVad\YZiZXidg
h^\cVa
&dg'djiejih
eZgYZiZXidg
A6CidA88]ZbHiVi^dc
adXVi^dcYZeZcYhdcYZiZXidg
Figure 18
48
Recommended Stack Configuration (Rear View)
Agilent 1260 FLD User Manual
Installing the Module
Optimizing the Stack Configuration
3
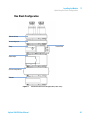
Two Stack Configuration
To avoid excessive height of the stack when the autosampler thermostat is
added to the system it is recommended to form two stacks. Some users prefer
the lower height of this arrangement even without the autosampler
thermostat. A slightly longer capillary is required between the pump and
autosampler. (See Figure 19 on page 49 and Figure 20 on page 50).
>chiVciE^adi
9ZiZXidg
8dajbcXdbeVgibZci
HdakZciXVW^cZi
9Z\VhhZgdei^dcVa
Ejbe
6jidhVbeaZg6AH$;gVXi^dcXdaaZXidg
I]ZgbdhiVi[dgi]Z6AH$;gVXi^dcXdaaZXidgdei^dcVa
Figure 19
Agilent 1260 FLD User Manual
Recommended Two Stack Configuration for 1260 Infinity (Front View)
49
3
Installing the Module
Optimizing the Stack Configuration
A6CidXdcigdahd[ilVgZ
86C7jhXVWaZ
id>chiVciE^adi
6jidhVbeaZg$;gVXi^dc
8daaZXidg8VWaZ
GZbdiZXVWaZ
86C7jhXVWaZ
68EdlZg
Figure 20
50
Recommended Two Stack Configuration for 1260 Infinity (Rear View)
Agilent 1260 FLD User Manual
Installing the Module
Installing the Module
3
Installing the Module
Parts required
Description
Power cord
For other cables see “Cable Overview” on page 190.
Software required
Agilent Data System and/or Instant Pilot G4208A.
Preparations
Locate bench space
Provide power connections
Unpack the detector
WA R N I N G
Module is partially energized when switched off, as long as the power cord is
plugged in.
Repair work at the module can lead to personal injuries, e.g. shock hazard, when the
cover is opened and the module is connected to power.
➔ Make sure that it is always possible to access the power plug.
➔ Remove the power cable from the instrument before opening the cover.
➔ Do not connect the power cable to the Instrument while the covers are removed.
1 Install the LAN interface board in the detector (if required), see “Replacing
the Interface Board” on page 179.
2 Place the detector in the stack or on the bench in a horizontal position.
Agilent 1260 FLD User Manual
51
3
Installing the Module
Installing the Module
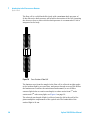
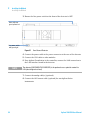
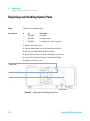
3 Ensure the line power switch at the front of the detector is OFF.
HiVijh^cY^XVidg
\gZZc$nZaadl$gZY
A^cZedlZghl^iX]
l^i]\gZZca^\]i
Figure 21
Front View of Detector
4 Connect the power cable to the power connector at the rear of the detector.
5 Connect the CAN cable to other modules.
6 If an Agilent ChemStation is the controller, connect the LAN connection to
the LAN interface board in the detector.
NOTE
The detector (DAD/MWD/FLD/VWD/RID) is the preferred access point for control via
LAN (due to higher data load).
7 Connect the analog cable(s) (optional).
8 Connect the APG remote cable (optional) for non-Agilent Series
instruments.
52
Agilent 1260 FLD User Manual
3
Installing the Module
Installing the Module
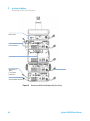
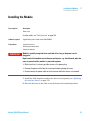
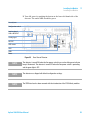
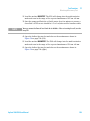
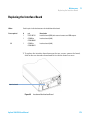
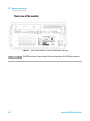
9 Turn ON power by pushing the button at the lower left hand side of the
detector. The status LED should be green.
HZXjg^inaZkZg
8dc[^\jgVi^dchl^iX]
>ciZg[VXZWdVgY
A6Cdg789$:MI
6cVad\h^\cVa
GH"'('8
6E<gZbdiZ
86C
<E>7
EdlZg
Figure 22
Rear View of Detector
NOTE
The detector is turned ON when the line power switch is pressed and the green indicator
lamp is illuminated. The detector is turned OFF when the line power switch is protruding
and the green light is OFF.
NOTE
The detector was shipped with default configuration settings.
NOTE
The GPIB interface has been removed with the introduction of the 1260 Infinity modules.
Agilent 1260 FLD User Manual
53
3
Installing the Module
Flow Connections to the Module
Flow Connections to the Module
For bio-inert modules use bio-inert parts only!
Tools required
Description
Wrench, 1/4 – 5/16 inch
(for capillary connections)
Parts required
Preparations
WA R N I N G
p/n
Description
G1321-68755
Accessory kit
Detector is installed in the LC system.
Toxic, flammable and hazardous solvents, samples and reagents
The handling of solvents, samples and reagents can hold health and safety risks.
➔ When working with these substances observe appropriate safety procedures (for
example by wearing goggles, safety gloves and protective clothing) as described in
the material handling and safety data sheet supplied by the vendor, and follow good
laboratory practice.
➔ The volume of substances should be reduced to the minimum required for the
analysis.
➔ Do not operate the instrument in an explosive atmosphere.
NOTE
54
The flow cell is shipped with a filling of isopropanol (also recommended when the
instrument and/or flow cell is shipped to another location). This is to avoid breakage due to
subambient conditions.
Agilent 1260 FLD User Manual
Installing the Module
Flow Connections to the Module
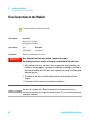
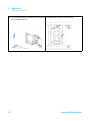
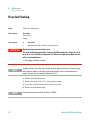
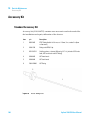
1 Press the release buttons and remove the front cover to
3
2 Locate the flow cell.
gain access to the flow cell area.
Agilent 1260 FLD User Manual
55
3
Installing the Module
Flow Connections to the Module
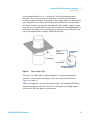
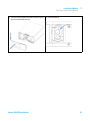
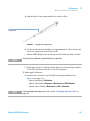
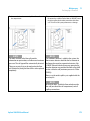
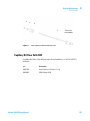
3 Assemble the column detector capillary from the
4 Assemble the waste tubing from the accessory kit.
accessory kit. One side is already factory-assembled.
EgZ"VhhZbWaZY
NOTE
The fluorescence detector should be the last module
in the flow system. An additional detector should be
installed before the fluorescence detector to prevent
any overpressure to the cell (maximum 20 bar).
When working with detector behind the FLD (on own
risk) determine the backpressure of this detector first
by
- removing the column and the last detect and
measuring system pressure at the application flow
rate.
- connecting the last detector (without column and
FLD) and measuring the system pressure with flow.
- the difference in measured pressure is due to the
back pressure generated by the last detector and is the
pressure seen by the FLD.
56
Agilent 1260 FLD User Manual
3
Installing the Module
Flow Connections to the Module
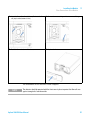
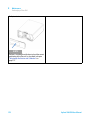
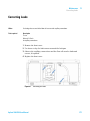
5 Insert the flow cell and install the capillaries to the flow
6 Connect the waste tubing to the bottom waste fitting.
cell (top is outlet, bottom is inlet).
7 Establish flow and observe if leaks occur.
8 Replace the front cover.
The installation of the detector is now complete.
NOTE
The detector should be operated with the front cover in place to protect the flow cell area
against strong drafts from the ouside.
Agilent 1260 FLD User Manual
57
3
58
Installing the Module
Flow Connections to the Module
Agilent 1260 FLD User Manual
Agilent 1260 FLD User Manual
4
Using the Fluorescence Detector
Before You Start
60
Getting Started and Checkout 61
Starting Your Detector 61
Setting the Chromatographic Conditions 62
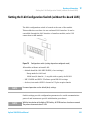
Observe the Maxima via the Isoabsorbance Plot
64
Method Development 65
Step 1: Check the LC System for Impurities 66
Step 2: Optimize Limits of Detection and Selectivity
Step 3: Set up Routine Methods 79
Example: Optimization for Multiple Compounds
Solvent Information
68
83
93
This chapter guides you how to start the work with the detector.
Agilent Technologies
59
4
Using the Fluorescence Detector
Before You Start
Before You Start
Your normal LC grade solvents usually give good results most of the time. But
experience shows that baseline noise can be higher (lower signal-to-noise
ratio) when impurities are in the solvents.
Flush your solvent delivery system for at least 15 minutes before checking
sensitivity. If your pump has multiple channels, you should also flush the
channels not in use.
For optimal results refer to “Optimizing the Detector” on page 97.
60
Agilent 1260 FLD User Manual
4
Using the Fluorescence Detector
Getting Started and Checkout
Getting Started and Checkout
This chapter describes the check out of the Agilent 1260 Infinity Fluorescence
Detector using the Agilent isocratic checkout sample.
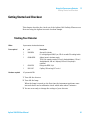
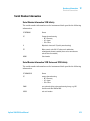
Starting Your Detector
When
Parts required
If you want to checkout the detector
#
p/n
Description
1
5063-6528
Start-up Kit, includes
1
Hardware required
LC cartridge Hypersil ODS, 5 µm, 125 x 4 mm with CIS cartridge holder
1
01080-68704
Agilent isocratic checkout sample
This 0.5 mL ampoule contains 0.15 wt.% dimethylphthalate, 0.15 wt.%
diethylphthalate, 0.01 wt.% biphenyl, 0.03 wt.% o-terphenyl in
methanol.
1
0100-1516
Fitting male PEEK, 2/pk
1
5021-1817
Capillary, 150 mm long, 0.17 mm i.d.
LC system with FLD
1 Turn ON the detector.
2 Turn ON the lamp.
When the lamp is turned on the first time the instrument performs some
internal checks and a calibration check which takes about 5 minutes.
3 You are now ready to change the settings of your detector.
Agilent 1260 FLD User Manual
61
4
Using the Fluorescence Detector
Getting Started and Checkout
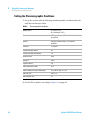
Setting the Chromatographic Conditions
1 Set up the system with the following chromatographic conditions and wait
until the baseline gets stable.
Table 6
Chromatographic Conditions
Mobile phases
A = water = 35 %
B = Acetonitrile = 65 %
Column
OSD-Hypersil column, 125 mm x 4 mm i.d. with 5
µm particles
Sample
Isocratic standard sample, 1:10 diluted in
methanol
Flow rate
1.5 ml/min
Compressibility A (water)
46
Compressibility B (Acetonitrile)
115
Stroke A and B
auto
Stop time
4 min
Injection volume
5 µl
Oven temperature (1200)
30 °C
FLD Excitations/Emission Wavelength
EX = 246 nm, EM = 317 nm
FLD PMT Gain
PMT = 10
FLD Response time
4s
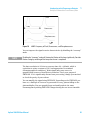
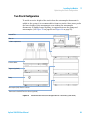
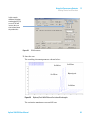
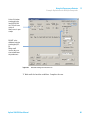
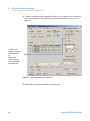
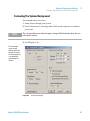
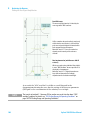
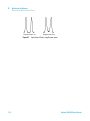
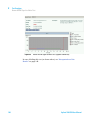
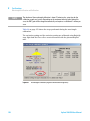
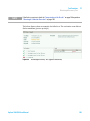
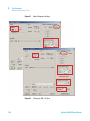
2 Set the FLD setpoints according to Figure 23 on page 63.
62
Agilent 1260 FLD User Manual
Using the Fluorescence Detector
Getting Started and Checkout
4
In this example
additional excitation
wavelenghts (B, C, D)
are used. This will
increase the scan
time and may lower
the performance.
Figure 23
FLD Parameters
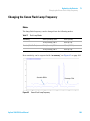
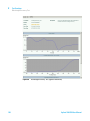
3 Start the run.
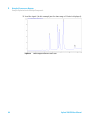
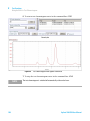
The resulting chromatograms are shown below :
:m2')+cb
:m2'*%cb
:m2'(%cb
7^e]ZcnaeZV`
:m2'.%cb
Figure 24
Biphenyl Peak With Different Excitation Wavelengths
The excitation maxima are around 250 nm.
Agilent 1260 FLD User Manual
63
4
Using the Fluorescence Detector
Getting Started and Checkout
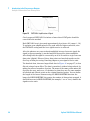
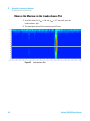
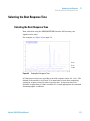
Observe the Maxima via the Isoabsorbance Plot
1 Load the data file (λEX = 246 nm, λEM = 317 nm) and open the
isoabsorbance plot.
2 The maximum λEX will be found around 250 nm.
Figure 25
64
Isoabsorbance Plot
Agilent 1260 FLD User Manual
Using the Fluorescence Detector
Method Development
4
Method Development
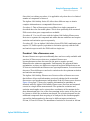
Fluorescence detectors are used in liquid chromatography when superior
limits of detection and selectivity are required. Thorough method
development, including spectra acquisition, is fundamental to achieve good
results. This chapter describes three different steps that can be taken with the
Agilent 1260 Infinity Fluorescence Detector. Table 7 on page 65 gives an
overview of how to benefit from the operation modes during these steps.
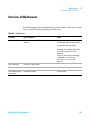
Table 7
Steps for thorough method development
Fluorescence scan
Step 1: Check system
Step 2: Optimize limits of
detection and selectivity
Find impurities (for example,
in solvents and reagents)
Determine simultaneously
the excitation and emission
spectra of a pure compound
Step 3: Set up routine
methods
Signal mode
Perform wavelength
switching
Use for lowest limits of
detection
Spectral
mode/multi-wavelength
detection
Determine Ex/Em spectra
for all separated compounds
in a single run
Collect online spectra,
perform library search,
determine peak purity
Activate up to four
wavelengths simultaneously
Deactivate wavelength
switching
Agilent 1260 FLD User Manual
65
4
Using the Fluorescence Detector
Method Development
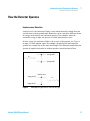
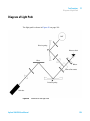
Step 1: Check the LC System for Impurities
A critical issue in trace level fluorescence detection is to have an LC system
free of fluorescent contamination. Most contaminants derive from impure
solvents. Taking a fluorescence scan is a convenient way to check the quality
of the solvent in a few minutes. This can be done, for example, by filling the
FLD cuvette directly with the solvent for an offline measurement even before
the start of a chromatographic run. The result can be displayed as an
isofluorescence plot or a three-dimensional plot. Different colors reflect
different intensities.
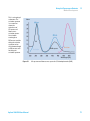
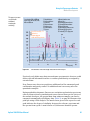
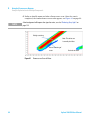
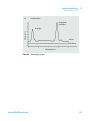
Figure 26 on page 66 shows a sample of slightly impure water which was
planned for use as mobile phase. The area where fluorescence of the
contaminated water sample can be seen is between the stray light areas: the
first- and second-order Raleigh stray light and Raman stray light.
A pure water sample
was put into the flow
cell. Spectra were
recorded at 5 nm
step sizes.
>bejg^in
Figure 26
&#dgYZg
GVbVc
'#dgYZg
Isofluorescence plot of a mobile phase
Since "excitation" and "emission" wavelength are the same for Raleigh stray
light, the area of first-order Raleigh stray light is visible in the left upper area
of the diagram. The Raman bands of water are seen below the first-order
Raleigh stray light. Since the cut-off filter cuts off light below 280 nm, the
second-order Raleigh stray light starts above 560 nm.
66
Agilent 1260 FLD User Manual
Using the Fluorescence Detector
Method Development
4
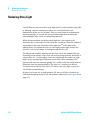
Stray light acts in the same way as impurities in that it simulates background
noise. In both cases, a higher noise level and therefore a higher limit of
detection are obtained. This indicates that high sensitivity measurements
should be done away from wavelength settings that have a high stray light
background.
Agilent 1260 FLD User Manual
67
4
Using the Fluorescence Detector
Method Development
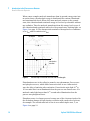
Step 2: Optimize Limits of Detection and Selectivity
To achieve optimum limits of detection and selectivity, analysts must find out
about the fluorescent properties of the compounds of interest. Excitation and
emission wavelengths can be selected for optimum limits of detection and best
selectivity. In general, fluorescence spectra obtained with different
instruments may show significant differences depending on the hardware and
software used.
The traditional approach is to extract an appropriate excitation wavelength
from the UV spectrum that is similar to the fluorescence excitation spectrum
(see Figure 27 on page 68) and to record the emission spectrum. Then with an
optimum emission wavelength determined, the excitation spectrum is
acquired.
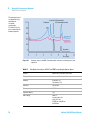
Excitation spectrum
with emission at
440 nm, emission
spectrum with
excitation at 250 nm
of 1 µg/ml quinidine.
Detector settings:
Step size 5 nm, PMT
12 Response time
4 s.
Cdgb#
:mX^iVi^dc
:b^hh^dc
LVkZaZc\i]PcbR
Figure 27
Excitation and emission spectra of quinidine
These tasks have to be repeated for each compound using either a
fluorescence spectrophotometer or stop-flow conditions in LC. Usually each
compound requires a separate run. As a result, a set of excitation and
emission spectrum is obtained (Figure 26 on page 66) for each compound.
68
Agilent 1260 FLD User Manual
4
Using the Fluorescence Detector
Method Development
Since this is a tedious procedure, it is applicable only when there is a limited
number of compounds of interest.
The Agilent 1200 Infinity Series LC offers three different ways to obtain
complete information on a compound's fluorescence:
Procedure I - Take a fluorescence scan offline for a single compound as
described above for the mobile phase. This is done preferably with a manual
FLD cuvette when pure compounds are available.
Procedure II - Use two LC runs with the Agilent 1260 Infinity Fluorescence
Detector to separate the compound mix under known conditions and acquire
emission and excitation spectra separately.
Procedure III - Use an Agilent 1200 Infinty Series FLD/DAD combination and
acquire UV/Visible spectra (equivalent to excitation spectra) with the DAD
and emission spectra with the FLD-both in a single run.
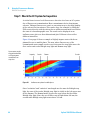
Procedure I - Take a fluorescence scan
Because fluorescence spectra traditionally have not been easily available with
previous LC fluorescence detectors, standard fluorescence
spectrophotometers have been used in the past to acquire spectral
information for unknown compounds. Unfortunately this approach limits
optimization, as there are differences expected in optical design between an
LC detector and a dedicated fluorescence spectrophotometer, or even between
detectors. These differences can lead to variations for the optimum excitation
and emission wavelengths.
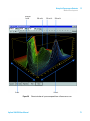
The Agilent 1260 Infinity Fluorescence Detector offers a fluorescence scan
that delivers all spectral information previously obtained with a standard
fluorescence spectrophotometer, independent of the LC fluorescence detector.
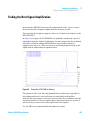
Figure 28 on page 71 shows the complete information for quinidine as
obtained with the Agilent 1260 Infinity Fluorescence Detector and a manual
cuvette in a single offline measurement. The optima for excitation and
emission wavelengths can be extracted as coordinates of the maxima in the
three dimensional plot. One of the three maxima in the center of the plot can
be chosen to define the excitation wavelength. The selection depends on the
additional compounds that are going to be analyzed in the chromatographic
run and the background noise that may be different upon excitation at
250 nm, 315 nm or 350 nm. The maximum of emission is observed at 440 nm.
Agilent 1260 FLD User Manual
69
4
Using the Fluorescence Detector
Method Development
Details for Figure 28 on page 71:
All excitation and emission spectra of Quinidine (1 μg/ml) are shown in
graphic. Fluorescence intensity is plotted vs excitation and emission
wavelengths.
Detector settings: step size 5 nm, PMT 12 , Response time 4 s
70
Agilent 1260 FLD User Manual
Using the Fluorescence Detector
Method Development
higVna^\]i
&#dgYZg
:mVm^h
(*%cb:m
(&*cb:m
4
'*%cb:m
:bVm^h
Figure 28
Agilent 1260 FLD User Manual
Characterization of a pure compound from a fluorescence scan
71
4
Using the Fluorescence Detector
Method Development
Procedure II - Take two LC runs with the FLD
The conditions for the separation of organic compounds such as polyaromatic
nuclear hydrocarbons (PNAs) are well described in various standard methods,
including commonly used EPA and DIN methods. Achieving the best detection
levels requires checking for the optimum excitation and emission wavelengths
for all compounds. Yet taking fluorescence scans individually makes this a
tedious process. A better approach is to acquire spectra online for all
compounds during a run. This speeds up method development tremendously.
Two runs are sufficient for optimization.
During the first run, one wavelength is chosen in the low UV range for the
excitation wavelength and one emission wavelength in the spectral range for
the emission wavelength. Most fluorophores show strong absorption at these
wavelengths and the quantum yield is high. Excitation is sufficient for
collecting emission spectra.
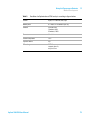
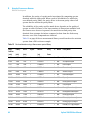
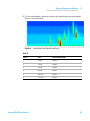
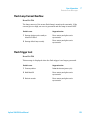
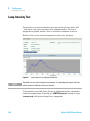
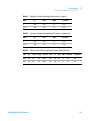
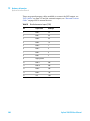
Table on page 74 contains all emission spectra obtained in a single run from a
mix of 15 PNAs. This set of spectra is used to set up a timetable for optimum
emission wavelengths for all compounds.
The individual compound spectra in the isofluorescence plot show that at
least three emission wavelengths are needed to detect all 15 PNAs properly:
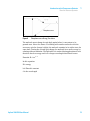
Table 8
Timetable for PNA analysis
0 min:
350 nm
for naphthalene to phenanthrene
8.2 min:
420 nm
for anthracene to benzo(g,h,i)perylene
19.0 min:
500 nm
for indeno(1,2,3-c,d)pyrene
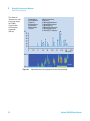
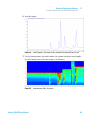
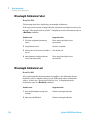
In the second run, three setpoints for emission wavelengths are entered into
the time-program and excitation spectra are recorded, as shown in Figure 30
on page 75. The area of high intensity (red) is caused by stray light when
emission spectra overlap with the excitation wavelength. This can be avoided
by fitting the spectral range automatically. Excitation at 260 nm is most
appropriate for all PNAs.
72
Agilent 1260 FLD User Manual
Using the Fluorescence Detector
Method Development
Table 9
Conditions for Optimization of PNA analysis according to figures below
Column
Vydac, 2.1 x 200 mm, PNA, 5 µm
Mobile phase
A = water; B = acetonitrile (50 : 50)
Gradient
3 minutes, 60%
14 minutes, 90%
22 minutes, 100%
Flow rate
0.4 ml/min
Column temperature
18 °C
Injection volume
5 µl
FLD settings
PMT 12,
response time 4 s,
step size 5 nm
Agilent 1260 FLD User Manual
4
73
4
Using the Fluorescence Detector
Method Development
This shows the
isofluorescence plot
of emission spectra
for 15 PNAs
(5 µg/ml) with a
fixed excitation
wavelength
(260 nm).
&CVe]i]VaZcZ
'6XZcVe]i]ZcZ
(;ajdgZcZ
)E]ZcVci]gZcZ
*6ci]gVXZcZ
+;ajdgVci]ZcZ
,EngZcZ
AJ
-7ZcoVVci]gVXZcZ
.8]gnhZcZ
&%7ZcodW[ajdgVci]ZcZ
&&7Zcod`[ajdgVci]ZcZ
&'7ZcoVengZcZ
&(9^WZcodV]Vci]gVXZcZ
&)7Zcod\!]!^eZgnaZcZ
&*>cYZcd&!'!("XYengZcZ
I^bZPb^cR
:b"heZXigV
[^mZY:m
Figure 29
74
Optimization of the time-program for the emission wavelength
Agilent 1260 FLD User Manual
4
Using the Fluorescence Detector
Method Development
&CVe]i]VaZcZ
'6XZcVe]i]ZcZ
(;ajdgZcZ
)E]ZcVci]gZcZ
*6ci]gVXZcZ
+;ajdgVci]ZcZ
,EngZcZ
AJ
-7ZcoVVci]gVXZcZ
.8]gnhZcZ
&%7ZcodW[ajdgVci]ZcZ
&&7Zcod`[ajdgVci]ZcZ
&'7ZcoVengZcZ
&(9^WZcodV]Vci]gVXZcZ
&)7Zcod\!]!^eZgnaZcZ
&*>cYZcd&!'!("XYengZcZ
I^bZPb^cR
:m^iVi^dc
heZXigV
:b^hh^dc
hl^iX]^c\
Figure 30
Optimization of the time-program for the excitation wavelength
The obtained data are combined to setup the time-table for the excitation
wavelength for best limit of detection and selectivity. The optimized switching
events for this example are summarized in Table 10 on page 75.
Table 10
Timetable for the analysis of 15 polynuclear aromatic hydrocarbons
Time [min]
Exitation Wavelength [nm]
Emission Wavelength [nm]
0
260
350
8.2
260
420
19.0
260
500
This timetable gives the conditions for optimum detection based on the results
of two chromatographic runs.
Agilent 1260 FLD User Manual
75
4
Using the Fluorescence Detector
Method Development
Procedure III - Make a single run with a DAD/FLD combination
For most organic compounds, UV-spectra from diode array detectors are
nearly identical to fluorescence excitation spectra. Spectral differences are
caused by specific detector characteristics such as spectral resolution or light
sources.
In practice, combining a diode array detector with a fluorescence detector in
series gives the full data set needed to achieve the optimum fluorescence
excitation and emission wavelengths for a series of compounds in a single run.
With the UV/Visible/excitation spectra available from the diode array detector,
the fluorescence detector is set to acquire emission spectra with a fixed
excitation wavelength in the low UV range.
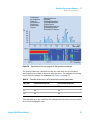
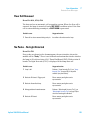
The example is taken from the quality control of carbamates. Samples are
analyzed for the impurities 2,3-diaminophenazine (DAP) and
2-amino-3-hydroxyphenazine (AHP). Reference samples of DAP and AHP were
analyzed with diode array and fluorescence detection. Table on page 77
shows the spectra obtained from both detectors for DAP. The excitation
spectrum of DAP is very similar to the UV absorption spectrum from the diode
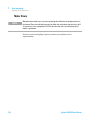
array detector. Table on page 78 shows the successful application of the
method to a carbamate sample and a pure mixture of DAP and AHP for
reference. The column was overloaded with the non-fluorescent carbamate
(2-benzimidazole carbamic acid methylester/MBC) to see the known
impurities, AHP and DAP.
76
Agilent 1260 FLD User Manual
Using the Fluorescence Detector
Method Development
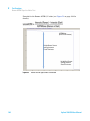
This is an impurity of
carbamates. The
excitation spectrum
in a second run
shows the
equivalence of
UV-spectra and
fluorescence
excitation spectra.
An excitation
wavelength at
265 nm was used for
taking the emission
spectrum and an
emission wavelength
at 540 nm was used
for taking the
excitation spectrum.
4
Cdgb#
JK
:mX^iVi^dc
969"heZXigV
:b^hh^dc
LVkZaZc\i]PcbR
Figure 31
Agilent 1260 FLD User Manual
UV-spectrum and fluorescence spectra for 2,3-diaminophenazine (DAP)
77
4
Using the Fluorescence Detector
Method Development
The two upper traces
are obtained using
two different
excitation
wavelengths.
The lower trace is a
pure standard of the
known impurities.
'"Vb^cd"("D="e]ZcVo^cZ
Jc`cdlc
'!("Y^Vb^cde]ZcVo^cZ
HiVcYVgY
I^bZPb^cR
Figure 32
Table 11
78
Qualitive analysis of MBC (2-benzimidazole carbamic acid methylester) and
impurities
Conditions for analysis of DAP and MBC according to figures above
Column
Zorbax SB, 2 x 50 mm, PNA, 5 µm
Mobile phase
A = water; B = acetonitrile
Gradient
0 minutes, 5%
10 minutes, 15%
Flow rate
0.4 ml/min
Column temperature
35 °C
Injection volume
5 µl
FLD settings
PMT 12,
response time 4 s,
step size 5 nm
Ex 265 nm and 430 nm
Em 540 nm
Agilent 1260 FLD User Manual
4
Using the Fluorescence Detector
Method Development
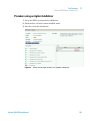
Step 3: Set up Routine Methods
In routine analysis, sample matrices can have a significant influence on
retention times. For reliable results, sample preparation must be thorough to
avoid interferences or LC methods must be rugged enough. With difficult
matrices, simultaneous multi-wavelength detection offers more reliability than
timetable-controlled wavelength switching. The FLD can, in addition, acquire
fluorescence spectra while it records the detector signals for quantitative
analysis. Therefore qualitative data are available for peak confirmation and
purity checks in routine analysis.
Multi wavelength detection
Time-programmed wavelength switching traditionally is used to achieve low
limits of detection and high selectivity in routine quantitative analysis. Such
switching is difficult if compounds elute closely and require a change in
excitation or emission wavelength. Peaks can be distorted and quantitation
made impossible if wavelength switching occurs during the elution of a
compound. Very often this happens with complex matrices, influencing the
retention of compounds.
In spectral mode, the FLD can acquire up to four different signals
simultaneously. All of them can be used for quantitative analysis. Apart from
complex matrices, this is advantageous when watching for impurities at
additional wavelengths. It is also advantageous for reaching low limits of
detection or increasing selectivity through optimum wavelength settings at
any time. The number of data points acquired per signal is reduced and thus
limits of detection may be higher, depending on the detector settings
compared to the signal mode.
PNA analysis, for example, can be performed with simultaneous multi
wavelength detection instead of wavelength-switching. With four different
wavelengths for emission, all 15 PNAs can be monitored (Table on page 81).
Agilent 1260 FLD User Manual
79
4
Using the Fluorescence Detector
Method Development
Table 12
80
Conditions for simultanoeus multi wavelength detection for PNA-analysis (see
figure below)
Column
Vydac, 2.1 x 250 mm, PNA, 5 µm
Mobile phase
A = water; B = acetonitrile (50 : 50 )
Gradient
3 min, 60 %
14.5 min, 90 %
22.5 min, 95 %
Flow rate
0.4 mL/min
Column temperature
22 °C
Injection volume
2 µL
FLD settings
PMT 12 ,
response time 4 s
Agilent 1260 FLD User Manual
Using the Fluorescence Detector
Method Development
The upper trace was
received with
traditional
wavelength
switching.
&ZmX^iVi^dcLAVi'+%cb
)Zb^hh^dcLAVi(*%!)'%!
))%VcY*%%cb
&CVe]i]VaZcZ
'6XZcVe]i]ZcZ
(;ajdgZcZ
)E]ZcVci]gZcZ
*6ci]gVXZcZ
+;ajdgVci]ZcZ
,EngZcZ
:m2',*!:b2(*%!II
GZ[ZgZcXZ
X]gdbVid\gVb
l^i]hl^iX]^c\ZkZcih
4
-7ZcoVVci]gVXZcZ
.8]gnhZcZ
&%7ZcodW[ajdgVci]ZcZ
&&7Zcod`[ajdgVci]ZcZ
&'7ZcoVengZcZ
&(9^WZcodV!]Vci]gVXZcZ
&)7Zcod\!]!^eZgnaZcZ
&*>cYZcd&!'!("XYengZcZ
I^bZPb^cR
Figure 33
Simultaneous multi wavelength detection for PNA-analysis
Previously, only diode array detectors and mass spectrometric detectors could
deliver spectral information on-line to confirm peak identity as assigned by
retention time.
Now, fluorescence detectors provide an additional tool for automated peak
confirmation and purity control. No additional run is necessary after the
quantitative analysis.
During method development, fluorescence excitation and emission spectra are
collected from reference standards and entered into a library-at the choice of
the method developer. All spectral data from unknown samples can then be
compared automatically with library data. Table 13 on page 82 illustrates this
principle using a PNA analysis. The match factor given in the report for each
peak indicates the degree of similarity between the reference spectrum and
the spectra from a peak. A match factor of 1,000 means identical spectra.
Agilent 1260 FLD User Manual
81
4
Using the Fluorescence Detector
Method Development
In addition, the purity of a peak can be investigated by comparing spectra
obtained within a single peak. When a peak is calculated to be within the
user-defined purity limits, the purity factor is the mean purity value of all
spectra that are within the purity limits.
The reliability of the purity and the match factor depends on the quality of
spectra recorded. Because of the lower number of data points available with
the fluorescence detector in general, the match factors and purity data
obtained show stronger deviations compared to data from the diode array
detector, even if the compounds are identical.
Table 13 on page 82 shows an automated library search based on the emission
spectra from a PNA reference sample.
Table 13
Peak confirmation using a fluorescence spectral library
Meas.
RetTime
Library
CalTbl
[min]
[min]
[min]
4.859
4.800
5.178
6.764
7.000
7.137
Amount
Purity
#
Match
Libary Name
[ng]
Factor
1
1.47986e-1
-
1
993
Naphthalene@em
7.162
1
2.16156e-1
-
1
998
Acenaphthene@em
7.100
7.544
1
1.14864e-1
-
1
995
Fluorene@em
8.005
8.000
8.453
1
2.56635e-1
-
1
969
Phenanthrene@em
8.841
8.800
9.328
1
1.76064e-1
-
1
993
Anthracene@em
9.838
10.000
10.353
1
2.15360e-1
-
1
997
Fluoranthene@em
10.439
10.400
10.988
1
8.00754e-2
-
1
1000
Pyrene@em
12.826
12.800
13.469
1
1.40764e-1
-
1
998
Benz(a)anthracene@em
13.340
13.300
14.022
1
1.14082e-1
-
1
999
Chrysene@em
15.274
15.200
16.052
1
6.90434e-1
-
1
999
Benzo(b)fluoranthene@em
16.187
16.200
17.052
1
5.61791e-1
-
1
998
Benzo(k)fluoranthene@em
16.865
16.900
17.804
1
5.58070e-1
-
1
999
Benz(a)pyrene@em
18.586
18.600
19.645
1
5.17430e-1
-
1
999
Dibenz(a,h)anthracene@em
19.200
19.100
20.329
1
6.03334e-1
-
1
995
Benzo(g,h,i)perylene@em
20.106
20.000
21.291
1
9.13648e-2
-
1
991
Indeno(1,2,3-c,d)pyrene@em
82
Signal
Agilent 1260 FLD User Manual
Using the Fluorescence Detector
Example: Optimization for Multiple Compounds
4
Example: Optimization for Multiple Compounds
Example: Optimization for Multiple Compounds
Using PNAs as a sample, this example uses the described scanning functions.
Agilent 1260 FLD User Manual
83
4
Using the Fluorescence Detector
Example: Optimization for Multiple Compounds
Setting the Chromatographic Conditions
This example uses the following chromatographic conditions (the detector
settings are shown in Figure 34 on page 85).
Table 14
Chromatographic Conditions
Mobile phases
A = water = 50 %
B = Acetonitrile = 50 %
Column
Vydac-C18-PNA, 250 mm x 2.1 mm i.d. with 5 µm
particles
Sample
PAH 0.5 ng
Flow rate
0.4 ml/min
Compressibility A (water)
46
Compressibility B (Acetonitrile)
115
Stroke A and B
auto
Time Table
at 0 min % B=50
at 3 min % B=60
at 14.5 min % B=90
at 22.5 min % B=95
84
Stop time
26 min
Post time
8 min
Injection volume
1 µl
Oven temperature (1200)
30 °C
FLD PMT Gain
PMT = 15
FLD Response time
4s
Agilent 1260 FLD User Manual
Using the Fluorescence Detector
Example: Optimization for Multiple Compounds
4
Select a Excitation
wavelength in the
low UV (230...260
nm). This will cover
nearly all
fluorescence in your
sample.
DO NOT select
additional emission
wavelengths (B, C,
D).
Doing so will
increase the scan
time and will lower
the performance.
Figure 34
Detector Settings for Emission Scan
1 Wait until the baseline stabilizes. Complete the run.
Agilent 1260 FLD User Manual
85
4
Using the Fluorescence Detector
Example: Optimization for Multiple Compounds
2 Load the signal. (In this example just the time range of 13 min is displayed).
Figure 35
86
Chromatogram from Emissions Scan
Agilent 1260 FLD User Manual
Using the Fluorescence Detector
Example: Optimization for Multiple Compounds
4
3 Use the isoabsorbance plot and evaluate the optimal emission wavelengths,
shown in the table below.
Figure 36
Isoabsorbance Plot from Emission Scan
Table 15
Peak #
Time
Emission Wavelength
1
5.3 min
330 nm
2
7.2 min
330 nm
3
7.6 min
310 nm
4
8.6 min
360 nm
5
10.6 min
445 nm
6
11.23 min
385 nm
Agilent 1260 FLD User Manual
87
4
Using the Fluorescence Detector
Example: Optimization for Multiple Compounds
4 Using the settings and the timetable (from previous page), do a second run
for the evaluation of the optimal excitation wavelength. See Figure 37 on
page 88.
DO NOT select
additional excitation
wavelengths (B, C,
D).
Doing so will
increase the scan
time and will lower
the performance.
Figure 37
Detector Settings for Excitation Scan
5 Wait until the baseline stabilizes. Start the run.
88
Agilent 1260 FLD User Manual
Using the Fluorescence Detector
Example: Optimization for Multiple Compounds
4
6 Load the signal.
Figure 38
Chromatogram - Excitation Scan at Reference Wavelength 260/330 nm
7 Use the isoabsorbance plot and evaluate the optimal excitation wavelengths
(in this example just in the time range of 13 minutes).
Figure 39
Agilent 1260 FLD User Manual
Isoabsorbance Plot - Excitation
89
4
Using the Fluorescence Detector
Example: Optimization for Multiple Compounds
The table below shows the complete information about emission (from
Figure 36 on page 87) and excitation maxima.
Table 16
Peak #
Time
Emission Wavelength
Excitation Wavelength
1
5.3 min
330 nm
220 / 280 nm
2
7.3 min
330 nm
225 / 285 nm
3
7.7 min
310 nm
265 nm
4
8.5 min
360 nm
245 nm
5
10.7 min
445 nm
280 nm
6
11.3 min
385 nm
270 / 330 nm
90
Agilent 1260 FLD User Manual
4
Using the Fluorescence Detector
Example: Optimization for Multiple Compounds
Evaluating The System Background
The example below uses water.
1 Pump solvent through your system.
2 Set the fluorescence scan range under FLD special setpoints according to
your needs.
NOTE
The scan time will increase when the range is enlarged. With the default values, the scan
takes about 2 minutes.
3 Set PMT gain to 16.
The wavelength
range and step
number defines the
duration. Using the
maximum range, the
scan would take
approximately 10
minutes.
Figure 40
Agilent 1260 FLD User Manual
FLD Special Settings
91
4
Using the Fluorescence Detector
Example: Optimization for Multiple Compounds
4 Define a data file name and take a fluorescence scan. After the scan is
completed, the isoabsorbance scan results appear, see Figure 41 on page 92.
NOTE
A low background will improve the signal-to-noise, see also “Reducing Stray Light” on
page 114.
GVaZ^\]hXViiZg^c\
CdiZ/I]^hl]^iZVgZV
^hcdgbVaanYVg`WajZ#
GVbVchXViiZg^c\d[
lViZg
Figure 41
92
'cYdgYZgd[Xjid[[
Fluorescence Scan of Water
Agilent 1260 FLD User Manual
Using the Fluorescence Detector
Solvent Information
4
Solvent Information
Observe the following recommendations on the use of solvents.
• Follow recommendations for avoiding the growth of algae, see pump
manuals.
• Small particles can permanently block capillaries and valves. Therefore,
always filter solvents through 0.4 μm filters.
• Avoid or minimize the use of solvents that may corrode parts in the flow
path. Consider specifications for the pH range given for different materials
like flow cells, valve materials etc. and recommendations in subsequent
sections.
Solvent information for parts of the 1260 Infinity Bio-inert LC system
For the Agilent 1260 Infinity Bio-inert LC system, Agilent Technologies uses
highest quality materials (see “Bio-inert Materials” on page 28) in the flow
path (also referred to as wetted parts), which are widely accepted by life
scientists, as they are known for optimum inertness to biological samples, and
ensure best compatibility to common samples and solvents over a wide pH
range. Explicitly, the complete flow path is free from stainless steel and free
from other alloys containing metals such as iron, nickel, cobalt, chromium,
molybdenum or copper, which can interfere with biological samples. The flow
downstream of the sample introduction contains no metals whatsoever.
However, there are no materials that combine suitability for versatile HPLC
instrumentation (valves, capillaries, springs, pump heads, flow cells etc.) with
complete compatibility with all possible chemicals and application conditions.
This section recommends the preferred solvents. Chemicals that are known to
cause issues should be avoided, or exposure should be minimized, for
example, for short-term cleaning procedures. After potentially aggressive
chemicals have been used, the system should be flushed with compatible
standard HPLC solvents.
Agilent 1260 FLD User Manual
93
4
Using the Fluorescence Detector
Solvent Information
PEEK
PEEK (Polyether-Ether Ketones) combines excellent properties with regard to
biocompatibility, chemical resistance, mechanical and thermal stability and is
therefore the material of choice for biochemical instrumentation. It is stable in
the specified pH range, and inert to many common solvents. There is still a
number of known incompatibilities with chemicals such as chloroform,
methylene chloride, THF, DMSO, strong acids (nitric acid > 10 %, sulphuric
acid > 10 %, sulfonic acids, trichloroacetic acid), halogenes or aequous
halogene solutions, phenol and derivatives (cresols, salicylic acid etc.).
When used above room temperature, PEEK is sensitive to bases and various
organic solvents, which can cause it to swell. As normal PEEK capillaries are
very sensitive to high pressure, especially under such conditions, Agilent uses
stainless-steel cladded PEEK capillaries to keep the flow path free of steel and
to ensure pressure stability to at least 600 bar. If in doubt, consult the
available literature about the chemical compatibility of PEEK.
Titanium
Titanium is highly resistant to oxidizing acids (for example, nitric, perchloric
and hypochlorous acid) over a wide range of concentrations and temperatures.
This is due to a thin oxide layer on the surface, which is stabilized by oxidizing
compounds. Reducing acids (for example, hydrochloric, sulfuric and
phosphoric acid) can cause slight corrosion, which increases with acid
concentration and temperature. For example, the corrosion rate with 3 % HCl
(about pH 0.1) at room temperature is about 13 μm/year. At room
temperature, titanium is resistant to concentrations of about 5 % sulfuric acid
(about pH 0.3). The addition of nitric acid to hydrochloric or sulfuric acids
significantly reduces corrosion rates. Titanium is subject to corrosion in
anhydrous methanol, which can be avoided by adding a small amount of water
(about 3 %). Slight corrosion is possible with ammonia > 10 %.
Fused silica
Fused silica is inert against all common solvents and acids except hydrofluoric
acid. It is corroded by strong bases and should not be used above pH 12 at
room temperature. The corrosion of flow cell windows can negatively affect
measurement results. For a pH greater than 12, the use of flow cells with
sapphire windows is recommended.
94
Agilent 1260 FLD User Manual
Using the Fluorescence Detector
Solvent Information
4
Gold
Gold is inert to all common HPLC solvents, acids and bases within the
specified pH range. It can be corroded by complexing cyanides and
concentrated acids like aqua regia (a mixture of concentrated hydrochloric
and nitric acid).
Zirconium Oxide
Zirconium Oxide (ZrO2) is inert to almost all common acids, bases and
solvents. There are no documented incompatibilities for HPLC applications.
Platinum/Iridium
Platinum/Iridium is inert to almost all common acids, bases and solvents.
There are no documented incompatibilities for HPLC applications.
PTFE
PTFE (polytetrafluorethen) is inert to almost all common acids, bases and
solvents. There are no documented incompatibilities for HPLC applications.
Sapphire, Ruby and Al2O3-based ceramics
Sapphire, ruby and ceramics based on Al2O3 are inert to almost all common
acids, bases and solvents. There are no documented incompatibilities for
HPLC applications.
Data above were collected from external resources and are meant as a
reference. Agilent cannot guarantee the completeness and correctness of such
information. Information can also not be generalized due to catalytic effects of
impurities like metal ions, complexing agents, oxygen etc. Most data available
refers to room temperature (typically 20 – 25 °C, 68 – 77 °F). If corrosion is
possible, it usually increases at higher temperatures. If in doubt, consult
additional resources.
Agilent 1260 FLD User Manual
95
4
96
Using the Fluorescence Detector
Solvent Information
Agilent 1260 FLD User Manual
Agilent 1260 FLD User Manual
5
Optimizing the Detector
Optimization Overview
98
Design Features Help Optimization 100
Check Performance Before You Start 100
Finding the Best Wavelengths
A Real Example 102
101
Finding the Best Signal Amplification 103
FLD Scaling Range and Operating Conditions
Changing the Xenon Flash Lamp Frequency
Lamp Life Savings 110
Selecting the Best Response Time
Reducing Stray Light
104
109
111
114
This chapter provides information on how to optimize the detector.
Agilent Technologies
97
5
Optimizing the Detector
Optimization Overview
Optimization Overview
1 Setting the right PMT value
For most applications a setting of 10 is adequate (see “Finding the Best
Signal Amplification” on page 103). The FLD A/D converter exhibits a large
linear range making PMT switching unnecessary for most applications. For
example, if at high concentrations a peak is cut off; decrease the PMT
setting. Remember that low PMT settings decrease the signal to noise ratio.
The built-in PMT gain test uses the parameters in the detector. When using
the PMT gain test, the wavelength setting and lamp energy mode
(depending on Multiwavelength-Mode and Lamp-Economy) will affect the
PMT gain calculation.
NOTE
If you have changed one or more parameter(s), you have to press 'OK' to write down the
new settings into the FLD. Then re-enter 'FLD-Signals' and start the PMT gain test.
2 Using an appropriate response time
For most applications a setting of 4 seconds is adequate (see “Selecting the
Best Response Time” on page 111). Only for high speed analyses (short
columns at high flow rates) a lower setting is recommended. Bear in mind
that even if the response time is too high fast peaks will appear a little
smaller and broader but retention time and peak areas are still correct and
reproducible.
3 Finding the optimum wavelength
Most fluorescent active molecules absorb at 230 nm (see “Finding the Best
Wavelengths” on page 101). Set the excitation wavelength to 230 nm and
on-line scan the emission spectra (multi-emission mode). Then set the
determined emission wavelength and perform a multi-excitation scan
(multi-excitation mode) to find the best excitation wavelength.
98
Agilent 1260 FLD User Manual
Optimizing the Detector
Optimization Overview
5
4 Evaluating fluorescence spectra
In contrast to diode array based UV detectors where UV spectra are
evaluated by taking a spectrum at the peak maximum and selecting a
reference spectrum at the baseline, correct fluorescence spectra are
obtained by selecting a peak maximum spectrum and a reference around
the inflection points. Selecting reference spectra at the baseline is not
useful because the spectrum on the baseline is very noisy (no light!).
5 Switching lamp ON only for analysis
Unless maximum sensitivity is needed, the lamp lifetime can significantly
be increased by switching it on just for analysis. In contrast to other LC
detectors the fluorescence detector equilibrates within seconds after the
lamp is switched ON.
NOTE
For highest reproducibility and linearity change the lamp setting to always ON (default is on
only during run).
One hour of initial warm-up of the instrument is recommended.
6 Do not overpressurize the detector flow cell
Be aware to not exceed a 20 bar pressure drop after the flow cell when
hooking up additional devices like other detectors or a fraction collector.
It's better to place a UV detector before the fluorescence detector.
NOTE
When comparing fluorescence excitation spectra directly with DAD spectra or literature
based absorbance spectra, you should consider large differences in the used optical
bandwidth (FLD = 20 nm) which cause a systematic wavelength maximum shift depending
on the absorbance spectrum of the compound under evaluation.
Agilent 1260 FLD User Manual
99
5
Optimizing the Detector
Design Features Help Optimization
Design Features Help Optimization
The module has several features you can use to optimize detection:
PMTGAIN
Amplification factor
LAMP
Flash frequency
RESPONSETIME
Data reduction interval
Check Performance Before You Start
Before you start you should check that your detector is performing according
to the specifications published by Agilent Technologies.
Your normal LC grade solvents may give good results most of the time but our
experience shows that baseline noise can be higher with LC grade solvents
than with fluorescence grade solvents.
Flush your solvent delivery system for at least 15 minutes before checking
sensitivity. If your pump has multiple channels, you should also flush the
channels not in use.
100
Agilent 1260 FLD User Manual
Optimizing the Detector
Finding the Best Wavelengths
5
Finding the Best Wavelengths
The most important parameters to be optimized in fluorescence detection are
the excitation and emission wavelengths. Generally, it is assumed that the best
excitation wavelength can be taken from the excitation spectrum acquired on
a spectrofluorimeter. It is also assumed that once the optimal excitation
wavelength has been found for one particular instrument type this wavelength
can also be applied to other instruments.
Both assumptions are wrong.
The optimum wavelength for the excitation depends on the absorption of the
compounds but also on the instrument characteristics, for example the lamp
type and the gratings. As most organic molecules absorb best in the
ultra-violet range the module was designed to give an optimum signal-to-noise
ratio in the 210 nm to 360 nm range of the spectrum. To achieve greatest
sensitivity, the absorbance wavelength of your sample molecule should match
the wavelength range for your instrument. In other words, an excitation
wavelength in the ultra-violet range. Your module has a broad excitation
wavelength range, but for higher sensitivity you should choose a wavelength in
the ultra-violet range (near 250 nm).
The design elements that contribute to lower efficiency in the lower
ultra-violet range are the xenon flash lamp and the gratings. Flash-type lamps
shift the optimum wavelength to lower wavelength ranges with the module to
a maximum of 250 nm. The excitation grating is blazed for highest efficiency at
300 nm.
Agilent 1260 FLD User Manual
101
5
Optimizing the Detector
Finding the Best Wavelengths
A Real Example
Although an excitation wavelength of 340 nm is quoted in the literature the
module scan of orthophthalaldehyde, a derivative of the amino acid alanine, (
Figure 42 on page 102) shows a maximum between 220 nm and 240 nm.
Figure 42
Scan Orthophthalaldehyde Derivative of Alanine
When you are looking for the wavelength by scanning, scan over the whole
range. As this example shows a maximum may be found in a completely
different wavelength range.
NOTE
102
When comparing fluorescence excitation spectra directly with DAD spectra or literature
based absorbance spectra, you should consider large differences in the used optical
bandwidth (FLD = 20 nm) which cause a systematic wavelength maximum shift depending
on the absorbance spectrum of the compound under evaluation.
Agilent 1260 FLD User Manual
5
Optimizing the Detector
Finding the Best Signal Amplification
Finding the Best Signal Amplification
Increasing the PMTGAIN increases the signal and the noise. Up to a certain
factor the increase in signal is higher than the increase in noise.
The step from gain to gain is equal to a factor of 2 (which is the same as on the
HP 1046A FLD).
In Figure 43 on page 103 the PMTGAIN was gradually raised from 4 up to 11
(the peak is from the Agilent Technologies isocratic sample which was diluted
1000 times). With increasing PMTGAIN there was an improvement in
signal-to-noise up to 10. Above 10 the noise increased proportionately to the
signal with no improvement in signal-to-noise.
EBI
&&
&%
.
+
)
Figure 43
Finding Best PMTGAIN for Biphenyl
The reason for this is the fact, that quantification of baselines (especially at
low background levels) is not sufficient for statistically working filter
methods. For the best gain, check your solvent under flow conditions with the
auto-gain function. Do not use higher values than proposed by the system, if
not necessary, because of excessive high fluorescence signals.
Use the PMT test to automatically determine the setting.
Agilent 1260 FLD User Manual
103
5
Optimizing the Detector
Finding the Best Signal Amplification
FLD Scaling Range and Operating Conditions
When using different FLD
• The signal height of individual G1321 FLD modules may exceed the
recommended signal range 0 – 100 LU. Under certain circumstances this
could lead to clipped peaks.
• Different G1321 FLD modules show different signal heights with identical
methods. This is not a problem in general but could be inconvenient when
operating more than one G1321 FLD in the lab.
Both scaling issues can be resolved. Refer to “Optimize the
PMT-Gain-Level” on page 105.
104
Agilent 1260 FLD User Manual
5
Optimizing the Detector
Finding the Best Signal Amplification
Optimize the PMT-Gain-Level
Start the PMT-Gain-Test with your operating conditions (used method
parameter, EX-/EM-wavelength, solvent, flow rate, …). The resulting PMT
value will give you the best signal to noise performance with the maximum
usable signal range for this method and this specific instrument. For another
FLD this PMT level may vary (based on the individual PMT-Gain-Test).
The figure below demonstrates the impact of changing the PMT Gain.
Figure 44
Agilent 1260 FLD User Manual
PMT Gain Behavior
105
5
Optimizing the Detector
Finding the Best Signal Amplification
In this example the maximum output is around 220 LU and further increase of
the PMT (above 9) results in a signal overload (clipping) and drop of signal to
noise value.
1 Set the PMT-Gain Level
Now check with your highest concentration amount, that your highest peak
does not clip or overflow.
• If this check is ok, you finished the PMT-Gain-Level optimization.
Continue with "Set your Luminescence Units in LU".
• If the check shows that the highest concentration doesn't fit to the
selected range (e.g. by clipping), you may decrease the sensitivity of your
FLD by gradually decreasing the PMT-Level by 1 to get roughly half the
signal height by each step. Be aware that by that step you will lose
sensitivity at low signal levels (LOD).
2 Set your Luminescence Units in LU
If you are not satisfied with the LU output level of the detector or if you
want to align the output of multiple instruments with different output
levels you can scale each instrument output.
The recommended setting of the G1321 FLD is around 100 LU for the
highest peak height to get optimum signal to noise and signal range. Lower
LU values normally do not influence the performance of the instrument if
PMT-Gain Test was executed fine.
For analog out less than 100 LU is optimum to get best analog signal
performance with the default attenuation of 100 LU/ 1 V. Adapt your LU
setting such that your maximum signal level under default attenuation is
between 50 to 80 LU (analog output equivalent to 500 mV to 800 mV).
After correct PMT Setting you can scale any instrument to your favorable
LU level. We recommend not exceeding around 100 LU. The parameter of
choice is called 'Scale factor' and is applicable by the local controller, the
Instant Pilot (B.02.07 or later).
106
Agilent 1260 FLD User Manual
5
Optimizing the Detector
Finding the Best Signal Amplification
In case older revisions are used, the 'Scale factor' can be entered using the
command line of
• Agilent ChemStation:
PRINT SENDMODULE$(LFLD,"DMUL x.xx")
• Instant Pilot: Service Mode – FLD, then type
DMUL x.xx and press SEND.
• LAN/RS-232 Firmware Update Tool: via Send Instruction menu:
DMUL x.xx
• Agilent LabAdvisor Software: via Instruction menu:
DMUL x.xx
This setting is resident to the instrument even for firmware updates and is
independent of the software environment.
The level of LU is no measure of instrument sensitivity! At the lowest
concentration limit (limit of detection), the signal to noise (e.g. by Raman
S/N Test) is the only measure that can accurately be used to compare
chromatograms and results and to confirm the performance of the
instrument.
For low background and highest sensitivity keep the flow cell clean and use
always fresh water to prevent biological background from native
fluorescence by algae and bacteria.
Visualization of ADC Limits
A new firmware (A.06.11) for the Fluorescence Detector G1321A/B has been
released that includes a new feature, the "Visualization of ADC Limits".
Up to firmware A.06.10, an "ADC overflow" was not visible in the
chromatogram under certain method conditions.
Overflow could be concealed by smoothing of a filter and thus not visible for
the user. In the Agilent ChemStation, the "ADC overflow" event was only
shown in the logbook.
This problem did only occur if the Peakwidth (Responsetime) parameter has
been set similar or larger than the real width of the chromatographic peak.
Agilent 1260 FLD User Manual
107
5
Optimizing the Detector
Finding the Best Signal Amplification
Raw ADC counts
The measured light intensity is limited by the
max range of the ADC-converter.
A filter smoothes the peak making it not clearly
visible that the max intensity is reached. Also
peak area and peak height are distorted which
leads to poor linearity performance.
Note that "max LU" is not a fix number but
depends on the intensity of the reference
channel!
New implementation (with firmware A.06.11
or above)
While any sample value within the filter width is
in state "ADC overflow" the max possible LU is
displayed in chromatogram.
Note that "max LU" is slightly dependent on
lamp drift and lamp noise but strongly
dependent on the excitation wavelength.
As a result, the "ADC overflow" is visible as a real flat peak in the
chromatogram showing the user, that the setting of the detector parameter
(PMT gain or the concentration of the solution) is set to high.
NOTE
108
The transfer of methods 1:1 from one FLD to another may result into the above "ADC
overflow" problem. For details see “FLD Scaling Range and Operating Conditions” on
page 104“FLD Scaling Range and Operating Conditions”.
Agilent 1260 FLD User Manual
Optimizing the Detector
Changing the Xenon Flash Lamp Frequency
5
Changing the Xenon Flash Lamp Frequency
Modes
The lamp flash frequency can be changed into the following modes:
Table 17
Flash Lamp Modes
Positioning
Rotation (Multi Ex/Em)
296 Hz (Standard), 560 V
63 mJ (18.8 W)
74 Hz (Economy), 560 V
63 mJ (4.7 W)
74 Hz (Standard), 950 V
180 mJ (13.3 W)
74 Hz (Economy), 560 V
63 mJ (4.7 W)
Best sensitivity can be expected with “no economy”, see Figure 45 on page 109.
HiVcYVgY2'.+=o
Figure 45
Agilent 1260 FLD User Manual
:Xdcdbn2,)=o
Xenon Flash Lamp Frequency
109
5
Optimizing the Detector
Changing the Xenon Flash Lamp Frequency
Lamp Life Savings
There are three ways to save lamp life:
• switch to “lamp on during run” without loss of sensitivity.
• switch to “economy” mode with a certain loss of sensitivity.
• a combination of the above.
110
Agilent 1260 FLD User Manual
Optimizing the Detector
Selecting the Best Response Time
5
Selecting the Best Response Time
Selecting the Best Response Time
Data reduction using the RESPONSETIME function will increase your
signal-to-noise ratio.
For example, see Figure 46 on page 111.
-hZX
)hZX
1 sec
Figure 46
Finding Best Response Time
LC fluorescence detectors typically work with response times of 2 or 4 s. The
default of the module is 4 seconds. It is important to know that comparing
sensitivity requires using the same response time. A response time of 4 s
(default) is equivalent to a time constant of 1.8 s and appropriate for standard
chromatographic conditions.
Agilent 1260 FLD User Manual
111
5
Optimizing the Detector
Selecting the Best Response Time
GZhedchZi^bZ'hZX
Figure 47
112
GZhedchZi^bZ-hZX
Separation of Peaks using Responsetime
Agilent 1260 FLD User Manual
Optimizing the Detector
Selecting the Best Response Time
5
Peakwidth Settings
NOTE
Do not use peak width shorter than necessary.
Peakwidth enables you to select the peak width (response time) for your
analysis. The peak width is defined as the width of a peak, in minutes, at half
the peak height. Set the peak width to the narrowest expected peak in your
chromatogram. The peak width sets the optimum response time for your
detector. The peak detector ignores any peaks that are considerably narrower,
or wider, than the peak width setting. The response time is the time between
10 % and 90 % of the output signal in response to an input step function.
Limits: When you set the peak width (in minutes), the corresponding response
time is set automatically and the appropriate data rate for signal and spectra
acquisition is selected as shown in the table below.
Table 18
Peakwidth Setting
Peak Width
Data Rate
At half height
[min]
Response
[sec]
Hz
ms
< 0.003
0.03
74.07
13.5
> 0.003
0.06
37.04
27.0
> 0.005
0.12
37.04
27.0
> 0.01
0.25
37.04
27.0
> 0.025
0.5
18.52
54.0
> 0.05
1.0
9.26
108.0
> 0.1
2.0
4.63
216.0
> 0.2
4.0
2.31
432.0
> 0.4
8.0
1.16
864.0
G1321B
Agilent 1260 FLD User Manual
G1321A/B
113
5
Optimizing the Detector
Reducing Stray Light
Reducing Stray Light
Cut-off filters are used to remove stray light and 2nd order or higher stray light
by allowing complete transmission above the cut-off and little or no
transmission below the cut-off point. They are used between excitation and
emission gratings, to prevent any stray excitation light from reaching the
photomultiplier tube, when it is measuring emission.
When the emission and excitation wavelengths are close together, the
distortion due to scattering severely limits the sensitivity. When the emission
wavelength is twice the excitation wavelength the 2nd order light is the
limiting factor. To explain the effect of such higher order light, assume the
detector is on, but no sample is eluting through the flow cell.
The lamp sends 1 million photons into the flow cell at, for example 280 nm.
Scattering on the surface of the flow cell and scattering from the molecules of
solvent allow 0.1 % of this light to leave the cell through the window at right
angles to the incident light. Without a cut-off filter, these remaining 1000
photons will reach the emission grating. 90 % will be reflected totally without
dispersion onto the photomultiplier. The other 10 % disperses at 280 nm
(1st order) and at 560 nm (2nd order). To remove this stray light, you need a
cut-off filter around 280 nm.
Because of a known set of applications a 295 nm cut-off filter is built-in for
undisturbed application up to 560 nm without compromises (see Figure 48 on
page 115).
114
Agilent 1260 FLD User Manual
Optimizing the Detector
Reducing Stray Light
AJ
5
:m^iVi^dc(%%cb
HZXdcYdgYZg
a^\]i+%%cb
;ajdgZhXZcXZ
HigVna^\]i
cd[^aiZg
[^aiZg'-%cb
LVkZaZc\i]PcbR
Figure 48
Agilent 1260 FLD User Manual
Reducing Stray Light
115
5
116
Optimizing the Detector
Reducing Stray Light
Agilent 1260 FLD User Manual
Agilent 1260 FLD User Manual
6
Troubleshooting and Diagnostics
Overview of the Module’s Indicators and Test Functions
118
Status Indicators 119
Power Supply Indicator 119
Module Status Indicator 120
User Interfaces
121
Agilent Lab Advisor Software
122
This chapter gives an overview about the troubleshooting and diagnostic
features and the different user interfaces.
Agilent Technologies
117
6
Troubleshooting and Diagnostics
Overview of the Module’s Indicators and Test Functions
Overview of the Module’s Indicators and Test Functions
Status Indicators
The module is provided with two status indicators which indicate the
operational state (prerun, run, and error states) of the module. The status
indicators provide a quick visual check of the operation of the module.
Error Messages
In the event of an electronic, mechanical or hydraulic failure, the module
generates an error message in the user interface. For each message, a short
description of the failure, a list of probable causes of the problem, and a list of
suggested actions to fix the problem are provided (see chapter Error
Information).
Test Functions
A series of test functions are available for troubleshooting and operational
verification after exchanging internal components (see Tests and
Calibrations).
Wavelength Recalibration
Wavelength recalibration is recommended after repair of internal components
to ensure correct operation of the detector. The detector uses specific
properties of the excitation and emission light characteristics (see
“Wavelength Calibration Procedure” on page 160).
118
Agilent 1260 FLD User Manual
6
Troubleshooting and Diagnostics
Status Indicators
Status Indicators
Two status indicators are located on the front of the module. The lower left
indicates the power supply status, the upper right indicates the module status.
HiVijh^cY^XVidg
\gZZc$nZaadl$gZY
A^cZedlZghl^iX]
l^i]\gZZca^\]i
Figure 49
Location of Status Indicators
Power Supply Indicator
The power supply indicator is integrated into the main power switch. When
the indicator is illuminated (green) the power is ON.
Agilent 1260 FLD User Manual
119
6
Troubleshooting and Diagnostics
Status Indicators
Module Status Indicator
The module status indicator indicates one of six possible module conditions:
• When the status indicator is OFF (and power switch light is on), the module
is in a prerun condition, and is ready to begin an analysis.
• A green status indicator, indicates the module is performing an analysis
(run mode).
• A yellow indicator indicates a not-ready condition. The module is in a
not-ready state when it is waiting for a specific condition to be reached or
completed (for example, immediately after changing a set point), or while a
self-test procedure is running.
• An error condition is indicated when the status indicator is red. An error
condition indicates the module has detected an internal problem which
affects correct operation of the module. Usually, an error condition requires
attention (e.g. leak, defective internal components). An error condition
always interrupts the analysis.
If the error occurs during analysis, it is propagated within the LC system,
i.e. a red LED may indicate a problem of a different module. Use the status
display of your user interface for finding the root cause/module of the
error.
• A blinking indicator indicates that the module is in resident mode (e.g.
during update of main firmware).
• A fast blinking indicator indicates that the module is in a low-level error
mode. In such a case try to re-boot the module or try a cold-start (see
“Special Settings” on page 224. Then try a firmware update (see “Replacing
Module Firmware” on page 180). If this does not help, a main board
replacement is required.
120
Agilent 1260 FLD User Manual
Troubleshooting and Diagnostics
User Interfaces
6
User Interfaces
Depending on the user interface the available tests vary. All test descriptions
are based on the Agilent ChemStation as user interface. Some descriptions are
only available in the Service Manual.
Table 19
Test Functions avaible vs. User Interface
Test
ChemStation
Instant Pilot G4208A
Lab Advisor
D/A Converter
No
No
Yes
Test Chromatogram
Yes (C)
No
Yes
Wavelength
Calibration
Yes
Yes (M)
Yes
Lamp Intensity
Yes
No
Yes
Dark Current
Yes
No
Yes
C
via command
M
section Maintenance
D
section Diagnose
Agilent 1260 FLD User Manual
121
6
Troubleshooting and Diagnostics
Agilent Lab Advisor Software
Agilent Lab Advisor Software
The Agilent Lab Advisor software is a standalone product that can be used
with or without data system. Agilent Lab Advisor software helps to manage
the lab for high quality chromatographic results and can monitor in real time a
single Agilent LC or all the Agilent GCs and LCs configured on the lab
intranet.
Agilent Lab Advisor software provides diagnostic capabilities for all Agilent
1200 Infinity Series modules. This includes diagnostic capabilities, calibration
procedures and maintenance routines for all the maintenance routines.
The Agilent Lab Advisor software also allows users to monitor the status of
their LC instruments. The Early Maintenance Feedback (EMF) feature helps to
carry out preventive maintenance. In addition, users can generate a status
report for each individual LC instrument. The tests and diagnostic features as
provided by the Agilent Lab Advisor software may differ from the descriptions
in this manual. For details refer to the Agilent Lab Advisor software help files.
The Instrument Utilities is a basic version of the Lab Advisor with limited
functionality required for installation, use and maintenance. No advanced
repair, troubleshooting and monitoring functionality is included.
122
Agilent 1260 FLD User Manual
Agilent 1260 FLD User Manual
7
Error Information
What Are Error Messages
124
General Error Messages 125
Timeout 125
Shutdown 126
Remote Timeout 127
Lost CAN Partner 127
Leak 128
Leak Sensor Open 128
Leak Sensor Short 129
Compensation Sensor Open
Compensation Sensor Short
Fan Failed 130
129
130
Detector Error Messages 131
Lamp Cover Open 131
FLF Board not found 131
ADC Not Calibrated 132
A/D Overflow 132
Flash Lamp Current Overflow 133
Flash Trigger Lost 133
Wavelength Calibration Failed 134
Wavelength Calibration Lost 134
Flow Cell Removed 135
No Peaks - No Light Detected 135
Motor Errors 136
This chapter describes the meaning of error messages, and provides
information on probable causes and suggested actions how to recover from
error conditions.
Agilent Technologies
123
7
Error Information
What Are Error Messages
What Are Error Messages
Error messages are displayed in the user interface when an electronic,
mechanical, or hydraulic (flow path) failure occurs which requires attention
before the analysis can be continued (for example, repair, or exchange of
consumables is necessary). In the event of such a failure, the red status
indicator at the front of the module is switched on, and an entry is written
into the module logbook.
If an error occurs outside a method run, other modules will not be informed
about this error. If it occurs within a method run, all connected modules will
get a notification, all LEDs get red and the run will be stopped. Depending on
the module type, this stop is implemented differently. For example, for a pump
the flow will be stopped for safety reasons. For a detector, the lamp will stay
on in order to avoid equilibration time. Depending on the error type, the next
run can only be started, if the error has been resolved, for example liquid from
a leak has been dried. Errors for presumably single time events can be
recovered by switching on the system in the user interface.
Special handling is done in case of a leak. As a leak is a potential safety issue
and may have occurred at a different module from where it has been observed,
a leak always causes a shutdown of all modules, even outside a method run.
In all cases, error propagation is done via the CAN bus or via an APG remote
cable (see documentation for the APG interface).
124
Agilent 1260 FLD User Manual
Error Information
General Error Messages
7
General Error Messages
General error messages are generic to all Agilent series HPLC modules and
may show up on other modules as well.
Timeout
Error ID: 0062
The timeout threshold was exceeded.
Probable cause
Suggested actions
1 The analysis was completed successfully,
Check the logbook for the occurrence and
source of a not-ready condition. Restart the
analysis where required.
and the timeout function switched off the
module as requested.
2 A not-ready condition was present during a
sequence or multiple-injection run for a
period longer than the timeout threshold.
Agilent 1260 FLD User Manual
Check the logbook for the occurrence and
source of a not-ready condition. Restart the
analysis where required.
125
7
Error Information
General Error Messages
Shutdown
Error ID: 0063
An external instrument has generated a shutdown signal on the remote line.
The module continually monitors the remote input connectors for status
signals. A LOW signal input on pin 4 of the remote connector generates the
error message.
Probable cause
Suggested actions
1 Leak detected in another module with a
Fix the leak in the external instrument before
restarting the module.
CAN connection to the system.
2 Leak detected in an external instrument
with a remote connection to the system.
3 Shut-down in an external instrument with a
remote connection to the system.
4 The degasser failed to generate sufficient
vacuum for solvent degassing.
126
Fix the leak in the external instrument before
restarting the module.
Check external instruments for a shut-down
condition.
Check the vacuum degasser for an error
condition. Refer to the Service Manual for the
degasser or the 1260 pump that has the
degasser built-in.
Agilent 1260 FLD User Manual
7
Error Information
General Error Messages
Remote Timeout
Error ID: 0070
A not-ready condition is still present on the remote input. When an analysis is
started, the system expects all not-ready conditions (for example, a not-ready
condition during detector balance) to switch to run conditions within one
minute of starting the analysis. If a not-ready condition is still present on the
remote line after one minute the error message is generated.
Probable cause
Suggested actions
1 Not-ready condition in one of the
Ensure the instrument showing the not-ready condition is
installed correctly, and is set up correctly for analysis.
instruments connected to the
remote line.
2 Defective remote cable.
Exchange the remote cable.
3 Defective components in the
Check the instrument for defects (refer to the instrument’s
documentation).
instrument showing the not-ready
condition.
Lost CAN Partner
Error ID: 0071
During an analysis, the internal synchronization or communication between
one or more of the modules in the system has failed.
The system processors continually monitor the system configuration. If one or
more of the modules is no longer recognized as being connected to the system,
the error message is generated.
Probable cause
Suggested actions
1 CAN cable disconnected.
•
Ensure all the CAN cables are connected correctly.
•
Ensure all CAN cables are installed correctly.
2 Defective CAN cable.
Exchange the CAN cable.
3 Defective main board in another
Switch off the system. Restart the system, and determine
which module or modules are not recognized by the
system.
module.
Agilent 1260 FLD User Manual
127
7
Error Information
General Error Messages
Leak
Error ID: 0064
A leak was detected in the module.
The signals from the two temperature sensors (leak sensor and
board-mounted temperature-compensation sensor) are used by the leak
algorithm to determine whether a leak is present. When a leak occurs, the leak
sensor is cooled by the solvent. This changes the resistance of the leak sensor
which is sensed by the leak-sensor circuit on the main board.
Probable cause
Suggested actions
1 Loose fittings.
Ensure all fittings are tight.
2 Broken capillary.
Exchange defective capillaries.
Leak Sensor Open
Error ID: 0083
The leak sensor in the module has failed (open circuit).
The current through the leak sensor is dependent on temperature. A leak is
detected when solvent cools the leak sensor, causing the leak-sensor current to
change within defined limits. If the current falls outside the lower limit, the
error message is generated.
Probable cause
Suggested actions
1 Leak sensor not connected to the main
Please contact your Agilent service
representative.
board.
2 Defective leak sensor.
Please contact your Agilent service
representative.
3 Leak sensor incorrectly routed, being
Please contact your Agilent service
representative.
pinched by a metal component.
128
Agilent 1260 FLD User Manual
Error Information
General Error Messages
7
Leak Sensor Short
Error ID: 0082
The leak sensor in the module has failed (short circuit).
The current through the leak sensor is dependent on temperature. A leak is
detected when solvent cools the leak sensor, causing the leak sensor current to
change within defined limits. If the current increases above the upper limit,
the error message is generated.
Probable cause
Suggested actions
1 Defective leak sensor.
Please contact your Agilent service
representative.
Compensation Sensor Open
Error ID: 0081
The ambient-compensation sensor (NTC) on the main board in the module has
failed (open circuit).
The resistance across the temperature compensation sensor (NTC) on the
main board is dependent on ambient temperature. The change in resistance is
used by the leak circuit to compensate for ambient temperature changes. If the
resistance across the sensor increases above the upper limit, the error
message is generated.
Probable cause
Suggested actions
1 Defective main board.
Please contact your Agilent service
representative.
Agilent 1260 FLD User Manual
129
7
Error Information
General Error Messages
Compensation Sensor Short
Error ID: 0080
The ambient-compensation sensor (NTC) on the main board in the module has
failed (short circuit).
The resistance across the temperature compensation sensor (NTC) on the
main board is dependent on ambient temperature. The change in resistance is
used by the leak circuit to compensate for ambient temperature changes. If the
resistance across the sensor falls below the lower limit, the error message is
generated.
Probable cause
Suggested actions
1 Defective main board.
Please contact your Agilent service
representative.
Fan Failed
Error ID: 0068
The cooling fan in the module has failed.
The hall sensor on the fan shaft is used by the main board to monitor the fan
speed. If the fan speed falls below a certain limit for a certain length of time,
the error message is generated.
Depending on the module, assemblies (e.g. the lamp in the detector) are
turned off to assure that the module does not overheat inside.
130
Probable cause
Suggested actions
1 Fan cable disconnected.
Please contact your Agilent service
representative.
2 Defective fan.
Please contact your Agilent service
representative.
3 Defective main board.
Please contact your Agilent service
representative.
Agilent 1260 FLD User Manual
Error Information
Detector Error Messages
7
Detector Error Messages
These errors are detector specific.
Lamp Cover Open
Error ID: 6622, 6731
The lamp cover in the optical compartment has been removed. The lamp
cannot be turned on while this message is on.
Probable cause
Suggested actions
1 Lamp cover removed.
Please contact your Agilent service
representative.
FLF Board not found
Error ID: 6620, 6730
The FLF board could not be found by the main board (FLM). This message
comes together with some other message generated on the FLF board (e.g.
Leak, ...).
Probable cause
Suggested actions
1 FLF board not connected to the FLM board.
Please contact your Agilent service
representative.
2 Defective FLF board.
Please contact your Agilent service
representative.
3 Defective FLM board.
Please contact your Agilent service
representative.
Agilent 1260 FLD User Manual
131
7
Error Information
Detector Error Messages
ADC Not Calibrated
Error ID: 6621, 6732
The analog-to-digital converter located on the FLF board cannot calibrate.
Probable cause
Suggested actions
1 Defective ADC or other FLF electronics.
Please contact your Agilent service
representative.
A/D Overflow
Error ID: 6618, 6619
This message is not implemented in firmware revision A.03.66 and below.
It indicates an overload situation of the A/D converter (sample signal). The
user-interface will show a not-ready condition for the FLD and an info event is
written into the logbook. If the message comes up during a run, it includes the
time of occurrence and when it disappears.
1200 FLD 1 A/D overflow (RT is 0.32 min) 16:33:24 02/11/99
1200 FLD 1 A/D overflow finished (RT is 0.67 min)16:33:46 02/11/99
If this condition is present prior to a run, the not-ready will prevent the
system to start the run/sequence.
With firmware revision A.06.11 and above, the A/D overflow leads into a flat
peak in the chromatogram. For details see “Visualization of ADC Limits” on
page 107.
132
Probable cause
Suggested actions
1 PMT setting to high.
Reduce PMT gain.
2 Wavelength setting wrong.
Change wavelength setting.
Agilent 1260 FLD User Manual
Error Information
Detector Error Messages
7
Flash Lamp Current Overflow
Error ID: 6704
The lamp current of the xenon flash lamp is monitored constantly. If the
current gets too high, an error is generated and the lamp is turned OFF.
Probable cause
Suggested actions
1 Shortage of trigger pack assembly or
Please contact your Agilent service
representative.
defective FLL board.
2 Shortage of flash lamp assembly.
Please contact your Agilent service
representative.
Flash Trigger Lost
Error ID: 6722
This message is displayed when the flash trigger is no longer generated.
Probable cause
Suggested actions
1 Firmware problem.
Reboot the detector (power cycle).
2 Multi Mode Off
Please contact your Agilent service
representative.
3 Defective encoder.
Please contact your Agilent service
representative.
Agilent 1260 FLD User Manual
133
7
Error Information
Detector Error Messages
Wavelength Calibration Failed
Error ID: 6703
This message may show up during a wavelength calibration.
If the expected deviation is larger than the specified wavelength accuracy, the
message “Wavelength Calibration Failed” is displayed and the instrument stays in
a Not Ready condition.
Probable cause
Suggested actions
1 Flash lamp not ignited or position not
Please contact your Agilent service
representative.
correct.
2 Cell position not correct.
Check the cell position.
3 Solvent in the cell not clean or air bubble in
Flush the flow cell.
the cell.
4 monochromator assembly position not
correct (after replacement).
Please contact your Agilent service
representative.
Wavelength Calibration Lost
Error ID: 6691
After exchanging the monochromator assemblies, the calibration factors
should be reset to defaults values (a new FLM board comes with default
values). In this case “Wavelength Calibration Lost” is displayed and the
instrument stays in a Not Ready condition.
Probable cause
Suggested actions
1 Reset of monochromator settings after
Perform a wavelength calibration.
exchange.
2 Replacement of FLM board.
134
Perform a wavelength calibration.
Agilent 1260 FLD User Manual
7
Error Information
Detector Error Messages
Flow Cell Removed
Error ID: 6616, 6702, 6760
The detector has an automatic cell recognition system. When the flow cell is
removed, the lamp is turned off and a NOT READY condition exists. If the flow
cell is removed during an analysis, a SHUT DOWN is generated.
Probable cause
Suggested actions
1 Flow cell has been removed during analysis.
Insert flow cell and turn on the lamp.
No Peaks - No Light Detected
Error ID: 6721
If no peaks are shown in the chromatogram, the user-interface shows the
module still in “Ready”. There is no feedback mechanism that checks whether
the lamp is ON with revision A/B/C Front End Board (FLF). With revision D
boards "No Light Detected (6721)" is displayed if the lamp shuts off..
Probable cause
Suggested actions
1 Lamp is off.
Perform a “Lamp Intensity Test” (see “Lamp
Intensity Test” on page 140). If no profile
available (very low counts).
2 Defective FLL board / Trigger pack.
Please contact your Agilent service
representative.
3 Defective Xenon flash lamp.
Please contact your Agilent service
representative.
4 Wrong position of monochromator.
Perform a “Wavelength Accuracy Test” (see
“Wavelength Accuracy Test” on page 154) to
check the wavelength calibration.
5 Defective FLF board.
Please contact your Agilent service
representative.
Agilent 1260 FLD User Manual
135
7
Error Information
Detector Error Messages
Motor Errors
NOTE
Monochromator motor errors may show up during the initialization or during operation of
the detector.There are individual messages for either the excitation or the emission side.If
an error occurs, do a lamp ignition. This will clear the error and a re-initialization of the
motors is performed.
If motor errors are displayed, please contact your Agilent service
representative.
136
Agilent 1260 FLD User Manual
Agilent 1260 FLD User Manual
8
Test Functions
Introduction
138
Diagram of Light Path
139
Lamp Intensity Test 140
Lamp Intensity History
141
Raman ASTM Signal-to-Noise Test 142
Procedure using an Agilent LabAdvisor 145
Procedure using an Agilent ChemStation 147
Interpretation of the Results 148
Using the Built-in Test Chromatogram 149
Procedure Using the Agilent LabAdvisor 149
Wavelength Verification and Calibration
151
Wavelength Accuracy Test 154
Using the Agilent LabAdvisor 154
Using the Agilent ChemStation (Manually)
Wavelength Calibration Procedure
157
160
This chapter describes the detector’s built in test functions.
Agilent Technologies
137
8
Test Functions
Introduction
Introduction
All tests are described based on the Agilent Lab Advisor Software B.01.04.
Other user interfaces may not provide any test or just a few.
Table 20
Interfaces and available test functions
Interface
Comment
Available Function
Agilent Instrument Utilities
Maintenance tests are
available
•
•
Intensity
WL Calibration
Agilent Lab Advisor
All tests are available
•
•
•
•
•
•
•
•
•
•
Intensity
ASTM Drift and Noise
Dark Current
D/A Converter
WL Accuracy
WL Calibration
Test Chromatogram (Tools)
Spectra Scan (Tools)
Module Infos (Tools)
Diagnostic (Tools)
Agilent ChemStation
Some tests may be available
Adding of temperature
•
Some of LabAdvisor tests
Agilent Instant Pilot
Some tests are available
•
•
•
•
•
Intensity
WL Calibration
Spectra Scan (Tools)
Module Infos (Tools)
Diagnostic
For details on the use of the interface refer to the interface documentation.
138
Agilent 1260 FLD User Manual
Test Functions
Diagram of Light Path
8
Diagram of Light Path
The light path is shown in Figure 50 on page 139.
EBI
:b^hh^dc\gVi^c\
GZ[ZgZcXZY^dYZ
B^ggdg
9^[[jhZg
;adlXZaadgXjkZiiZ
:mX^iVi^dc\gVi^c\
;aVh]ijWZ
Figure 50
Agilent 1260 FLD User Manual
Schematic of the Light Path
139
8
Test Functions
Lamp Intensity Test
Lamp Intensity Test
The intensity test scans an intensity spectrum via the reference diode (200
- 1200 nm in 1 nm steps) and stores it in a diagnosis buffer. The scan is
displayed in a graphic window. There is no further evaluation of the test.
Results of this test are stored as lamp history (date code, intensity).
Figure 51
NOTE
Lamp Intensity Test (Agilent LabAdvisor)
The profile can vary from instrument to instrument. It is dependig on the age of the lamp
and the content of the flow cell (use fresh water).
UV degradation, especially below 250 nm is significantly higher compared to
visible wavelength range. Generally the "LAMP ON during run" setting or using
"economy mode" will increase lamp life by a magnitude.
140
Agilent 1260 FLD User Manual
8
Test Functions
Lamp Intensity Test
Lamp Intensity History
Results of the lamp intensity test (if the last one is older than one week) are
stored as lamp history (date code, intensity of four different wavelengths,
250 nm, 350 nm, 450 and 600 nm) in a buffer. The data/plot can be retrieved
via the diagnostics and provides intensity data over a length of time.
Figure 52
NOTE
Lamp Intensity History (Agilent ChemStation Diagnostic)
In the Agilent LabAdvisor the Lamp Intensity History can be found in the Module Info
section.
Agilent 1260 FLD User Manual
141
8
Test Functions
Raman ASTM Signal-to-Noise Test
Raman ASTM Signal-to-Noise Test
These tests verify the Raman ASTM signal-to-noise for
• single wavelength (at signal) (EX=350 nm, EM=397 nm) or
• single wavelength (at background) (Ex=350 nm, Em=397 nm, dark value
450 nm) or
• dual wavelength (EX=350 nm, EMA=397 nm, EMB=450 nm)
NOTE
The specification single wavelength at signal can be measured with the Agilent LabAdvisor.
All other have to be set up manually as described for “Dual Wavelength Verification” on
page 147 with the information from Table 23 on page 143 and Table 24 on page 143.
Table 21
142
Raman Signal-to-Noise Test Conditions
Duration
approximately 23 minutes
Report Style (Agilent ChemStation)
Performance+Noise
Noise Determination
5 to 20 minutes
Solvent
LC grade water, degassed
Flow rate
0.5 - 1 ml/min
Specification (single wavelength at signal)
>500 (according to settings in Table 22 on
page 143)
Specification (single wavelength at
background)
>3000 (according to settings in Table 23 on
page 143)
Specification (dual wavelength)
>300 (according to settings in Table 24 on
page 143)
Agilent 1260 FLD User Manual
Test Functions
Raman ASTM Signal-to-Noise Test
Table 22
Settings for Single Wavelength Specifications (at signal)
Time
EX
EM
PMT
Baseline
0
350
397
12
Free
20.30
350
450
12
Free
Table 23
Settings for Single Wavelength Specifications (at background)
Time
EX
EM
PMT
Baseline
0
350
450
14
Free
20.30
350
397
14
Free
Table 24
8
Settings for Dual Wavelength Specifications (Multi-EM Scan)
Time
EX
EM_A
EM_B
Spectra From
To
Step
PMT Baseline
Fit Spectra
00.00
350
397
450
None
280
450
10
12
Free
OFF
20.30
350
450
450
None
280
450
10
12
Free
OFF
Agilent 1260 FLD User Manual
143
8
Test Functions
Raman ASTM Signal-to-Noise Test
Formula for the Raman ASTM S/N value (see Figure 53 on page 144 for
details):
6HIBCd^hZ
i^bZ*id'%b^cjiZh
=Z^\]iGVbVc8jggZci
VkZgV\ZWZilZZc
*VcY&%b^cjiZh
=Z^\]i9Vg`8jggZci
VkZgV\ZWZilZZc
'&VcY''b^cjiZh
Figure 53
144
Raman ASTM signal/noise calculation
Agilent 1260 FLD User Manual
Test Functions
Raman ASTM Signal-to-Noise Test
8
Procedure using an Agilent LabAdvisor
1 Set up the HPLC system and the LabAdvisor.
2 Flush the flow cell with clean bi-distilled water.
3 Start the test in the LabAdvisor.
Figure 54
Agilent 1260 FLD User Manual
Raman ASTM Signal-to-Noise Test (Agilent LabAdvisor)
145
8
Test Functions
Raman ASTM Signal-to-Noise Test
Figure 55
Raman ASTM Signal-to-Noise Test (Agilent LabAdvisor)
In case of failing this test (as shown above) see “Interpretation of the
Results” on page 148.
146
Agilent 1260 FLD User Manual
8
Test Functions
Raman ASTM Signal-to-Noise Test
Procedure using an Agilent ChemStation
Procedure using an Agilent ChemStation
The Agilent ChemStation should be used for the verification of the Dual
Wavelength Check only.
1 Set up the HPLC system and the Agilent LabAdvisor.
2 Flush the flow cell with clean bi-distilled water.
3 Turn on the FLD lamp.
4 Select “Verification (OQ/PV)”.
NOTE
Assure that the FLD signal is signal 1 (in case you use an additional detector in the system).
Otherwise wrong calculations may be done due to wrong signals.
Dual Wavelength Verification
For specfications and settings see Table 21 on page 142 and Table 24 on
page 143.
1 Open Method and Run Control.
2 Open method OQFLDSNT.M.
3 Modify the time table according to Table 24 on page 143.
4 Save the method as OQFLDSNT2.M.
5 Open sequence OQFLDSNT.S.
6 Modify the sequence to use a different store location and and to call up
method OQFLDSNT2.M.
7 Save the sequence as OQFLDSNT2.S
8 Select customize sequence and select OQFLDSNT2.S.
9 Set the limits to 300.
10 When the run is completed a report is displayed and the status line shows
the “Raman signal/noise ratio = “ value should be >300.
Agilent 1260 FLD User Manual
147
8
Test Functions
Raman ASTM Signal-to-Noise Test
Interpretation of the Results
If the test shows low Raman values, check for:
✔ correctly positioned flow cell,
✔ clean flow cell (flush with clean bi-distilled water),
✔ no air bubble(s) (check via fluorescence scan or visual check of
cell/cuvette),
✔ solvent inlet filter (may create air bubbles in flow cell).
148
Agilent 1260 FLD User Manual
Test Functions
Using the Built-in Test Chromatogram
8
Using the Built-in Test Chromatogram
This function is available from the Agilent ChemStation, LabAdvisor and
Instant Pilot.
The built-in Test Chromatogram can be used to check the signal path from the
detector to the data system and the data analysis or via the analog output to
the integrator or data system. The chromatogram is continuously repeated
until a stop is executed either by means of a stop time or manually.
NOTE
The peak height is always the same but the area and the retention time depend on the set
peakwidth, see example below.
Procedure Using the Agilent LabAdvisor
This procedure works for all Agilent 1200 Infinity detectors (DAD, MWD,
VWD, FLD and RID). The example figure is from the RID detector.
1 Assure that the default LC method is loaded via the control software.
2 Start the Agilent Lab Advisor software (B.01.03 SP4 or later) and open the
detector's Tools selection.
3 Open the test chromatogram screen
4 Turn the Test Chromatogram on.
5 Change to the detector's Module Service Center and add the detector signal to
the Signal Plot window.
Agilent 1260 FLD User Manual
149
8
Test Functions
Using the Built-in Test Chromatogram
6 To start a test chromatogram enter in the command line: STRT
Figure 56
Test Chromatogram with Agilent Lab Advisor
7 To stop the test chromatogram enter in the command line: STOP
NOTE
150
The test chromatogram is switched off automatically at the end of a run.
Agilent 1260 FLD User Manual
8
Test Functions
Wavelength Verification and Calibration
Wavelength Verification and Calibration
The wavelength calibration is based on a Glycogen solution, which acts as a
strong elastic light scatterer (refer to ASTM Test Method E388-72-1993
“Spectral Bandwidth and Wavelength Accuracy of Fluorescence
Spectrometers”). The Glycogen solution is introduced into the flow cell and
then the built-in wavelength calibration functionality is used.
The algorithm is based on evaluating different grating orders and calculating
the wavelength scales of both, excitation and emission monochromator, by
applying the fundamental grating equation.
NOTE
A complete wavelength calibration is not always required. In most cases a quick
wavelength accuracy verification is sufficient enough, see Table 25 on page 151.
Table 25
Reasons for doing a Verification or Calibration
Verification
WL calibration
interest
X
GLP compliance
X
cell change
X
(X)
lamp change
X
(X)
monochromator change
X
main board change
X
optical unit change
X
( X ) only required, if deviation is too large.
NOTE
Prior to a wavelength calibration, a wavelength accuracy verification should be performed,
see “Wavelength Accuracy Test” on page 154. If the deviation is more than ±3 nm, the
wavelength calibration should be done as described in “Wavelength Calibration
Procedure” on page 160.
Agilent 1260 FLD User Manual
151
8
Test Functions
Wavelength Verification and Calibration
NOTE
The duration of the wavelength calibration is about 15 minutes plus setup time for the
calibration sample and system. Depending on the maximum intensity found during this
scan, the PMT gain will be changed automatically and requires an additional 1 minute per
scan.
Table 26 on page 153 shows the steps performed during the wavelength
calibration.
The excitation grating and the emission grating are calibrated using Rayleigh
stray light from the flow cell or cuvette measured with the photomultiplier
tube.
Figure 57
152
Wavelength Calibration (Agilent ChemStation Diagnostic)
Agilent 1260 FLD User Manual
Test Functions
Wavelength Verification and Calibration
Table 26
8
Wavelength Calibration Steps
Step
Description
Duration
1
Preparation
max 30 s
2
Excitation rotation scan, full circle
60 s
3
Excitation rotation scan, high resolution
44 s
4
Excitation position scan, low resolution
55 s variable
5
Excitation position scan, high resolution
260 s variable
6.n
Emission rotation scan, full circle (# of scans depends on the required PMT gain, 1
minute per scan)
61 s variable
6.n
Em rotation scan, full circle" (instrument profile)
9s
6.n
Em rotation scan, full circle" (instrument profile)
9s
6.n
Em rotation scan, full circle" (instrument profile)
9s
6.n
Em rotation scan, full circle" (instrument profile)
9s
7
Emission rotation scan, high resolution, part I
44 s
8
Emission rotation scan, high resolution, part II
44 s
9
Emission position scan, low resolution
50 s variable
10
Emission position scan, high resolution
250 s variable
NOTE
Variable times means that they could be a little bit longer.
When the lamp is off, the calibration process will stop within the first two steps with “
Wavelength Calibration Failed” , see “Wavelength Calibration Failed” on page 134.
Agilent 1260 FLD User Manual
153
8
Test Functions
Wavelength Accuracy Test
Wavelength Accuracy Test
Using the Agilent LabAdvisor
1 Set up the HPLC system and the Agilent LabAdvisor.
2 Flush the flow cell with clean bi-distilled water.
3 Turn on the FLD lamp.
4 Run the Wavelength Accuracy Test.
5 The FLD will change into the multi-excitation mode with emission
wavelength at 397 nm and scan in the range of the expected maximum of
350 nm ±20 nm.
As result, the maxima should be found at 350 nm ±3 nm, see Figure 58 on
page 154.
The FLD will change into the multi-emission mode with excitation
wavelength at 350 nm and scan in the range of the expected maximum of
397 nm ± 20 nm.
As result, the maxima should be found at 397 nm ± 3 nm, see Figure 58 on
page 154.
:B2(*%cb
[^mZY
:M2(*%cb
[^mZY
:M2(*%cb
$"(cb
Figure 58
154
:B2(.,cb
$"(cb
Excitation and Emission Spectrum (expected results)
Agilent 1260 FLD User Manual
8
Test Functions
Wavelength Accuracy Test
NOTE
If the limits are not met, check for “Interpretation of the Results” on page 148 or perform
“Wavelength Calibration Procedure” on page 160.
The below figures show an example of a failed test. The excitation scan did not
find a maximum (just an up-slope).
Figure 59
Agilent 1260 FLD User Manual
Wavelength Accuracy Test (Agilent LabAdvisor)
155
8
Test Functions
Wavelength Accuracy Test
Figure 60
156
Wavelength Accuracy Test (Agilent LabAdvisor)
Agilent 1260 FLD User Manual
Test Functions
Wavelength Accuracy Test
8
Using the Agilent ChemStation (Manually)
1 Create the methods WLEMTEST and WLEXTEST as listed Table 27 on
page 157.
Table 27
Method Settings
Setting
Check of EM WL 397 nm
WLEMTEST
Check of EX WL 350 nm
WLEXTEST
Peak Width
>0.2 min (4 s, standard)
>0.2 min (4 s, standard)
Fit Spectral Range
OFF
OFF
PMT Gain
12
12
Flash Lamp
ON
ON
Spectrum Range
EM 367 - 417 nm step 1 nm
EX 330 - 380 nm step 1 nm
Store Spectra
All w/o signal
All w/o signal
EX Wavelength
350 nm, ON
350 nm, OFF
EM Wavelength
397 nm, OFF
397 nm, ON
Multi WL Settings
Multi EM
Multi EX
Agilent 1260 FLD User Manual
157
8
158
Test Functions
Wavelength Accuracy Test
Figure 61
Special Setpoints Settings
Figure 62
Settings for EM / EX Scan
Agilent 1260 FLD User Manual
8
Test Functions
Wavelength Accuracy Test
2 Load the method WLEXTEST. The FLD will change into the multi-emission
mode and scan in the range of the expected maximum of 397 nm ±20 nm.
3 Start the pump and flush the cell with water for a few minutes to assure a
clean flow cell. Flow rate should be 0.5 to 1 ml/min and the baseline stable.
NOTE
You may remove the flow cell and check for air bubbles. After re-inserting the cell, turn the
lamp ON.
4 Open the Online Spectra plot and observe the maximum as shown in
Figure 58 on page 154 (left).
5 Load the method WLEMTEST. The FLD will change into the multi-excitation
mode and scan in the range of the expected maximum of 350 nm ±20 nm.
6 Open the Online Spectra plot and observe the maximum as shown in
Figure 58 on page 154 (right).
Agilent 1260 FLD User Manual
159
8
Test Functions
Wavelength Calibration Procedure
Wavelength Calibration Procedure
When
Tools required
If application requires, or see Table 26 on page 153.
Description
Laboratory balance
Parts required
p/n
Description
5063-6597
Calibration Sample, Glycogen
9301-1446
Syringe
9301-0407
Needle
5061-3364
Filter regen Cellulose 30/45 luer 100/pk
0100-1516
Fitting male PEEK, 2/pk
1 Preparation of the Glycogen Calibration Sample.
a To prepare 10 ml of the calibration solution you have to use 10 mg of the
Glycogen sample (a tolerance of ±20% is not critical).
b Fill the prepared amount into a suitable bottle/vial.
c Fill 10 ml of distilled water into the vial and shake.
d Wait 5 minutes and shake again. After 10 minutes the solution is ready.
2 Preparation of the Flow Cell.
a Flush the flow cell with water.
b Remove the inlet capillary from the flow cell.
c Take the syringe and fix the needle to the syringe adapter.
d Suck about 1.0 ml of the calibration sample into the syringe.
e Keep the syringe in a horizontal position.
f Remove the needle.
160
Agilent 1260 FLD User Manual
Test Functions
Wavelength Calibration Procedure
8
g Add the filter to the syringe and fit the needle to filter.
HVbeaZ[^aiZg
Figure 63
Syringe with Sample Filter
h Lift the needle tip and carefully eject approximately 0.5 ml to remove air
out of the syringe and to flush the needle.
i Add the PEEK fitting to the needle tip and fix both at the flow cell inlet.
NOTE
Do not inject the calibration sample without the sample filter.
j Slowly inject about 0.2 ml and wait for about 10 seconds to inject another
0.1 ml. This will assure that the cell is filled properly.
3 Wavelength Calibration.
a From the user interface start the FLD wavelength calibration (see
Figure 66 on page 163).
• Agilent LabAdvisor: Calibrations
• Agilent ChemStation: Diagnosis > Maintenance > FLD Calibration
• Instant Pilot (G4208A): Maintenance > FLD > Calibration
NOTE
If the wavelength calibration process fails, refer to “Wavelength Calibration Failed” on
page 134.
Agilent 1260 FLD User Manual
161
8
Test Functions
Wavelength Calibration Procedure
b If a deviation is displayed, press Yes (LabAdvisor) to adjust to new values
or Adjust and OK (ChemStation, see next page). The history table will be
updated.
Figure 64
162
Wavelength Calibration (Agilent LabAdvisor)
Agilent 1260 FLD User Manual
Test Functions
Wavelength Calibration Procedure
Figure 65
Calibration History (Agilent LabAdvisor)
Figure 66
Wavelength Calibration (Agilent ChemStation)
Agilent 1260 FLD User Manual
8
163
8
Test Functions
Wavelength Calibration Procedure
NOTE
To look at the history table (ChemStation) start a wavelength calibration and abort
immediately. No changes are made to the calibration at this time.
NOTE
Rinse the flow cell with pure water at a minimum of 1.5 ml/min to get rid of the Glycogen
from the cell and the capillaries. When organic solvent is sequentially applied (without
rinsing), a blockage of capillaries may occur.
4 Verification using “Wavelength Accuracy Test” on page 154.
a Refit the capillary to the flow cell.
b Follow the procedure “Wavelength Accuracy Test” on page 154.
164
Agilent 1260 FLD User Manual
Agilent 1260 FLD User Manual
9
Maintenance
Introduction to Maintenance
Warnings and Cautions
167
Overview of Maintenance
Cleaning the Module
169
170
Exchanging a Flow Cell
171
How to use the Cuvette
175
Flow Cell Flushing
Correcting Leaks
166
176
177
Replacing Leak Handling System Parts
Replacing the Interface Board
Replacing Module Firmware
Tests and Calibrations
178
179
180
181
This chapter provides general information on maintenance of the detector.
Agilent Technologies
165
9
Maintenance
Introduction to Maintenance
Introduction to Maintenance
The module is designed for easy maintenance. Maintenance can be done from
the front with module in place in the system stack.
NOTE
There are no serviceable parts inside.
Do not open the module.
166
Agilent 1260 FLD User Manual
9
Maintenance
Warnings and Cautions
Warnings and Cautions
WA R N I N G
Toxic, flammable and hazardous solvents, samples and reagents
The handling of solvents, samples and reagents can hold health and safety risks.
➔ When working with these substances observe appropriate safety procedures (for
example by wearing goggles, safety gloves and protective clothing) as described in
the material handling and safety data sheet supplied by the vendor, and follow good
laboratory practice.
➔ The volume of substances should be reduced to the minimum required for the
analysis.
➔ Do not operate the instrument in an explosive atmosphere.
WA R N I N G
Eye damage by detector light
Eye damage may result from directly viewing the UV-light produced by the lamp of
the optical system used in this product.
➔ Always turn the lamp of the optical system off before removing it.
WA R N I N G
Electrical shock
Repair work at the module can lead to personal injuries, e.g. shock hazard, when the
cover is opened.
➔ Do not remove the cover of the module.
➔ Only certified persons are authorized to carry out repairs inside the module.
Agilent 1260 FLD User Manual
167
9
Maintenance
Warnings and Cautions
WA R N I N G
Personal injury or damage to the product
Agilent is not responsible for any damages caused, in whole or in part, by improper
use of the products, unauthorized alterations, adjustments or modifications to the
products, failure to comply with procedures in Agilent product user guides, or use of
the products in violation of applicable laws, rules or regulations.
➔ Use your Agilent products only in the manner described in the Agilent product user
guides.
CAUTION
Safety standards for external equipment
➔ If you connect external equipment to the instrument, make sure that you only use
accessory units tested and approved according to the safety standards appropriate
for the type of external equipment.
168
Agilent 1260 FLD User Manual
9
Maintenance
Overview of Maintenance
Overview of Maintenance
The following pages describe maintenance (simple repairs) of the detector that
can be carried out without opening the main cover.
Table 28
Simple Repairs
Procedure
Typical Frequency
Notes
Flow cell exchange
If application requires a different flow cell type or if
defective.
Complete Assembly
A wavelength calibration check should
be performed after replacement.
If the flow cell is removed and inserted,
then a quick calibration check is
performed.
If this fails, you must do a wavelength
recalibration, see “Wavelength
Verification and Calibration” on
page 151.
Flow cell flushing
If flow cell is contaminated.
Leak sensor drying
If leak has occurred.
Check for leaks.
Leak handling System
replacement
If broken or corroded.
Check for leaks.
Agilent 1260 FLD User Manual
169
9
Maintenance
Cleaning the Module
Cleaning the Module
To keep the module case clean, use a soft cloth slightly dampened with water,
or a solution of water and mild detergent.
WA R N I N G
Liquid dripping into the electronic compartment of your module can cause shock
hazard and damage the module
➔ Do not use an excessively damp cloth during cleaning.
➔ Drain all solvent lines before opening any connections in the flow path.
170
Agilent 1260 FLD User Manual
Maintenance
Exchanging a Flow Cell
9
Exchanging a Flow Cell
For bio-inert modules use bio-inert parts only!
When
If an application needs a different type of flow cell or the flow cell is defective (leaky).
Tools required
Description
Wrench, 1/4 inch
for capillary connections
Parts required
Preparations
CAUTION
#
p/n
Description
1
G1321-60005
Flow cell, 8 µL, 20 bar (pH 1 – 9.5 )
1
G1321-60015
Flow cell, 4 µL, 20 bar (pH 1 – 9.5 )
1
G5615-60005
Bio-inert flow cell, 8 µL, 20 bar (pH 1–12) includes Capillary Kit Flow
Cells BIO (p/n G5615-68755)
1
G1321-60007
FLD Cuvette Kit, 8 µL, 20 bar
Turn off the flow.
Sample degradation and contamination of the instrument
Metal parts in the flow path can interact with the bio-molecules in the sample leading
to sample degradation and contamination.
➔ For bio-inert applications, always use dedicated bio-inert parts, which can be
identified by the bio-inert symbol or other markers described in this manual.
➔ Do not mix bio-inert and non-inert modules or parts in a bio-inert system.
NOTE
DO NOT install the inlet capillary to the outlet connection of the flow cell. This will result in
poor performance.
NOTE
In case the flow cell is not used for some time (stored), then flush the flow cell with
iso-propanol and close the cell with Plug-Screw (0100-1259).
Agilent 1260 FLD User Manual
171
9
Maintenance
Exchanging a Flow Cell
1 Press the release buttons and remove the front cover for
2 Disconnect the capillaries from the flow cell.
access to the flow cell area.
172
Agilent 1260 FLD User Manual
9
Maintenance
Exchanging a Flow Cell
3 Unscrew the thumb screws and pull the flow cell out of
the compartment.
NOTE
4 Insert the flow cell and tighten the thumb screws.
Reconnect the capillaries to the flow cell. DO NOT install
the inlet capillary to the outlet connection of the flow
cell. This will result in poor performance or damage.
NOTE
The label attached to the flow cell provides
If an additional detector is added to the system, the
information on part number, cell volume and maximum fluorescence detector should be the last detector in
pressure. The cell type will be automatically detected. the flow path except for evaporative detectors, like
LC-MSD. Otherwise the back pressure generated by
There are no parts that can be replaced on the flow
the other detector may overload the flow cell and will
cell. If defective (leaky) the flow cell has to be replaced
lead to a defective cell (maximum pressure is 20 bar
completely.
(2 MPa)).
Always use the outlet capillary set supplied with the
accessory kit.
NOTE
To check for leaks, establish a flow and observe the
flow cell (outside of the cell compartment) and all
capillary connections.
Agilent 1260 FLD User Manual
173
9
Maintenance
Exchanging a Flow Cell
5 Replace the front cover.
NOTE
Perform a wavelength verification to check the correct
positioning of the flow cell, as described in chapter
“Wavelength Verification and Calibration” on
page 151.
174
Agilent 1260 FLD User Manual
9
Maintenance
How to use the Cuvette
How to use the Cuvette
The cuvette is used for off-line measurements (no flow system required) and is
basically a standard flow cell with a few changes:
• wide bore capillary connections for easier injections with a syringe
• identification lever for cell auto-recognition system.
1 Install the cuvette instead of the standard flow cell.
2 Connect the waste tubing to the outlet of the cuvette.
3 Use the syringe (see “Cuvette Kit” on page 185) to inject the compound.
4 Setup the parameters for the Fluorescence Scan (under Special Setpoints).
5 Select “Take Fluorescence Scan” on the user-interface to start the off-line
measurement.
Agilent 1260 FLD User Manual
175
9
Maintenance
Flow Cell Flushing
Flow Cell Flushing
When
If flow cell is contaminated
Tools required
Description
Glass syringe
Adapter
Parts required
WA R N I N G
#
Description
1
Bidistilled water, nitric acid (65 %), tubings to waste
Dangerous concentration of nitric acid
The nitric acid flushing procedure is not an infallible remedy for a dirty cell. It is to
be used as a last attempt to salvage the cell before cell replacement. Note that the
cell is a consumable item.
➔ Give proper attention to safety.
NOTE
Aqueous solvents in the flow cell can built up algae. Algae do fluoresce. Therefore do not
leave aqueous solvents in the flow cell for longer periods. Add a small percentage of
organic solvents (e.g. Acetonitrile or Methanol ~5 %).
1 Flush with bidistilled water.
2 Flush with nitric acid (65 %) using a glass syringe.
3 Leave this solution in the cell for about one hour.
4 Flush with bidistilled water.
NOTE
176
Do not exceed the pressure limit of 20 bar (0.2 MPa).
Agilent 1260 FLD User Manual
Maintenance
Correcting Leaks
9
Correcting Leaks
When
Tools required
If a leakage has occurred in the flow cell area or at the capillary connections
Description
Tissue
Wrench, 1/4 inch
for capillary connections
1 Remove the front cover.
2 Use tissue to dry the leak sensor area and the leak pan.
3 Observe the capillary connections and the flow cell area for leaks and
correct, if required.
4 Replace the front cover.
Figure 67
Agilent 1260 FLD User Manual
Observing for Leaks
177
9
Maintenance
Replacing Leak Handling System Parts
Replacing Leak Handling System Parts
When
Parts required
If the parts are corroded or broken
#
p/n
Description
1
5041-8389
Leak funnel
1
5061-3356
Leak funnel holder
1
5042-9974
Leak tubing (1.5 m, 120 mm required)
1 Remove the front cover.
2 Pull the leak funnel out of the leak funnel holder.
3 Pull out the leak funnel with the tubing.
4 Insert the leak funnel with the tubing in its position.
5 Insert the leak funnel into the leak funnel holder.
6 Replace the front cover.
Leak funnel
Leak funnel holder
Leak tubing
Leak sensor
Figure 68
178
Replacing Leak Handling System Parts
Agilent 1260 FLD User Manual
9
Maintenance
Replacing the Interface Board
Replacing the Interface Board
When
Parts required
OR
For all repairs inside the detector or for installation of the board
#
p/n
Description
1
G1351-68701
Interface board (BCD) with external contacts and BCD outputs
1
G1369B or
G1369-60002
Interface board (LAN)
1
G1369C or
G1369-60012
Interface board (LAN)
1 To replace the interface board unscrew the two screws, remove the board,
slide in the new interface board and fix it with the board’s screws.
>ciZg[VXZWdVgY
Figure 69
Agilent 1260 FLD User Manual
Location of the Interface Board
179
9
Maintenance
Replacing Module Firmware
Replacing Module Firmware
When
The installation of newer firmware might be necessary
• if a newer version solves problems of older versions or
• to keep all systems on the same (validated) revision.
The installation of older firmware might be necessary
• to keep all systems on the same (validated) revision or
• if a new module with newer firmware is added to a system or
• if third party control software requires a special version.
Tools required
Description
LAN/RS-232 Firmware Update Tool
OR
Agilent Lab Advisor software
OR
Instant Pilot G4208A
(only if supported by module)
Parts required
Preparations
#
Description
1
Firmware, tools and documentation from Agilent web site
Read update documentation provided with the Firmware Update Tool.
To upgrade/downgrade the module’s firmware carry out the following
steps:
1 Download the required module firmware, the latest LAN/RS-232 FW
Update Tool and the documentation from the Agilent web.
• http://www.chem.agilent.com/_layouts/agilent/downloadFirmware.aspx?
whid=69761
2 For loading the firmware into the module follow the instructions in the
documentation.
Module Specific Information
There is no specific information for this module.
180
Agilent 1260 FLD User Manual
Maintenance
Tests and Calibrations
9
Tests and Calibrations
The following tests are required after maintenance of lamps and flow cells:
• “Lamp Intensity Test” on page 140.
• “Wavelength Verification and Calibration” on page 151
Agilent 1260 FLD User Manual
181
9
182
Maintenance
Tests and Calibrations
Agilent 1260 FLD User Manual
Agilent 1260 FLD User Manual
10
Parts for Maintenance
Overview of Maintenance Parts
Cuvette Kit
Accessory Kit
184
185
186
This chapter provides information on parts for maintenance.
Agilent Technologies
183
10 Parts for Maintenance
Overview of Maintenance Parts
Overview of Maintenance Parts
p/n
Description
G1321-60005
Flow cell, 8 µL, 20 bar (pH 1 – 9.5 )
OR G1321-60015
Flow cell, 4 µL, 20 bar (pH 1 – 9.5 ) requires a 0.12 mm i.d. capillary (e.g.
p/n G1316-87318, 300 mm long), part of Capillary kit for 0.12 mm id (p/n
G1316-68716)
OR G5615-60005
Bio-inert flow cell, 8 µL, 20 bar (pH 1–12) includes Capillary Kit Flow Cells
BIO (p/n G5615-68755)
G5615-68755
Capillary Kit Flow Cells BIO includes Peek Capillary i.d. 0.18 mm, 1.5 m lg
and PEEK Fittings 10/PK (p/n 5063-6591)
G1321-60007
FLD Cuvette Kit, 8 µL, 20 bar
9301-0407
Needle
9301-1446
Syringe
5067-4691
Front Panel DAD/VWD/FLD (1260/1290)
5041-8388
Leak funnel
5041-8389
Leak funnel
5041-8387
Tube clip
5062-2463
Corrugated tubing, PP, 6.5 mm id, 5 m
5062-2462
PTFE Tubing flexible i.d. 0.8 mm, o.d. 1.6 mm, 2 m, re-order 5 m (flow cell
to waste)
5181-1516
CAN cable, Agilent module to module, 0.5 m
5181-1519
CAN cable, Agilent module to module, 1 m
G1369B or
G1369-60002
Interface board (LAN)
5023-0203
Cross-over network cable, shielded, 3 m (for point to point connection)
5023-0202
Twisted pair network cable, shielded, 7 m (for point to point connection)
01046-60105
Agilent module to general purpose (Analog)
G1351-68701
Interface board (BCD) with external contacts and BCD outputs
Parts for wavelength calibration, see “Standard Accessory Kit” on page 186.
184
Agilent 1260 FLD User Manual
Parts for Maintenance
Cuvette Kit
10
Cuvette Kit
p/n
Description
G1321-60007
FLD Cuvette Kit, 8 µL, 20 bar includes:
5062-2462
PTFE Tubing flexible i.d. 0.8 mm, o.d. 1.6 mm, 2 m, re-order 5 m
(flow cell to waste)
79814-22406
SST Fitting
0100-0043
SST front ferrule
0100-0044
SST back ferrule
0100-1516
Fitting male PEEK, 2/pk
9301-0407
Needle
9301-1446
Syringe
Agilent 1260 FLD User Manual
185
10 Parts for Maintenance
Accessory Kit
Accessory Kit
Standard Accessory Kit
Accessory kit (G1321-68755) contains some accessories and tools needed for
the installation and repair/calibration of the detector.
Item
p/n
Description
1
5062-2462
PTFE Tubing flexible i.d. 0.8 mm, o.d. 1.6 mm, 2 m, re-order 5 m (flow
cell to waste)
2
0100-1516
Fitting male PEEK, 2/pk
3
G1315-87311
Capillary column – detector 380 mm lg, 0.17 i.d., (includes SST ferrule
front, SST ferrule back and SST fitting).
4
0100-0043
SST front ferrule
5
0100-0044
SST back ferrule
6
79814-22406
SST Fitting
'
&
Figure 70
186
Waste Tubing Parts
Agilent 1260 FLD User Manual
Parts for Maintenance
Accessory Kit
4
5
6
3
Figure 71
10
This end is
pre-installed
Inlet Capillary (Column-Detector) Parts
Capillary Kit Flow Cells BIO
Capillary Kit Flow Cells BIO includes Peek Capillary i.d. (G5615-68755)
includes:
p/n
Description
0890-1763
Peek Capillary i.d. 0.18 mm, 1.5 m lg
5063-6591
PEEK Fittings 10/PK
Agilent 1260 FLD User Manual
187
10 Parts for Maintenance
Accessory Kit
188
Agilent 1260 FLD User Manual
Agilent 1260 FLD User Manual
11
Identifying Cables
Cable Overview
190
Analog Cables
192
Remote Cables
194
BCD Cables
197
CAN/LAN Cables
199
External Contact Cable
Agilent Module to PC
200
201
This chapter provides information on cables used with the 1290 series of HPLC
modules.
Agilent Technologies
189
11 Identifying Cables
Cable Overview
Cable Overview
NOTE
Never use cables other than the ones supplied by Agilent Technologies to ensure proper
functionality and compliance with safety or EMC regulations.
Analog cables
p/n
Description
35900-60750
Agilent module to 3394/6 integrators
35900-60750
Agilent 35900A A/D converter
01046-60105
Analog cable (BNC to general purpose, spade lugs)
Remote cables
p/n
Description
03394-60600
Agilent module to 3396A Series I integrators
3396 Series II / 3395A integrator, see details in section “Remote
Cables” on page 194
03396-61010
Agilent module to 3396 Series III / 3395B integrators
5061-3378
Remote Cable
01046-60201
Agilent module to general purpose
BCD cables
190
p/n
Description
03396-60560
Agilent module to 3396 integrators
G1351-81600
Agilent module to general purpose
Agilent 1260 FLD User Manual
11
Identifying Cables
Cable Overview
CAN cables
p/n
Description
5181-1516
CAN cable, Agilent module to module, 0.5 m
5181-1519
CAN cable, Agilent module to module, 1 m
LAN cables
p/n
Description
5023-0203
Cross-over network cable, shielded, 3 m (for point to point connection)
5023-0202
Twisted pair network cable, shielded, 7 m (for point to point
connection)
RS-232 cables
p/n
Description
G1530-60600
RS-232 cable, 2 m
RS232-61601
RS-232 cable, 2.5 m
Instrument to PC, 9-to-9 pin (female). This cable has special pin-out,
and is not compatible with connecting printers and plotters. It's also
called "Null Modem Cable" with full handshaking where the wiring is
made between pins 1-1, 2-3, 3-2, 4-6, 5-5, 6-4, 7-8, 8-7, 9-9.
5181-1561
RS-232 cable, 8 m
Agilent 1260 FLD User Manual
191
11 Identifying Cables
Analog Cables
Analog Cables
One end of these cables provides a BNC connector to be connected to Agilent
modules. The other end depends on the instrument to which connection is
being made.
Agilent Module to 3394/6 Integrators
p/n 35900-60750
Pin 3394/6
Pin Agilent
module
1
192
Signal Name
Not connected
2
Shield
Analog -
3
Center
Analog +
Agilent 1260 FLD User Manual
Identifying Cables
Analog Cables
11
Agilent Module to BNC Connector
p/n 8120-1840
Pin BNC
Pin Agilent
module
Signal Name
Shield
Shield
Analog -
Center
Center
Analog +
Pin Agilent
module
Signal Name
Agilent Module to General Purpose
p/n 01046-60105
Pin
1
Agilent 1260 FLD User Manual
Not connected
2
Black
Analog -
3
Red
Analog +
193
11 Identifying Cables
Remote Cables
Remote Cables
One end of these cables provides a Agilent Technologies APG (Analytical
Products Group) remote connector to be connected to Agilent modules. The
other end depends on the instrument to be connected to.
Agilent Module to 3396A Integrators
p/n 03394-60600
Pin 3396A
Pin Agilent
module
Signal Name
9
1 - White
Digital ground
NC
2 - Brown
Prepare run
Low
3
3 - Gray
Start
Low
NC
4 - Blue
Shut down
Low
NC
5 - Pink
Not
connected
NC
6 - Yellow
Power on
High
5,14
7 - Red
Ready
High
1
8 - Green
Stop
Low
NC
9 - Black
Start request
Low
13, 15
Active
(TTL)
Not
connected
Agilent Module to 3396 Series II / 3395A Integrators
Use the cable Agilent module to 3396A Series I integrators (03394-60600) and
cut pin #5 on the integrator side. Otherwise the integrator prints START; not
ready.
194
Agilent 1260 FLD User Manual
Identifying Cables
Remote Cables
11
Agilent Module to 3396 Series III / 3395B Integrators
p/n 03396-61010
Pin 33XX
Pin Agilent
module
Signal Name
9
1 - White
Digital ground
NC
2 - Brown
Prepare run
Low
3
3 - Gray
Start
Low
NC
4 - Blue
Shut down
Low
NC
5 - Pink
Not connected
NC
6 - Yellow
Power on
High
14
7 - Red
Ready
High
4
8 - Green
Stop
Low
NC
9 - Black
Start request
Low
13, 15
Active
(TTL)
Not connected
Agilent Module to Agilent 35900 A/D Converters
p/n 5061-3378
Agilent 1260 FLD User Manual
Pin 35900 A/D Pin Agilent
module
Signal Name
Active
(TTL)
1 - White
1 - White
Digital ground
2 - Brown
2 - Brown
Prepare run
Low
3 - Gray
3 - Gray
Start
Low
4 - Blue
4 - Blue
Shut down
Low
5 - Pink
5 - Pink
Not connected
6 - Yellow
6 - Yellow
Power on
High
7 - Red
7 - Red
Ready
High
8 - Green
8 - Green
Stop
Low
9 - Black
9 - Black
Start request
Low
195
11 Identifying Cables
Remote Cables
Agilent Module to General Purpose
p/n 01046-60201
196
Wire Color
Pin Agilent
module
Signal Name
Active
(TTL)
White
1
Digital ground
Brown
2
Prepare run
Low
Gray
3
Start
Low
Blue
4
Shut down
Low
Pink
5
Not
connected
Yellow
6
Power on
High
Red
7
Ready
High
Green
8
Stop
Low
Black
9
Start request
Low
Agilent 1260 FLD User Manual
Identifying Cables
BCD Cables
11
BCD Cables
One end of these cables provides a 15-pin BCD connector to be connected to
the Agilent modules. The other end depends on the instrument to be
connected to
Agilent Module to General Purpose
p/n G1351-81600
Agilent 1260 FLD User Manual
Wire Color
Pin Agilent
module
Signal Name
BCD Digit
Green
1
BCD 5
20
Violet
2
BCD 7
80
Blue
3
BCD 6
40
Yellow
4
BCD 4
10
Black
5
BCD 0
1
Orange
6
BCD 3
8
Red
7
BCD 2
4
Brown
8
BCD 1
2
Gray
9
Digital ground
Gray
Gray/pink
10
BCD 11
800
Red/blue
11
BCD 10
400
White/green
12
BCD 9
200
Brown/green
13
BCD 8
100
not connected
14
not connected
15
+5V
Low
197
11 Identifying Cables
BCD Cables
Agilent Module to 3396 Integrators
p/n 03396-60560
198
Pin 3396
Pin Agilent
module
Signal Name
BCD Digit
1
1
BCD 5
20
2
2
BCD 7
80
3
3
BCD 6
40
4
4
BCD 4
10
5
5
BCD0
1
6
6
BCD 3
8
7
7
BCD 2
4
8
8
BCD 1
2
9
9
Digital ground
NC
15
+5V
Low
Agilent 1260 FLD User Manual
Identifying Cables
CAN/LAN Cables
11
CAN/LAN Cables
Both ends of this cable provide a modular plug to be connected to
Agilent modules CAN or LAN connectors.
CAN Cables
p/n
Description
5181-1516
CAN cable, Agilent module to module, 0.5 m
5181-1519
CAN cable, Agilent module to module, 1 m
LAN Cables
p/n
Description
5023-0203
Cross-over network cable, shielded, 3 m (for point to point connection)
5023-0202
Twisted pair network cable, shielded, 7 m (for point to point
connection)
Agilent 1260 FLD User Manual
199
11 Identifying Cables
External Contact Cable
External Contact Cable
5
10
15
1
6
11
One end of this cable provides a 15-pin plug to be connected to
Agilent modules interface board. The other end is for general purpose.
Agilent Module Interface Board to general purposes
p/n G1103-61611
200
Color
Pin Agilent
module
Signal Name
White
1
EXT 1
Brown
2
EXT 1
Green
3
EXT 2
Yellow
4
EXT 2
Grey
5
EXT 3
Pink
6
EXT 3
Blue
7
EXT 4
Red
8
EXT 4
Black
9
Not connected
Violet
10
Not connected
Grey/pink
11
Not connected
Red/blue
12
Not connected
White/green
13
Not connected
Brown/green
14
Not connected
White/yellow
15
Not connected
Agilent 1260 FLD User Manual
11
Identifying Cables
Agilent Module to PC
Agilent Module to PC
p/n
Description
G1530-60600
RS-232 cable, 2 m
RS232-61601
RS-232 cable, 2.5 m
Instrument to PC, 9-to-9 pin (female). This cable has special pin-out,
and is not compatible with connecting printers and plotters. It's also
called "Null Modem Cable" with full handshaking where the wiring is
made between pins 1-1, 2-3, 3-2, 4-6, 5-5, 6-4, 7-8, 8-7, 9-9.
5181-1561
RS-232 cable, 8 m
Agilent 1260 FLD User Manual
201
11 Identifying Cables
Agilent Module to PC
202
Agilent 1260 FLD User Manual
Agilent 1260 FLD User Manual
12
Hardware Information
Firmware Description
204
Optional Interface Boards
207
Electrical Connections 211
Rear view of the module 212
Serial Number Information 213
Interfaces 214
Overview Interfaces
217
Setting the 8-bit Configuration Switch (without On-board LAN)
Communication Settings for RS-232C 222
Special Settings 224
Early Maintenance Feedback
Instrument Layout
221
225
226
This chapter describes the detector in more detail on hardware and electronics.
Agilent Technologies
203
12 Hardware Information
Firmware Description
Firmware Description
The firmware of the instrument consists of two independent sections:
• a non-instrument specific section, called resident system
• an instrument specific section, called main system
Resident System
This resident section of the firmware is identical for all Agilent
1100/1200/1220/1260/1290 series modules. Its properties are:
• the complete communication capabilities (CAN, LAN and RS-232C)
• memory management
• ability to update the firmware of the 'main system'
Main System
Its properties are:
• the complete communication capabilities (CAN, LAN and RS-232C)
• memory management
• ability to update the firmware of the 'resident system'
In addition the main system comprises the instrument functions that are
divided into common functions like
• run synchronization through APG remote,
• error handling,
• diagnostic functions,
• or module specific functions like
• internal events such as lamp control, filter movements,
• raw data collection and conversion to absorbance.
204
Agilent 1260 FLD User Manual
Hardware Information
Firmware Description
12
Firmware Updates
Firmware updates can be done using your user interface:
• PC and Firmware Update Tool with local files on the hard disk
• Instant Pilot (G4208A) with files from a USB Flash Disk
• Agilent Lab Advisor software B.01.03 and above
The file naming conventions are:
PPPP_RVVV_XXX.dlb, where
PPPP is the product number, for example, 1315AB for the G1315A/B DAD,
R the firmware revision, for example, A for G1315B or B for the G1315C DAD,
VVV is the revision number, for example 102 is revision 1.02,
XXX is the build number of the firmware.
For instructions on firmware updates refer to section Replacing Firmware in
chapter "Maintenance" or use the documentation provided with the
Firmware Update Tools.
NOTE
Update of main system can be done in the resident system only. Update of the resident
system can be done in the main system only.
Main and resident firmware must be from the same set.
BV^c;LjeYViZ
BV^cHnhiZb
GZh^YZciHnhiZb
GZh^YZci;LJeYViZ
Figure 72
Agilent 1260 FLD User Manual
Firmware Update Mechanism
205
12 Hardware Information
Firmware Description
NOTE
Some modules are limited in downgrading due to their main board version or their initial
firmware revision. For example, a G1315C DAD SL cannot be downgraded below firmware
revision B.01.02 or to a A.xx.xx.
Some modules can be re-branded (e.g. G1314C to G1314B) to allow operation in specific
control software environments. In this case the feature set of the target type are use and
the feature set of the original are lost. After re-branding (e.g. from G1314B to G1314C), the
original feature set is available again.
All these specific informations are described in the documentation provided with the
firmware update tools.
The firmware update tools, firmware and documentation are available from
the Agilent web.
• http://www.chem.agilent.com/_layouts/agilent/downloadFirmware.aspx?whid=69761
206
Agilent 1260 FLD User Manual
12
Hardware Information
Optional Interface Boards
Optional Interface Boards
BCD / External Contact Board
The Agilent 1200 Infinity Series modules have one optional board slot that
allows to add an interface board to the modules. Some modules do not have
this interface slot. Refer to “Interfaces” on page 214 for details.
Optional Interface Boards
p/n
Description
G1351-68701
Interface board (BCD) with external contacts and BCD outputs
2110-0004
Fuse for BCD board, 250 mA
The BCD board provides a BCD output for the bottle number of the
Agilent 1200 Series autosampler and four external contacts. The external
contact closure contacts are relay contacts. The maximum settings are: 30 V
(AC/DC); 250 mA (fused).
G;>[^aiZg
7dVgY
^YZci^[^XVi^dc
&'
789
gZ\^hiZg
A^cZYg^kZg
'*%b6
:miZgcVa
XdciVXih
Agilent 1260 FLD User Manual
)m
789
XdccZXidg
G;>[^aiZg
EgdXZhhdg
^ciZg[VXZ
:miZgcVa
XdciVXi
XdccZXidg
207
12 Hardware Information
Optional Interface Boards
There are general purpose cables available to connect the BCD output, see
“BCD Cables” on page 197 and the external outputs, see “External Contact
Cable” on page 200 to external devices.
Table 29
208
Detailed connector layout (1200)
Pin
Signal name
BCD digit
1
BCD 5
20
2
BCD 7
80
3
BCD 6
40
4
BCD 4
10
5
BCD 0
1
6
BCD 3
8
7
BCD 2
4
8
BCD 1
2
9
Digital ground
10
BCD 11
800
11
BCD 10
400
12
BCD 9
200
13
BCD 8
100
15
+5V
Low
Agilent 1260 FLD User Manual
12
Hardware Information
Optional Interface Boards
LAN Communication Interface Board
The Agilent modules have one optional board slot that allows to add an
interface board to the modules. Some modules do not have this interface slot.
Refer to “Interfaces” on page 214 for details.
p/n
OR
Description
G1369B or
G1369-60002
Interface board (LAN)
G1369C or
G1369-60012
Interface board (LAN)
NOTE
One board is required per Agilent 1260 Infinity instrument. It is recommended to add the
LAN board to the detector with highest data rate.
NOTE
For the configuration of the G1369 LAN Communication Interface card refer to its
documentation.
Agilent 1260 FLD User Manual
209
12 Hardware Information
Optional Interface Boards
The following cards can be used with the Agilent 1260 Infinity modules.
Table 30
LAN Boards
Type
Vendor
Supported networks
Interface board (LAN) (G1369B
or G1369-60002) or
Interface board (LAN) (G1369C
or G1369-60012)
Agilent Technologies
Fast Ethernet, Ethernet/802.3,
RJ-45 (10/100Base-TX)
recommended for re-ordering
LAN Communication Interface
board (G1369A or
G1369-60001)
Agilent Technologies
Fast Ethernet, Ethernet/802.3,
RJ-45 (10/100Base-TX)
(obsolete)
J4106A1
Hewlett Packard
Ethernet/802.3, RJ-45
(10Base-T)
J4105A1
Hewlett Packard
Token Ring/802.5, DB9, RJ-45
(10Base-T)
J4100A1
Hewlett Packard
Fast Ethernet, Ethernet/802.3,
RJ-45 (10/100Base-TX) + BNC
(10Base2)
1
These cards may be no longer orderable. Minimum firmware of these Hewlett Packard JetDirect
cards is A.05.05.
Recommended LAN Cables
210
p/n
Description
5023-0203
Cross-over network cable, shielded, 3 m (for point to point connection)
5023-0202
Twisted pair network cable, shielded, 7 m (for point to point
connection)
Agilent 1260 FLD User Manual
12
Hardware Information
Electrical Connections
Electrical Connections
• The CAN bus is a serial bus with high speed data transfer. The two
connectors for the CAN bus are used for internal module data transfer and
synchronization.
• Two independent analog outputs provide signals for integrators or data
handling.
• The interface board slot is used for external contacts and BCD bottle
number output or LAN connections.
• The REMOTE connector may be used in combination with other analytical
instruments from Agilent Technologies if you want to use features such as
start, stop, common shut down, prepare, and so on.
• With the appropriate software, the RS-232C connector may be used to
control the module from a computer through a RS-232C connection. This
connector is activated and can be configured with the configuration switch.
• The power input socket accepts a line voltage of 100 – 240 VAC ± 10 % with
a line frequency of 50 or 60 Hz. Maximum power consumption varies by
module. There is no voltage selector on your module because the power
supply has wide-ranging capability. There are no externally accessible
fuses, because automatic electronic fuses are implemented in the power
supply.
NOTE
Never use cables other than the ones supplied by Agilent Technologies to ensure proper
functionality and compliance with safety or EMC regulations.
Agilent 1260 FLD User Manual
211
12 Hardware Information
Electrical Connections
Rear view of the module
Figure 73
NOTE
212
Rear View of Detector – Electrical Connections and Label
The GPIB interface has been removed with the introduction of the 1260 Infinity modules.
Agilent 1260 FLD User Manual
Hardware Information
Electrical Connections
12
Serial Number Information
Serial Number Information 1260 Infinity
The serial number information on the instrument labels provide the following
information:
CCXZZ00000
Format
CC
Country of manufacturing
• DE = Germany
• JP = Japan
• CN = China
X
Alphabetic character A-Z (used by manufacturing)
ZZ
Alpha-numeric code 0-9, A-Z, where each combination
unambiguously denotes a module (there can be more than one
code for the same module)
00000
Serial number
Serial Number Information 1200 Series and 1290 Infinity
The serial number information on the instrument labels provide the following
information:
CCYWWSSSSS
Format
CC
country of manufacturing
• DE = Germany
• JP = Japan
• CN = China
YWW
year and week of last major manufacturing change, e.g. 820
could be week 20 of 1998 or 2008
SSSSS
real serial number
Agilent 1260 FLD User Manual
213
12 Hardware Information
Interfaces
Interfaces
The Agilent 1200 Infinity Series modules provide the following interfaces:
Table 31
Agilent 1200 Infinity Series Interfaces
Module
CAN
LAN/BCD
(optional)
LAN
(on-board)
RS-232
Analog
APG
Remote
Special
G1310B Iso Pump
G1311B Quat Pump
G1311C Quat Pump VL
G1312B Bin Pump
G1312C Bin Pump VL
1376A Cap Pump
G2226A Nano Pump
G5611A Bio-inert Quat
Pump
2
Yes
No
Yes
1
Yes
G4220A/B Bin Pump
G4204A Quat Pump
2
No
Yes
Yes
No
Yes
CAN-DC- OUT for CAN
slaves
G1361A Prep Pump
2
Yes
No
Yes
No
Yes
CAN-DC- OUT for CAN
slaves
G1329B ALS
G2260A Prep ALS
2
Yes
No
Yes
No
Yes
THERMOSTAT for
G1330B
G1364B FC-PS
G1364C FC-AS
G1364D FC-μS
G1367E HiP ALS
G1377A HiP micro ALS
G2258A DL ALS
G5664A Bio-inert
FC-AS
G5667A Bio-inert
Autosampler
2
Yes
No
Yes
No
Yes
THERMOSTAT for
G1330B
CAN-DC- OUT for CAN
slaves
G4226A ALS
2
Yes
No
Yes
No
Yes
Pumps
Samplers
214
Agilent 1260 FLD User Manual
Hardware Information
Interfaces
Table 31
12
Agilent 1200 Infinity Series Interfaces
Module
CAN
LAN/BCD
(optional)
LAN
(on-board)
RS-232
Analog
APG
Remote
Special
G1314B VWD VL
G1314C VWD VL+
2
Yes
No
Yes
1
Yes
G1314E/F VWD
2
No
Yes
Yes
1
Yes
G4212A/B DAD
2
No
Yes
Yes
1
Yes
G1315C DAD VL+
G1365C MWD
G1315D DAD VL
G1365D MWD VL
2
No
Yes
Yes
2
Yes
G1321B FLD
2
Yes
No
Yes
2
Yes
G1362A RID
2
Yes
No
Yes
1
Yes
G4280A ELSD
No
No
No
Yes
Yes
Yes
EXT Contact
AUTOZERO
G1170A Valve Drive
2
No
No
No
No
No
1
G1316A/C TCC
2
No
No
Yes
No
Yes
G1322A DEG
No
No
No
No
No
Yes
G1379B DEG
No
No
No
Yes
No
Yes
G4225A DEG
No
No
No
Yes
No
Yes
G4227A Flex Cube
2
No
No
No
No
No
Detectors
Others
AUX
CAN-DC- OUT for CAN
slaves
1
G4240A CHIP CUBE
1
2
Yes
No
Yes
No
Yes
CAN-DC- OUT for CAN
slaves
THERMOSTAT for
G1330A/B (NOT USED)
Requires a HOST module with on-board LAN (e.g. G4212A or G4220A with minimum firmware B.06.40 or C.06.40) or with additional G1369C LAN Card
Agilent 1260 FLD User Manual
215
12 Hardware Information
Interfaces
NOTE
The detector (DAD/MWD/FLD/VWD/RID) is the preferred access point for control via
LAN. The inter-module communication is done via CAN.
• CAN connectors as interface to other modules
• LAN connector as interface to the control software
• RS-232C as interface to a computer
• REMOTE connector as interface to other Agilent products
• Analog output connector(s) for signal output
216
Agilent 1260 FLD User Manual
12
Hardware Information
Interfaces
Overview Interfaces
CAN
The CAN is inter-module communication interface. It is a 2-wire serial bus
system supporting high speed data communication and real-time requirement.
LAN
The modules have either an interface slot for an LAN card (e.g. Agilent
G1369B/C LAN Interface) or they have an on-board LAN interface (e.g.
detectors G1315C/D DAD and G1365C/D MWD). This interface allows the
control of the module/system via a PC with the appropriate control software.
Some modules have neither on-board LAN nor an interface slot for a LAN card
(e.g. G1170A Valve Drive or G4227A Flex Cube). These are hosted modules and
require a Host module with firmware B.06.40 or later or with additional
G1369C LAN Card.
NOTE
If an Agilent detector (DAD/MWD/FLD/VWD/RID) is in the system, the LAN should be
connected to the DAD/MWD/FLD/VWD/RID (due to higher data load). If no Agilent
detector is part of the system, the LAN interface should be installed in the pump or
autosampler.
RS-232C (Serial)
The RS-232C connector is used to control the module from a computer
through RS-232C connection, using the appropriate software. This connector
can be configured with the configuration switch module at the rear of the
module. Refer to Communication Settings for RS-232C.
NOTE
There is no configuration possible on main boards with on-board LAN. These are
pre-configured for
• 19200 baud,
• 8 data bit with no parity and
• one start bit and one stop bit are always used (not selectable).
Agilent 1260 FLD User Manual
217
12 Hardware Information
Interfaces
The RS-232C is designed as DCE (data communication equipment) with a
9-pin male SUB-D type connector. The pins are defined as:
Table 32
RS-232C Connection Table
Pin
Direction
Function
1
In
DCD
2
In
RxD
3
Out
TxD
4
Out
DTR
5
Ground
6
In
DSR
7
Out
RTS
8
In
CTS
9
In
RI
>chigjbZci
BVaZ
Figure 74
E8
;ZbVaZ
;ZbVaZ BVaZ
RS-232 Cable
Analog Signal Output
The analog signal output can be distributed to a recording device. For details
refer to the description of the module’s main board.
218
Agilent 1260 FLD User Manual
Hardware Information
Interfaces
12
APG Remote
The APG Remote connector may be used in combination with other analytical
instruments from Agilent Technologies if you want to use features as common
shut down, prepare, and so on.
Remote control allows easy connection between single instruments or systems
to ensure coordinated analysis with simple coupling requirements.
The subminiature D connector is used. The module provides one remote
connector which is inputs/outputs (wired- or technique).
To provide maximum safety within a distributed analysis system, one line is
dedicated to SHUT DOWN the system’s critical parts in case any module detects
a serious problem. To detect whether all participating modules are switched
on or properly powered, one line is defined to summarize the POWER ON state
of all connected modules. Control of analysis is maintained by signal readiness
READY for next analysis, followed by START of run and optional STOP of run
triggered on the respective lines. In addition PREPARE and START REQUEST may
be issued. The signal levels are defined as:
• standard TTL levels (0 V is logic true, + 5.0 V is false),
• fan-out is 10 ,
• input load is 2.2 kOhm against + 5.0 V, and
• output are open collector type, inputs/outputs (wired- or technique).
NOTE
All common TTL circuits operate with a 5 V power supply. A TTL signal is defined as "low"
or L when between 0 V and 0.8 V and "high" or H when between 2.0 V and 5.0 V (with
respect to the ground terminal).
Agilent 1260 FLD User Manual
219
12 Hardware Information
Interfaces
Table 33
Remote Signal Distribution
Pin
Signal
Description
1
DGND
Digital ground
2
PREPARE
(L) Request to prepare for analysis (for example, calibration, detector
lamp on). Receiver is any module performing pre-analysis activities.
3
START
(L) Request to start run / timetable. Receiver is any module
performing run-time controlled activities.
4
SHUT DOWN
(L) System has serious problem (for example, leak: stops pump).
Receiver is any module capable to reduce safety risk.
5
Not used
6
POWER ON
(H) All modules connected to system are switched on. Receiver is
any module relying on operation of others.
7
READY
(H) System is ready for next analysis. Receiver is any sequence
controller.
8
STOP
(L) Request to reach system ready state as soon as possible (for
example, stop run, abort or finish and stop injection). Receiver is any
module performing run-time controlled activities.
9
START REQUEST
(L) Request to start injection cycle (for example, by start key on any
module). Receiver is the autosampler.
Special Interfaces
There is no special interface for this module.
220
Agilent 1260 FLD User Manual
12
Hardware Information
Setting the 8-bit Configuration Switch (without On-board LAN)
Setting the 8-bit Configuration Switch (without On-board LAN)
The 8-bit configuration switch is located at the rear of the module.
This module does not have its own on-board LAN interface. It can be
controlled through the LAN interface of another module, and a CAN
connection to that module.
Figure 75
Configuration switch (settings depend on configured mode)
All modules without on-board LAN:
• default should be ALL DIPS DOWN (= best settings)
• Bootp mode for LAN and
• 19200 baud, 8 data bit / 1 stop bit with no parity for RS-232
• DIP 1 DOWN and DIP 2 UP allows special RS-232 settings
• for boot/test modes DIPS 1+2 must be UP plus required mode
NOTE
For normal operation use the default (best) settings.
Switch settings provide configuration parameters for serial communication
protocol and instrument specific initialization procedures.
NOTE
With the introduction of the Agilent 1260 Infinity, all GPIB interfaces have been removed.
The preferred communication is LAN.
Agilent 1260 FLD User Manual
221
12 Hardware Information
Setting the 8-bit Configuration Switch (without On-board LAN)
NOTE
The following tables represent the configuration switch settings for the modules without
on-board LAN only.
Table 34
NOTE
8-bit Configuration Switch (without on-board LAN)
Mode Select
1
2
RS-232C
0
1
Reserved
1
0
TEST/BOOT
1
1
3
4
5
Baudrate
6
7
Data
Bits
8
Parity
Reserved
RSVD
SYS
RSVD
RSVD
FC
The LAN settings are done on the LAN Interface Card G1369B/C. Refer to the
documentation provided with the card.
Communication Settings for RS-232C
The communication protocol used in the column compartment supports only
hardware handshake (CTS/RTR).
Switches 1 in down and 2 in up position define that the RS-232C parameters
will be changed. Once the change has been completed, the column instrument
must be powered up again in order to store the values in the non-volatile
memory.
Table 35
Communication Settings for RS-232C Communication (without on-board LAN)
Mode
Select
1
2
RS-232C
0
1
3
4
Baudrate
5
6
Data Bits
7
8
Parity
Use the following tables for selecting the setting which you want to use for
RS-232C communication. The number 0 means that the switch is down and 1
means that the switch is up.
222
Agilent 1260 FLD User Manual
12
Hardware Information
Setting the 8-bit Configuration Switch (without On-board LAN)
Table 36
Baudrate Settings (without on-board LAN)
Switches
Baud Rate
3
4
5
0
0
0
0
0
0
0
Table 37
Switches
Baud Rate
3
4
5
9600
1
0
0
9600
1
1200
1
0
1
14400
1
0
2400
1
1
0
19200
1
1
4800
1
1
1
38400
Data Bit Settings (without on-board LAN)
Switch 6
Data Word Size
0
7 Bit Communication
1
8 Bit Communication
Table 38
Parity Settings (without on-board LAN)
Switches
Parity
7
8
0
0
No Parity
0
1
Odd Parity
1
1
Even Parity
One start bit and one stop bit are always used (not selectable).
Per default, the module will turn into 19200 baud, 8 data bit with no parity.
Agilent 1260 FLD User Manual
223
12 Hardware Information
Setting the 8-bit Configuration Switch (without On-board LAN)
Special Settings
The special settings are required for specific actions (normally in a service
case).
Boot-Resident
Firmware update procedures may require this mode in case of firmware
loading errors (main firmware part).
If you use the following switch settings and power the instrument up again,
the instrument firmware stays in the resident mode. It is not operable as a
module. It only uses basic functions of the operating system for example, for
communication. In this mode the main firmware can be loaded (using update
utilities).
Table 39
Boot Resident Settings (without on-board LAN)
Mode Select
SW1
SW2
SW3
SW4
SW5
SW6
SW7
SW8
TEST/BOOT
1
1
0
0
1
0
0
0
Forced Cold Start
A forced cold start can be used to bring the module into a defined mode with
default parameter settings.
CAUTION
Loss of data
Forced cold start erases all methods and data stored in the non-volatile memory.
Exceptions are calibration settings, diagnosis and repair log books which will not be
erased.
➔ Save your methods and data before executing a forced cold start.
If you use the following switch settings and power the instrument up again, a
forced cold start has been completed.
Table 40
224
Forced Cold Start Settings (without on-board LAN)
Mode Select
SW1
SW2
SW3
SW4
SW5
SW6
SW7
SW8
TEST/BOOT
1
1
0
0
1
0
0
1
Agilent 1260 FLD User Manual
Hardware Information
Early Maintenance Feedback
12
Early Maintenance Feedback
Maintenance requires the exchange of components which are subject to wear
or stress. Ideally, the frequency at which components are exchanged should be
based on the intensity of usage of the module and the analytical conditions,
and not on a predefined time interval. The early maintenance feedback (EMF)
feature monitors the usage of specific components in the instrument, and
provides feedback when the user-selectable limits have been exceeded. The
visual feedback in the user interface provides an indication that maintenance
procedures should be scheduled.
EMF Counters
EMF counters increment with use and can be assigned a maximum limit which
provides visual feedback in the user interface when the limit is exceeded.
Some counters can be reset to zero after the required maintenance procedure.
Using the EMF Counters
The user-settable EMF limits for the EMF Counters enable the early maintenance
feedback to be adapted to specific user requirements. The useful maintenance
cycle is dependent on the requirements for use. Therefore, the definition of the
maximum limits need to be determined based on the specific operating
conditions of the instrument.
Setting the EMF Limits
The setting of the EMF limits must be optimized over one or two maintenance
cycles. Initially the default EMF limits should be set. When instrument
performance indicates maintenance is necessary, take note of the values
displayed by the EMF counters. Enter these values (or values slightly less than
the displayed values) as EMF limits, and then reset the EMF counters to zero.
The next time the EMF counters exceed the new EMF limits, the EMF flag will be
displayed, providing a reminder that maintenance needs to be scheduled.
Agilent 1260 FLD User Manual
225
12 Hardware Information
Instrument Layout
Instrument Layout
The industrial design of the module incorporates several innovative features.
It uses Agilent’s E-PAC concept for the packaging of electronics and
mechanical assemblies. This concept is based upon the use of expanded
polypropylene (EPP) layers of foam plastic spacers in which the mechanical
and electronic boards components of the module are placed. This pack is then
housed in a metal inner cabinet which is enclosed by a plastic external
cabinet. The advantages of this packaging technology are:
• virtual elimination of fixing screws, bolts or ties, reducing the number of
components and increasing the speed of assembly/disassembly,
• the plastic layers have air channels molded into them so that cooling air can
be guided exactly to the required locations,
• the plastic layers help cushion the electronic and mechanical parts from
physical shock, and
• the metal inner cabinet shields the internal electronics from
electromagnetic interference and also helps to reduce or eliminate radio
frequency emissions from the instrument itself.
226
Agilent 1260 FLD User Manual
Agilent 1260 FLD User Manual
13
Appendix
General Safety Information
228
The Waste Electrical and Electronic Equipment (WEEE) Directive
(2002/96/EC) 231
Lithium Batteries Information
Radio Interference
Sound Emission
232
233
234
UV-Radiation (UV-lamps only)
Solvent Information
235
236
Agilent Technologies on Internet
238
This chapter provides safetey and other general information.
Agilent Technologies
227
13 Appendix
General Safety Information
General Safety Information
Safety Symbols
Table 41
Safety Symbols
Symbol
Description
The apparatus is marked with this symbol when the user should refer to
the instruction manual in order to protect risk of harm to the operator and
to protect the apparatus against damage.
Indicates dangerous voltages.
Indicates a protected ground terminal.
Indicates eye damage may result from directly viewing the light produced
by the deuterium lamp used in this product.
The apparatus is marked with this symbol when hot surfaces are available
and the user should not touch it when heated up.
WA R N I N G
A WARNING
alerts you to situations that could cause physical injury or death.
➔ Do not proceed beyond a warning until you have fully understood and met the
indicated conditions.
CAUTION
A CAUTION
alerts you to situations that could cause loss of data, or damage of equipment.
➔ Do not proceed beyond a caution until you have fully understood and met the
indicated conditions.
228
Agilent 1260 FLD User Manual
13
Appendix
General Safety Information
General Safety Information
The following general safety precautions must be observed during all phases of
operation, service, and repair of this instrument. Failure to comply with these
precautions or with specific warnings elsewhere in this manual violates safety
standards of design, manufacture, and intended use of the instrument. Agilent
Technologies assumes no liability for the customer’s failure to comply with
these requirements.
WA R N I N G
Ensure the proper usage of the equipment.
The protection provided by the equipment may be impaired.
➔ The operator of this instrument is advised to use the equipment in a manner as
specified in this manual.
Safety Standards
This is a Safety Class I instrument (provided with terminal for protective
earthing) and has been manufactured and tested according to international
safety standards.
Operation
Before applying power, comply with the installation section. Additionally the
following must be observed.
Do not remove instrument covers when operating. Before the instrument is
switched on, all protective earth terminals, extension cords,
auto-transformers, and devices connected to it must be connected to a
protective earth via a ground socket. Any interruption of the protective earth
grounding will cause a potential shock hazard that could result in serious
personal injury. Whenever it is likely that the protection has been impaired,
the instrument must be made inoperative and be secured against any intended
operation.
Make sure that only fuses with the required rated current and of the specified
type (normal blow, time delay, and so on) are used for replacement. The use of
repaired fuses and the short-circuiting of fuse holders must be avoided.
Agilent 1260 FLD User Manual
229
13 Appendix
General Safety Information
Some adjustments described in the manual, are made with power supplied to
the instrument, and protective covers removed. Energy available at many
points may, if contacted, result in personal injury.
Any adjustment, maintenance, and repair of the opened instrument under
voltage should be avoided whenever possible. When inevitable, this has to be
carried out by a skilled person who is aware of the hazard involved. Do not
attempt internal service or adjustment unless another person, capable of
rendering first aid and resuscitation, is present. Do not replace components
with power cable connected.
Do not operate the instrument in the presence of flammable gases or fumes.
Operation of any electrical instrument in such an environment constitutes a
definite safety hazard.
Do not install substitute parts or make any unauthorized modification to the
instrument.
Capacitors inside the instrument may still be charged, even though the
instrument has been disconnected from its source of supply. Dangerous
voltages, capable of causing serious personal injury, are present in this
instrument. Use extreme caution when handling, testing and adjusting.
When working with solvents, observe appropriate safety procedures (for
example, goggles, safety gloves and protective clothing) as described in the
material handling and safety data sheet by the solvent vendor, especially when
toxic or hazardous solvents are used.
230
Agilent 1260 FLD User Manual
Appendix
The Waste Electrical and Electronic Equipment (WEEE) Directive (2002/96/EC)
13
The Waste Electrical and Electronic Equipment (WEEE) Directive
(2002/96/EC)
Abstract
The Waste Electrical and Electronic Equipment (WEEE) Directive
(2002/96/EC), adopted by EU Commission on 13 February 2003, is
introducing producer responsibility on all Electric and Electronic appliances
from 13 August 2005.
NOTE
This product complies with the WEEE Directive (2002/96/EC) marking requirements. The
affixed label indicates that you must not discard this electrical/electronic product in
domestic household waste.
Product Category: With reference to the equipment types in the WEEE Directive Annex I,
this product is classed as a “Monitoring and Control instrumentation” product.
Do not dispose off in domestic household waste
To return unwanted products, contact your local Agilent office, or see www.agilent.com for
more information.
Agilent 1260 FLD User Manual
231
13 Appendix
Lithium Batteries Information
Lithium Batteries Information
WA R N I N G
Lithium batteries may not be disposed-off into the domestic waste. Transportation of
discharged Lithium batteries through carriers regulated by IATA/ICAO, ADR, RID,
IMDG is not allowed.
Danger of explosion if battery is incorrectly replaced.
➔ Discharged Lithium batteries shall be disposed off locally according to national
waste disposal regulations for batteries.
➔ Replace only with the same or equivalent type recommended by the equipment
manufacturer.
WA R N I N G
Lithiumbatteri - Eksplosionsfare ved fejlagtig håndtering.
Udskiftning må kun ske med batteri af samme fabrikat og type.
➔ Lever det brugte batteri tilbage til leverandøren.
WA R N I N G
Lithiumbatteri - Eksplosionsfare.
Ved udskiftning benyttes kun batteri som anbefalt av apparatfabrikanten.
➔ Brukt batteri returneres appararleverandoren.
NOTE
232
Bij dit apparaat zijn batterijen geleverd. Wanneer deze leeg zijn, moet u ze niet weggooien
maar inleveren als KCA.
Agilent 1260 FLD User Manual
Appendix
Radio Interference
13
Radio Interference
Cables supplied by Agilent Technologies are screened to provide optimized
protection against radio interference. All cables are in compliance with safety
or EMC regulations.
Test and Measurement
If test and measurement equipment is operated with unscreened cables, or
used for measurements on open set-ups, the user has to assure that under
operating conditions the radio interference limits are still met within the
premises.
Agilent 1260 FLD User Manual
233
13 Appendix
Sound Emission
Sound Emission
Manufacturer’s Declaration
This statement is provided to comply with the requirements of the German
Sound Emission Directive of 18 January 1991.
This product has a sound pressure emission (at the operator position) < 70 dB.
• Sound Pressure Lp < 70 dB (A)
• At Operator Position
• Normal Operation
• According to ISO 7779:1988/EN 27779/1991 (Type Test)
234
Agilent 1260 FLD User Manual
Appendix
UV-Radiation (UV-lamps only)
13
UV-Radiation (UV-lamps only)
Emissions of ultraviolet radiation (200-315 nm) from this product is limited
such that radiant exposure incident upon the unprotected skin or eye of
operator or service personnel is limited to the following TLVs (Threshold Limit
Values) according to the American Conference of Governmental Industrial
Hygienists:
Table 42
UV-Radiation Limits
Exposure/day
Effective Irradiance
8 hours
0.1 µW/cm2
10 minutes
5.0 µW/cm2
Typically the radiation values are much smaller than these limits:
Table 43
UV-Radiation Typical Values
Position
Effective Irradiance
Lamp installed, 50-cm distance
average 0.016 µW/cm2
Lamp installed, 50-cm distance
maximum 0.14 µW/cm2
Agilent 1260 FLD User Manual
235
13 Appendix
Solvent Information
Solvent Information
Flow Cell
To protect optimal functionality of your flow-cell:
• Avoid the use of alkaline solutions (pH > 9.5) which can attack quartz and
thus impair the optical properties of the flow cell.
• If the flow cell is transported while temperatures are below 5 °C, it must be
assured that the cell is filled with alcohol.
• Aqueous solvents in the flow cell can built up algae. Therefore do not leave
aqueous solvents sitting in the flow cell. Add a small % of organic solvents
(e.g. acetonitrile or methanol ~5 %).
Use of Solvents
Observe the following recommendations on the use of solvents.
• Brown glass ware can avoid growth of algae.
• Small particles can permanently block capillaries and valves. Therefore
always filter solvents through 0.4 μm filters.
• Avoid the use of the following steel-corrosive solvents:
• Solutions of alkali halides and their respective acids (for example,
lithium iodide, potassium chloride, and so on),
• High concentrations of inorganic acids like sulfuric acid and nitric acid,
especially at higher temperatures (if your chromatography method
allows, replace by phosphoric acid or phosphate buffer which are less
corrosive against stainless steel),
• Halogenated solvents or mixtures which form radicals and/or acids, for
example:
2CHCl3 + O2→ 2COCl2 + 2HCl
This reaction, in which stainless steel probably acts as a catalyst, occurs
quickly with dried chloroform if the drying process removes the
stabilizing alcohol,
236
Agilent 1260 FLD User Manual
Appendix
Solvent Information
13
• Chromatographic grade ethers, which can contain peroxides (for
example, THF, dioxane, di-isopropylether) such ethers should be filtered
through dry aluminium oxide which adsorbs the peroxides,
• Solvents containing strong complexing agents (e.g. EDTA),
• Mixtures of carbon tetrachloride with 2-propanol or THF.
Agilent 1260 FLD User Manual
237
13 Appendix
Agilent Technologies on Internet
Agilent Technologies on Internet
For the latest information on products and services visit our worldwide web
site on the Internet at:
http://www.agilent.com
238
Agilent 1260 FLD User Manual
Index
Index
8
8-bit configuration switch
without On-Board LAN
boards
LAN card
221
A
accessory kit parts 186
accuracy of wavelength 36
Agilent Diagnostic software 122
Agilent Lab Advisor software 122
Agilent Lab Advisor 122
Agilent
on internet 238
algae 236, 236
algea 176
ambient non-operating temperature 35
ambient operating temperature 35
analog signal 218
analog
cable 192
apg remote 219
B
battery
safety information 232
BCD board
external contacts 207
BCD
cable 197
bench space 34
bio-inert 171
materials 28
board
HP JetDirect card 209
Agilent 1260 FLD User Manual
209
C
cable
analog 192
BCD 197
CAN 199
connecting APG remote 50
connecting CAN 50
connecting LAN 50
connecting the ChemStation 50
connecting the power 50
external contact 200
LAN 199
remote 194
RS-232 201
cables
analog 190
BCD 190
CAN 191
LAN 191
overview 190
remote 190
RS-232 191
calibration sample 160
CAN
cable 199
cautions and warnings 167
cleaning 170
Communication settings
RS-232C 222
compensation sensor open 129
compensation sensor short 130
condensation 34
Configuration
two stack 49
cut-off filter 15
cuvette
how to use 175
D
defect on arrival 44
degradation UV 17, 140
delivery checklist 45
Diagnostic software 122
dimensions 35
E
electrical connections
descriptions of 211
emission condenser 15
emission grating 15
emission monochromator 19
emission slit 15
error messages
A/D Overflow 132
ADC Not Calibrated 132
compensation sensor open 129
compensation sensor short 130
fan failed 130
Flash Lamp Current Overflow 133
Flash Trigger Lost 133
FLF Board not found 131
Flow Cell Removed 135
Lamp Cover Open 131
leak sensor open 128
leak sensor short 129
leak 128
239
Index
lost CAN partner 127
motor errors 136
No Peaks 135
remote timeout 127
shutdown 126
timeout 125
Wavelength Calibration Failed 134
Wavelength Calibration Lost 134
excitation condenser 15
excitation grating 15
excitation monochromator 17
excitation slit 15
external contact
cable 200
external contacts
BCD board 207
H
How the Detector Operates 11
how to use the cuvette 175
HP JetDirect card 209
humidity 35
I
installation
bench space 34
flow connections 54
of flow cell and capillaries 54
of the detector 51
site requirements 31
interfaces 214
internet 238
Introduction to the Detector 10
F
L
fan failed 130
features
safety and maintenance 41, 38
firmware
description 204
main system 204
resident system 204
update tool 205
updates 205, 180
upgrade/downgrade 180
flow cell 15, 20, 236
solvent information 236
fluorescence and phosphorescence 12
fluorescence detection 23
frequency range 35
front view of module 51
lamp intensity history 141
lamp intensity test 140
LAN
cable 199
communication interface board
leak sensor open 128
leak sensor short 129
leak 128
leaks
correcting 177
line frequency 35
line voltage 35
lithium batteries 232
lost CAN partner 127
luminescence 11
G
M
general error messages
GLP features 38, 41
glycogen 160
240
125
maintenance
definition of 166
overview 169
209
replacing firmware 180
materials
bio-inert 28
message
A/D Overflow 132
ADC Not Calibrated 132
Flash Lamp Current Overflow 133
Flash Trigger Lost 133
FLF Board not found 131
Flow Cell Removed 135
Lamp Cover Open 131
motor messages 136
No Peaks 135
remote timeout 127
Wavelength Calibration Failed 134
Wavelength Calibration Lost 134
method development
1 - check the LC system for
impurities 66
2 - optimize limits of detection and
selectivity 68
3 - set up routine methods 79
multi wavelength detection 79
take a fluorescence scan 69
mirror 15
monochromator
EM 19, 15
EX 17, 15
multi wavelength detection 79
N
non-operating altitude 35
non-operating temperature 35
O
off-line measurements 10
operating Altitude 35
operating temperature 35
operation of the detector 11
optical unit overview 15
Agilent 1260 FLD User Manual
Index
optimization
example 83
stack configuration
46
P
packaging
damaged 44
parts identification
accessory kit 186
cables 189
overview 184
parts
damaged 45
missing 45
peakwidth settings 113
peakwidth
selecting 111
performance specifications 36, 39
phosphorescence detection 24
photoluminescence 11
photo-multiplier tube
location of PMT 15
PMT 20
physical specifications 35
PMT
gain test 98
gain 103, 20
photo-multiplier tube 20
range 26
power consideration 32
power consumption 35
power cords 33
power supply indicator 119
R
radio interference 233
Raman S/N test 142
Raman 14
recalibration of wavelength
118, 139
Agilent 1260 FLD User Manual
reference diode 22
reference system 22, 22
remote
cable 194
repairs
cautions and warnings 167
correction leaks 177
exchanging a flow cell 171
of the detector 165
replacing firmware 180
replacing leak handling system
replacing interface board
(BCD/LAN) 179
response time settings 113
response time
selecting 111
responsetime 26
RS-232C
cable 201
communication settings 222
S
safety class I 229
safety information
lithium batteries 232
safety
general information 229
standards 35
symbols 228
selecting
peakwidth 111
response time 111
serial number
information 213, 213
settings
peakwidth 113
response time 113
shutdown 126
site requirements 31
power cords 33
178
solvent information 93, 236
solvents 236
sound emission 234
special interfaces 220
special settings
boot-resident 224
forced cold start 224
specification
physical 35
specifications
analog outputs 40, 38
communications 40, 38
flow cell 40, 37
GLP features 41, 38
monochromators 39, 36
performance 39, 36
pulse frequency 39, 36
safety and maintenance 41, 38
wavelength accuracy 36
spectra wavelength shift 99
stack configuration
front view 49
rear view 50
status indicator 120
stray light 114
system setup and installation
optimizing stack configuration 46
T
temperature sensor 128
test chromatogram 149
test functions 118, 139
tests
functions 139
lamp intensity history 141
lamp intensity 140
PMT gain test 98
Raman AST S/N 142
test chromatogram 149
241
Index
timeout 125
troubleshooting
error messages 118, 124
status indicators 119, 118
U
unpacking 44
UV degradation 17, 140
V
voltage range
35
W
warnings and cautions 167
wavelength calibration procedure
160
wavelength calibration 151
wavelength shift of spectra 99
wavelength
recalibration 118, 139
weight 35
151,
X
xenon flash lamp
242
15, 16
Agilent 1260 FLD User Manual
www.agilent.com
In This Book
This manual contains technical reference
information about the Agilent 1260 Infinity
Fluorescence Detector G1321B and Agilent
1200 Series Fluorescence Detector G1321A
(obsolete).
• introduction and specifications,
• installation,
• using and optimizing,
• troubleshooting and diagnose,
• maintenance,
• parts identification,
• safety and related information.
© Agilent Technologies 2010-2012
Printed in Germany
10/2012
*G1321-90012*
*G1321-90012*
G1321-90012
Rev. C
Agilent Technologies