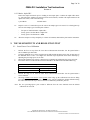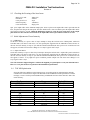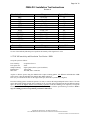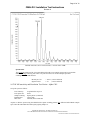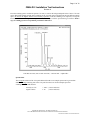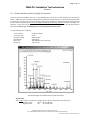
1
OMALDI 2
MS/TOF System Ion Source
Installation and Site Acceptance
Testing Data Instructions
850 Lincoln Centre Drive, Foster City, CA 94404
Page 2 of 16
OMALDI 2 Installation Test Instructions
Revision A
Revision Log
Date
05/09/2002
Revision Level
Rev A
Description of Revision
First issue of document
PROPRIETARY INFORMATION - APPLIED BIOSYSTEMS, INC.
NOT TO BE REPRODUCED OR DISCLOSED TO OTHERS WITHOUT PRIOR WRITTEN APPROVAL
File: oMALDI 2 Installation Test InstructionsRevA.doc
Page 3 of 16
OMALDI 2 Installation Test Instructions
Revision A
TABLE OF CONTENTS
1. PREFACE
2. INTRODUCTION NOTES
3. SOURCE UNPACKING AND INSPECTION
4. SOURCE/INSTRUMENT SET-UP
5. MATERIALS REQUIRED
6. SAFETY
7. VACUUM SYSTEM PRESSURE CHECK
8. SAMPLE PLATE PREPARATION
9. TOF MS SENSITIVITY AND RESOLUTION TEST
10. PRODUCT ION MASS SENSITIVITY
11. FINAL COLLECTION OF OMALDI 2 PERFORMANCE DATA
PROPRIETARY INFORMATION - APPLIED BIOSYSTEMS, INC.
NOT TO BE REPRODUCED OR DISCLOSED TO OTHERS WITHOUT PRIOR WRITTEN APPROVAL
File: oMALDI 2 Installation Test InstructionsRevA.doc
Page 4 of 16
OMALDI 2 Installation Test Instructions
Revision A
1. Preface
The Customer Support Engineer (CSE) and the customer should sign the first page of the Installation and Site
Acceptance Testing Data Log after verifying that all installation criteria have been met and after the customer
orientation is complete. The system configuration should be filled out based on the configuration present on the
source to be installed. If an option is not present on the source N/A should be entered in the blank.
The check lines in the form should be checked off as they are completed. Spectra and chromatograms should be
printed as specified in this document. If an option is not present on a system, the check line should not be modified.
For all tests, use the acquisition parameters specified on the installation form. Fill in data requested. If data does not
meet the required values, the check line should not be checked until the system is able to meet the required value.
2. INTRODUCTION NOTES
All initial setup procedures required to ensure the functional performance and calibration of the QStar Pulsar I
instrument must be performed before collecting any analytical data to validate the performance of the
oMALDI 2 source. The QStar Pulsar I used to collect the oMALDI 2 performance test must be known to
reliably meet all site installation test requirements.
2.1
The following describes on-site performance tests to be completed on the oMALDI 2 /QSTAR
PULSAR I as part of performance verification testing.
2.2
The "guideline" performance values in this document are to be used in diagnosing hardware
problems in the oMALDI 2/QSTAR PULSAR I systems. The performance verification
"guidelines" do not represent specifications for Site Acceptance. The Site Acceptance
specifications are clearly marked as such. However, if the intensity and/or resolution verification
guideline values described below are not met, it is unlikely that the Site Acceptance specifications
will be attainable.
2.3
All tests are to be run on an oMALDI 2 installed on a QStar Pulsar I.
2.4
Record all test results on the Installation Check list. A copy of the installation check list/data log
and a hard copy of all test runs, data acquisition data method files (.dam), parameter settings files
and calibration runs are to be given to the District Service Manager and to the LC/MS Product
Department.
2.5 Save copies of all method files used, parameter settings file and calibration (instrumentdata.ins) file
and all tests to disk. These will be needed not only for the customers GLP records but will aid in future
troubleshooting. The name of the saved files should include, at a minimum, the test section number,
the date and unit S/N.
2.6 Unless otherwise noted all installation tests will be run using renin sample from the standard ABD
Sample test kit (ABD P/N 401-936). It must be refrigerated upon arrival. Renin test sample will require
dilution at the customer site. Consult the document in the test kit for dilution instructions.
3. SOURCE UNPACKING AND INSPECTION
Inspect the packaging for mechanical damage. Unpack the system and inspect the system for mechanical damage.
PROPRIETARY INFORMATION - APPLIED BIOSYSTEMS, INC.
NOT TO BE REPRODUCED OR DISCLOSED TO OTHERS WITHOUT PRIOR WRITTEN APPROVAL
File: oMALDI 2 Installation Test InstructionsRevA.doc
Page 5 of 16
OMALDI 2 Installation Test Instructions
Revision A
4. SOURCE/INSTRUMENT SET-UP
Refer to the QStar Pulsar I Installation Guide and QStar Pulsar I Service Manual for further instructions.
5. MATERIALS REQUIRED
5.1 Matrix solutions – DHB Agilent and Alpha CHC Agilent
5.2 Sample: 1 pmol/µl Renin Substrate Solution, 100 fmol/µl Renin Substrate Solution.
Both 1pmol/µl and 100 fmol/µl Renin Substrate Solution have to be diluted from 10 pmol/µl Renin
Substrate Solution. Use the Dilution solvent from API Final Test KIT.
The renin substrate solution consists of 10 pmol/µL renin substrate and 0.1% acetic acid dissolved in a
50/50 solution of acetonitrile/water. As mentioned in the instructions from the API Final Test
KIT (P/N401936) the following procedure has to be followed to prepare the 10pmol Renin Substrate:
Renin Substrate Standard: Add 3.80 ml of Dilution solvent to the Renin vial, cap and mix gently or sonicate
to dissolve the material. Reconstitution produces a 10 pmol/ul solution of renin substrate.
Dilution Solvent used for Renin is the dilution solvent from the API Final Test KIT:
50/50 ACN/H2O with 0.1% HOAc .
1 pmol and 100 fmol/uL Renin dilution from 10 pmol/uL stock solution:
1. Dilute 10 pmol/uL renin to 1 pmol/uL:
Remove 20 uL of 10 pmol/uL renin, place it in 500 uL plastic vial. Add 180 uL above dilution solvent.
Vortex the vial for 30 seconds and centrifuge for 30 seconds.
2. Dilute 1 pmol/uL renin to 100 fmol/uL:
Withdraw 20 uL of 1 pmol/uL renin solution with 20 uL pipetter and place it in another 500 uL plastic vial.
Add 180 uL dilute solvent to make 200 uL of 100 fmol/uL solution. Vortex it for 30 seconds and centrifuge
it for 30 seconds.
5.3 Materials used for Sample plate preparation and Sample deposition:
Variable Pipettes : 0.1 to 1.0 µl; 20 ul and 200 ul.
Disposable Pipette tips, 1 to 2 ul, 200ul.
Methanol (HPLC Grade)
De-ionized distilled water (DDW) H2O
Soap solution ( 2-3 drops of kitchen detergent in 200 ml de-ionized distilled water)
Latest Version of Analyst QS with oMALDI Support.
oMALDI 2 Performance Test Data Log.
Gases:“ZERO” Air < 2.0 ppm total CH4
Gas withdrawal Liquid Nitrogen
Gas withdrawal Liquid Argon
Leybold S25B or Varian DS602 Backing Pump.
50 psig and 90 psig
40 psig
40 psig
PROPRIETARY INFORMATION - APPLIED BIOSYSTEMS, INC.
NOT TO BE REPRODUCED OR DISCLOSED TO OTHERS WITHOUT PRIOR WRITTEN APPROVAL
File: oMALDI 2 Installation Test InstructionsRevA.doc
Page 6 of 16
OMALDI 2 Installation Test Instructions
Revision A
COMPUTER SYSTEM REQUIREMENTS
•
Dell Precision 220, GX300, or Precision 530 dual processor, 512 Mb of RAM, 20 Gb hard drive.
All test solutions must be kept under refrigerated conditions, if for any reason they are left out
of the refrigerator for longer than 24 hours new solutions must be used!
Stock solution of standards should be diluted to the required concentration in eppendorf tubes by a
dilution factor of 10 or less. This will avoid large dilution errors.
6. SAFETY
Refer to all applicable Material Safety Data Sheets for any necessary precautions, before handling chemical
solutions or solvents. Before performing the tests, the customer support engineer must be sufficiently trained
on operation and safety procedures for the instrument and the oMALDI 2 source.
All safety interlocks for the oMALDI 2 must be in place prior to its use. This ensures that at no time will
there be any risk of laser light exposure to the operator, or to anyone in the immediate vicinity of the
oMALDI2 source, during testing.
7. VACUUM SYSTEM PRESSURE CHECK
7.1
Attach the oMALDI 2 source to the instrument in accordance with applicable installation
procedure. Pump down the instrument. The TOF section of the instrument must reach a base
pressure of 4.0 e10-6 torr with the CAD gas off and 5.0 e10-6 torr, with the CAD gas set to
maximum flow (12), before testing of the source can begin.
7.2
The Quad analyzer region vacuum must be lower than 2.0e10-5 with CAD=1 and must not
exceed 8.0e10-5 torr with the CAD =12.
8. SAMPLE PLATE PREPARATION
8.1
Sample plate Cleaning Procedure
1.
2.
3.
4.
5.
Drop a few drops of soap solution (dish wash detergent solution) on the dirty sample plate.
Rub softly and thoroughly with lint free cloth or wipe tissue to clean.
Rinse with deionized water (no tap water) thoroughly.
Rinse with Methanol (HPLC grade)
Examine the plate, if you see any sample or matrix residue, oil or fingerprints on the plate,
repeat steps 1 to 5.
6. Allow the plate to dry in an area where it will not be exposed to contaminants, cover the
plate with a 1 L beaker if necessary.
7. Recommendation: in high humidity environment pre-cool the plate in fridge for 5-10 minutes
then buff it with a clean lint free cloth (or wipe tissue) and let it dry in the atmosphere.
8.2.1 Sample Loading Matrix: DHB
Premix the sample and matrix prior to loading on the sample plate. Combine the matrix DHB 1:1 with
each of the samples to be analyzed. From stock solutions, combine with equal amounts of the DHB
matrix, each of the following:
1 pmol Renin
100 fmol Renin
PROPRIETARY INFORMATION - APPLIED BIOSYSTEMS, INC.
NOT TO BE REPRODUCED OR DISCLOSED TO OTHERS WITHOUT PRIOR WRITTEN APPROVAL
File: oMALDI 2 Installation Test InstructionsRevA.doc
Page 7 of 16
OMALDI 2 Installation Test Instructions
Revision A
8.2.2 Matrix: Alpha CHC
Premix the sample and matrix prior to loading on the sample plate. Combine the Alpha CHC matrix
1:1 with each of the samples to be analyzed. From stock solutions, combine with equal amounts of the
Alpha CHC matrix, each of the following:
1 pmol Renin
8.3
Deposit a series of 1.0 microliter spots for each of the sample types to be tested. Use a fresh pipette tip
between each sample type. The final plate will have:
-
8.4
100 fmol Renin
Ten spots of 500 fmol Renin +Alpha CHC
Twenty spots of 50 fmol Renin +Alpha CHC
Twenty spots of 50 fmol Renin + DHB
Allow the samples to air dry completely in a clean environment, then load the plate into the instrument.
9. TOF MS SENSITIVITY AND RESOLUTION TEST
9.1
1.
2.
3.
4.
Laser Power Curve Calibration
Perform the first 10 steps from the Laser Power Measurement Procedure. See the QStar Pulsar I
Service Manual p/n 1001555B.
Using the oMALDI server set the repetition rate at 20Hz and the attenuator steps value at 1000 steps. If
the oMALDI Server is Rev 2.0 or higher the attenuator steps adjustment can be done indirectly by
adjusting the percentage power level value.
Increase the attenuator step value by 1000 steps up to 24000 steps and measure the power each time.
Record the values in a table like the one below and add it to the oMALDI 2 installation Data Log.
Date:
oMALDI 2 S/N:
Power
5.
6.
Attenuator Steps
Perform the steps 14 –21 from the Laser Power Measurement Procedure. See the QStar Pulsar I
Service Manual.
Selecting Calibrate Laser Power in the Operate menu brings up the Calibration Laser Power dialog
box. Initially a default calibration file is loaded by the software. Modify the default calibration using
the values obtained in the step 4 and save the file as oMALDI 2_Installation_Date.lsr.
Note: The new percentage/power pairs would be different from the ones obtained when the default
calibration file was used.
PROPRIETARY INFORMATION - APPLIED BIOSYSTEMS, INC.
NOT TO BE REPRODUCED OR DISCLOSED TO OTHERS WITHOUT PRIOR WRITTEN APPROVAL
File: oMALDI 2 Installation Test InstructionsRevA.doc
Page 8 of 16
OMALDI 2 Installation Test Instructions
Revision A
9.2
Checking the Focusing of the laser beam
Matrix to be used:
Pulse Rate:
Laser power level:
Pulsar Frequency:
Laser Scan Pattern:
Alpha CHC
20 Hertz
40 µJ
7 Kilohertz
Single point
Spot 1µl of Alpha CHC on the oMALDI sample plate. Select a point on the Alpha CHC matrix spot and start the
laser, keep the laser firing at the same point. The laser should create a clear oval black spot in the Alpha CHC matrix
spot within less than five second. Adjust the illuminator position to verify the focus of the laser on the sample
plate if the laser does not burn an oval hole in the Alpha CHC matrix spot within less than five second.
9.3 Initial Adjustment of Laser Intensity
9.3.1 DHB Matrix
Set the laser intensity to a power value of 30µJ. Attempt to desorp the 50 fmol renin + DHB premix solution in
TOF-MS mode (scan 400 to 1800 amu). Use the spotted plate supplied with the oMALDI 2 Head. Increase or
decrease the laser intensity in steps of 1µJ until the ionization threshold (the laser power level at which some ions
first appear) is found. The Laser Power Range is 15 to 40µJ. Typical value is 30µJ.
9.3.2 Alpha CHC Matrix
Set the laser intensity to a power value of 8µJ. Attempt to desorp the 50 fmol renin + Alpha CHC premix solution in
TOF-MS mode (scan 400 to 1800 amu). Use the spotted plate supplied with the oMALDI 2 Head. Increase or
decrease the laser intensity in steps of 1µJ until the ionization threshold (the laser power level at which some ions
first appear) is found. A very high laser power would not produce sample ions. The Laser Power Range is 8 to
15µJ. Typical value is 12µJ.
Note: The Customer Support Engineer could use the supplied pre-spotted plate to verify the oMALDI source
However a new plate needs to be spotted for final installation specifications.
9.4
TOF MS Optimization
Setup the following conditions on the instrument: use as a starting point for optimization the methods
created for the renin solution in single TOF MS mode in initial installation of the Qstar Pulsar I with the
Ion Spray. Create a new Project named oMALDI 2_SerialNumber and save all the data and “.dam” files
in this directory.
Source/Gas Parameters
CUR Gas
GS1/GS2 Gas
Range
10-55
0
Typical Value
25
0
Compound Parameters
Range
Typical Value
FP
DP2
CAD Gas
Q0
ST
IQ2
60
20
2 to 5
20
14 to 17
-20 to 20
60
20
3
20
15
5
PROPRIETARY INFORMATION - APPLIED BIOSYSTEMS, INC.
NOT TO BE REPRODUCED OR DISCLOSED TO OTHERS WITHOUT PRIOR WRITTEN APPROVAL
File: oMALDI 2 Installation Test InstructionsRevA.doc
Page 9 of 16
OMALDI 2 Installation Test Instructions
Revision A
Resolution Parameters
IE1
R02
IQ3
IRP
GRID
TFO
TST
LINER
MIRROR
PLATE
GRID
OFFSET
Range
0.0 to 4.0
9 to 10.5
8.5 to 10
=IQ3
-5 to –15
5.0 to –5.0
2.0 to –2.0
4000
750 to 1050
300 to 420
-280 to –450
10.0 to –10.0
Typical Value
1.0
9.5
9.0
=IQ3
-8
0.0
0.0
4000
975
325
-340
-5.0
Detector Parameters
MCP
Range
1800 to 2400
Typical Value
2200
Use one of the 50fmole/µl Renin spots to optimize the intensity of the signal at m/z 1759.
9.5 TOF MS sensitivity and Resolution Test: Renin + DHB.
Set up the system as follows:
Laser intensity:
Laser pulse rate:
Sample scanning:
Run duration:
Mass scan:
as optimized in 9.3.1
20 Hz
Square pattern (If the crystal is uniform).
120 seconds
TOF-MS, 400 to 1800 amu
Acquire to disk the spectra using the oMaldi with a Square scanning pattern, nine different 50fmol Renin +DHB
premix spots. Label the individual files 50fmol_MS_DHB_Sample1-9.
Note: (Try to concentrate the laser on the edges of the spot, where the crystal density is highest)
From the resulting spectra examine the peak at 1759 amu, as well as the background peaks in the 1740 to 1770 amu
region. Record the intensity and the mass resolution for the 1759 amu parent ion peak from the nine different sample
spots.. Do not use the highest and the lowest intensity replicates. From the remaining seven replicates, average the
intensity and calculate the signal to background ratio, and compare with the specifications given below. Print a
copy of resulting spectra to keep with the performance data sheet.
PROPRIETARY INFORMATION - APPLIED BIOSYSTEMS, INC.
NOT TO BE REPRODUCED OR DISCLOSED TO OTHERS WITHOUT PRIOR WRITTEN APPROVAL
File: oMALDI 2 Installation Test InstructionsRevA.doc
Page 10 of 16
OMALDI 2 Installation Test Instructions
Revision A
TOF MS 120 scans (120 sec total scan time) – renin 50 fmol + DHB
Specification:
The average Resolution of the 1759 peak obtained from the seven samples spots must be greater than
8000. The average intensity peak of the 1759 peak from the seven 50 fmol sample spots after
scanning for 120 seconds must be:
Intensity at 1759
Signal to Noise
> 200 tc (120 second scan)
≥ 10
(120 second scan)
9.6 TOF MS sensitivity and Resolution Test: Renin + Alpha CHC.
Set up the system as follows:
Laser intensity:
Laser pulse rate:
Sample scanning:
Run duration:
Mass scan:
as optimized in step 9.3.2
20 Hz
Square pattern (or manual).
120 seconds
TOF MS, 400 to 1800 amu
Acquire to disk the spectra using the oMaldi with a Square scanning pattern, nine different 50fmol Renin sample
spots. Label the individual files 50fmol_MS_Alpha_Sample1-9.
PROPRIETARY INFORMATION - APPLIED BIOSYSTEMS, INC.
NOT TO BE REPRODUCED OR DISCLOSED TO OTHERS WITHOUT PRIOR WRITTEN APPROVAL
File: oMALDI 2 Installation Test InstructionsRevA.doc
Page 11 of 16
OMALDI 2 Installation Test Instructions
Revision A
From the resulting spectra examine the peak at 1759 amu, as well as the background peaks in the 1740 to 1770 amu
region. Record the intensity and the mass resolution for the 1759 amu parent ion peak from the nine different sample
spots.. Do not use the highest and the lowest intensity replicates. From the remaining seven replicates, average the
intensity and calculate the signal to background ratio, and compare with the specifications given below. Print a
copy of resulting spectra to keep with the performance data sheet.
TOF MS 120 scans (120 sec total scan time) – renin 50 fmol + Alpha CHC
Specification:
The average Resolution of the 1759 peak obtained from the seven samples spots must be greater than
8000. The average intensity peak of the 1759 peak from the seven 50 fmol sample spots after
scanning for 120 seconds must be:
Intensity at 1759
Signal to Noise
> 200 tc (120 second scan)
≥ 40
(120 second scan)
PROPRIETARY INFORMATION - APPLIED BIOSYSTEMS, INC.
NOT TO BE REPRODUCED OR DISCLOSED TO OTHERS WITHOUT PRIOR WRITTEN APPROVAL
File: oMALDI 2 Installation Test InstructionsRevA.doc
Page 12 of 16
OMALDI 2 Installation Test Instructions
Revision A
10. PRODUCT ION MASS SENSITIVITY
10.1 Optimization of MSMS conditions:
Set up the system initially as follows:
Laser intensity:
Laser pulse rate:
Sample scanning:
Run duration:
Mass scan:
Product of:
as optimized below
20 Hz
Square pattern
60 seconds
TOF-MS/MS: 100 to 1800 amu
1758.93 amu
Source/Gas Parameters
CUR Gas
Range
10-55
Typical Value
25
Compound Parameters
Range
Typical Value
FP
DP2
CAD Gas
IQ2
CE
60
20
4 to 8
-20 to 20
85 to 115
60
20
5
5
90
Resolution Parameters
IE1
R02
IQ3
IRP
GRID
TFO
TST
LINER
MIRROR
PLATE
GRID
OFFSET
Range
0.0 to 5
9 to 10.5
8.5 to 10
=IQ3
-5 to -15
5.0 to –5.0
2.0 to –2.0
4000
750 to 1050
300 to 420
-280 to -450
10.0 to –10.0
Typical Value
1.0
9.5
9.0
=IQ3
-8
As Optimized
As Optimized
4000
As Optimized
As Optimized
As Optimized
As Optimized
Detector Parameters
MCP
Range
1800 to 2400
Typical Value
As Optimized
Using one of the ten 500 fmole/µl Renin solution spots, optimize the laser intensity, collision energy CE and
the CAD gas to obtain the maximum sensitivity of the m/z 608 Renin peak.
PROPRIETARY INFORMATION - APPLIED BIOSYSTEMS, INC.
NOT TO BE REPRODUCED OR DISCLOSED TO OTHERS WITHOUT PRIOR WRITTEN APPROVAL
File: oMALDI 2 Installation Test InstructionsRevA.doc
Page 13 of 16
OMALDI 2 Installation Test Instructions
Revision A
10.2 Product Ion Mass Sensitivity (High concentration)
Using the optimized conditions from 10.1, collect MS/MS spectra from each of the remaining nine 500 fmole/µl
Renin + Alpha CHC spots. From the resulting spectra examine the peak at 608 amu, as well as the background peaks
in the 605 to 611 amu region. Record the intensity and the mass resolution for the 608 amu product ion peak from
the nine different sample spots. Do not use the highest and the lowest intensity replicates. From the remaining seven
replicates, average the intensity and calculate the signal to background ratio, and compare with the specifications
given below. Print a copy of resulting spectra to keep with the performance data.
Use the following scan conditions:
Laser intensity:
Laser pulse rate:
Sample scanning:
Run duration:
Mass scan:
Product of:
as optimized above
20 Hz
Square pattern
600 seconds
TOF-MS/MS: 100 to 1800 amu
1758.93 amu
TOF Product High Concentration Renin (Alpha CHC matrix)
Specification:
The average intensity from the seven sample spots for the m/z 608 product ion peak must be:
Intensity at 608
> 200 tc (60 second scan)
Signal to Noise
≥ 30
(60 second scan).
PROPRIETARY INFORMATION - APPLIED BIOSYSTEMS, INC.
NOT TO BE REPRODUCED OR DISCLOSED TO OTHERS WITHOUT PRIOR WRITTEN APPROVAL
File: oMALDI 2 Installation Test InstructionsRevA.doc
Page 14 of 16
OMALDI 2 Installation Test Instructions
Revision A
10.3 Product Ion Mass Sensitivity (Low concentration)
10.3.1 Product Ion Mass Sensitivity (Low concentration): Renin + Alpha CHC
Using the optimized conditions from 10.2, collect MS/MS product spectra from nine 50 fmole/µl Renin + Alpha
CHC solution spots. From the resulting spectra examine the peak at 608 amu, as well as the background peaks in the
605 to 611 amu region. Record the intensity and the mass resolution for the 608 amu product ion peak from the nine
different sample spots. Do not use the highest and the lowest intensity replicates. From the remaining seven
replicates, average the intensity and calculate the signal to background ratio, and compare with the specifications
given below. Print a copy of resulting spectra to keep with the performance data. Print a copy of resulting
spectra to keep with the performance data sheet.
Use the following scan conditions:
Laser intensity:
Laser pulse rate:
Run duration:
Mass scan:
Product of:
as optimized above
20 Hz
200 seconds (complete sample desorption)
TOF Product: 100 to 1800 amu
1758.93 amu
TOF Product Low Concentration Renin + Alpha CHC
Specification:
The average intensity peak of the 608 peak from the 50 fmol sample spots after scanning for no less
than 200 seconds must be:
Intensity at 608 > 20 tc (>200 second scan)
Signal to Noise ≥ 30
(>200 second scan)
PROPRIETARY INFORMATION - APPLIED BIOSYSTEMS, INC.
NOT TO BE REPRODUCED OR DISCLOSED TO OTHERS WITHOUT PRIOR WRITTEN APPROVAL
File: oMALDI 2 Installation Test InstructionsRevA.doc
Page 15 of 16
OMALDI 2 Installation Test Instructions
Revision A
10.3.2 Product Ion Mass sensitivity (Low Concentration): Renin + DHB
Using the optimized conditions from 10.2, collect MS/MS product spectra from nine 50 fmole/µl Renin solution
spots. Use the optimized laser power from section 9.5. From the resulting spectra examine the peak at 608 amu,
as well as the background peaks in the 605 to 611 amu region. Record the intensity and the mass resolution for
the 608 amu product ion peak from the nine different sample spots. Do not use the highest and the lowest
intensity replicates. From the remaining seven replicates, average the intensity and calculate the signal to
background ratio, and compare with the specifications given below. Print a copy of resulting spectra to keep
with the performance data. Print a copy of resulting spectra to keep with the performance data sheet.
Use the following scan conditions:
Laser intensity:
Laser pulse rate:
Run duration:
Mass scan:
Product of:
as optimized above
20 Hz
200 seconds (complete sample desorption)
TOF Product: 100 to 1800 amu
1758.93 amu
TOF Product Low Concentration Renin + DHB
Specification:
The average intensity peak of the 608 peak from the 50 fmol sample spots after scanning for no less
than 200 seconds must be:
Intensity at 608
Signal to Noise
> 20 tc (>200 second scan)
≥5
(>200 second scan)
PROPRIETARY INFORMATION - APPLIED BIOSYSTEMS, INC.
NOT TO BE REPRODUCED OR DISCLOSED TO OTHERS WITHOUT PRIOR WRITTEN APPROVAL
File: oMALDI 2 Installation Test InstructionsRevA.doc
Page 16 of 16
OMALDI 2 Installation Test Instructions
Revision A
11.
FINAL COLLECTION OF OMALDI 2 PERFORMANCE DATA
Upon completion of tests on the checked system, the customer support engineer will perform the
following actions:
Copy all *.dam files saved during the installation to a floppy and label it.
Make two copies of the oMALDI 2 Installation Data Log and the Laser Power Curve table.
Provide one copy to the customer and one to GSS at SCIEX.
Make a backup of all *.dam files saved during the installation to a floppy and label it as:
Installation Files oMaldi 2 Serial No.
Specify the appropriate model No.
PROPRIETARY INFORMATION - APPLIED BIOSYSTEMS, INC.
NOT TO BE REPRODUCED OR DISCLOSED TO OTHERS WITHOUT PRIOR WRITTEN APPROVAL
File: oMALDI 2 Installation Test InstructionsRevA.doc