1
®
98
Automotive ScopeMeter] Series II
Users Manual
4822 872 00786
September 1996, Rev. 3, 3/97
^1996, 1997 Fluke Corporation. All rights reserved. Printed in the Netherlands.
All product names are trademarks of their respective companies.
II
Fluke 98
Users Manual
Contents
1
INTRODUCING YOUR
AUTOMOTIVE SCOPEMETER TEST TOOL
INTRODUCTION . . . . . . . . . . . . . . . . . . . . . . . . . . . . . . . . . . . . . . . . 1-3
QUICK TOUR . . . . . . . . . . . . . . . . . . . . . . . . . . . . . . . . . . . . . . . . . . 1-4
POWER SOURCES . . . . . . . . . . . . . . . . . . . . . . . . . . . . . . . . . . . . 1-11
CHARGING THE BATTERY . . . . . . . . . . . . . . . . . . . . . . . . . . . . . . 1-12
USING THE KEYS . . . . . . . . . . . . . . . . . . . . . . . . . . . . . . . . . . . . . . 1-13
READING THE DISPLAY . . . . . . . . . . . . . . . . . . . . . . . . . . . . . . . . 1-16
MEASUREMENT CONNECTIONS . . . . . . . . . . . . . . . . . . . . . . . . . 1-19
GROUNDING GUIDELINES . . . . . . . . . . . . . . . . . . . . . . . . . . . . . . 1-21
2
TUTORIAL
INTRODUCTION . . . . . . . . . . . . . . . . . . . . . . . . . . . . . . . . . . . . . . . . 2-2
POWER ON/OFF/BACKLIGHT/CONTRAST . . . . . . . . . . . . . . . . . . 2-3
VEHICLE DATA SETUP . . . . . . . . . . . . . . . . . . . . . . . . . . . . . . . . . . 2-4
BATTERY VOLTAGE TEST . . . . . . . . . . . . . . . . . . . . . . . . . . . . . . . 2-5
RESISTANCE MEASUREMENT . . . . . . . . . . . . . . . . . . . . . . . . . . . . 2-7
POTENTIOMETER TEST . . . . . . . . . . . . . . . . . . . . . . . . . . . . . . . . . 2-9
OXYGEN SENSOR TEST . . . . . . . . . . . . . . . . . . . . . . . . . . . . . . . . 2-11
GENERAL SENSORS TEST . . . . . . . . . . . . . . . . . . . . . . . . . . . . . . 2-13
RPM MEASUREMENT . . . . . . . . . . . . . . . . . . . . . . . . . . . . . . . . . . 2-15
SECONDARY IGNITION SINGLE ON DIS . . . . . . . . . . . . . . . . . . . 2-17
INJECTION TEST . . . . . . . . . . . . . . . . . . . . . . . . . . . . . . . . . . . . . . 2-19
RECORD PLOT READINGS . . . . . . . . . . . . . . . . . . . . . . . . . . . . . . 2-21
RECORD MIN MAX TRENDPLOT . . . . . . . . . . . . . . . . . . . . . . . . . 2-23
RECORD INTERMITTENT RECORD . . . . . . . . . . . . . . . . . . . . . . . 2-25
RECORD FLIGHT RECORD . . . . . . . . . . . . . . . . . . . . . . . . . . . . . . 2-28
SAVE/RECALL OF SCREENS . . . . . . . . . . . . . . . . . . . . . . . . . . . . 2-30
CURSOR KEY FUNCTION . . . . . . . . . . . . . . . . . . . . . . . . . . . . . . . 2-32
3
USING THE AUTOMOTIVE SCOPEMETER TEST TOOL
INTRODUCTION . . . . . . . . . . . . . . . . . . . . . . . . . . . . . . . . . . . . . . . . 3-3
MENU OVERVIEW . . . . . . . . . . . . . . . . . . . . . . . . . . . . . . . . . . . . . . 3-8
USING SENSOR FUNCTIONS . . . . . . . . . . . . . . . . . . . . . . . . . . . . 3-13
USING AIR/FUEL FUNCTIONS . . . . . . . . . . . . . . . . . . . . . . . . . . . 3-20
USING IGNITION FUNCTIONS . . . . . . . . . . . . . . . . . . . . . . . . . . . 3-23
USING DIESEL FUNCTIONS . . . . . . . . . . . . . . . . . . . . . . . . . . . . . 3-28
USING ELECTRICAL SYSTEM FUNCTIONS . . . . . . . . . . . . . . . . 3-30
USING SCOPE FUNCTIONS . . . . . . . . . . . . . . . . . . . . . . . . . . . . . 3-37
USING MULTIMETER FUNCTIONS . . . . . . . . . . . . . . . . . . . . . . . . 3-47
CHANGING THE VEHICLE DATA AND INSTRUMENT SETUP . . 3-56
III
4
USING THE ADDITIONAL CAPABILITIES
USING THE RECORD FUNCTIONS . . . . . . . . . . . . . . . . . . . . . . . . . 4-2
INTERMITTENT RECORD . . . . . . . . . . . . . . . . . . . . . . . . . . . . . . . . . 4-8
FLIGHT RECORD . . . . . . . . . . . . . . . . . . . . . . . . . . . . . . . . . . . . . . 4-10
FREEZING, PRINTING, SAVING, AND RECALLING SCREENS . . 4-12
USING CURSORS . . . . . . . . . . . . . . . . . . . . . . . . . . . . . . . . . . . . . . 4-14
USING THE SMOOTH FUNCTION . . . . . . . . . . . . . . . . . . . . . . . . . 4-16
5
AUTOMOTIVE APPLICATIONS
SENSORS . . . . . . . . . . . . . . . . . . . . . . . . . . . . . . . . . . . . . . . . . . . . . 5-3
AIR/FUEL . . . . . . . . . . . . . . . . . . . . . . . . . . . . . . . . . . . . . . . . . . . . . 5-37
IGNITION . . . . . . . . . . . . . . . . . . . . . . . . . . . . . . . . . . . . . . . . . . . . . 5-57
ELECTRICAL SYSTEM . . . . . . . . . . . . . . . . . . . . . . . . . . . . . . . . . . 5-79
DIESEL . . . . . . . . . . . . . . . . . . . . . . . . . . . . . . . . . . . . . . . . . . . . . . . 5-92
6
USER MAINTENANCE
CLEANING . . . . . . . . . . . . . . . . . . . . . . . . . . . . . . . . . . . . . . . . . . . . .
KEEPING BATTERIES IN OPTIMAL CONDITION . . . . . . . . . . . . . .
REPLACING AND DISPOSING OF BATTERIES . . . . . . . . . . . . . . .
FUSES NOT REQUIRED . . . . . . . . . . . . . . . . . . . . . . . . . . . . . . . . . .
CALIBRATING 10:1 TEST LEADS . . . . . . . . . . . . . . . . . . . . . . . . . . .
7
6-2
6-2
6-4
6-5
6-6
APPENDIXES
APPENDIX 7A
APPENDIX 7B
APPENDIX 7C
APPENDIX 7D
APPENDIX 7E
INDEX
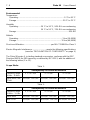
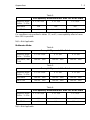
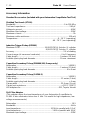
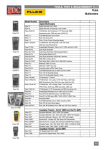
Specifications . . . . . . . . . . . . . . . . . . . . . . . . . . . . . 7-1
Parts and Accessories . . . . . . . . . . . . . . . . . . . . . 7-14
PM8907 Information . . . . . . . . . . . . . . . . . . . . . . . 7-17
Warranty and Service Centers . . . . . . . . . . . . . . . 7-19
Terminology . . . . . . . . . . . . . . . . . . . . . . . . . . . . . 7-21
IV
Fluke 98
Users Manual
About This Manual
Chapter 1. Introducing Your Automotive ScopeMeter test tool.
This chapter introduces Automotive ScopeMeter£ test tool features and
capabilities. It starts with a ‘Quick Tour’ to give you a quick introduction to the
Automotive ScopeMeter test tool.
Chapter 2. Tutorial
This chapter provides many demonstrations with use of the Demo Board to
help you understand how the Automotive ScopeMeter test tool works.
Chapter 3. Using the Automotive ScopeMeter Test Tool
This chapter describes how to use the main functions of the Automotive
ScopeMeter test tool. This includes the Automotive Test Functions, the
Scope, and the Multimeter.
Chapter 4. Using the Additional Capabilities
This chapter describes the Automotive ScopeMeter test tool capabilities
beyond the normal measurement functions, such as Recording, Saving and
Recalling Screens, Cursors, and the Smooth Function.
Chapter 5. Automotive Applications
This chapter handles applications for the test tool, including descriptions, test
setup (probes and test leads used and how to connect them), the operation
sequence to perform the tests, the results you should see on the display, and
analysis of the displayed results.
Chapter 6. User Maintenance
This chapter describes the cleaning of the Automotive ScopeMeter test tool
and proper use and replacement of the battery pack. Periodic probe
calibration is also covered here.
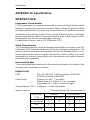
Chapter 7. Appendixes
Appendix 7A. Specifications
Specifies the operating characteristics of the Automotive
ScopeMeter test tool.
Appendix 7B. Parts and Test Tool Accessories
Kit contents and parts ordering information.
Appendix 7C PM8907 Power Adapter Information.
Gives information about the Power Adapters for different
local line voltages.
Appendix 7D. Warranty and Service Centers
Warranty terms and Service Center addresses.
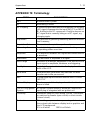
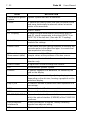
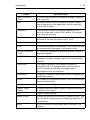
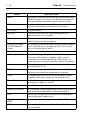
Appendix 7E. Terminology
Defines terms you are likely to encounter when working with
the Automotive ScopeMeter test tool.
About This Manual
V
Keystrokes
Keystrokes are represented in this manual with graphics of the keys. For
example,
instructs you to press the MENU key.
Use of Terminology
Consult Appendix 7E ‘TERMINOLOGY’ at the back of the manual for
explanations of unfamiliar terms.
UNPACKING
Check that the following items are included with your Automotive ScopeMeter test
tool:
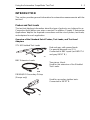
Carrying Case Contents
1. Automotive Hard Carrying Case C98.
2. Automotive ScopeMeter test tool in Yellow Holster, installed with NiCad
Battery Pack (PM9086/011.)
3.
1 Power Adapter/Battery Charger PM8907/80*
* = 4 for UK, 240V, 50Hz
* = 1 for rest of Europe, 230V, 50 Hz
* = 3 for USA and Canada 120V, 60 Hz
* = 6 for Japan, 100V, 60 Hz
* = 7 for Australia, 240V, 50 Hz
* = 8 for other countries, selectable for 115V and 230V.
VI
Fluke 98
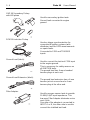
4.
2 Shielded Test Leads, red and grey (STL90).
5.
2 Ground Leads for STL90 Test Leads, black.
6.
2 BNC Extension Leads for STL90.
7.
1 Ground Lead (unshielded), black.
8.
1 Ground Extension Lead (unshielded), black.
9.
2 Filter Adapters (blue).
Users Manual
10. 1 Demo Board with 9V battery.
11. 1 Accessory Container
12. 1 Secondary Pickup being one of the following models (country dependent):
12a CAP90-2 with three HEI (High Energy Ignition) Adapters.
12b PM9096/01
13. 1 Inductive Pickup RPM90.
14. 3 Alligator Clips, red, grey, and black.
15. 3 4-mm Banana Adapters, grey, red, and black
16. 3 2-mm Adapters, red, grey, and black.
17. 3 Back Probe Pins, red, grey, and black.
18. 2 Keys for Case.
19. 1 Soft Case C75.
20. 1 Users Manual.
Check the contents for completeness, noting whether any damage has occurred
during shipment. If something in the kit is damaged or missing, contact your
distributor immediately.
WARNING
READ “SAFETY” BEFORE USING THE AUTOMOTIVE SCOPEMETER TEST TOOL.
SAFETY
The instrument described in this manual is designed to be used only by qualified
personnel.
Safety Precautions
To use this instrument safely, it is essential that operating and servicing
personnel follow both generally accepted safety procedures and the safety
precautions specified in this manual.
Safety
VII
$pecific warning and caution statements, where they apply, will be found
throughout the manual.
Where necessary, the warning and caution statements and/or symbols are
marked on the instrument.
A CAUTION identifies conditions and actions that may damage the
Automotive ScopeMeter test tool.
A WARNING IDENTIFIES CONDITIONS AND ACTIONS THAT POSE
HAZARD(S) TO THE USER.
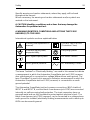
International symbols used are explained below.
Caution (see explanation in
manual)
DOUBLE INSULATION
(Protection Class)
Common input symbol,
equipotentiality
Recycling symbol
BNC signal input symbol
DC-Direct Current
Earth (ground) terminal
AC-Alternating Current
The terms “Isolated” or “Electrically floating “ are used in this manual to indicate
a measurement in which the Automotive ScopeMeter test tool COM (common,
also called ground) is connected to a voltage different from earth ground. The
term “Grounded” is used in this manual to indicate a measurement in which the
Automotive ScopeMeter test tool COM (common) is connected to an earth
ground potential.
The Automotive ScopeMeter test tool common connections (BNC shields of
INPUT A and INPUT B, and the black 4-mm banana jack COM) are connected
internally via self-recovering fault protection. The input connectors have no
exposed metal and are fully insulated to protect against electrical shock. The
black 4-mm banana jack COM (common) can be connected to a voltage above
earth ground for isolated (electrically floating) measurements and is rated up to
600V rms above earth ground.
VIII
Fluke 98
Users Manual
USING YOUR AUTOMOTIVE SCOPEMETER TEST TOOL SAFELY
Follow safe servicing practices as described in your vehicle service manual. To
ensure that you use your Automotive ScopeMeter test tool safely, follow the
safety guidelines below:
•
•
Avoid working alone.
•
Inspect the test leads for damaged insulation or exposed metal. Check test
lead continuity. Replace damaged leads before use.
•
•
•
Do not use the Automotive ScopeMeter test tool if it looks damaged.
•
When using the probes, keep your fingers away from probe contacts. Keep
your fingers behind the finger guards on the probes.
•
•
Disconnect the live test lead before disconnecting the common test lead.
Disconnect the power and discharge all high-voltage capacitors before
connecting the Automotive ScopeMeter test tool to make resistance
measurements.
Select the proper function and range for your measurement.
Use caution when working above 60V dc, 42V peak, or 30V rms. Such
voltages pose a shock hazard.
Do not perform internal service or adjustment of this product unless you are
qualified to do so.
WARNING
DO THE FOLLOWING TO AVOID ELECTRICAL SHOCK BEFORE USING THE
AUTOMOTIVE SCOPEMETER TEST TOOL:
1. MAKE SURE THAT THE VEHICLE TO BE TESTED IS AT A SAFE POTENTIAL
BEFORE MAKING ANY MEASUREMENT CONNECTIONS.
2. CONNECT THE COM INPUT OF THE TEST TOOL TO VEHICLE GROUND
BEFORE CLAMPING THE STANDARD SUPPLIED SECONDARY PICKUP OR
THE INDUCTIVE PICKUP ON THE IGNITION WIRES. THIS GROUND
CONNECTION IS REQUIRED IN ADDITION TO THE NORMAL
MEASUREMENT GROUND CONNECTIONS.
Safety
IX
WARNING
DO THE FOLLOWING TO AVOID ELECTRICAL SHOCK IF THE GROUND OF THE
AUTOMOTIVE SCOPEMETER TEST TOOL IS CONNECTED TO A VOLTAGE
HIGHER THAN 42V PEAK (30V RMS):
1. USE ONLY THE TEST LEAD/PROBE SET SUPPLIED WITH THE
AUTOMOTIVE SCOPEMETER TEST TOOL (OR SAFETY-DESIGNED
EQUIVALENTS WITHOUT EXPOSED METAL CONNECTORS).
2. DO NOT USE CONVENTIONAL EXPOSED METAL BNC OR BANANA PLUG
CONNECTORS IF THE GROUND POTENTIAL OF THE AUTOMOTIVE
SCOPEMETER TEST TOOL IS HIGHER THAN 42V PEAK (30V RMS).
3. USE ONLY ONE GROUND CONNECTION TO THE AUTOMOTIVE
SCOPEMETER TEST TOOL (GROUND LEAD OF THE PROBE ON INPUT A).
4. REMOVE ALL PROBES AND TEST LEADS THAT ARE NOT IN USE.
5. USE ONLY THE SUPPLIED PROBE TIP ADAPTERS OR 600V RATED TYPES.
6. CONNECT THE PM8907 POWER ADAPTER TO THE AC OUTLET BEFORE
CONNECTING IT TO THE AUTOMOTIVE SCOPEMETER TEST TOOL.
WARNING
DO NOT USE THE AUTOMOTIVE SCOPEMETER TEST TOOL IN
ENVIRONMENTS WHERE EXPLOSIVE PETROLEUM VAPOR MAY COLLECT
(SUCH AS IN BELOW-GROUND PITS OR WITHIN 18 INCHES ( 45cm) OF THE
FLOOR.)
This instrument contains Nickel Cadmium batteries. Do not
mix with the solid waste stream. Spent batteries should be
disposed of by a qualified recycler or hazardous materials
handler. Contact your authorized Fluke Service Center for
recycling information.
X
Fluke 98
Users Manual
DECLARATION OF CONFORMITY
for
FLUKE 98 Automotive ScopeMeter® Series II
Manufacturer
Fluke Industrial B.V.
Lelyweg 1
7602 EA Almelo
The Netherlands
Statement of Conformity
Based on test results using appropriate standards, the product is in conformity
with
Electromagnetic Compatibility Directive 89/336/EEC
Low Voltage Directive 73/23/EEC
Sample tests
Standards used:
EN 61010-1 (1993)
Safety Requirements for Electrical Equipment
for Measurement, Control, and Laboratory Use
EN 50081-1 (1992)
Electromagnetic Compatibility Generic Emission Standard:
EN55022 and EN60555-2
EN 50082-1 (1992)
Electromagnetic Compatibility Generic Immunity Standard:
IEC801-2, -3, -4, -5
The tests have been performed in a typical configuration.
This Conformity is indicated by the symbol
“Conformité européenne”.
, i.e.
1 - 11
Chapter
1
Introducing your
Automotive ScopeMeter Test Tool
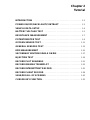
Introducing your Automotive ScopeMeter Test Tool
INTRODUCTION . . . . . . . . . . . . . . . . . . . . . . . . . . . . . . . . . . . . . . . . . . . . 1-3
QUICK TOUR . . . . . . . . . . . . . . . . . . . . . . . . . . . . . . . . . . . . . . . . . . . . . . . 1-4
A Look at the Test Tool . . . . . . . . . . . . . . . . . . . . . . . . . . . . . . . . . . . . . .
Using the Tilt Stand . . . . . . . . . . . . . . . . . . . . . . . . . . . . . . . . . . . . . . . . .
Accessories Overview . . . . . . . . . . . . . . . . . . . . . . . . . . . . . . . . . . . . . . .
Powering the Test Tool . . . . . . . . . . . . . . . . . . . . . . . . . . . . . . . . . . . . . .
Adjusting the Display Contrast . . . . . . . . . . . . . . . . . . . . . . . . . . . . . . . . .
Resetting the Test Tool . . . . . . . . . . . . . . . . . . . . . . . . . . . . . . . . . . . . . .
Performing a Navigation Exercise . . . . . . . . . . . . . . . . . . . . . . . . . . . . . .
1-4
1-5
1-5
1-6
1-7
1-7
1-8
POWER SOURCES . . . . . . . . . . . . . . . . . . . . . . . . . . . . . . . . . . . . . . . . . 1-11
Minimizing Signal Noise . . . . . . . . . . . . . . . . . . . . . . . . . . . . . . . . . . . . . 1-11
CHARGING THE BATTERY . . . . . . . . . . . . . . . . . . . . . . . . . . . . . . . . . 1-12
Saving Battery Life . . . . . . . . . . . . . . . . . . . . . . . . . . . . . . . . . . . . . . . . . 1-12
USING THE KEYS . . . . . . . . . . . . . . . . . . . . . . . . . . . . . . . . . . . . . . . . . . 1-13
Keypad Overview . . . . . . . . . . . . . . . . . . . . . . . . . . . . . . . . . . . . . . . . . . 1-13
Key Descriptions . . . . . . . . . . . . . . . . . . . . . . . . . . . . . . . . . . . . . . . . . . 1-14
READING THE DISPLAY . . . . . . . . . . . . . . . . . . . . . . . . . . . . . . . . . . . . 1-16
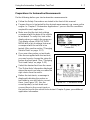
Menu Display and 'ON-LINE HELP' . . . . . . . . . . . . . . . . . . . . . . . . . . . .
Getting Extended Information During Menu Selection . . . . . . . . . . . . . .
Result Display and 'ON-LINE HELP' . . . . . . . . . . . . . . . . . . . . . . . . . . .
Getting Information About the Function Keys During a Running Test . .
1-16
1-16
1-17
1-18
MEASUREMENT CONNECTIONS . . . . . . . . . . . . . . . . . . . . . . . . . . . . 1-19
INPUT A (Red) . . . . . . . . . . . . . . . . . . . . . . . . . . . . . . . . . . . . . . . . . . . .
INPUT B (Grey) . . . . . . . . . . . . . . . . . . . . . . . . . . . . . . . . . . . . . . . . . . .
COM, TRIGGER . . . . . . . . . . . . . . . . . . . . . . . . . . . . . . . . . . . . . . . . . . .
TRIGGER (as single input) . . . . . . . . . . . . . . . . . . . . . . . . . . . . . . . . . . .
COM (as single input) . . . . . . . . . . . . . . . . . . . . . . . . . . . . . . . . . . . . . . .
1-19
1-19
1-19
1-19
1-20
GROUNDING GUIDELINES . . . . . . . . . . . . . . . . . . . . . . . . . . . . . . . . . . 1-21
Problems with Incorrect Grounding . . . . . . . . . . . . . . . . . . . . . . . . . . . . 1-21
Test Tool Grounding for Measurements on the Ignition System . . . . . . 1-22
1-2
Fluke 98
Users Manual
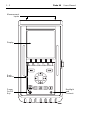
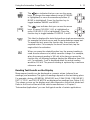
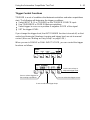
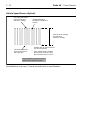
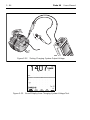
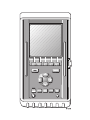
Measurement
Inputs
Display
Push
Buttons
Power
On/Off
Key
Backlight
and
Contrast
Introducing your Automotive ScopeMeter Test Tool
1-3
INTRODUCTION
Your new Fluke Automotive ScopeMeter ® test tool is a powerful instrument with
a wide variety of capabilities.
•
•
•
•
•
Its menu-driven interface has automatic configurations for most of your tests,
so you will find that the test tool is easy to use.
Continuous AUTO RANGE, an exclusive Fluke feature, constantly acquires
and displays the best possible signal.
The secondary ignition pickup and automated ignition functions make it easy
for you to analyze an ignition system malfunction.
The Relative Compression mode helps you quickly find a low compression
cylinder.
The Secondary Ignition Single function displays the waveform along with the
spark voltage, RPM, burn time and burn voltage.
Many problems you will encounter are under a load - on a road test.
•
•
•
•
The Intermittent Record function can find and display such a problem. This
record function can record up to 1280 divisions of continuous information.
The Flight Record function records screen snapshots from 200ms per
division up to full time base speed.
The Plot Readings function allows you to plot up to four different readings of
a signal over time with a single connection.
Min/Max Trendplot continuously monitors the minimum, maximum, and
average value of a signal's readings with time stamp.
The Automotive ScopeMeter test tool has a wide variety of accessories,
designed to enhance the test tool's measurement power.
The optional diesel accessories allows you to set injection pump timing and
rpm with confidence.
The optional 90i-610s Current Probe will let you measure and analyze
electrical system problems quickly and easily.
The optional TR90 Temperature probe makes oil, surface, and air
temperature measurements safe and easy.
Test lead extensions are included for most of your long distance
measurements.
A wide variety of probes and clips are included to make connection to the
vehicle quick and easy. Additional probes are available as accessories,
easily connecting to the test leads.
•
•
•
•
•
Even though your instrument has been designed to configure itself to almost any
test, review the following chapters to find out how easy test and measurement
can be.
1-4
Fluke 98
Users Manual
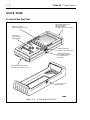
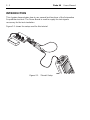
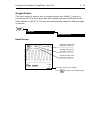
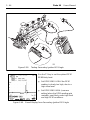
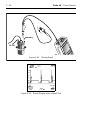
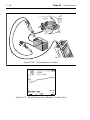
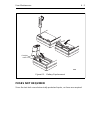
QUICK TOUR
A Look at the Test Tool
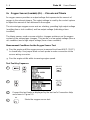
DISPLAY SHOWS
MEASUREMENT RESULT
RECESSED AREA FOR
MEASUREMENTS
CONNECTIONS
(PROBES AND TEST LEADS)
KEYPAD TO
OPERATE THE
INSTRUMENT
CONNECTION FOR
PRINTER OR COMPUTER
CONNECTION FOR
AC POWER ADAPTER
OR AUTOMOTIVE
ADAPTER
BATTERY COMPARTMENT
WITH NiCAD BATTERY PACK
PROTECTIVE
HOLSTER
Figure 1-1. A look at the Test Tool
Introducing your Automotive ScopeMeter Test Tool
Using the Tilt Stand
RELEASE
HERE
Figure 1-2. Tilt Stand
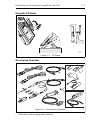
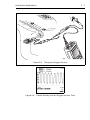
Accessories Overview
Figure 1-3. Accessories Overview
*
Alternative (country dependent) delivery
1-5
1-6
Fluke 98
Users Manual
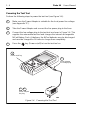
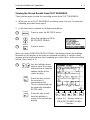
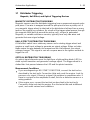
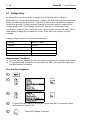
Powering the Test Tool
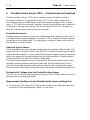
Perform the following steps to power the test tool (see Figure 1-4).
1
Make sure the Power Adapter is suitable for the local power line voltage
(see Appendix 7C).
2
Take the Power Adapter and connect the line power plug to the lines.
3
Connect the low voltage plug to the test tool as shown in Figure 1-4. This
supplies the automotive test tool and charges the internal rechargeable
NiCad Battery Pack. At delivery, the NiCad batteries may be discharged
and must be charged for 16 hours to charge them completely.
4
Press the
key (Power on/off) to turn the test tool on.
4
Power on/off key
3
Power Adapter
low voltage plug
1
2
Power Adapter
line plug
Figure 1-4. Powering the Test Tool
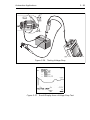
Introducing your Automotive ScopeMeter Test Tool
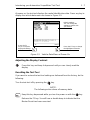
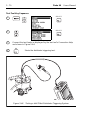
1-7
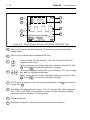
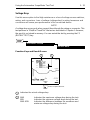
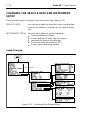
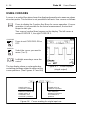
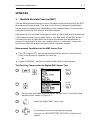
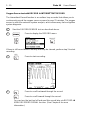
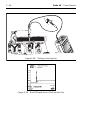
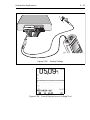
At power on, the test tool displays the model identification data. Press any key to
display the vehicle data menu as shown in Figure 1-5.
Default settings.
You can change the
settings to match with
your vehicle
Press the F1
key to accept the
displayed settings
Press the F5 key to change
the highlighted selection
Figure 1-5. Vehicle Data Menu at Power-On
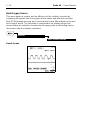
Adjusting the Display Contrast
Press this key and keep it depressed until you can clearly read the
display.
Resetting the Test Tool
If you want to restore the test tool settings as delivered from the factory, do the
following:
Turn the test tool off by pressing the
key.
NOTE:
The following action clears all memory data.
Keep this key depressed while you turn the power on with the
key.
Release the F5 key. You will hear a double beep to indicate that the
Master Reset has been executed.
1-8
Fluke 98
Users Manual
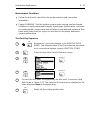
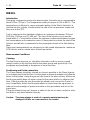
Performing a Navigation Exercise
Subsequently follow steps 1 , 2 , and 3 in Figure 1-6 to select a test via
menu control.
1
2
Open the
Main Menu
Move highlighted
menu option.
Put the highlight
on IGNITION
Information about
highlighted menu option
Pressing the F1 key
returns you to the
last test used. This is
also valid after turning
the power on.
3
Select highlighted menu
option (IGNITION)
Figure 1-6. Selecting IGNITION Menu
Introducing your Automotive ScopeMeter Test Tool
1-9
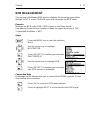
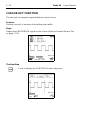
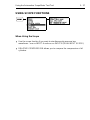
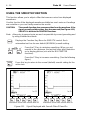
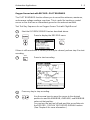
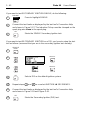
Subsequently follow steps 1 and 2 in Figure 1-7 to select SECONDARY
IGNITION test.
1
Move highlighted
menu option.
Put the highlight
on SECONDARY
2
Select highlighted menu
option (SECONDARY)
Figure 1-7. Selecting SECONDARY Ignition Test
1 - 10
Fluke 98
Users Manual
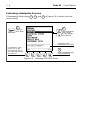
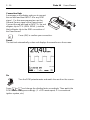
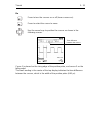
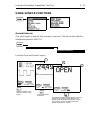
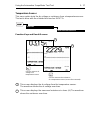
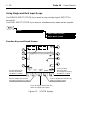
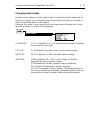
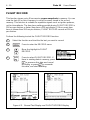
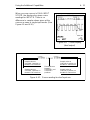
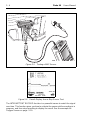
After you have selected the test you want, the display tells you what test leads you
need and how to connect them (See Figure 1-8). This ‘Connection Help’ can be
turned off. See ‘Changing Instrument Setup’ under OPTIONS MENU in Chapter 3.
The inputs to
be used are
highlighted
F1 starts the test
Figure 1-8. Connection Information During Test Selection
Press
to start the test. For this example, it is not necessary to make the
actual connections.
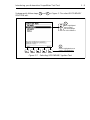
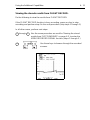
The test tool now runs the secondary ignition parade test. Note that PARADE is
highlighted on the bottom display.
Press the information key
performed.
to display information about the present test being
Introducing your Automotive ScopeMeter Test Tool
1 - 11
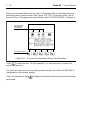
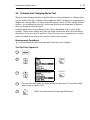
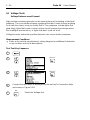
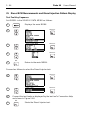
POWER SOURCES
You can power the automotive test
tool from any of the following
sources (refer to Figure 1-9.):
•
•
•
•
•
Internal Battery Pack
(PM9086/011). 1)
This is a rechargeable NiCad
Battery Pack already installed.
Four C Cell batteries can be used
in place of the NiCad Battery
Pack.
These batteries can be used in
combination with one of the
following adapters, but charging
is disabled.
Power Adapter PM8907. 2)
The Power Adapter/Battery
Charger powers the test tool from
Figure 1-9. Powering the Test Tool
a standard ac outlet and charges
the installed PM9086/011 NiCad Battery Pack. The test tool can be used
during battery charging. Verify that your local line voltage is appropriate
before using the Power Adapter/Battery Charger to power the test tool.
Charging Adapter PM9087/002 (optional).
This adapter charges the test tool’s NiCad Battery Pack from a standard 12V
dc cigarette lighter outlet.
Charging Adapter PM9087/021 (optional).
This adapter charges the test tool’s NiCad Battery Pack from a standard 24V
dc cigarette lighter outlet.
1) Refer to Chapter 6 'USER MAINTENANCE' for battery replacement
instructions.
2) Refer to Appendix 7C for information about local versions.
Minimizing Signal Noise
In general, noise pickup is minimized when you use the test tool on its internal
battery power. Using the STL 90 Shielded Test Leads will help in noise rejection.
1 - 12
Fluke 98
Users Manual
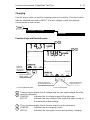
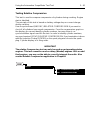
CHARGING THE BATTERY
WARNING
TO AVOID ELECTRICAL SHOCK, USE A BATTERY CHARGER THAT IS
AUTHORIZED FOR USE WITH THE AUTOMOTIVE SCOPEMETER TEST TOOL.
Use the following procedure to charge the battery pack and to power the test
tool:
1. Connect the Power Adapter/Battery Charger to line voltage.
2. Insert the Power Adapter/Battery Charger low voltage plug into the Power
Adapter connector of the test tool. You can now use the test tool while the
NiCad batteries charge slowly. If the test tool is turned off, the batteries
charge more quickly.
During operation, when the batteries are low, a blinking battery symbol
appears on the top right of the display. When this occurs there is about 10
minutes of operating time left.
3. The Power Adapter/Battery Charger uses a trickle charge for the batteries,
so no damage can occur if you leave it charging for long periods, e.g.,
through the weekend. Typically a 16-hour recharge provides the maximum
use of 4 hours.
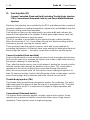
Saving Battery Life
When operated on batteries (no adapter connected), the test tool conserves
power by shutting itself down. If you have not pressed a key for 5 minutes or if
the battery level is too low, the test tool beeps and displays a message. This
message prompts you to turn off the test tool or to continue. If you do not press a
key during the next 5 minutes, the test tool turns itself off automatically.
Automatic power shutdown will not occur during recording.
Introducing your Automotive ScopeMeter Test Tool
1 - 13
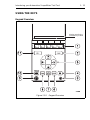
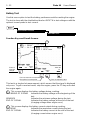
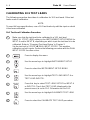
USING THE KEYS
Keypad Overview
Display area for the
Function Key Labels
Figure 1-10. Keypad Overview
1 - 14
Fluke 98
Users Manual
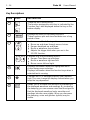
Key Descriptions
ITEM
KEYS
1
to
2
3
DESCRIPTION
These are the Function Keys.
The function assigned to each key is indicated by the
Function Key Label displayed above the key on the
bottom display.
Displays the menu for recording functions.
These functions plot and store test data over a long
period of time.
Performs one of the following actions:
Moves up and down through menu choices.
Ranges amplitude up and down.
Moves a waveform up and down.
Adjusts the trigger level when you are in the
SCOPE function.
•
•
•
•
Performs one of the following actions:
Ranges Time Base up and down.
Moves a waveform right and left.
Moves cursor left and right.
•
•
•
4
Displays information about the highlighted menu
choice during menu selection.
Displays information about the function keys when a
selected test is running.
5
Changes the LCD Backlight intensity (low, medium,
high.) You can change the display contrast when you
keep the key depressed.
6
Allows you to increase and decrease the damping of
the displayed waveform and readings. By increasing
the damping, you can remove noise from the signal so
that the displayed waveform looks smoother and
readings become more stable. When you decrease
the damping, noise and glitches (spikes) may be
visible.
Introducing your Automotive ScopeMeter Test Tool
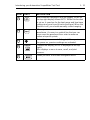
ITEM
KEYS
1 - 15
DESCRIPTION
$ets automatic ranging on and off (toggle). When on,
the top right display shows AUTO. When this function
is set on, it searches for the best range and time base
settings and once found it tracks the signal. When this
function is off, you should manually control ranging.
7
8
Allows you to use cursors for measurements on
waveforms. A cursor is a vertical line that you can
move over the waveform like a ruler to measure
values at specific points.
9
Turns the power on and off (toggle.) When you turn
the power on, previous settings are activated.
10
11
FREEZE
Freezes the display (HOLD is displayed at the top
right).
Also displays a menu to save, recall, and print
screens.
Takes you back to the main navigation menu.
1 - 16
Fluke 98
Users Manual
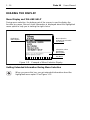
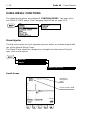
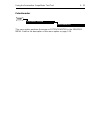
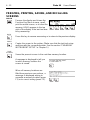
READING THE DISPLAY
Menu Display and 'ON-LINE HELP'
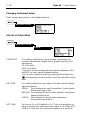
During menu selection, the bottom part of the screen is used to display the
function key menu. Above it, brief information is displayed about the highlighted
menu option to help you in making the right choice.
Highlighted
Menu Option
Menu selection
window lists selectable
test funtions
Information about
highlighted
Menu Option
Function
Key Menu
Figure 1-11. Example of Menu Selection Display
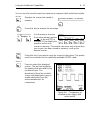
Getting Extended Information During Menu Selection
When you press this key, you get extended information about the
highlighted menu option. See Figure 1-12.
Introducing your Automotive ScopeMeter Test Tool
1 - 17
x
Highlighted menu option
Extended Information
Function
Key Menu
Figure 1-12. Example of Extended Information Display when the i-Key is
pressed during Menu Selection.
BACK
Press this key to return to the menu selection display.
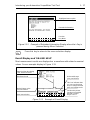
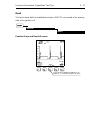
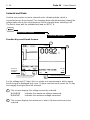
Result Display and 'ON-LINE HELP'
Most measurement results are displayed as a waveform with related numerical
values. See an example display in Figure 1-13.
Numerical Results relating
to the waveform below
Waveform Result
Vertical Range value
5 kV per Division
Menu test selection
Horizontal Range
2 ms per Division
This icon indicates that
you can use the arrow
keys to change the time
base and voltage scale
Function Key Menu.
Functions accessible
through Function
Keys F1 to F5
Figure 1-13. Example of Result Display
1 - 18
Fluke 98
Users Manual
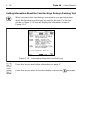
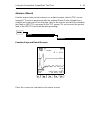
Getting Information About the Function Keys During a Running Test
When you press this key during a running test, you get information
about the function keys that can be used for the test. For the test
shown in Figure 1-13, this will display the information shown in
Figure 1-14.
Figure 1-14. Information About the Function Keys
Press this key to read further information on page 2.
BACK
Press this key to return to the test display or press the
key again.
Introducing your Automotive ScopeMeter Test Tool
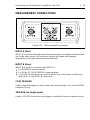
1 - 19
MEASUREMENT CONNECTIONS
Figure 1-15. Measurement Connections
INPUT A (Red)
INPUT A is used for all single channel measurements, sometimes combined with
use of the other inputs. You may need various test leads and adapters,
depending on the type of measurement selected.
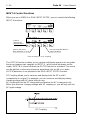
INPUT B (Grey)
INPUT B is used in conjunction with INPUT A:
For ADVANCE measurements.
For DUAL OXYGEN SENSOR measurements.
In SCOPE functions you can use the test tool as a dual trace oscilloscope
with INPUT A and INPUT B connected.
•
•
•
COM, TRIGGER
Used as external trigger for probes with dual banana plugs, such as the RPM90
Inductive Pickup.
TRIGGER (as single input)
Used in SCOPE functions to start (trigger) acquisitions from an external source.
1 - 20
Fluke 98
Users Manual
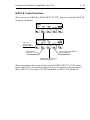
COM (as single input)
Used for safety grounding when the Inductive Pickup or the Secondary Pickup is
connected to the ignition system.
WARNING
TO AVOID ELECTRICAL SHOCK, CONNECT THE COM INPUT OF THE TEST
TOOL TO VEHICLE GROUND BEFORE CLAMPING THE STANDARD
SUPPLIED CAPACITIVE SECONDARY PICKUP OR THE INDUCTIVE
PICKUP ON THE IGNITION WIRES. THIS GROUND CONNECTION IS
REQUIRED IN ADDITION TO THE NORMAL MEASUREMENT GROUND
CONNECTIONS.
For other tests, the COM input should not be connected to engine ground when
the probes have their own ground connection at the probe end. See the following
GROUNDING GUIDELINES.
Introducing your Automotive ScopeMeter Test Tool
1 - 21
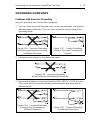
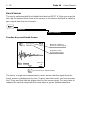
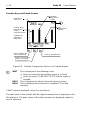
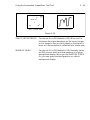
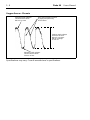
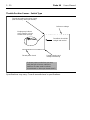
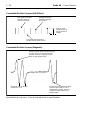
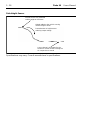
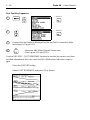
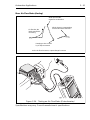
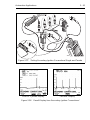
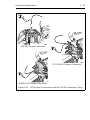
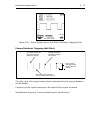
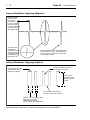
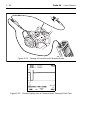
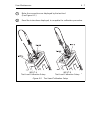
GROUNDING GUIDELINES
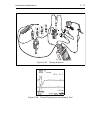
Problems with Incorrect Grounding
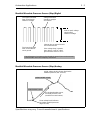
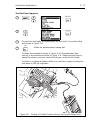
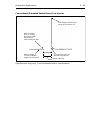
Incorrect grounding can cause various problems:
1. You can create a ground loop when you use two ground leads connected to
different ground potentials. This can cause excessive current through the
grounding leads.
Figure 1-16. Incorrect Grounding:
Ground Loop by Double Grounding
on Different Grounds
Figure 1-17. Correct Grounding:
Shield of Test Lead Connected to
Ground
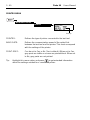
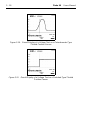
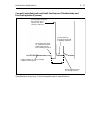
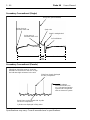
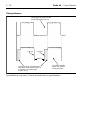
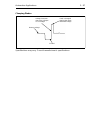
2. Excessive noise shown on the measured signal.
Figure 1-18. Incorrect Grounding:
Noise Pickup on Unshielded Ground Lead
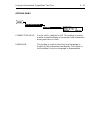
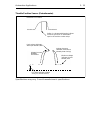
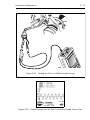
3. Measurement faults or short circuit with the DUAL INPUT SCOPE function.
This occurs when you perform floating measurements with grounding at
different points.
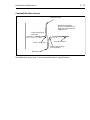
Figure 1-19. Incorrect Grounding:
Shortcircuit by Grounding on
Different Potentials
Figure 1-20. Correct Grounding:
Grounding at One Point
1 - 22
Fluke 98
Users Manual
Test Tool Grounding for Measurements on the Ignition System
For the safe use of the test tool, you must connect the COM input to engine
ground before you perform measurements on the ignition system with the
Secondary Pickup or the Inductive Pickup.
To prevent ground loops, connect all ground leads to the SAME engine ground.
Introducing your Automotive ScopeMeter Test Tool
2 - 23
Chapter
2
Tutorial
INTRODUCTION . . . . . . . . . . . . . . . . . . . . . . . . . . . . . . . . . . . . . . . . . . . . 1-2
POWER ON/OFF/BACKLIGHT/CONTRAST . . . . . . . . . . . . . . . . . . . . 1-3
VEHICLE DATA SETUP . . . . . . . . . . . . . . . . . . . . . . . . . . . . . . . . . . . . . . 1-4
BATTERY VOLTAGE TEST . . . . . . . . . . . . . . . . . . . . . . . . . . . . . . . . . . 1-5
RESISTANCE MEASUREMENT . . . . . . . . . . . . . . . . . . . . . . . . . . . . . . . 1-7
POTENTIOMETER TEST . . . . . . . . . . . . . . . . . . . . . . . . . . . . . . . . . . . . . 1-9
OXYGEN SENSOR TEST . . . . . . . . . . . . . . . . . . . . . . . . . . . . . . . . . . . . 1-11
GENERAL SENSORS TEST . . . . . . . . . . . . . . . . . . . . . . . . . . . . . . . . . 1-13
RPM MEASUREMENT . . . . . . . . . . . . . . . . . . . . . . . . . . . . . . . . . . . . . . 1-15
SECONDARY IGNITION SINGLE ON DIS . . . . . . . . . . . . . . . . . . . . . 1-17
INJECTION TEST . . . . . . . . . . . . . . . . . . . . . . . . . . . . . . . . . . . . . . . . . . 1-19
RECORD PLOT READINGS . . . . . . . . . . . . . . . . . . . . . . . . . . . . . . . . . 1-21
RECORD MIN MAX TRENDPLOT . . . . . . . . . . . . . . . . . . . . . . . . . . . . 1-23
RECORD INTERMITTENT RECORD . . . . . . . . . . . . . . . . . . . . . . . . . . 1-25
RECORD FLIGHT RECORD . . . . . . . . . . . . . . . . . . . . . . . . . . . . . . . . . 1-28
SAVE/RECALL OF SCREENS . . . . . . . . . . . . . . . . . . . . . . . . . . . . . . . 1-30
CURSOR KEY FUNCTION . . . . . . . . . . . . . . . . . . . . . . . . . . . . . . . . . . . 1-32
2-2
Fluke 98
Users Manual
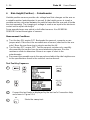
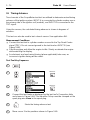
INTRODUCTION
This chapter demonstrates how to use several test functions of the Automotive
ScopeMeter test tool. The Demo Board is used to supply the test signals
necessary for the test simulation.
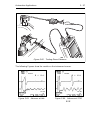
Figure 2-1 shows the setup used for this tutorial.
Figure 2-1. Tutorial Setup
Tutorial
2-3
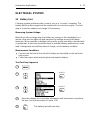
POWER ON/OFF/BACKLIGHT/CONTRAST
POWER ON
Press and release the power on/off key.
The test tool beeps once and turns on. The display shows the test tool
model data. Press any key to continue.
BACKLIGHT
Press and release the backlight key. The display backlight is set to the
minimum intensity.
Press and release the backlight key. The display backlight is set to
medium intensity.
Press and release the backlight key. The display backlight is set to the
maximum intensity.
CONTRAST
Press and hold the backlight key until desired contrast is achieved on the
display.
SWITCHING OFF
Press and release the power on/off key. The test tool turns off.
MASTER RESET
Press and hold F5.
Press and release the power on/off key. Release
. The test tool turns
on and beeps twice. The display shows the opening screen containing the
model data.
Please note that this Master Reset automatically erases all memory data.
Press any key to continue.
2-4
Fluke 98
Users Manual
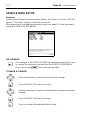
VEHICLE DATA SETUP
Exercise:
Set the Vehicle Data for the test tool as follows: 6 Cylinders, 4 Cycles, 12V, DIS
Ignition. This same "vehicle" is used for the tutorial.
After powering on and after the opening screen (see page 2-3), the instrument
shows the VEHICLE DATA MENU.
NO CHANGES
If no changes to the VEHICLE DATA are necessary, press the F1 key
to confirm the selections and exit from the VEHICLE DATA MENU.
Or you may press
. This has the same effect.
TO MAKE A CHANGE:
Use the arrow keys to select the menu line to change.
Press to SELECT the item to change.
Use the arrow keys to set the variable within the pop-up selection
window.
Press to SELECT the item to change.
Press to confirm the displayed Vehicle Data
Tutorial
2-5
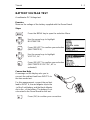
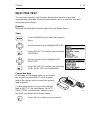
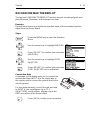
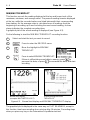
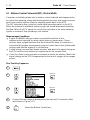
BATTERY VOLTAGE TEST
A multimeter DC Voltage test
Exercise
Measure the voltage of the battery supplied with the Demo Board.
Steps
Press the MENU key to open the selection Menu.
Use the arrow keys to highlight
MULTIMETER.
Press (SELECT) to confirm your selection
(MULTIMETER).
Use the arrow keys to highlight
VOLT DC, AC.
Press (SELECT) to confirm your selection
(MULTIMETER VOLT DC, AC is
activated).
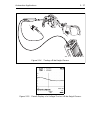
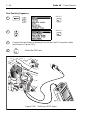
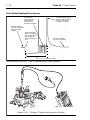
Connection Help
A message on the display asks you to
connect the red test lead from INPUT A to
the item under test.
For this measurement, connect the red test
lead to INPUT A, the red alligator clip to the
+ of the 9 volt battery, and the black alligator
clip to the - of the battery. The battery is not
connected to the Demo Board for this test.
Press (OK) to confirm your connection.
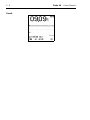
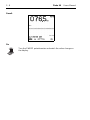
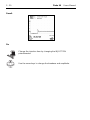
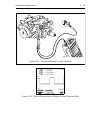
2-6
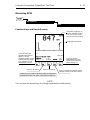
Result
Fluke 98
Users Manual
Tutorial
2-7
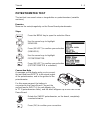
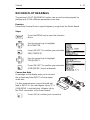
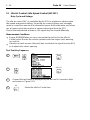
RESISTANCE MEASUREMENT
A Multimeter Resistance measurement.
Exercise
Measure the resistance of the potentiometer on the Demo Board.
Steps
Press MENU key to open the selection Menu.
Use the arrow keys to highlight
MULTIMETER.
Press (SELECT) to confirm your selection
(MULTIMETER).
Use the arrow keys to highlight
OHM/DIODE/CONTINUITY.
Press (SELECT) to confirm your selection
(MULTIMETER OHM is activated).
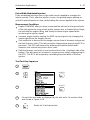
Connection Help
A message on the display asks you to connect
the red test lead to INPUT A and across the
item to be tested.
For this measurement, connect the red test
lead to INPUT A, the red alligator clip to TP 3,
and the black alligator clip to the GND
connection of the Demo Board.
The battery is not connected to the Demo Board.
Press (OK) to confirm your connection.
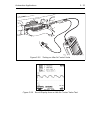
2-8
Fluke 98
Users Manual
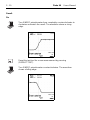
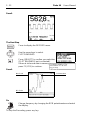
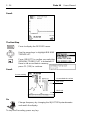
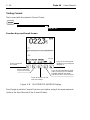
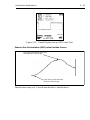
Result
Do
Turn the SWEEP potentiometer and watch the value change on
the display.
Tutorial
2-9
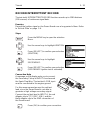
POTENTIOMETER TEST
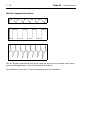
The test tool can reveal noise or irregularities on potentiometers (variable
resistors).
Exercise
Measure the noise/irregularity on the Demo Board potentiometer.
Steps
Press the MENU key to open the selection Menu.
Use the arrow keys to highlight
SENSORS.
Press (SELECT) to confirm your selection
(SENSORS).
Use the arrow keys to highlight
POTENTIOMETER.
Press (SELECT) to confirm your selection
(POTENTIOMETER is activated.)
Connection Help
A message on the display asks you to connect
the test lead from INPUT A to the signal output
of the potentiometer, and to the ground of the
potentiometer.
For this measurement, the battery is
connected to the Demo Board. Connect the
red test lead to INPUT A, the red alligator clip
to TP 3 (potentiometer slider), and the black alligator clip to the GND of the
Demo Board.
Rotate the SWEEP potentiometer, on the board, completely
counterclockwise.
Press (OK) to confirm your connection.
2 - 10
Fluke 98
Users Manual
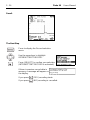
Result
Do
Turn SWEEP potentiometer from completely counterclockwise to
clockwise and watch the result. The waveform shows a rising
edge.
Reset the test tool for a new measurement by pressing
(REPEAT TEST).
Turn SWEEP potentiometer counterclockwise. The waveform
shows a falling edge.
Tutorial
2 - 11
OXYGEN SENSOR TEST
The test tool automatically adjusts for any type of oxygen sensor, automatically
shows the signal output of the sensor, and calculates the Maximum, Average,
and Minimum values.
Exercise
Measure the simulated Oxygen sensor output signal from the Demo Board.
Steps
Press the MENU key to open the selection
Menu.
Use the arrow keys to highlight AIR/FUEL.
Press (SELECT) to confirm your selection
(AIR/FUEL).
Use the arrow keys to highlight OXYGEN
SENSOR.
Press (SELECT) to confirm your selection.
(OXYGEN SENSOR test is activated.)
Connection Help
A message on the display asks you to connect
the blue filter adapter and the red test lead
from INPUT A to the oxygen sensor.
For this measurement, connect the red test
lead to the blue filter adapter on INPUT A, the
red alligator clip to TP 5 (OXYGEN SENS.),
and the black alligator clip to the GND of the
Demo Board.
Press (OK) to confirm your connection.
2 - 12
Fluke 98
Users Manual
Result
Do
Change the RPM potentiometer, and watch the OXYGEN SENS
signal behavior on the display.
Tutorial
2 - 13
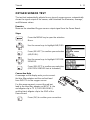
GENERAL SENSORS TEST
The test tool’s General Sensors function optimally displays any signal, varying in
amplitude and frequency.
Exercise
Measure the simulated Hall-Effect sensor output signal from the Demo Board
(GEN.SENS signal).
Steps
Press the MENU key to open the selection
Menu.
Use the arrow keys to highlight
SENSORS.
Press (SELECT) to confirm your selection
(SENSORS).
Use the arrow keys to highlight GENERAL
SENSORS
Press (SELECT) to confirm your selection
(GENERAL SENSORS test is activated.)
Connection Help
A message on the display asks you to connect
the red test lead from INPUT A to the sensor.
For this measurement, connect the red test
lead to INPUT A, the red alligator clip to TP 4
(GEN. SENS.), and the black alligator clip to
the GND connection of the Demo board.
Press (OK) to confirm your connection.
2 - 14
Fluke 98
Users Manual
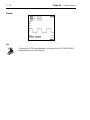
Result
The test tool automatically scales and displays the waveform on the screen.
Do
Turn the RPM potentiometer and watch the result on the screen.
Press the up/down and left/right arrow keys, changing range, and
watch the waveform appearance on the display.
Press the AUTO RANGE key, and the test tool automatically
re-scales the waveform for an optimal display on the screen.
Tutorial
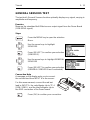
2 - 15
RPM MEASUREMENT
The test tool’s Multimeter RPM function displays the incoming signal either
through INPUT A or the TRIGGER input and calculates the RPM value.
Exercise
Measure the RPM of the GEN. SENS Signal on the Demo board.
Use different Divide factors (number of times the signal is present in 720°,
1 crankshaft revolution = 360°).
Steps
Press the MENU key to open the selection
Menu.
Use the arrow keys to highlight
MULTIMETER.
Press (SELECT) to confirm your selection
(MULTIMETER).
Use the arrow keys to highlight RPM.
Press (SELECT) to confirm your selection
(the RPM function is activated)
Connection Help
A message on the display asks you to connect the RPM90 Inductive Pickup.
Skip making this connection.
Press (OK) to enter the RPM measurement.
Press to highlight INPUT A as the input for the RPM signal.
2 - 16
Fluke 98
Users Manual
Connection Help
A message on the display asks you to connect
the red test lead from INPUT A to any RPM
signal . For this measurement we use the
General Sensor signal of the Demo board.
Connect the red test lead to INPUT A, the red
alligator clip to TP 4 (GEN. SENS.), and the
black alligator clip to the GND connection of
the Demo board.
Press (OK) to confirm your connection.
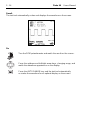
Result
The test tool automatically scales and displays the waveform on the screen.
Do
Turn the RPM potentiometer and watch the result on the screen.
Press
or
and change the dividing factor accordingly. Then watch the
RPM number change accordingly. ( 1 = DIS waste spark; 2 = conventional
ignition system, etc.)
Tutorial
2 - 17
SECONDARY IGNITION SINGLE ON DIS
The test tool’s Ignition function optimally displays the ignition signal and
automatically calculates all relevant ignition parameters, such as spark voltage,
rpm, burn time, and burn voltage.
Exercise
Measure the simulated Secondary DIS Ignition signal from the Demo Board.
For setting DIS, refer to ‘Vehicle Data Setup’ on page 2-4.
Steps
Press the MENU key to open the selection
Menu.
Use the arrow keys to highlight IGNITION.
Press (SELECT) to confirm your selection
(IGNITION).
Use the arrow keys to highlight
SECONDARY.
Press (SELECT) to confirm your selection
(SECONDARY ignition test is activated).
Connection Help
A message on the display asks you to connect
the Secondary Pickup to INPUT A and around
the spark plug wire, and to connect the COM
input to engine ground.
For this measurement we use the red test
lead, since the Demo Board is not able to
generate a High Voltage Secondary Signal.
Connect the red test lead to INPUT A, the red
alligator clip to TP 2 (SEC. IGN.), and the
black alligator clip to the GND connection of
the Demo board.
Press (OK) to confirm your connection.
2 - 18
Fluke 98
Users Manual
Result
Do
Press (FAST UPDATE) to increase the update speed of the
screen. Note that the readings will disappear.
Use the arrow keys to change amplitude and time base.
Press Auto Range to select the default setting again.
Tutorial
2 - 19
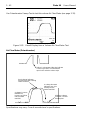
INJECTION TEST
The test tool’s Injection test function displays the injection signal and
automatically calculates all relevant parameters, such as injection time and
maximum peak voltage.
Exercise
Measure the simulated injection signal from the Demo Board.
Steps
Press the MENU key to open the selection
Menu.
Use the arrow keys to highlight AIR/FUEL.
Press (SELECT) to confirm your selection
(AIR/FUEL).
Use the arrow keys to highlight FUEL
INJECTOR.
Press (SELECT) to confirm your selection
(FUEL INJECTOR test is activated).
Connection Help
A message on the display asks you to connect
the red test lead from INPUT A to the signal
wire of the injector and to connect the ground
lead to ground.
For this measurement, connect the red test
lead to INPUT A, the red alligator clip to TP 1
(INJECTION), and the black alligator clip to
the GND connection of the Demo board.
Press (OK) to confirm your connection.
2 - 20
Fluke 98
Users Manual
Result
Do
Change the injection time by changing the INJECTION
potentiometer.
Use the arrow keys to change the timebase and amplitude.
Tutorial
2 - 21
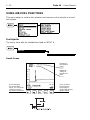
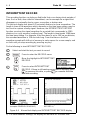
RECORD PLOT READINGS
The test tool’s PLOT READINGS function can record incoming signals by
plotting up to FOUR different parameters over time.
Exercise
Record the General Sensor signal frequency range from the Demo Board.
Steps
Press the MENU key to open the selection
Menu.
Use the arrow keys to highlight
MULTIMETER.
Press (SELECT) to confirm your selection
(MULTIMETER).
Use the arrow keys to highlight
FREQUENCY.
Press (SELECT) to confirm your selection
(FREQUENCY test is activated).
Connection Help
A message on the display asks you to connect
the red test lead from INPUT A to the signal
under test.
For this measurement, connect the red test
lead to INPUT A, the red alligator clip to TP 4
(GEN.SENS.), and the black alligator clip to
the GND connection of the Demo board.
Press (OK) to confirm your connection.
2 - 22
Fluke 98
Users Manual
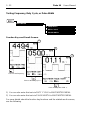
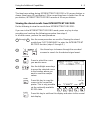
Result
The Next Step
Press to display the RECORD menu.
Use the arrow keys to select
PLOT READINGS.
Press (SELECT) to confirm your selection
(PLOT READINGS test is activated).
If there is old record data in memory,
press F1 (YES) to continue.
Result
Max Scale
Present value
Min Scale
Do
Change frequency by changing the RPM potentiometer and watch
the display.
To stop the Recording, press any key.
Tutorial
2 - 23
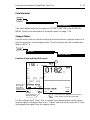
RECORD MIN MAX TRENDPLOT
The test tool’s MIN MAX TRENDPLOT function records incoming signals and
plots Minimum, Maximum, and Average over time.
Exercise
Record the minimum and maximum injection times of the simulated injection
signal from the Demo Board.
Steps
Press the MENU key to open the selection
Menu.
Use the arrow keys to highlight AIR/FUEL.
Press (SELECT) to confirm your selection
(AIR/FUEL).
Use the arrow keys to highlight FUEL
INJECTOR.
Press (SELECT) to confirm your selection
(FUEL INJECTOR test is activated).
Connection Help
A message on the display asks you to connect the
red test lead from INPUT A to the signal wire of
the injector and to connect the ground lead to the
vehicle ground.
For this measurement, connect the red test lead
to INPUT A, the red alligator clip to TP 1
(INJECTION), and the black alligator clip to the
GND connection of the Demo board.
Press (OK) to confirm your connection.
2 - 24
Fluke 98
Users Manual
Result
The Next Step
Press to display the RECORD menu.
Use the arrow keys to highlight MIN MAX
TRENDPLOT.
Press (SELECT) to confirm your selection
(MIN MAX TREND PLOT is activated). If
there is old record data in memory,
press F1 (YES) to continue.
Result
Present reading
Accumalated time of test
Max Scale
Min Scale
Do
Change frequency by changing the INJECTION potentiometer
and watch the display.
To stop the Recording, press any key.
Tutorial
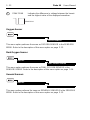
2 - 25
RECORD INTERMITTENT RECORD
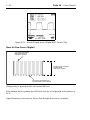
The test tool’s INTERMITTENT RECORD function records up to 1280 divisions
(128 screens) of continuous signal data.
Exercise
Record the Ignition signal on the Demo Board over a long period of time. Refer
to ‘Vehicle Data’ on page 2-4.
Steps
Press the MENU key to open the selection
Menu.
Use the arrow keys to highlight IGNITION.
Press (SELECT) to confirm your selection
(IGNITION).
Use the arrow keys to highlight
SECONDARY.
Press (SELECT) to confirm your selection
(SECONDARY ignition test is activated).
Connection Help
A message on the display asks you to connect
the Secondary Pickup to INPUT A and around
the Spark Plug Wire. The test tool’s COM input
must be connected to the engine ground.
For this measurement we use the red test
lead, since the Demo Board is not able to
generate a high voltage secondary signal.
Connect the red test lead to INPUT A, the red
alligator clip to TP 2 (SEC. IGN.), and the
black alligator clip to the GND connection of
the Demo board.
Press (OK) to confirm your connection.
2 - 26
Fluke 98
Result
The Next Step
Press to display the Record selection
menu.
Use the arrow keys to highlight
INTERMITTENT RECORD.
Press (SELECT) to confirm your selection
(INTERMITTENT RECORD is activated).
If there is previous record data in
memory, a message will appear on
the display.
If you press
(YES) recording starts.
If you press
(NO) recording is cancelled.
Users Manual
Tutorial
2 - 27
Do
To stop the Recording, press any key.
Press
and
to step back and forth through the recorded screens.
Press
to return to the normal test mode.
2 - 28
Fluke 98
Users Manual
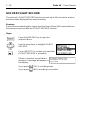
RECORD FLIGHT RECORD
The test tool’s FLIGHT RECORD function records up to 40 successive screens
that have been displayed from start recording.
Exercise
Record the simulated ignition signal from the Demo Board (still connected from
the previous exercise) with the FLIGHT RECORD function.
Steps
Press the RECORD key to open the
selection Menu.
Use the arrow keys to highlight FLIGHT
RECORD.
Press (SELECT) to confirm your selection
(FLIGHT RECORD is activated.).
If there is previous record data in
memory, a message will appear on
the display.
If you press
(YES), recording starts.
If you press
(NO), recording is cancelled.
Tutorial
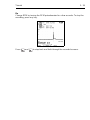
2 - 29
Do
Change RPM by turning the RPM potentiometer for a few seconds. To stop the
recording, press any key.
Press
and
to step back and forth through the recorded screens.
2 - 30
Fluke 98
Users Manual
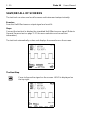
SAVE/RECALL OF SCREENS
The test tool can store and recall screens and instrument setups instantly.
Exercise
Save the Hall-Effect sensor output signal and recall it.
Steps
Connect the test tool to display the simulated Hall-Effect sensor signal (Refer to
General Sensors test on page 2-13 for menu selection and connection
information).
The test tool automatically scales and displays the waveform on the screen.
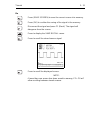
The Next Step
Press to freeze the signal on the screen. HOLD is displayed on
the top right.
Tutorial
2 - 31
Do
Press (SAVE SCREEN) to save the current screen into memory.
Press (OK) to confirm the saving of the signal in the memory.
Disconnect the signal and press F1 (Back). The signal will
disappear from the screen.
Press to display the SAVE RECALL menu.
Press to recall the stored sensor signal.
Press to recall the displayed screen.
NOTE:
If more than one screen has been saved in memory, F2 + F3 will
allow scrolling between stored screens.
2 - 32
Fluke 98
Users Manual
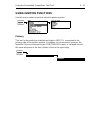
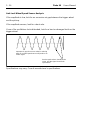
CURSOR KEY FUNCTION
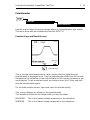
The test tool can measure signal details by using Cursors.
Exercise
Use the cursor(s) to measure the positive pulse width.
Steps
Display the GEN.SENSOR signal on the screen (Refer to General Sensor Test
on page 2-13)
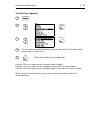
The Next Step
Press to display the CURSORS function key menu.
Tutorial
2 - 33
Do
Press to turn the cursors on or off (leave cursors on).
Press to select the cursor to move.
Use the arrow keys to position the cursors as shown in the
following screen.
Time difference
between the cursors
Cursor 1 is placed on the rising edge of the positive pulse, and cursor 2 on the
falling edge.
The lower reading in the center of the top display indicates the time difference
between the cursors, which is the width of the positive pulse (660 2s).
Chapter3 -31
Using the Automotive ScopeMeter Test Tool
Using the Automotive ScopeMeter Test Tool
INTRODUCTION . . . . . . . . . . . . . . . . . . . . . . . . . . . . . . . . . . . . . . . . . . . . 3-3
Probes and Test Leads . . . . . . . . . . . . . . . . . . . . . . . . . . . . . . . . . . . . . . 3-3
Preparations for Automotive Measurements . . . . . . . . . . . . . . . . . . . . . . 3-7
MENU OVERVIEW . . . . . . . . . . . . . . . . . . . . . . . . . . . . . . . . . . . . . . . . . . . 3-8
Navigating the Menu . . . . . . . . . . . . . . . . . . . . . . . . . . . . . . . . . . . . . . . . 3-9
Using the Function Keys . . . . . . . . . . . . . . . . . . . . . . . . . . . . . . . . . . . . 3-10
Examples of Function Key Labels . . . . . . . . . . . . . . . . . . . . . . . . . . . . . 3-10
Reading Test Results on the Display . . . . . . . . . . . . . . . . . . . . . . . . . . . 3-11
USING SENSOR FUNCTIONS . . . . . . . . . . . . . . . . . . . . . . . . . . . . . . . 3-13
General Sensors . . . . . . . . . . . . . . . . . . . . . . . . . . . . . . . . . . . . . . . . . .
Oxygen Sensor . . . . . . . . . . . . . . . . . . . . . . . . . . . . . . . . . . . . . . . . . . . .
Dual Oxygen Sensor . . . . . . . . . . . . . . . . . . . . . . . . . . . . . . . . . . . . . . .
Temperature Sensor . . . . . . . . . . . . . . . . . . . . . . . . . . . . . . . . . . . . . . .
Knock Sensor . . . . . . . . . . . . . . . . . . . . . . . . . . . . . . . . . . . . . . . . . . . . .
Potentiometer . . . . . . . . . . . . . . . . . . . . . . . . . . . . . . . . . . . . . . . . . . . . .
3-13
3-15
3-16
3-17
3-18
3-19
USING AIR/FUEL FUNCTIONS . . . . . . . . . . . . . . . . . . . . . . . . . . . . . . 3-20
Fuel Injector . . . . . . . . . . . . . . . . . . . . . . . . . . . . . . . . . . . . . . . . . . . . . .
Potentiometer . . . . . . . . . . . . . . . . . . . . . . . . . . . . . . . . . . . . . . . . . . . . .
Stepper Motor . . . . . . . . . . . . . . . . . . . . . . . . . . . . . . . . . . . . . . . . . . . . .
Oxygen Sensor . . . . . . . . . . . . . . . . . . . . . . . . . . . . . . . . . . . . . . . . . . . .
Dual Oxygen Sensor . . . . . . . . . . . . . . . . . . . . . . . . . . . . . . . . . . . . . . .
General Sensors . . . . . . . . . . . . . . . . . . . . . . . . . . . . . . . . . . . . . . . . . .
3-20
3-21
3-21
3-22
3-22
3-22
USING IGNITION FUNCTIONS . . . . . . . . . . . . . . . . . . . . . . . . . . . . . . . 3-23
Primary . . . . . . . . . . . . . . . . . . . . . . . . . . . . . . . . . . . . . . . . . . . . . . . . . .
Secondary . . . . . . . . . . . . . . . . . . . . . . . . . . . . . . . . . . . . . . . . . . . . . . .
Advance . . . . . . . . . . . . . . . . . . . . . . . . . . . . . . . . . . . . . . . . . . . . . . . . .
Dwell . . . . . . . . . . . . . . . . . . . . . . . . . . . . . . . . . . . . . . . . . . . . . . . . . . . .
3-23
3-25
3-26
3-27
USING DIESEL FUNCTIONS . . . . . . . . . . . . . . . . . . . . . . . . . . . . . . . . 3-28
Diesel injector . . . . . . . . . . . . . . . . . . . . . . . . . . . . . . . . . . . . . . . . . . . . . 3-28
Advance (Diesel) . . . . . . . . . . . . . . . . . . . . . . . . . . . . . . . . . . . . . . . . . . 3-29
3-2
Fluke 98
Users Manual
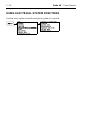
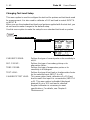
USING ELECTRICAL SYSTEM FUNCTIONS . . . . . . . . . . . . . . . . . . 3-30
Charging . . . . . . . . . . . . . . . . . . . . . . . . . . . . . . . . . . . . . . . . . . . . . . . .
Battery Test . . . . . . . . . . . . . . . . . . . . . . . . . . . . . . . . . . . . . . . . . . . . . .
Potentiometer . . . . . . . . . . . . . . . . . . . . . . . . . . . . . . . . . . . . . . . . . . . .
Solenoid and Diode . . . . . . . . . . . . . . . . . . . . . . . . . . . . . . . . . . . . . . . .
Voltage Drop . . . . . . . . . . . . . . . . . . . . . . . . . . . . . . . . . . . . . . . . . . . . .
Stepper Motor . . . . . . . . . . . . . . . . . . . . . . . . . . . . . . . . . . . . . . . . . . . .
3-31
3-32
3-33
3-34
3-35
3-36
USING SCOPE FUNCTIONS . . . . . . . . . . . . . . . . . . . . . . . . . . . . . . . . 3-37
When Using the Scope . . . . . . . . . . . . . . . . . . . . . . . . . . . . . . . . . . . . .
Using Single and Dual Input Scope . . . . . . . . . . . . . . . . . . . . . . . . . . . .
Making an Easy Setup . . . . . . . . . . . . . . . . . . . . . . . . . . . . . . . . . . . . .
INPUT A Control Functions . . . . . . . . . . . . . . . . . . . . . . . . . . . . . . . . . .
INPUT B Control Functions . . . . . . . . . . . . . . . . . . . . . . . . . . . . . . . . . .
Single-Shot Function . . . . . . . . . . . . . . . . . . . . . . . . . . . . . . . . . . . . . . .
Trigger Control Functions . . . . . . . . . . . . . . . . . . . . . . . . . . . . . . . . . . .
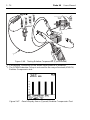
Testing Relative Compression . . . . . . . . . . . . . . . . . . . . . . . . . . . . . . . .
3-37
3-38
3-39
3-40
3-41
3-42
3-43
3-45
USING MULTIMETER FUNCTIONS . . . . . . . . . . . . . . . . . . . . . . . . . . 3-47
Making Connections . . . . . . . . . . . . . . . . . . . . . . . . . . . . . . . . . . . . . . .
Testing Volt DC, AC . . . . . . . . . . . . . . . . . . . . . . . . . . . . . . . . . . . . . . .
Testing Resistance, Continuity, and Diode . . . . . . . . . . . . . . . . . . . . . .
Measuring RPM . . . . . . . . . . . . . . . . . . . . . . . . . . . . . . . . . . . . . . . . . . .
Testing Frequency, Duty Cycle, or Pulse Width . . . . . . . . . . . . . . . . . .
Testing Current . . . . . . . . . . . . . . . . . . . . . . . . . . . . . . . . . . . . . . . . . . .
Testing Temperature . . . . . . . . . . . . . . . . . . . . . . . . . . . . . . . . . . . . . . .
3-47
3-48
3-49
3-51
3-52
3-54
3-55
CHANGING THE VEHICLE DATA AND INSTRUMENT SETUP . . 3-56
Setup Overview . . . . . . . . . . . . . . . . . . . . . . . . . . . . . . . . . . . . . . . . . . .
Changing Vehicle Data . . . . . . . . . . . . . . . . . . . . . . . . . . . . . . . . . . . . .
Changing Instrument Setup . . . . . . . . . . . . . . . . . . . . . . . . . . . . . . . . . .
Changing Test Lead Setup . . . . . . . . . . . . . . . . . . . . . . . . . . . . . . . . . .
3-56
3-57
3-58
3-62
Using the Automotive ScopeMeter Test Tool
3-3
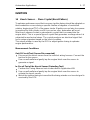
INTRODUCTION
This section provides general information for automotive measurements with the
test tool.
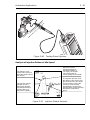
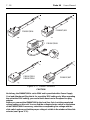
Probes and Test Leads
The test tool displays information about the type of probe to use (referred to as
Connection Help) before you enter a new test. In addition, Chapter 5 'Automotive
Applications' depicts the required connections and the use of probes, test leads,
and adapters for each application.
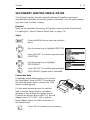
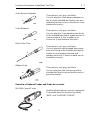
Overview of the Standard Set of Probes, Test Leads, and Test Lead
Adapters
STL 90 Shielded Test Leads
Red and grey, with ground leads.
For general purpose use (1:1).
Connected to BNC inputs (red INPUT A
and grey INPUT B.)
BNC Extension Leads
Two pieces, black.
Used for the extension of the Shielded
Test Leads.
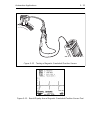
PM9096/101 Secondary Pickup
(Europe only)
Used for secondary ignition tests.
Connected to INPUT A.
3-4
Fluke 98
Users Manual
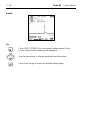
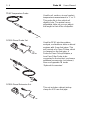
AP 90 Secondary Pickup
with HEI plates
Used for secondary ignition tests.
Ground lead connected to engine
ground.
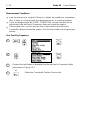
RPM 90 Inductive Pickup
Used as trigger synchronization for
conventional ignition systems (with
distributor) and for RPM measurements
on spark leads.
Connected to COM and TRIGGER
inputs.
Ground Lead (black).
Used to connect the test tool COM input
to the engine ground.
This is necessary for safety reasons on
all IGNITION tests.
The ground lead has 4-mm shrouded
banana plugs at each end.
Ground Lead Extension (black).
The ground lead extension has a 4-mm
banana jack at one end and a 4-mm
banana plug at the other end.
Filter Adapter.
2x
Used for oxygen sensor tests to provide
10 M://3.5pF input impedance. This
low-pass Filter Adapter eliminates noise
over 4 kHz.
One side of the adapter is connected to
INPUT A or B, the other side is used to
connect the shielded test lead.
Using the Automotive ScopeMeter Test Tool
3-5
-mm Banana Adapters
Three pieces, red, grey, and black.
You can plug the 4-mm banana adapter on
the tip of the shielded test lead for use as a
(exposed) test tip, or for connection to 4-mm
breakout box jacks.
3x
2-mm Adapters
Three pieces, red, grey, and black.
You can plug the 2-mm adapter onto the tip
of the shielded test lead to enable access to
narrow contacts (2-mm or wider) or to
connect to 2-mm breakout box jacks.
3x
Back Probe Pins
3x
Three pieces, red, grey, and black.
You can plug the spring loaded back probe
pins onto the tip of the shielded test lead to
enable access between the wire and
weather pack seal. Contact is made on the
shielded connector
Alligator Clips
3x
Three pieces, red, grey, and black.
You can plug the clips onto the tip of the
shielded test lead or ground lead for test or
ground terminals.
Overview of Optional Probes and Probe Accessories
90i-610s Current Probe
Used for all tests where current is measured.
These tests have the function key labels
"AMP" and "CURRENT PROBE".
3-6
Fluke 98
Users Manual
%R90 Temperature Probe
Used for oil, surface, air and coolant
temperature measurement in qC or qF.
This probe fits in the vehicle oil
dipstick hole. The probe has an
adjustable slider so you can adjust
the length to that of the oil dipstick.
DPS90 Diesel Probe Set
Used for RPM, injection pattern
analysis, and advance tests on diesel
engines with 6 mm fuel pipes. This
set consists of a Piezo Pickup, which
is clamped on the fuel pipe, a
Probe-to-Piezo Pickup Adapter, a
Low Pass Filter Probe to be
connected to the test tool, and some
additional accessories (not shown).
Also see Appendix 7B under
’Optional Accessories’.
DPE90 Diesel Extension Set
This set includes a diesel pickup
clamp for 4.55 mm fuel pipe.
Using the Automotive ScopeMeter Test Tool
3-7
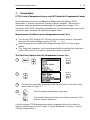
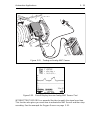
Preparations for Automotive Measurements
Do the following before you start automotive measurements:
•
•
Follow the Safety Precautions as stated in the front of this manual.
•
Make sure that the test tool settings
correspond with the data of the vehicle
to be tested. To verify this, look at the
display when you switch the power on.
The display shows VEHICLE DATA
MENU with a list of settings that must
correspond with the vehicle to be
tested. (Also see the section "Changing
Vehicle Data" on page 3-57)
Prepare the car to be tested for the desired measurement, e.g. warm up the
engine. In Chapter 5 "Automotive Applications" you can find the conditions
required for each application.
Figure 3-1. Display at
Power-On.
•
If you use other probes or test leads
than those supplied with the test tool,
you may have to change the setup for
probes and test leads. (See "Changing
Test Lead Setup" on page 3-62)
•
Select the desired test from the menu.
The 'Online Help' information displayed
above the menu can help you make the
right choice from the menu.
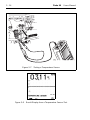
•
Before the test starts, a message is
displayed indicating the probes or
test leads to use and how to connect
Figure 3-2. Connection Help.
them, (see Figure 3.2). Use the
correct probe(s) or test leads and
connect them to the correct input on
the test tool and to the vehicle to be tested. Chapter 5 gives you additional
application information.
3-8
Fluke 98
Users Manual
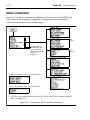
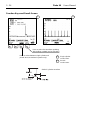
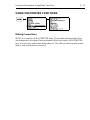
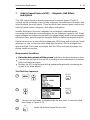
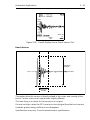
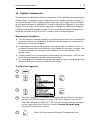
MENU OVERVIEW
Figure 3.3 shows an overview of available test functions from the MENU key.
The menu choices represent categories of applications that are listed in
sub-menus as shown in the following figure.
See
Note 1
See the section
“CHANGING THE
VEHICLE DATA
AND INSTRUMENT
SETUP” on
page 3-56
See
Note 2
Note 1: For DIESEL *) this menu is as follows
Note 2: For DIESEL *) this menu is as follows
*)
DIESEL can be selected via the VEHICLE DATA menu (see "Changing Vehicle
Data" on page 3-57
Figure 3-3. Automotive Test Functions Overview.
Using the Automotive ScopeMeter Test Tool
3-9
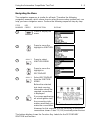
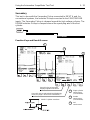
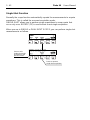
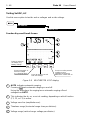
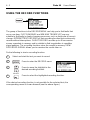
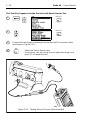
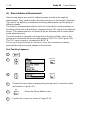
Navigating the Menu
The navigation sequence is similar for all tests. Therefore the following
navigation example, which shows how to select the secondary ignition test, can
help you learn navigate a menu. Perform the following sequence step by step.
STEP
KEY
NUMBER PRESS
DESCRIPTION
1
Press to display the
menu
2
Press to move the
highlight to IGNITION
3
SELECT
Press to select
IGNITION MENU
Press to move the
highlight to
SECONDARY
4
5
DISPLAY
SELECT
Select SECONDARY
from the IGNITION
MENU.
Before the selected
test starts running,
information about the
required connections
is displayed.
OK
6
If you were performing
an actual ignition test,
the connection information would help you
make the connections. Figure 3-4. Connection Help Screen
However, for this example, it is not necessary to make the
connections shown. Press F1 (OK) to actually enter the test.
The bottom display shows the Function Key Labels for the SECONDARY
IGNITION test function.
3 - 10
Fluke 98
Users Manual
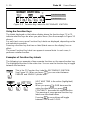
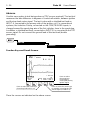
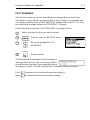
Function Key Labels
Function Keys
Figure 3-5. Function Key Labels for SECONDARY IGNITION.
Using the Function Keys
The labels displayed on the bottom display above the function keys F1 to F5,
indicate what the keys do when you press them. (See the example in Figure 3.5
above.)
For each test, one or more Function Key Labels are displayed, depending on the
sub-selections possible.
Pressing a function key that has no label (blank area on the display) has no
effect.
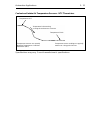
The same Function Key Label can appear in several tests. In each case, it
performs a similar function.
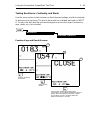
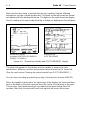
Examples of Function Key Labels
The following is an example of two separate functions on the same function key.
The highlighted function is the active one. You can use the function key to toggle
between the functions.
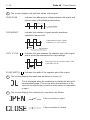
This is the F3 Function Key Label for SECONDARY IGNITION.
See Figure 3.5. When you press
,you can select between
PARADE and SINGLE cylinder test.
VOLT AND TIME is the active (highlighted)
function.
When you press
, OHM becomes the
active function.When you press
,
CONTINUITY becomes the active function.
The meaning of some general function key
labels are described below.
Pressing
a second time will toggle
between OPEN and CLOSE.
Using the Automotive ScopeMeter Test Tool
3 - 11
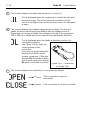
%he
icon indicates that you can use the arrow
keys to change the measurement range (if RANGE
is highlighted) or move the waveform position (if
MOVE is highlighted). Press the function key to
toggle between RANGE and MOVE.
The
icon indicates that you can use the arrow
keys to move CURSOR 1 (if 1 is highlighted) or
move CURSOR 2 (if 2 is highlighted). Press the
function key to toggle between CURSOR 1 and 2.
This label is displayed for tests that perform single measurements,
for example the knock sensor and the potentiometer sweep test.
To repeat the test, press the function key, then perform the
required action. For example, the knock sensor test, tap the
engine block for activation.
When you press the related function key, the present reading is
used as zero reference to (delta) measure change. For example,
when the present reading is 100 mV at the time you press the
function key, all following readings display the difference from 100
mV. For example, 5 mV is displayed when the actual reading
would be 105 mV. The present reading is replaced by a new zero
reference value.
Reading Test Results on the Display
Measurement results can be displayed as numeric values (referred to as
readings) and waveform.The types of readings depend on the test taking place.
For example, during a GENERAL SENSORS test, PEAK-PEAK, FREQUENCY,
DUTY CYCLE, and PULSE WIDTH are displayed as readings (see Figure 3-6.).
The values you see on the display most often depend on the vehicle under test.
Refer to the Service Manual of the vehicle manufacturer. In Chapter 5
"Automotive Applications" you can find typical results of certain applications.
3 - 12
Fluke 98
Users Manual
x
1
5
2
6
7
3
4
8
Figure 3-6. Result Display from the GENERAL SENSORS Test.
1
Zero line for the horizontal timebase. This point in time represents the
trigger event.
2
Zero line for vertical signal amplitude (0V line.)
3
4
Vertical range (2V per division). You can change this with the
up/down arrow keys.
Notice when you do so that automatic ranging is turned off. See
to reactivate automatic ranging.
5 . Press
Horizontal timebase range (500 Ps per division). You can change
this with the left/right arrow keys.
Notice when you do so that automatic ranging is turned off. See
to reactivate automatic ranging.
5 . Press
5
AUTOmatic ranging is on for both horizontal timebase (see 4 ) and vertical
range (see 3 ).
6
Readings calculated from the signal. The F1 Function Key Label indicates
that a VOLT and TIME measurement is active. So the following readings
represent either a voltage or a timing value.
7
Signal waveform.
8
Graticule. Graticules mark the horizontal and vertical divisions.
Using the Automotive ScopeMeter Test Tool
3 - 13
USING SENSOR FUNCTIONS
General Sensors
This menu option is used to test a variety of sensors. The test is done with the
shielded test lead on INPUT A.
SENSORS
GENERAL SENSORS
Function Keys and Result Screens
1
2
3
Used to measure volt
and time values of the
signal
Used to measure
resistance
Used to test whether a connection is open or
closed. If you select OPEN, the test tool
beeps when the tested connection is open.
If you select CLOSE, it beeps when the
tested connection is closed.
3 - 14
1
Fluke 98
Users Manual
%his screen displays volt and time values of the signal.
PEAK-PEAK
Indicates the difference in voltage between the lowest and
highest value of the displayed waveform.
PEAK-PEAK
FREQUENCY
Indicates the number of signal periods (waveform
repetitions) per second.
Signal period = 20 ms = 0.02s
Frequency = 1 / 0.02 = 50 Hz
Signal period
DUTY CYCLE
Indicates the ratio between the negative part of the signal
and its period time expressed as a percentage.
Duty cycle = 15 ms / 20 ms x 100% = 75%
Pulse with = 15 ms
PULSE WIDTH
2
Indicates the width of the negative part of the signal.
This screen displays the measured resistance in ohms (:).
This is displayed when the resistance is outside the test tool's
measurement range. This occurs when the resistance of the
sensor is too high or the connection to the sensor is interrupted
or open.
3
This screen displays the continuity of a connection as follows:
If the connection is open.
If the connection is closed.
Using the Automotive ScopeMeter Test Tool
3 - 15
Oxygen Sensor
This menu option is used to test an oxygen sensor also called O2 sensor or
Lambda sensor.The test is done with the shielded test lead connected via the
Filter Adapter on INPUT A. The test tool automatically adapts for different types
of sensors.
SENSORS
OXYGEN SENSOR
Result Screen
Maximum value of the
displayed waveform.
Average value of the
displayed waveform.
Minimum value of the
displayed waveform.
Use the arrow keys for ranging.
Press
to return to the default range.
3 - 16
Fluke 98
Users Manual
Dual Oxygen Sensor
This menu option is used to test the efficiency of the catalytic converter by
comparing the signals from the oxygen sensor before and after the converter.
Both STL90 probes are used, each connected via a blue filter adapter on the test
tool’s input A and B. The red probe is connected to the leading sensor (the
sensor before the catalytic converter) and the grey probe to the trailing sensor
(the sensor after the catalytic converter).
SENSORS
DUAL OXYGEN SENSOR
Result Screen
Using the Automotive ScopeMeter Test Tool
3 - 17
Temperature Sensor
This menu option tests the dc voltage or resistance from a temperature sensor.
The test is done with the shielded test lead on INPUT A.
SENSORS
TEMPERATURE SENSOR
Function Keys and Result Screens
1
2
Used to measure dc
voltage on a
temperature sensor.
Used to measure the resistance
of a temperature sensor (sensor disconnected).
1
This screen displays the dc voltage from the temperature sensor.
The waveform shows the dc voltage over time.
2
This screen displays the measured resistance in ohms (:).The waveform
shows the resistance over time.
3 - 18
Fluke 98
Users Manual
Knock Sensor
The test is performed with the shielded test lead on INPUT A. After you enter the
test, tap the engine block close to the sensor or the sensor itself with a mallet to
get a signal from the knock sensor.
SENSORS
KNOCK SENSOR
Function Keys and Result Screen
Maximum voltage of
the knock sensor signal.
Frequency of the
knock sensor signal.
Press this key to repeat the test.
The test is a single shot measurement, which means that the signal from the
knock sensor is displayed only once. To get a new test result, you have to press
the F3-key and then tap the engine block or the sensor again. You may have to
readjust the vertical range with the arrow keys to get an optimal waveform.
Using the Automotive ScopeMeter Test Tool
3 - 19
Potentiometer
SENSORS
POTENTIOMETER
Use this menu option to test the voltage output of a potentiometer type sensor.
The test is done with the shielded test lead on INPUT A.
Function Keys and Result Screen
Press this key.
This is a single-shot measurement, which means that the signal from the
potentiometer is displayed once. Turn the potentiometer slider from full counter
clockwise to full clockwise or from full clockwise to full counter clockwise to get
result display. To get a new test result, you have to press the F3-key and then
turn the potentiometer again.
On a throttle position sensor, open and close the throttle quickly.
This screen displays dc voltage on the potentiometer.
The waveform shows the dc voltage while you turn the slider.
MAXIMUM
MINIMUM
This is the highest voltage measured on the waveform.
This is the lowest voltage measured on the waveform.
3 - 20
Fluke 98
Users Manual
USING AIR/FUEL FUNCTIONS
This menu option is used to test actuators and sensors in the vehicles's air and
fuel system.
Fuel Injector
The test is done with the shielded test lead on INPUT A.
AIR/FUEL
FUEL INJECTOR
Result Screen
Duration of
the injection
pulse.
Maximum
voltage of
the induced
peak.
Press to display
the vehicle data
menu. You can make
changes to match
the vehicle under test.
Press to select
the arrow keys
for ranging or
moving the primary
ignition signal.
Using the Automotive ScopeMeter Test Tool
3 - 21
Potentiometer
AIR/FUEL
POTENTIOMETER
This menu option performs the same as POTENTIOMETER in the SENSORS
MENU. Refer to the description of this menu option on page 3-19.
Stepper Motor
Use this menu option to test the voltage pulse that controls a stepper motor or to
test the resistance of the stepper motor. The test is done with the shielded test
lead on INPUT A.
AIR/FUEL
STEPPER MOTOR
Function Keys and Result Screens
1
Press to test
the voltage
pulse that
controls the
stepper motor.
Press this key to
repeat the test.
Press this key to measure the resistance
of the stepper motor (disconnected).
For the voltage test (F1 key), this is a single shot measurement, which means
that the signal is displayed only once. To get a new test result, press the F3-key
and reapply the signal from the stepper motor.
3 - 22
1
Fluke 98
PEAK PEAK
Users Manual
Indicates the difference in voltage between the lowest
and the highest value of the displayed waveform.
PEAK-PEAK
Oxygen Sensor
AIR/FUEL
OXYGEN SENSOR
This menu option performs the same as OXYGEN SENSOR in the SENSORS
MENU. Refer to the description of this menu option on page 3-15.
Dual Oxygen Sensor
AIR/FUEL
DUAL OXYGEN SENSOR
This menu option performs the same as DUAL OXYGEN SENSOR in the
SENSORS MENU. Refer to the description of this menu option on page 3-16.
General Sensors
AIR/FUEL
GENERAL SENSORS
This menu option performs the same as GENERAL SENSORS in the SENSORS
MENU. Refer to the description of this menu option on page 3-13.
Using the Automotive ScopeMeter Test Tool
3 - 23
USING IGNITION FUNCTIONS
Use this menu option to test the vehicle's ignition system.
Primary
This test is done with the shielded test lead on INPUT A, connected to the
primary side of the ignition system. In addition, for conventional systems, the
Inductive Pickup connected on the COM/TRIGGER inputs, is clamped around
the spark plug wire of the first cylinder, close to the spark plug.
IGNITION
PRIMARY
3 - 24
Fluke 98
Users Manual
Function Keys and Result Screen
1
2
Press to select fast waveform updating
with readings omitted (not for PARADE).
Press to select between single cylinder and
parade test (conventional systems only).
1
Single cylinder
result screen.
2
Parade
result screen.
SINGLE cylinder waveform
Using the Automotive ScopeMeter Test Tool
3 - 25
Secondary
This test is done with the Secondary Pickup connected to INPUT A and, for
conventional systems, the Inductive Pickup connected to the COM/TRIGGER
inputs. The Secondary Pickup is clamped around the high voltage coil wire. The
RPM90 Inductive Pickup is clamped around the spark plug wire of the first
cylinder.
IGNITION
SECONDARY
Function Keys and Result Screens
1
2
3
Press this key to invert the
displayed ignition waveform.
1
Single cylinder
result screen
(Conventional).
2
Parade
result screen
(Conventional).
3
DIS
result screen.
Press this key to select the RPM SENSitivity
level (see page 5-64 for more information).
SINGLE cylinder waveform
3 - 26
Fluke 98
Users Manual
Advance
Use this menu option to test timing advance (TDC sensor required.) The test tool
measures the time difference in degrees of crankshaft rotation, between ignition
and the top dead center signal. The test is done with a shielded test lead on
INPUT A, connected to the primary side of the ignition coil. For conventional
systems, the Inductive Pickup, connected on the COM/TRIGGER inputs, is
clamped around the spark plug wire of the first cylinder, close to the spark plug.
In addition, a shielded test lead, connected on INPUT B, is connected to the TDC
sensor signal. Do not connect the ground lead of this test lead (double
grounding).
IGNITION
ADVANCE
Function Keys and Result Screens
Press to select
the arrow keys
for ranging or
moving the primary
ignition signal.
Press to select the arrow keys
for moving CURSOR 1 or 2.
Place the cursors as indicated on the above screen.
Press to select the arrow keys
for ranging or moving the TDC
sensor signal (on INPUT B).
Using the Automotive ScopeMeter Test Tool
3 - 27
Dwell
The test is done with the shielded test lead on INPUT A connected to the primary
side of the ignition coil.
IGNITION
DWELL
Function Keys and Result Screens
Press to select between readings in %,
degrees (q) crankshaft rotation, or in ms.
3 - 28
Fluke 98
Users Manual
USING DIESEL FUNCTIONS
The diesel test functions are selected if 'IGNITION: DIESEL' has been set in
the VEHICLE DATA menu. (See Changing Vehicle Data on page 3-57).
Diesel injector
Use this menu option to check injection pressure pulses on a diesel engine with
use of the optional Diesel Probe.
The Diesel Probe should be clamped on a straight and clean part of the fuel
pipe, close to the injector.
AIR/FUEL
DIESEL
[DIESEL] INJECTOR
Result Screen
Duration of
the injection
pulse.
Engine speed in RPM.
Using the Automotive ScopeMeter Test Tool
3 - 29
Advance (Diesel)
Use this menu option to test advance on a diesel engine vehicle (TDC sensor
required.) The test is performed with the optional Diesel Probe clamped on a
straight and clean part of the fuel pipe close to the injector and with the shielded
test lead on INPUT B connected to the TDC sensor. Do not connect the ground
lead of the INPUT B test lead (double grounding).
DIESEL
ADVANCE
Function Keys and Result Screens
Place the cursors as indicated on the above screen.
3 - 30
Fluke 98
USING ELECTRICAL SYSTEM FUNCTIONS
Use this menu option to test the electrical system of a vehicle.
Users Manual
Using the Automotive ScopeMeter Test Tool
3 - 31
Charging
Use this menu option to test the charging system of a vehicle. This test is done
with the shielded test lead on INPUT A to test voltage, or with the optional
current probe to test current.
ELECTRICAL SYSTEMS
CHARGING
Function Keys and Result Screens
1
2
3
4
Press to
measure
dc charging
voltage. 1)
Press to measure
ripple voltage. 1)
Press to measure
dc charging current. 2)
1)
1
2
3
4
Use shielded test lead
Press to measure
ripple current. 2)
2)
Use current probe
These screens display the dc voltage and the rms ripple voltage from the
vehicle’s alternator.
CHARGE
Indicates the dc voltage output of the alternator.
RIPPLE
Indicates the rms voltage of the ripple that rides on top of
the alternator output voltage.
These screens display the dc current output from the alternator.
CHARGE
Indicates the dc charging current.
RIPPLE
Indicates the rms ripple current during battery charging.
3 - 32
Fluke 98
Users Manual
Battery Test
Use this menu option to test the battery performance while cranking the engine.
The test is done with the shielded test lead on INPUT A to test voltage or with the
optional current probe to test current.
ELECTRICAL SYSTEM
BATTERY TEST
Function Keys and Result Screens
1
2
Press to
measure
voltage.
Press to measure current with
the optional current probe.
Press to repeat the test.
This test is a single shot measurement, which means that the signal is displayed
only once. To get a new test result, stop the engine, press the F3-key and crank
the engine again.
1 This screen displays the battery voltage during cranking.
BEGINNING OF SIGNAL Indicates the battery voltage at the beginning of the
test.
MINIMUM
Indicates the minimum voltage during the test.
END OF SIGNAL
Indicates the battery voltage at the end of the test
(charging voltage when engine runs).
2 This screen displays the battery current output during cranking.
MAXIMUM
Indicates the maximum current during the test.
END OF SIGNAL
Indicates the battery current at the end of the test
(charging current when engine runs).
Using the Automotive ScopeMeter Test Tool
3 - 33
Potentiometer
ELECTRICAL SYSTEM
POTENTIOMETER
This menu option performs the same as POTENTIOMETER in the SENSORS
MENU. Refer to the description of this menu option on page 3-19.
3 - 34
Fluke 98
Users Manual
Solenoid and Diode
Use this menu option to test a solenoid and a clamping diode, which is
connected across the solenoid. The clamping diode should minimize (clamp) the
voltage spike due to the self-inductance of the solenoid when switching it off.
The test is done with the shielded test lead on INPUT A.
ELECTRICAL SYSTEM
SOLENOID AND DIODE
Function Keys and Result Screens
1
2
Press to
measure
voltage.
Press to repeat the test.
Press to measure resistance.
For the voltage test (F1 key), this is a single shot measurement, which means
that the signal is displayed only once. To get a new test result, press the F3-key
and reapply the signal from the solenoid.
1
This screen displays the voltage across the solenoid.
MAXIMUM
MINIMUM
2
Indicates the maximum voltage measured.
Indicates the minimum voltage measured.
This screen displays the resistance in ohms (:) measured across the
solenoid.
Using the Automotive ScopeMeter Test Tool
3 - 35
Voltage Drop
Use this menu option to find high resistance or a loss of voltage across switches,
wiring, and connectors. Loss of voltage (voltage drop) in wiring harnesses and
connectors will cause poor performance of the connected device.
NOTE
A voltage drop occurs only when current flows through the wiring or connector. This
test performs a "Min/Max TrendPlot" like test as described in Chapter 4. However,
the result is not stored in memory. You can restart the test by pressing the F3
(REPEAT TEST) key.
ELECTRICAL SYSTEM
VOLTAGE DROP
Function Keys and Result Screen
1
2
Press to repeat the test.
1
Indicates the actual voltage drop.
2
MAX
MIN
MAX-MIN
Indicates the maximum voltage drop during the test.
Indicates the minimum voltage drop during the test.
Indicates the difference between the maximum and
minimum voltage drop during the test.
3 - 36
Fluke 98
Users Manual
Stepper Motor
ELECTRICAL SYSTEM
STEPPER MOTOR
This menu option performs the same as STEPPER MOTOR in the AIR/FUEL
MENU. Refer to the description of this menu option on page 3-21.
Using the Automotive ScopeMeter Test Tool
3 - 37
USING SCOPE FUNCTIONS
When Using the Scope
•
Use the scope function if you want to simultaneously measure two
waveforms - one on INPUT A and one on INPUT B (DUAL INPUT SCOPE.)
•
RELATIVE COMPRESSION allows you to compare the compression of all
cylinders.
3 - 38
Fluke 98
Users Manual
Using Single and Dual Input Scope
Use SINGLE INPUT SCOPE if you want to use a single signal, INPUT B is
turned off.
Use DUAL INPUT SCOPE if you want to simultaneously measure two signals.
SCOPE
SINGLE INPUT SCOPE
DUAL INPUT SCOPE
Function Keys and Result Screen
1
8
7
2
6
3
4
5
Press to select
the arrow keys
for ranging or moving
the INPUT A signal.
Press to display the
function key labels
for INPUT A control.
Press to display the function
key labels for INPUT B control.
Press to display the function key
labels for trigger control.
Press to display the function key
labels for single-shot control.
Figure 3-7. SCOPE display.
Using the Automotive ScopeMeter Test Tool
3 - 39
1
utomatic ranging and signal tracking is on.
Pressing
sets automatic ranging and signal tracking on and off. If on,
AUTO is displayed, if off, AUTO is extinguished.
2
INPUT B zero level.
3
INPUT A zero level.
4
Timebase range.
5
Timebase zero line (trigger event.)
6
Trigger icon. Indicates the trigger source (a indicates INPUT A), the trigger
slope (
indicates negative slope), and the trigger level (the vertical
position of the icon.)
7
INPUT B range setting and probe identification. This label displays OFF
when INPUT B is turned off.
8
INPUT A range setting and probe identification.
Making an Easy Setup
When you enter the scope function, the test tool automatically optimizes vertical
range, timebase, and trigger settings, thus creating a stable display.
When you press one of the arrow keys, the test tool switches to
manual control of range (timebase and vertical range) and trigger
settings.
Press this key to toggle between automatic and manual control of
range and trigger settings. Use this key if you cannot get a stable
display using manual control.
3 - 40
Fluke 98
Users Manual
INPUT A Control Functions
When you are in SINGLE or DUAL INPUT SCOPE, you can control the following
INPUT A functions.
Press to
return to the
previous menu.
Press to invert the INPUT A
signal waveform.
Press to turn 40 ns
glitch detection on or off.
Press to select DC or AC coupling.
The GLITCH function enables you to capture and display events such as spikes
that occur between two samples on INPUT A , which would otherwise not be
visible. INPUT B is turned off when the GLITCH function is activated. The events
can be glitches or other asynchronous waveforms that are 40 ns or wider.
GLITCH detection is not possible in the DUAL INPUT SCOPE function.
DC Coupling allows you to measure and display both the DC and AC
components of a signal. For example, you can measure and display battery
charging voltage with AC ripple riding on top.
AC coupling blocks the DC component and passes the AC component only.
When you measure charging voltage with AC coupling on, you will only see the
AC ripple voltage.
DC Coupling
Using the Automotive ScopeMeter Test Tool
3 - 41
INPUT B Control Functions
When you are in SINGLE or DUAL INPUT SCOPE, you can control the INPUT B
functions as follows.
Press to
return to the
previous menu.
Press to turn
INPUT B on or off.
Press to invert the INPUT B
signal waveform.
Press to select DC or AC
coupling for INPUT B.
When you entered the scope function via the SINGLE INPUT SCOPE menu
option, INPUT B is turned off by default, but you can turn it on by pressing F2.
When INPUT B is turned on, GLITCH detection on INPUT A is turned off.
3 - 42
Fluke 98
Users Manual
Single-Shot Function
Normally the scope function automatically repeats the measurements to acquire
waveforms. This is called the recurrent acquisition mode.
SINGLE-SHOT allows you to perform single acquisitions to snap events that
occur only once. REPEAT (F3) is used to start a next single acquisition.
When you are in SINGLE or DUAL INPUT SCOPE, you can perform single-shot
measurements as follows.
Press to exit
single-shot mode
and return to the
previous menu.
Press to repeat a
single-shot acquisition.
Using the Automotive ScopeMeter Test Tool
3 - 43
Trigger Control Functions
TRIGGER is a set of conditions that determine whether and when acquisitions
start. The following will determine the trigger conditions:
Select INPUT A, B, or TRIGGER as the TRIGGER SOURCE input.
Use TRIGGERED or FREE RUNning acquisitions
Select trigger to occur on a positive or negative SLOPE of the signal.
SET the trigger LEVEL.
•
•
•
•
If you change the trigger level, the AUTO RANGE function is turned off, so that
vertical and horizontal (timebase) ranging and trigger level are set to manual
control. (Also see "Making an Easy Setup" on page 3-39.)
When you are in SINGLE or DUAL INPUT SCOPE, you can control the trigger
functions as follows.
Use the arrow keys to
adjust the trigger level.
Press to select triggered or
free running acquisitions.
Press to select the trigger source.
Press to select the trigger slope.
3 - 44
Fluke 98
Users Manual
BTRIGGERED versus FREE RUNning acquisitions
If you select FREE RUN (default), the test tool always performs acquisitions, i.e.,
it always displays the signals on the input. If TRIGGERED is selected, a trigger is
always needed to start an acquisition.
TRIGGER SLOPE
If you select
If you select
, trigger occurs at a rising (positive) edge of the signal.
, trigger occurs at a falling (negative) edge of the signal.
TRIGGER SOURCE
If you select TRIGGER SOURCE A (default), acquisitions start when the signal
on INPUT A fulfills the selected trigger conditions (SLOPE, LEVEL).
If you select TRIGGER SOURCE B, the previous rule is valid for INPUT B
(INPUT B must be ON.)
If you select TRIGGER SOURCE TRIG, the previous rule is valid for the signal
on the TRIGGER input.
TRIGGER LEVEL (SET LEVEL)
This function allows you to set the level the signal must cross to trigger
acquisitions.
Normally, after you enter the scope function, the AUTO RANGE function
automatically sets and maintains an optimal trigger level as the signal changes.
Move the
trigger level icon (or
negative) to the desired level.
icon if trigger slope is set to
NOTE
If you selected TRIG as the trigger source, you can select only 2V or 0.2V as
trigger level.
Using the Automotive ScopeMeter Test Tool
3 - 45
Testing Relative Compression
This test is used to compare compression of cylinders during cranking. Engine
start is disabled.
The principle of this test is based on battery voltage drop or current change
during cranking.
Use unsynchronized (UNSYNC) RELATIVE COMPRESSION if you want to
check if all cylinders have equal compression. From the compression graph on
the display you cannot identify cylinder numbers, because there is no
synchronization signal used for the test. In order to identify cylinder numbers,
use synchronized (SYNC) RELATIVE COMPRESSION. Synchronization is done
with the Inductive Pickup (RPM 90) on the spark plug wire close to the spark
plug. Cylinder display is in firing order.
IMPORTANT
The relative Compression test can only be used on reciprocating piston
engines. This test cannot be used on rotary (Wankel) engines. Also on odd
fired engines, you may not be able to correctly interpret the rsults. Also
see the Relative Compression application in Chapter5.
SCOPE
REL. COMPRESSION UNSYNC
REL. COMPRESSION SYNC
3 - 46
Fluke 98
Users Manual
Function Keys and Result Screens
RPM during
cranking.
Maximum
compression
cylinder.
1
Low
compression
cylinder.
Cylinder #1 for
the SYNCED
relative
compression test.
Cylinders are
displayed in
firing order.
Press to display the
vehicle data menu.
Press to repeat the test.
Press to use a current
probe or a shielded
test lead on INPUT A.
Figure 3-8. Relative Compression Test on a 4-Cylinder Engine.
1
WAIT
This is displayed in the following cases:
when you enter the test until the engine is cranked
when you press F3 (REPEAT TEST) until the engine is
cranked.
This is displayed for about 6 seconds during cranking.
This is displayed when the test is completed. Then stop
cranking.
•
•
BUSY
HOLD
If WAIT remains displayed, check the connections.
The peak value of the cylinder with the highest compression is displayed as the
0% reference. The peak values of the other cylinders are displayed relative to
the 0% reference.
Using the Automotive ScopeMeter Test Tool
3 - 47
USING MULTIMETER FUNCTIONS
Making Connections
INPUT A is used for all MULTIMETER tests. The probes and test leads to be
used depend on the type of test performed. When you select a MULTIMETER
test, a connection help screen will guide you. This tells you which probe or test
lead to use and where to connect it.
3 - 48
Fluke 98
Users Manual
Testing Volt DC, AC
Use this menu option to test dc and ac voltages and ac+dc voltage.
MULTIMETER
VOLT DC, AC
Function Keys and Result Screen
1
2
5
3
4
Press to measure
dc voltage, e.g.,
battery voltage.
Press to measure ac
true rms voltage
e.g. charging ripple.
Press to measure ac+dc
true rms voltage.
Press to use the present
reading as zero
reference to measure
difference 'from now on.
Figure 3-9. MULTIMETER VOLT display.
1
AUTO indicates automatic ranging.
Pressing
sets automatic ranging on and off.
Using the arrow keys for ranging turns automatic ranging off and
extinguishes AUTO.
2
This indicates the dc, ac, or ac+dc reading, depending on which function
(F1, F2, or F3) is active.
3
Voltage zero line (amplitude zero).
4
Timebase range (horizontal range: time per division).
5
Voltage range (vertical range: voltage per division).
Using the Automotive ScopeMeter Test Tool
3 - 49
Testing Resistance, Continuity, and Diode
Use this menu option to test resistance, diode forward voltage, and the continuity
of wiring and connections.The test is done with the shielded test lead on INPUT
A. Connect the test lead tip and test lead ground across the object (resistance,
wire, diode, etc.) to be tested.
MULTIMETER
OHM/DIODE/CONTINUITY
Function Keys and Result Screens
1
2
3
Press to measure
resistance.
Press to test
diodes.
Press to test continuity of wiring and
connections. If you select OPEN, the test tool
beeps when the tested connection is open.
If you select CLOSE, it beeps when the
tested connection is closed.
3 - 50
1
Fluke 98
Users Manual
This screen displays the measured resistance in ohms (:).
This is displayed when the resistance is outside the test tool's
maximum range. This occurs when the resistance of the
sensor is too high or the connection to the sensor is interrupted
or open.
2
This screen displays the forward voltage across a diode. The test tool
sends a small current through the diode to test the voltage across it.
Depending on the type of diode, this voltage should be in the range from
300 to 600 mV. A diode that has an internal short will display about 0V.
This is displayed when the diode is defective or when it is
connected in reverse.
See Figure 3-10 to verify the
correct polarity of the
connection.
If you are not certain about the
polarity of the diode, try the
reverse connection. If this also
displays OL, the diode is defective. A good diode must display
OL when connected in reverse.
Figure 3-10. Connection
for Diode Test.
3
This screen displays the continuity of a connection as follows:
If the connection is open or
interrupted.
If the connection is closed or shorted.
Using the Automotive ScopeMeter Test Tool
3 - 51
Measuring RPM
MULTIMETER
RPM
Function Keys and Result Screens
Automatic ranging is on
to track the RPM signal.
You can use the arrow
keys for manual ranging.
RPM signal waveform.
Press to select the
shielded test lead on
INPUT A or the
Inductive Pickup on the
COM/TRIGGER input.
This selection is not
displayed for diesel.
Press to decrease.
Press to use the
presentRPM as zero
reference to measure
RPM change (').
Press to increase.
Press to restore the default value
settings stored in VEHICLE DATA.
These keys are used to set the number of test pulses
to the test tool per 720q (two crank shaft revolutions)
NOTE:
You can use the arrow keys to change sensitivity and time base.
3 - 52
Fluke 98
Users Manual
Testing Frequency, Duty Cycle, or Pulse Width
MULTIMETER
FREQUENCY
DUTY CYCLE
PULSE WIDTH
Function Keys and Result Screens
1
2
3
Press to test frequency.
Press to test duty cycle. 1)
Press to test pulse width. 2)
1) You can also enter this test via DUTY CYCLE in MULTIMETER MENU.
2) You can also enter this test via PULSE WIDTH in MULTIMETER MENU.
For more details about the function key functions and the related result screens,
see the following.
Using the Automotive ScopeMeter Test Tool
Hz
3 - 53
!ress to test the signal frequency in Hz (screen 1 ).
DUTY CYCLE
Press to test the duty cycle of the signal (screen 2 ).
If you select
, the duty cycle of the negative-going pulse is
displayed.
If you select
, the duty cycle of the positive-going pulse is
displayed.
PULSE WIDTH
Press to test the pulse width of the signal (screen 3 ).
If you select
, the width of the negative-going pulse is
displayed.
If you select
, the width of the positive-going pulse is
displayed.
SET
ZERO
Press to use the present reading as zero reference (display ').
3 - 54
Fluke 98
Users Manual
Testing Current
Test current with the optional Current Probe.
MULTIMETER
AMP DC, AC
Function Keys and Result Screen
Press to use the present
reading as zero reference
(display ').
Press to measure
dc current.
Press to measure
ac true rms current.
Press to select between 1 mV/A
and 10 mV/A (only if CURRENT
PROBE: 90i-610s has been
selected in TEST LEAD SETUP).
Press to measure ac+dc
true rms voltage.
Figure 3-11. MULTIMETER AMPERE Display.
Don’t forget to set the Current Probe to zero before using it for measurements
(refer to the User Manual of the Current Probe).
Using the Automotive ScopeMeter Test Tool
3 - 55
Testing Temperature
Use this menu option to test temperature with the optional Temperature Probe or
a probe that has a temperature sensitivity of 1 mV per degree Celsius or
Fahrenheit.
MULTIMETER
TEMPERATURE °C, °F
Function Keys and Result Screen
Press to select between
measuring degrees
Celsius and degrees
Fahrenheit.
Press to use the present
temperature reading as
zero reference to measure
temperature change (').
Figure 3-12. MULTIMETER TEMPERATURE Display.
In TEST LEAD SETUP, you can select TR90 Temperature Probe or a
thermocouple probe with sensitivity 1 mV/qC or 1 mV/qF. Use the F1 key to set
the corresponding temperature unit (qC or qF.)
3 - 56
Fluke 98
Users Manual
CHANGING THE VEHICLE DATA AND INSTRUMENT
SETUP
There are two groups of setups in the main menu (see Figure 3-13):
VEHICLE DATA
Use this menu option to enter the correct vehicle data,
such as the number of cylinders on the vehicle under
test.
INSTRUMENT SETUP Use this menu option to set the following:
Optimal settings for display.
Correct settings for hard copy to a printer.
Language for menus and help text.
Connection Help turned ON or OFF.
Correct probe and test lead data.
•
•
•
•
•
Setup Overview
See page 3-8
Figure 3-13. Overview of the Setup Menus.
Using the Automotive ScopeMeter Test Tool
3 - 57
Changing Vehicle Data
Use this menu option to set the vehicle data to match the vehicle under test. If
they do not match, you could get incorrect test results and may not be able to
select all available tests for this vehicle.
Because this menu is very important for the proper use of the test tool, it also
appears at power-on as the start-up display.
VEHICLE DATA
CYLINDERS:
1, 2, 3, 4 (default), 5, 6, or 8. Specifies the number of cylinders
on the vehicle under test.
CYCLES:
2 or 4 (default). Specifies a two- or four-stroke engine.
BATTERY:
6V, 12V (default), or 24V. Specifies battery voltage.
IGNITION:
CONV (default), DIS, COP (Coil On Plug), or DIESEL.
Specifies the type of ignition system.
'CONVentional' indicates systems using a distributor.
DIS indicates Distributorless Ignition Systems.
Coil on Plug systems have an ignition coil placed directly on
top of each spark plug. Normally, secondary ignition tests are
not possible on these systems, without a special adapter.
3 - 58
Fluke 98
Users Manual
Changing Instrument Setup
These options give access to the following menus.
INSTRUMENT SETUP
DISPLAY OPTIONS MENU
INSTRUMENT SETUP
DISPLAY
CONTRAST:
This setting, expressed as a percentage, determines the
contrast ratio between display text or graphics and the LCD
background.
0% is all white.
100% is all black.
In practice, the percentage will be somewhere between 35%
and 80%, to have a good readable display.
You can also change contrast by pressing the backlight key
and keeping it pressed until you reach the desired contrast
level.
DOT SIZE:
This setting determines the height of the dots used to display
signal waveforms:
SMALL Dots displayed as small as possible (1-pixel height.)
Waveforms appear thin.
MEDIUM Dots displayed 2-pixel height (default.) Waveforms
appear medium thick.
LARGE Dots displayed 3-pixel height (maximum.)
Waveforms appear thick.
DOT JOIN:
Can be set On or Off (default is On). Think of a waveform as
being a sequence of single dots (see Figure 3-14). When DOT
JOIN is On, the dots are connected together as a solid line.
Using the Automotive ScopeMeter Test Tool
3 - 59
x
DOT JOIN: Off
DOT JOIN: On
Figure 3-14.
TRACE PERSISTENCE: Can be set On or Off (default is Off). When set On,
this keeps the signal waveform on the screen longer
so it is easier to see any (fast) detail on the signal. It
looks as if the waveform is refreshed at a slower rate.
INVERSE VIDEO:
Can be set On or Off (default is Off.) Normally (when
set Off) you see black text and graphics on a green
background display. When you set INVERSE VIDEO
On, you see green text and graphics on a black
background display.
3 - 60
Fluke 98
Users Manual
PRINTER MENU
INSTRUMENT SETUP
PRINTER
See Tip
PRINTER:
Defines the type of printer connected to the test tool.
BAUD RATE:
Defines the communication speed of the optical link
between the test tool and the printer. This must correspond
with the settings of the printer.
PRINT GREY:
Can be set to Yes or No (Yes is default.) When set to Yes,
grey parts as visible on screen are printed black. When set
to No, grey parts are not printed.
Tip:
Highlight this menu option and press
to get extended information
about the settings needed for a connected printer.
Using the Automotive ScopeMeter Test Tool
3 - 61
OPTIONS MENU
INSTRUMENT SETUP
OPTIONS
CONNECTION HELP:
Can be set On (default) or Off. This setting is used to
enable or disable display of connection help information
during selection of a test.
LANGUAGE:
This setting is used to select the local language or
English for the information text display. This option is
not available if only one language is implemented.
3 - 62
Fluke 98
Users Manual
Changing Test Lead Setup
This menu option is used to configure the test tool for probes and test leads used
for measurement. It is also used to calibrate a 10:1 test lead to match INPUT A
or INPUT B.
When you use the standard test leads and probes supplied with the test tool, you
do not need to make changes to the default setup.
Use this menu option to make the setup for non-standard test leads or probes.
INSTRUMENT SETUP
TEST LEAD INPUT A
TEST LEAD INPUT B
CURRENT PROBE:
SEC. PICKUP:
TEMP. PROBE:
TEST LEAD:
CALIBRATE TEST LEAD:
Defines the type of current probe or its sensitivity in
mV/A.
Defines the type of secondary pickup or its
attenuation factor.
Defines the type of temperature probe or its
sensitivity in mV/degree.
Defines the type of test lead or its attenuation factor
for the selected input (INPUT A or B).
This menu option starts calibration of a 10:1 test
lead to match the input it is connected to (INPUT A
or B). This menu option is disabled (displayed
dimmed) if not a 10:1 test lead is selected.
Regular calibration is necessary to meet
specifications. For details, see Chapter 6
"Maintenance".
Chapter2 -41
Using the Additional Capabilities
Introducing your Automotive ScopeMeter Test Tool
USING THE RECORD FUNCTIONS . . . . . . . . . . . . . . . . . . . . . . . . . . . 4-2
PLOT READINGS . . . . . . . . . . . . . . . . . . . . . . . . . . . . . . . . . . . . . . . . . .
Viewing the Stored Results from PLOT READINGS . . . . . . . . . . . . . . . .
MIN/MAX TRENDPLOT . . . . . . . . . . . . . . . . . . . . . . . . . . . . . . . . . . . . . .
Viewing the stored results from MIN/MAX TRENDPLOT . . . . . . . . . . . . .
4-3
4-5
4-6
4-7
INTERMITTENT RECORD . . . . . . . . . . . . . . . . . . . . . . . . . . . . . . . . . . . . 4-8
Viewing the stored results from INTERMITTENT RECORD . . . . . . . . . . 4-9
FLIGHT RECORD . . . . . . . . . . . . . . . . . . . . . . . . . . . . . . . . . . . . . . . . . . 4-10
Viewing the storeds results from FLIGHT RECORD. . . . . . . . . . . . . . . . 4-11
FREEZING, PRINTING, SAVING, AND RECALLING SCREENS . 4-12
USING CURSORS . . . . . . . . . . . . . . . . . . . . . . . . . . . . . . . . . . . . . . . . . . 4-14
USING THE SMOOTH FUNCTION . . . . . . . . . . . . . . . . . . . . . . . . . . . . 4-16
4-2
Fluke 98
Users Manual
USING THE RECORD FUNCTIONS
The group of functions in the RECORD MENU can help you to find faults that
occur over time. PLOT READINGS and MIN MAX TRENDPLOT are very
suitable to find faults in slowly changing processes, such as faults due to current
change. INTERMITTENT RECORD is a fast recording function that continuously
records without interruptions. FLIGHT RECORD records up to 40 successive
screen snapshots in memory and is suitable to find irregularities in repetitive
signal patterns. The recording functions store the results in memory. VIEW
RECORDED SIGNAL allows you to examine the results later on.
Do the following to start a recording function:
1
Select and start the test you want to record.
2
Press to enter the RECORD menu.
3
Press to move the highlight to the
desired recording function.
SELECT
4
Press to select the highlighted recording function.
If the desired recording function is not possible for the selected test, the
corresponding menu is shown dimmed (see the above figure.)
Using the Additional Capabilities
4-3
PLOT READINGS
This function allows you to see how different readings influence each other.
Information is presented as a graphical plot of each reading. For example, you
can display graphical plots of the PEAK-PEAK voltage and the DUTY CYCLE to
see how these readings behave as FREQUENCY changes.
Do the following to start the PLOT READINGS recording function:
1
Select and start the test you want to record.
2
Press to enter the RECORD menu.
3
Move the highlight to PLOT
READINGS.
SELECT
4
Press to select.
The Automotive ScopeMeter test tool displays a
message when there is still an existing record in
record memory that has to be overwritten before
recording can start. This will not affect the 15 memory storage locations.
Press
to preserve the record and cancel recording, or
press
to overwrite the record and start recording.
4-4
Fluke 98
Users Manual
When this function starts, a plot will start for each reading. See the following
example for a single cylinder ignition test. The figure on the left shows the normal
test display with the readings at the top. The figure on the right shows the display
of each reading in the same order from top to bottom as displayed in the left figure.
Normal test display
(example IGNITION SECONDARY
SINGLE CYLINDER)
Display during
PLOT READINGS
Figure 4-1. Normal test display and PLOT READINGS display
The plots that appear on the display are also written to memory for later
examination. Memory contents are preserved when the test tool is turned off.
(See the next section 'Viewing the stored results from PLOT READINGS'.)
You can stop recording by pressing any key on the test tool (except ON/OFF).
When the graphical plots reach the right edge of the display, the horizontal time
base is doubled so the plots continue from the centre of the display to the right.
This process (time base rescaling) can repeat three times during about 16
minutes. After that, the plots will scroll from right to left across the screen.
Using the Additional Capabilities
4-5
Viewing the Stored Results from PLOT READINGS
There are two ways to view the recording results from PLOT READINGS:
1. While you are in PLOT READINGS recording, press any key. Continue the
following procedure from step 4.
2. In all other cases, perform the following procedure.
1
Press to enter the RECORD menu.
2
Move the highlight to VIEW
RECORDED SIGNAL
SELECT
Press to select.
3
When you enter VIEW RECORDED SIGNAL, the display shows the readings
that were on the display at the time you stopped recording. A vertical cursor
appears at the location where these readings are valid, that is, at the end of the
record. (See Figure 4-2)
Use the left/right arrow
keys to move the cursor
over the plots to read the
sample values at the
cursor location.
4
PRINT
Press this key to print
the record to a
connected printer.
This is only possible via
the optionally available
RS232 cable.
BACK
Press this key to exit
from this display to
return to the normal test
display.
Figure 4-2. Display shown in
VIEW RECORDED SIGNAL
Function
4-6
Fluke 98
Users Manual
MIN/MAX TRENDPLOT
This function records the reading displayed at the top and keeps track of the
maximum, minimum, and average value. The present reading remains displayed
at the top, while the recorded values are listed below with their corresponding
time stamps. As the average value is calculated over all readings from the
beginning of recording up to and including the most recent reading, its time
stamp indicates the complete recording time.
A graphical plot of the actual reading is displayed (see Figure 4-3).
Do the following to start the MIN MAX TRENDPLOT recording function:
1
Select and start the test you want to record.
2
Press to enter the RECORD menu.
3
Move the highlight to MIN MAX
TRENDPLOT.
SELECT
4
Press to select MIN MAX TRENDPLOT.
If there is still existing record data in memory, press
to
preserve this data, or press
to overwrite this data, and start
recording.
Normal test display
(example MULTIMETER VOLT)
Display during MIN MAX
TRENDPLOT
Figure 4-3. Normal test display and MIN MAX TRENDPLOT display
The graphical plot is displayed in the same way as PLOT READINGS, except in
this function, time base rescaling does not stop after 16 minutes. Recording stops
when you press any key on the Automotive ScopeMeter test tool.
Using the Additional Capabilities
4-7
Viewing the stored results from MIN/MAX TRENDPLOT
Use the same procedure as used for 'Viewing the stored results from PLOT
READINGS' to enter the VIEW RECORDED SIGNAL function.
When you enter this function, the display shows the same information that was
shown when you stopped recording. Unlike PLOT READINGS, in this function
there is no cursor available to scan the displayed plot.
4-8
Fluke 98
Users Manual
INTERMITTENT RECORD
This recording function can help you find faults that occur during short periods of
time. Such a fault, also called an intermittent, can for example be a signal that
disappears occasionally due to a poor connection or broken wire.
The test tool display has about 9.5 horizontal divisions to show a waveform. The
length in time of the waveform which depends on the time base setting, may be
too short to capture a faulty signal. However, the INTERMITTENT RECORD
function can store the signal waveform for a period that corresponds to 1280
divisions in a cyclic memory (endless loop). The length in time equals 1280 times
the time base setting. For example, if the time base is set to 100 ms per division,
the recorded waveform is 128 seconds long. From that time on the first
waveform sample will shift out of memory to make space for a new sample, and
so forth until you stop recording by pressing any key.
Do the following to start INTERMITTENT RECORD:
1
Select and start the test you want to record.
2
Press to enter the RECORD menu.
3
Move the highlight to INTERMITTENT
RECORD.
SELECT
4
Press to select INTERMITTENT
RECORD. If there is still existing record data in memory, press
to preserve this data, or press
to overwrite this data
and start recording.
Normal test display
(example GENERAL SENSORS)
Display during INTERMITTENT
RECORD 1)
Figure 4-4. Normal test display and INTERMITTENT RECORD display
1) For slow timebase settings, the display will be blank for a certain time.
Using the Additional Capabilities
4-9
The time base setting during INTERMITTENT RECORD is 20 ms per division or
slower (time base >20 ms/division). If the current time base is faster than 20 ms
per division, INTERMITTENT RECORD records at 20 ms per division.
Viewing the stored results from INTERMITTENT RECORD
Do the following to view the results from INTERMITTENT RECORD:
If you are in the INTERMITTENT RECORD mode, press any key to stop
recording and continue the following procedure from step 4.
In all other cases, perform the next procedure.
1 through 3
Use the same procedure as used for 'Viewing the stored
results from PLOT READINGS' to enter the INTERMITTENT
RECORD function (steps 1 through 3.)
Use these keys to browse through the recorded
screens to search for the desired signal event.
4
CURSOR
1 2
5
Press to select the cursor
you want to move.
6
Use the left/right arrow keys
to move the selected cursor
to the location where you
want to read the sample
values.
PRINT
Press this key to copy the
screen to the connected
printer. This is only possible
via the optionally available
RS232 cable.
BACK
Press this key to exit from this display and return to the normal
test display.
4 - 10
Fluke 98
Users Manual
FLIGHT RECORD
This function stores up to 40 successive screen snapshots in memory. You can
view the last 40 (or less if memory is not full) screens stored in the record
memory. This function is suitable for repetitive signals such as ignition patterns,
not for intermittents. The time base setting possible during FLIGHT RECORD is
200 ms per division or faster (time base <200 ms/division). If the current time
base is slower than 200 ms per division, FLIGHT RECORD records at 200 ms
per division.
Perform the following to start the FLIGHT RECORD function:
1
Select the function and start the the test you want to record:
2
Press to enter the RECORD menu.
3
Move the highlight to FLIGHT
RECORD.
SELECT
4
Press to select FLIGHT RECORD. If
there is existing data in memory, press
to preserve this data and cancel
recording, or press
to overwrite
this data, and start recording.
Ignition Single Cylinder Display
Display during FLIGHT RECORD
Figure 4-5. Normal Test Display and FLIGHT RECORD Display
Using the Additional Capabilities
4 - 11
Viewing the storeds results from FLIGHT RECORD.
Do the following to view the results from FLIGHT RECORD:
If the FLIGHT RECORD function is busy recording, press any key to stop
recording and perform step 4 in the next procedure (skip steps 1 through 3).
In all other cases, perform next steps.
1 through 3
4
Use the same procedure as used for ‘Viewing the stored
results from PLOT READINGS’ on page 4-5, to enter the
VIEW RECORDED SIGNAL function (steps 1 through 3.)
Use these keys to browse through the recorded
screens.
4 - 12
Fluke 98
Users Manual
FREEZING, PRINTING, SAVING, AND RECALLING
SCREENS
FREEZE
Freezes the display and shows the
Function Key Menu to save, recall,
print the actual screen, or to clear the
memory. HOLD appears in the top
right of the display if the test tool was
busy measuring.
BACK
Press this key to resume measuring or to return to the previous display.
PRINT
Copies the screen to the printer. (Make sure that the test tool setup
matches with the connected printer. See the section "CHANGING
INSTRUMENT SETUP" in Chapter 3.)
SAVE
SCREEN
Saves the present screen in the next free memory location.
A message is displayed to tell you
in which memory location the
screen is saved.
When all memory locations are
filled from previous save actions, a
message is displayed asking to
overwrite a memory location (press
F1) or to cancel saving (press F2).
Using the Additional Capabilities
4 - 13
You can recall a saved screen from memory to compare it with actual test results.
RECALL
Displays the screen last saved in
memory.
OK
Press this key to remove the message.
Use these keys to move
the screen memory pointer
to the left (F2) or
the right (F3) to display the
previous or the next
screen in memory. The pointer can move only if more than
one screen has been saved in memory. Look up the
desired screen.
PRINT
Press this key if you want to copy the screen to the printer. The printer
must be connected via the optionally available RS232 cable.
SELECT
Press to select the displayed
screen. The test tool activates
the settings that are valid for the
recalled screen. The
waveform(s) from the recalled
screen are displayed in grey to
enable distinction from the
active waveform(s) for
comparison.
Figure 4-6. Comparison of
recalled screen (grey) with
active result
4 - 14
Fluke 98
Users Manual
USING CURSORS
A cursor is a vertical line placed over the displayed waveform to measure values
at certain points. This function is not possible for all tests. Use cursors as follows:
Press to display the Function Key Menu for cursor operation. If cursor
operation is not possible for the actual measurement, the test tool
beeps to alert you.
Two cursors (vertical lines) appear on the display. The left cursor is
named CURSOR 1, the right CURSOR 2.
CURSORS
ON OFF
CURSOR
1 2
Press to set CURSORS ON or
OFF.
Select the cursor you want to
move (1 or 2).
Left/right arrow keys move the
cursor.
The top display shows a rectangular box
containing readings related to values at the
cursor positions. (See Figures 4-7 and 4-8)
Figure 4-7. Cursor display
(single output)
Sample value at
CURSOR 1 position
Sample value at
CURSOR 2 position
Difference between the
sample values at
CURSOR 1 and
CURSOR 2 positions
Time difference
between CURSOR 1
and CURSOR 2
positions
Figure 4-8. Cursor reading for single input use
Using the Additional Capabilities
4 - 15
When you use cursors in DUAL INPUT
SCOPE, the display also gives cursor
readings for INPUT B. There is no
difference in sample values given at the
cursors as seen in single input mode. (See
Figure 4-9 and 4-10)
Figure 4-9. Cursor display
(dual output)
Sample value at
CURSOR 1 position on
the INPUT A waveform
Sample value at
CURSOR 1 position on
the INPUT B waveform
Sample value at
CURSOR 2 position on
the INPUT A waveform
Time difference
between
CURSOR 1 and
CURSOR 2
positions
Sample value at
CURSOR 2 position on
the INPUT B waveform
Figure 4-10. Cursor reading for dual input use
4 - 16
Fluke 98
Users Manual
USING THE SMOOTH FUNCTION
This function allows you to adjust a filter that removes noise from displayed
waveforms.
Use this function if the displayed waveform exhibits too much noise or if readings
are unstable so you can hardly examine the results.
CAUTION:
The smooth function also removes spikes from the waveform. If the
signal normally exibits spikes, they are removed (See Figure 4-11).
SMOOTH is disabled for IGNITION functions
Note: Always try to prevent noise as much as possible by correct grounding and
by using shielded test leads.
Displays the Function Key Menu for SMOOTH control. Each
automotive test has its own default (NORMAL) smooth setting.
Press the F2 key to minimize smoothing. When you set
smooth to the minimum, the test tool turns glitch detection
on to display glitches (not valid for MULTIMETER
functions).
Press the F3 key to increase smoothing. (See the following
figure.)
NORMAL
Press this key to return to the normal (default) smooth setting for the
active test.
Waveform shown with smooth filter off
Waveform shown with smooth filter on
Figure 4-11. Signal Displayed with Smooth Filter Off and On
Automotive Applications
Chapter5 -51
Automotive Applications
SENSORS . . . . . . . . . . . . . . . . . . . . . . . . . . . . . . . . . . . . . . . . . . . . . . . . . . 5-3
3.
2a.
2b.
3.
4.
5.
6.
7.
8.
Manifold Absolute Pressure (MAP) . . . . . . . . . . . . . . . . . . . . . . . . . . . . 5-3
Oxygen Sensor (Lambda) (O2) Zirconia and Titania . . . . . . . . . . . . 5-6
Dual Oxygen Sensor (Dual Lambda or Dual O2) . . . . . . . . . . . . . . . . 5-11
Temperature . . . . . . . . . . . . . . . . . . . . . . . . . . . . . . . . . . . . . . . . . . . . 5-13
Throttle Position Sensor (TPS) Potentiometer and Switched . . . . . 5-16
Crankshaft/Camshaft Position (CPS) . . . . . . . . . . . . . . . . . . . . . . . . . 5-21
Ride Height (Position) Potentiometer . . . . . . . . . . . . . . . . . . . . . . . 5-26
Vehicle Speed Sensor (VSS) Magnetic, Hall-Effect, and Optical . . 5-29
Anti-Lock Wheel Speed Sensor (ABS) Magnetic . . . . . . . . . . . . . . 5-33
AIR/FUEL . . . . . . . . . . . . . . . . . . . . . . . . . . . . . . . . . . . . . . . . . . . . . . . . . . 5-37
9.
10.
11.
12.
13.
Air Flow Sensors . . . . . . . . . . . . . . . . . . . . . . . . . . . . . . . . . . . . . . . . .
Exhaust Gas Recirculation (EGR) . . . . . . . . . . . . . . . . . . . . . . . . . . . .
Fuel Injection (FI) . . . . . . . . . . . . . . . . . . . . . . . . . . . . . . . . . . . . . . . . .
Mixture Control Solenoid (MC) ( Pulse Width . . . . . . . . . . . . . . . . . . .
Idle Air Control / Idle Speed Control (IAC/ISC) . . . . . . . . . . . . . . . . . .
5-37
5-43
5-46
5-52
5-54
IGNITION . . . . . . . . . . . . . . . . . . . . . . . . . . . . . . . . . . . . . . . . . . . . . . . . . . 5-57
14.
15.
16.
17.
18.
19.
Knock Sensor Piezo Crystal (Burst Pattern) . . . . . . . . . . . . . . . . . .
Secondary Ignition . . . . . . . . . . . . . . . . . . . . . . . . . . . . . . . . . . . . . . . .
Primary Ignition . . . . . . . . . . . . . . . . . . . . . . . . . . . . . . . . . . . . . . . . . .
Distributor Triggering . . . . . . . . . . . . . . . . . . . . . . . . . . . . . . . . . . . . . .
Relative Compression . . . . . . . . . . . . . . . . . . . . . . . . . . . . . . . . . . . . .
Timing Advance . . . . . . . . . . . . . . . . . . . . . . . . . . . . . . . . . . . . . . . . . .
5-57
5-60
5-67
5-69
5-73
5-76
ELECTRICAL SYSTEM . . . . . . . . . . . . . . . . . . . . . . . . . . . . . . . . . . . . . 5-79
20.
21.
22.
23.
24.
Battery Test . . . . . . . . . . . . . . . . . . . . . . . . . . . . . . . . . . . . . . . . . . . . .
Charging . . . . . . . . . . . . . . . . . . . . . . . . . . . . . . . . . . . . . . . . . . . . . . .
Solenoid and Clamping Diode Test . . . . . . . . . . . . . . . . . . . . . . . . . . .
Voltage Drop . . . . . . . . . . . . . . . . . . . . . . . . . . . . . . . . . . . . . . . . . . . .
Voltage Tests . . . . . . . . . . . . . . . . . . . . . . . . . . . . . . . . . . . . . . . . . . . .
5-79
5-81
5-85
5-88
5-90
DIESEL . . . . . . . . . . . . . . . . . . . . . . . . . . . . . . . . . . . . . . . . . . . . . . . . . . . . 5-92
25. Diesel RPM Measurements and Diesel Injection Pattern Display . . . . 5-94
26. Diesel Advance Measurement . . . . . . . . . . . . . . . . . . . . . . . . . . . . . . . 5-96
5-2
Fluke 98
Users Manual
AUTOMOTIVE APPLICATIONS
Applications are divided into four groups:
1. SENSORS
Measurements on sensor-type devices.
2. AIR/FUEL
Measurements on devices used in the vehicle's
air and fuel management system.
3. IGNITION
Measurements on devices used in conjunction
with the vehicle's ignition system.
4. ELECTRICAL SYSTEM
Measurements on devices used in the vehicle's
electrical system.
NOTES:
This chapter provides many typical automotive tests. These tests are designed
to help you learn how to use the Automotive ScopeMeter test tool. These tests
DO NOT REPLACE test procedures that apply to particular vehicles. Therefore
consult your vehicle manufacturer's service manual to use correct test
procedures.
The application examples given in this chapter represent often used applications
with typical specifications. Some vehicle manufacturers use other systems with
different specifications and require test methods different from those mentioned
in this application chapter.
Automotive Applications
5-3
SENSORS
1
Manifold Absolute Pressure (MAP)
The manifold absolute pressure sensor provides an electrical signal to the ECU
that represents engine load. This data, in the form of a frequency modulated
square wave or voltage level (depending on the manufacturer), is used by the
computer to alter the fuel mixture and other outputs.
High pressure occurs when the engine is under a heavy load, and low pressure
(high intake vacuum) occurs when there is very little load. A bad MAP sensor
can affect the air-fuel ratio when the engine accelerates and decelerates. It
serves the same basic function as a power valve in a carburetor. It may also
have some effect on ignition timing and other computer outputs.
Measurement Conditions for the MAP Sensor Test
•
Key ON, Engine OFF, with vacuum applied to the sensor's vacuum input
using a hand pump to simulate the vacuum.
•
Engine RUNNING, monitor the signal at idle while increasing rpm.
or
Test Tool Key Sequence for the Digital MAP Sensor Test
SELECT
1
SELECT
2
3
Connect the test leads as displayed by the test tool's Connection Help
banner and as shown in Figure 5-1.
OK
4
Starts the Digital MAP sensor test.
5
If necessary, use the arrow keys for ranging.
You can use INTERMITTENT RECORD to log the test
results.
5-4
Fluke 98
Users Manual
Figure 5-1. Testing a MAP Sensor
Figure 5-2. Result Display from a Map Sensor Test
The INTERMITTENT RECORD function is a powerful means to watch the signal
over time. This function gives you time to activate the sensor while recording is in
progress, and then stop recording to display the result. See the example for
Oxygen Sensor on page 5-10.
Automotive Applications
5-5
Manifold Absolute Pressure Sensor (Map) Digital
The upper horizontal
lines should reach
reference voltage
Voltage transitions
should be straight
and vertical
Peak-to-peak voltage
should equal
reference voltage
Voltage drop to ground should
not exceed 400 mV
The lower horizontal
lines should almost
reach ground
If the voltage drop is greater
than 400 mV, look for a bad
ground at the sensor or ECU
Signal frequency increases as the throttle is opened (vacuum decreases).
As the throttle closes the frequency decreases.
Manifold Absolute Pressure Sensor (Map) Analog
A high voltage level indicates high intake
manifold pressure (low vacuum)
HIGH ENGINE LOAD
LOW ENGINE LOAD
As the throttle plate opens,
manifold pressure rises
(manifold vacuum lowers)
A low voltage level indicates
low intake manifold pressure
(high vacuum)
Specifications may vary. Consult manufacturer’s specifications.
5-6
2a
Fluke 98
Users Manual
Oxygen Sensor (Lambda) (O2) Zirconia and Titania
An oxygen sensor provides an output voltage that represents the amount of
oxygen in the exhaust stream. The output voltage is used by the control system
to adjust the amount of fuel delivered to the engine.
The zirconia-type oxygen sensor acts as a battery, providing high output voltage
(resulting from a rich condition) and low output voltage (indicating a lean
condition.)
The titania sensor, used on some vehicles, changes resistance as the oxygen
content of the exhaust gas changes. This results in a low output voltage (from a
rich condition) and a high output voltage (from a lean condition).
Measurement Conditions for the Oxygen Sensor Test
•
Run the engine until the oxygen sensor is warmed to at least 600 °F (315 °C),
in closed loop. Use jumper leads or back probe to make connection at the
sensor wiring connector.
•
Run the engine at idle while increasing engine speed.
Test Tool Key Sequence
SELECT
1
SELECT
2
3
Connect the test leads as displayed by the test tool's Connection Help
and shown in Figure 5-3.
OK
4
Starts the oxygen sensor test.
Automotive Applications
Figure 5-3. Testing an Oxygen Sensor
Figure 5-4. Result Display from an Oxygen Sensor Test.
5-7
5-8
Fluke 98
Users Manual
Oxygen Sensor - Zirconia
Maximum peak voltages
should reach at least
800 mV or more
Rise and Fall times increase
by aging and poisoning
of the sensor
Peak-to-peak voltages
should be at least
600 mV or greater
with an average
of 450 mV
Minimum peak voltages
should reach at least
200 mV or less
Specifications may vary. Consult manufacturer’s specifications.
Automotive Applications
5-9
Oxygen Sensor test with RECORD - PLOT READINGS
The PLOT READINGS function allows you to record the minimum, maximum,
and average voltage readings over time. This is useful for tracking a coated
sensor or one that has an intermittent ground on the exhaust manifold.
Test Tool Key Sequence for an Oxygen Sensor Test with Flight Record
1
Start the OXYGEN SENSOR test as described above.
Press to display the RECORD menu.
2
SELECT
If there is still record data in memory that may be cleared, perform step 3 to start
recording.
YES
3
4
5
Press to start recording.
Press any key to stop recording.
Use the arrow keys to move the cursor to the desired
position to read the MAXIMUM, AVERAGE, and MINIMUM
values at that position.
You can turn the test tool off and read this record later via
the RECORD - DISPLAY RECORDED SIGNAL function.
(See Chapter 4 for more information.)
5 - 10
Fluke 98
Users Manual
Oxygen Sensor test with RECORD Î INTERMITTENT RECORD
The Intermittent Record function is an endless loop recorder that allows you to
continuously record the oxygen sensor screens for over 21 minutes. The oxygen
sensor is useful for emission system analysis, which allows easy fuel and ignition
system diagnosis.
1
Start the OXYGEN SENSOR test as described above.
Press to display the RECORD menu.
2
SELECT
If there is still record data in memory that may be cleared, perform step 3 to start
recording.
YES
3
Press to start recording.
4
Press to scroll backward through the record.
Press to scroll forward through the record.
You can turn the test tool off and read this record later via RECORD Î
VIEW RECORDED SIGNAL function. (See Chapter 4 for more
information.)
Automotive Applications
5 - 11
2b Dual Oxygen Sensor (Dual Lambda or Dual O2)
Both oxygen sensors provide an output voltage that represent the amount of
oxygen in the exhaust stream respectively before and after the catalytic
converter. The leading sensor signal is used as feedback for mixture control.
The signal from the trailing sensor is used by the vehicle computer to test
efficiency of the catalytic converter. The signal amplitude from the trailing sensor
will increase when the efficiency of the catalytic converter declines over years.
The difference in voltage amplitude from the sensors is a measure for the ability
of the catalytic converter to store oxygen for the conversion of harmful exhaust
gases.
Measurement Conditions for the Oxygen Sensor Test
•
Run the engine until the oxygen sensor is warmed to at least 600°F (315°C),
in closed loop. Use jumper leads or back probe to make connection at the
sensor wiring connector.
•
Run the engine at idle while increasing engine speed.
Test Tool Key Sequence for the Temperature Sensor Test
SELECT
1
SELECT
2
3
Connect the test leads as displayed by the test tool's Connection Help
and shown in Figure 5-5.
OK
4
Start the temperature sensor test now.
5 - 12
Fluke 98
Users Manual
Figure 5-5. Testing a Dual Oxygen Sensor
Catalytic Converter OK
Catalytic Converter Efficiency
poor
Figure 5-6. Example Result of a good and bad working Catalytic Converter
Automotive Applications
3
5 - 13
Temperature
(CTS) Coolant Temperature Sensor and (IAT) Intake Air Temperature Sensor
Most temperature sensors are Negative Temperature Coefficient (NTC)
thermistors, a resistor made from a semiconductor material. The electrical
resistance changes greatly and predictably as temperature changes. The
resistance of the NTC thermistor goes down as its temperature goes up, and its
resistance goes up when the temperature goes down.
Measurement Conditions for the Temperature Sensor Test
•
•
•
Turn the key ON, Engine OFF. With the sensor wiring harness connected,
measure the output voltage (engine COLD). ........or
Run the engine and monitor the voltage decrease (NTC) as the engine
warms.
This same test sequence can be performed while monitoring the resistance
value of the sensor. The sensor must then be disconnected.
Test Tool Key Sequence for the Temperature Sensor Test
SELECT
1
SELECT
2
Connect the test leads as displayed by the test tool's Connection Help
and shown in Figure 5-7.
3
OK
Start the temperature sensor test now.
4
or
OHM
You should disconnect the sensor before you press F2 to
test the sensor resistance.
Use the optional TR90 temperature probe to measure the actual coolant or
intake air temperature. (See Chapter 3 “Using Multimeter Functions”, section
“Testing Temperature”.)
5 - 14
Fluke 98
Users Manual
Figure 5-7. Testing a Temperature Sensor
Figure 5-8. Result Display from a Temperature Sensor Test
Automotive Applications
5 - 15
Coolant and Intake Air Temperature Sensors - NTC Thermistors
Temperature HOT
Temperature is decreasing,
causing the resistance to increase
Temperature COLD
Temperature sensors are normally
Negative Temperature Coefficient
thermistors (NTC)
Temperature sensor readings are typically
made over a long period of time
Specifications may vary. Consult manufacturer’s specifications.
5 - 16
4
Fluke 98
Users Manual
Throttle Position Sensor (TPS) Potentiometer and Switched
Throttle position sensors (TPS) are a common source of faults in today's
on-board computers. Some people think of a TPS as a replacement for an
accelerator pump on throttle body or port fuel-injected engines, but it is much
more. A TPS tells the on-board computer how far the throttle is open, whether it
is opening or closing and how fast. As the resistance of the TPS changes, so
does the voltage signal returning to the computer.
Potentiometer Sensor
Variable position sensors provide a dc voltage level that changes as the arm on
a variable resistor (potentiometer) is moved. A TPS is simply a variable resistor
connected to the throttle shaft. The changing dc voltage is used as an input to
the electronic control module.
Switched Type of Sensor
Some manufacturers use switches to determine the position of the throttle. The
signal to the ECU from this switch tells the ECU to control the idle speed (switch
closed, throttle closed) or not to control the idle speed (switch open because the
driver has moved the throttle linkage from the closed position). Another switch
closes to tell the ECU that the throttle is wide open.
The linear throttle position sensor is mounted to the throttle shaft and has two
movable contacts traveling along the same axis as the throttle valve. One is
used for the throttle opening angle and the other for the closed throttle signal.
Insure that the correct wires are monitored to determine a malfunctioning sensor.
Testing the DC Voltage from the Throttle Position Sensor
This is an in-circuit test (nothing disconnected) on the Throttle Position Sensor to
measure the dc voltage delivered.
Measurement Conditions for the Throttle Position Sensor Voltage Test
•
Turn the key ON, engine OFF. Sweep the throttle to the wide open position
and then to the closed position again, or vice versa.
Automotive Applications
5 - 17
Test Tool Key Sequence
SELECT
1
SELECT
2
3
Connect the test leads as displayed by the test tool's Connection Help
and shown in Figure 5-9.
OK
4
Starts the potentiometer sweep test.
To obtain the waveform shown in Figure 5-10 (Potentiometer-type
sensor) or the waveform shown in Figure 5-11 (Switched-type sensor),
sweep the sensor arm from closed to full open, and back to closed.
To obtain a continuous pattern while on a road test, simply increase the
time base to 500 ms or greater.
Figure 5-9. Testing a Throttle Position Sensor (In-circuit Voltage Test)
5 - 18
Fluke 98
Users Manual
Figure 5-10. Result Display of a Voltage Test on a Potentiometer-Type
Throttle Position Sensor
Figure 5-11. Result Display of a Voltage Test on a Switched-Type Throttle
Position Sensor
Automotive Applications
5 - 19
Throttle Position Sensor (Potentiometer)
Defective TPS Pattern
Spikes in a downward direction indicate
a short to ground or an intermittent
open in the resistive carbon strips
Peak voltage indicates
wide open throttle (WOT)
Voltage increase
identifies
enrichment
Voltage decrease
identifies enleanment
(throttle plate closing)
Minimum voltage
indicates closed
throttle plate
DC offset indicates voltage
at key on, throttle closed
Specifications may vary. Consult manufacturer’s specifications.
5 - 20
Fluke 98
Users Manual
Throttle Position Sensor - Switch Type
Throttle at position other than closed.
(Not necessarily wide open throttle)
Reference voltage
Ringing may indicate
worn contacts or loose
throttle return springs
Transitions should be
straight and vertical
Throttle plate closed
Throttle opening and
voltage transitioning
To insure proper results from your test,
verify the type of sensor under test
Switches are often used to indicate
closed throttle or wide open throttle (WOT)
Specifications may vary. Consult manufacturer’s specifications.
Automotive Applications
5
5 - 21
Crankshaft/Camshaft Position (CPS)
Hall-Effect, Magnetic, and Optical Sensors
Magnetic Sensors (Variable Reluctance Sensors) do not require a separate
power connection. They have two shielded connecting wires for the stationary
magnet's coil. Small signal voltages are induced as the teeth of a trigger wheel
pass through the magnetic field of this stationary magnet and coil. The trigger
wheel is made of a low magnetic reluctance steel.
Crankshaft Position Sensor (CPS), Anti-Lock Brake Sensor (ABS), and Vehicle
Speed Sensor (VSS) are examples of Variable Reluctance Sensors. Output
voltage and frequency vary as vehicle speed changes.
In a Hall-Effect Sensor, a current is passed through a semiconductor that is
positioned close to a varying magnetic field. These variations can be caused by
the turning of a crankshaft or the rotation of a distributor shaft.
Hall-Effect Sensors are used in Crankshaft Position Sensors and Distributors.
Output voltage amplitude is constant; frequency changes as rpm changes.
Optical Sensors use a rotor disk that separates LEDs from optical pickups.
Small openings, or slits, in the rotor disk, allow light from the LEDs to energize
the optical pickups. Each time a slit aligns with the LEDs and optical pickups, the
pickup sends out a pulse.
The resulting voltage variations can then be used as a reference signal for other
systems. The output voltage amplitude is constant; frequency changes as rpm
changes.
A cam sensor is commonly installed in place of the ignition distributor. The
sensor sends electrical pulses to the coil module and gives data on camshaft
and valve position.
5 - 22
Fluke 98
Users Manual
Measurement Conditions
•
•
•
Look for presence of a signal. If there is a signal, the problem is somewhere
else. If there is no signal, look for a defective sensor or a wiring problem.
If you are diagnosing a NO START CONDITION, connect the test tool as
described in the test tool's Connection Help and crank the engine.
If the engine runs, connect the test tool as described in the test tool's
Connection Help and start the engine. Run the test at idle and at higher rpm
values.
Test Tool Key Sequence
SELECT
1
SELECT
2
3
Connect the test leads as displayed by the test tool's Connection Help
and shown in Figure 5-12.
OK
4
Starts the Crankshaft Position Sensor test.
Automotive Applications
5 - 23
Figure 5-12. Testing a Magnetic Crankshaft Position Sensor
Figure 5-13. Result Display from a Magnetic Crankshaft Position Sensor Test
5 - 24
Fluke 98
Users Manual
Crankshaft Position Sensor (Hall Effect)
The upper horizontal
lines should reach
reference voltage
Voltage transitions
should be straight
and vertical
Peak to peak
voltages should
equal reference
voltage
The lower horizontal lines
should almost reach ground
Crankshaft Position Sensor (Magnetic)
Maximum peak levels should be equal
to each other. If one is shorter than
another, look for a chipped or bent
tooth on the trigger wheel
These two pulses identify
cylinder # 1 TDC.
Maximum peak levels should be
equal to each other. If one is
shorter than another, look for a
chipped or bent tooth on the
trigger wheel
Specifications may vary. Consult manufacturer’s specifications.
Automotive Applications
5 - 25
Camshaft Position Sensor
Maximum peak
Waveform shaped by
physical characteristics of
trigger wheel passing the
magnetic coil
Tooth approaching
alignment
Tooth in alignment
Ground reference
Toothe moving away
from alignment
Minimum peak
Specifications may vary. Consult manufacturer’s specifications.
5 - 26
6
Fluke 98
Users Manual
Ride Height (Position) Potentiometer
Variable position sensors provide a dc voltage level that changes as the arm on
a variable resistor (potentiometer) is moved. A ride height sensor is simply a
variable resistor connected between the vehicle frame and the rear axle or inside
the strut assembly. The changing dc voltage is used as an input to the electronic
control unit to adjust ride height.
Some manufacturers use optical or hall-effect sensors. Use GENERAL
SENSORS to test these types of sensors.
Measurement Conditions
•
•
•
Turn the key ON, engine OFF. Backprobe the sensor's connector or use
jumper wires. Disconnect the moveable arm of sensor (attached to the rear
axle.) Move the arm from stop to stop to monitor the full
Turn the key OFF, engine OFF. Test the sensor's resistance by carefully
disconnecting the sensor from its associated wiring harness. Use the
resistance mode to determine if there is an open or short in the
potentiometer.
Reconnect the movable arm to the rear axle and adjust the ride height sensor
to the specifications found in the vehicle's service manual.
Test Tool Key Sequence
SELECT
1
SELECT
2
3
Connect the test leads as displayed by the test tool's Connection Help
and shown in Figure 5-14.
OK
4
Starts the sweep test.
Automotive Applications
5 - 27
Figure 5-14. Testing a Ride Height Sensor
Figure 5-15. Result Display of a Voltage Test on a Ride Height Sensor
5 - 28
Fluke 98
Ride Height Sensor
Vehicle shocks fully extended
vehicle height at maximum
Weight added to the vehicle causing
vehicle height to lower
Potentiometer on height sensor
reducing output voltage
Lower voltage is interrupted by the
electronic control module causing the
air suspension to extend
Specifications may vary. Consult manufacturer’s specifications.
Users Manual
Automotive Applications
7
5 - 29
Vehicle Speed Sensor (VSS) Magnetic, Hall-Effect,
and Optical
The VSS output signal is directly proportional to vehicle speed. The ECU
controls torque-converter clutch lockup, electronic transmission shift levels, and
other functions from this signal. There are three main sensor types used for the
Vehicle Speed Sensor, magnetic, Hall-effect, and optical.
Variable Reluctance Sensors (magnetic) do not require a separate power
connection and have two connecting wires for the stationary magnet's coil. Small
signal voltages are induced as the teeth of a trigger wheel, made of a low magnetic
reluctance steel, pass through the magnetic field of a stationary magnet and coil.
Optical sensors use a rotor disk that separates LEDs from optical pickups. Small
openings, or slits, in the rotor disk, allow light from the LEDs to energize the
optical pickups. Each time a slit aligns with the LEDs and optical pickups, the
pickup sends out a pulse.
Measurement Conditions
•
•
•
Raise the drive wheels off the ground and place the transmission in drive.
Connect the test tool to the sensor according to the instruments Connection
Help and start the engine.
Monitor the VSS output signal at low speed while gradually increasing the
speed of the drive wheels.
Test Tool Key Sequence
SELECT
1
SELECT
2
3
Connect the test leads as displayed by the test tool's Connection Help
and shown in Figure 5-16.
OK
4
Starts the Vehicle Speed Sensor test.
5 - 30
Fluke 98
Users Manual
Figure 5-16. Testing a Vehicle Speed Sensor
Figure 5-17. Result Display from a Magnetic Vehicle Speed Sensor Test
Automotive Applications
5 - 31
Figure 5-18. Result Display from a Hall-Effect Vehicle Speed Sensor Test
Vehicle Speed Sensor (Magnetic)
If the amplitude is low, look for an excessive air gap between the trigger wheel
and the pickup.
If the amplitude waivers, look for a bent trigger wheel or shaft.
If one of the oscillations look distorted, look for a bent or damaged tooth on the
trigger wheel.
Peak-to-peak values should be
identical and the signal should
look symmetrical at constant speed
Improper air gap or missing teeth on a
trigger wheel will cause an erratic signal
5 - 32
Fluke 98
Users Manual
Vehicle Speed Sensor (Optical)
The upper horizontal
lines should reach
reference voltage
Voltage transitions
should be straight and
vertical
Peak-to-peak voltages
should equal
reference voltage
Voltage drop to ground should
not exceed 400 mV
The lower horizontal
lines should almost
reach ground
If the voltage drop is greater
than 400 mV, look for a bad
ground at the sensor or ECU
Signal frequency increases as the
speed of the vehicle increases
Specifications may vary. Consult manufacturer’s specifications.
Automotive Applications
8
5 - 33
Anti-Lock Wheel Speed Sensor (ABS) Magnetic
The ABS computer compares the frequencies, but not voltage levels, from
magnetic wheel sensors, and uses this information to maintain wheel speeds
while braking. The frequency is directly related to the wheel speed, and
increases as the wheel speed increases.
Variable Reluctance Sensors do not require a separate power connection and
have two connecting wires for the stationary magnet's coil. Small signal voltages
are induced as the teeth of a trigger wheel, made of a low magnetic reluctance
steel, pass through the magnetic field of a stationary magnet and coil.
Measurement Conditions
•
•
Raise the vehicle off the ground.
Key OFF, Engine OFF. Disconnect the wheel speed sensor from the vehicle's
wiring harness. Connect the test tool to the wheel speed sensor connector
and rotate the wheel.
or
•
Engine RUNNING. Back probe the connector leading to the wheel speed
sensor (or use a breakout box.) Place the transmission in drive, and slowly
accelerate the drive wheels. To test the non-drive wheels, use the procedure
outlined above in Key OFF, Engine OFF.
5 - 34
Fluke 98
Users Manual
Test Tool Key Sequence
SELECT
1
SELECT
2
3
Connect the test leads as displayed by the test tool's Connection Help
and shown in Figure 5-19.
OK
4
Starts the ABS Wheel Speed Sensor test.
(See Figure 5-19 and 5-20.)
Use the RECORD - PLOT READINGS function to monitor the sensor over time
and find intermittents that can cause the MIL (Malfunction Indicator Lamp) to
light.
Press the RECORD button.
Select PLOT READINGS and press F5 to Select.
Automotive Applications
5 - 35
Figure 5-19. Testing an Anti-Lock Wheel Speed Sensor
Figure 5-20. Result Display from an Anti-Lock Wheel Speed Sensor Test
5 - 36
Fluke 98
Users Manual
Anti-Lock Wheel Speed Sensor Analysis
If the amplitude is low, look for an excessive air gap between the trigger wheel
and the pickup.
If the amplitude wavers, look for a bent axle.
If one of the oscillations looks distorded, look for a bent or damaged tooth on the
trigger wheel.
Improper air gap from a tone wheel or missing
teeth on a wheel speed sensor will produce an
erratic signal
Peak-to-peak values should be the
same, and the signal should look
symmetrical
Specifications may vary. Consult manufacturer’s specifications.
Automotive Applications
5 - 37
AIR/FUEL
9
Air Flow Sensors
Analog, Digital, and Potentiometer Sensors
ANALOG MASS AIR FLOW SENSOR (MAF)
This mass air flow sensor uses a heated-metal-foil sensing element to measure
air flow entering the intake manifold. The sensing element is heated to a
temperature of about 170qF (77qC), above the temperature of incoming air.
As air flows over the sensing element, it cools the element, causing resistance to
drop. This causes a corresponding increase in current flow, which causes supply
voltage to decrease. This signal is seen by the ECU as a change in voltage drop,
(an increase in air flow causes an increase in voltage drop), and is used as an
indication of air flow.
DIGITAL MASS AIR FLOW SENSOR (MAF)
This type of air flow sensor receives a 5 volt reference signal from the electronic
control unit and sends back a variable frequency signal that is equivalent to the
mass of air entering the engine. The output signal is a square wave, with
amplitude fixed at 0 and 5 volts. Frequency of the signal varies from about 30 to
150 Hz. Low frequency equals low air flow; high frequency equals high air flow.
AIR FLOW METER (Potentiometer)
Air-flow meters have a spring-loaded vane that pivots on a shaft as it opens and
closes in response to a volume of incoming air. A variable resistor "potentiometer"
is connected to the vane at its pivot point, causing the output voltage signal to
change as the air vane angle changes. When the vane is wide open, the ECU
knows that a maximum amount of air is being drawn into the engine, and when it
is closed, a minimum amount of air is entering the engine. The ECU responds by
increasing or decreasing fuel injector pulse width accordingly.
The electronic control units use these signals to calculate fuel injector pulse
width or ON time and ignition timing. Engine coolant temperature, engine speed,
manifold air temperature, and the air flow sensor signals enable the computer to
make the necessary calculations and adjustments.
5 - 38
Fluke 98
Users Manual
Measurement Conditions
Connect the test tool to the output signal from the air flow sensor (or meter).
Start the engine and allow the engine to idle. Slowly accelerate the engine
while watching the display.
Use a screwdriver handle and gently tap on the sensor while performing this
test. Loose connections in the sensor can cause momentary hesitations and
flat spots.
•
•
•
Test Tool Key Sequence for a Mass Air Flow Sensor Test
SELECT
1
SELECT
2
3
Connect the test leads as displayed by the test tool's Connection Help
and shown in Figure 5-21.
OK
4
Starts the Mass Air Flow Sensor test.
If necessary, use the arrow keys to range.
Automotive Applications
5 - 39
Figure 5-21. Testing an Analog MAF Sensor
Figure 5-22. Result Display from an Analog MAF Sensor Test
INTERMITTENT RECORD is a powerful function to watch the signal over time.
This function also gives you more time to activate the MAF Sensor and then stop
recording. See the example for Oxygen Sensor on page 5-10.
5 - 40
Fluke 98
Users Manual
Figure 5-23. Result Display from a Digital MAF Sensor Test
Mass Air Flow Sensor (Digital)
The upper horizontal
lines should reach
reference voltage
Peak-to-peak voltages
should equal
reference voltage
The lower horizontal lines
should almost reach ground
Voltage drop to ground should not exceed 400 mV.
If the voltage drop is greater than 400 mV, look for a bad ground at the sensor or
ECU.
Signal frequency increases as the air flow through the sensor increases.
Automotive Applications
5 - 41
Mass Air Flow Meter (Analog)
Wide open throttle,
maximum acceleration
Idle air bypass compensating
air flow into intake manifold
Air flow into the
intake manifold is
increasing
Damping action caused
by air flap movement
As the air flow increases, output voltage increases
Figure 5-24. Testing an Air Flow Meter (Potentiometer)
Specifications may vary. Consult manufacturer’s specifications.
5 - 42
Fluke 98
Users Manual
Use Potentiometer Sweep Test to test this volume Air Flow Meter (see page 5-15).
Figure 5-25. Result Display from a Volume Air Flow Meter Test
Air Flow Meter (Potentiometer)
Spikes in a downward direction indicate
a short to ground or an intermittent
open in the resistive carbon strips
Peak voltage indicates
maximum air flow entering
intake manifold
A voltage decrease
indicates less air is
flowing into the
intake manifold
A voltage increase
identifies an
increase of airflow
into the intake
manifold
Minimum voltage
indicates a closed
throttle plate
Specifications may vary. Consult manufacturer’s specifications.
Automotive Applications
10
5 - 43
Exhaust Gas Recirculation (EGR)
Pulse Width (Control) Potentiometer (Sensor)
CONTROL
EGR dilutes the air-fuel mixture and limits NOx formation when combustion
temperatures are high and air-fuel ratios are lean. On a gasoline engine, EGR
should operate during moderate acceleration and at cruising speeds from 30 to
70 mph (50 to 120 km/h).
The ECU controls the application of EGR by applying or blocking vacuum,
providing a signal to de-energize or energize a solenoid, or by using a
pulse-width-modulated solenoid.
SENSOR
Variable position sensors provide a dc voltage level that changes as the arm on
a variable resistor (potentiometer) is moved. An EGR valve position sensor is
simply a variable resistor connected to a plunger shaft that rides atop the EGR
valve. The changing dc voltage is used as an input to the electronic control unit
to indicate EGR operation.
Measurement Conditions
Control
•
Engine RUNNING. With the test tool connected to the EGR valve, slowly
increase engine speed to cruise speed.
NOTE: Most EGR valves will not open until the engine is placed under load.
For this reason a road test or dyno may be necessary.
Sensor
•
•
•
CAUTION:
Perform the following tests on a cold
engine to prevent personal injury.
Key ON, Engine OFF. Back probe the position sensor on top of the EGR
valve and carefully (with a cold engine), raise the EGR from its seat position.
If there is limited or no access to the EGR diaphragm, running the vehicle
under a load may be necessary to move the EGR valve.
Key OFF, Engine OFF. Disconnect the sensor from the engine wiring harness
and carefully raise the EGR from its seated position. Some position sensors
can be separated from the EGR valve to allow access to the sensor plunger.
To test the position sensor, use POTENTIOMETER SWEEP TEST under
GENERAL SENSORS
5 - 44
Fluke 98
Users Manual
Test Tool Key Sequence
SELECT
1
SELECT
2
3
Connect the test leads as displayed by the test tool's Connection Help
and shown in Figure 5-26.
OK
4
Starts the EGR test.
Figure 5-26. Testing an EGR Valve
Automotive Applications
5 - 45
Figure 5-27. Result Display from an EGR Valve Test
Exhaust Gas Recirculation (EGR) valve Position Sensor
EGR valve open nearly all the way
allowing flow of exhaust gas
EGR valve closed restricting
the flow of exhaust gas
Specifications may vary. Consult manufacturer’s specifications.
5 - 46
11
Fluke 98
Users Manual
Fuel Injection (FI)
Current Controlled (Peak and Hold) including Throttle Body Injection
(TBI), Conventional (Saturated Switch), and Pulse Width Modulated
Injectors
Electronic fuel injectors are controlled by the ECU and influenced by a variety of
operating conditions including temperature, engine load, and feedback from the
O2 sensor during closed loop operation.
Fuel injection on-time can be expressed in ms pulse width and indicates the
amount of fuel delivered to the cylinder. Greater pulse width means more fuel,
provided the fuel pressure stays the same.
The ECU provides a ground path for the injector through a driver transistor.
When the transistor is "on", current flows through the injector winding and the
transistor to ground, opening the injector valve.
There are three main fuel injector systems, each with its own method for
controlling fuel injection. All injectors have some method for limiting the electrical
flow through the injector too much current flow could burn out the injector.
Current Controlled (Peak and Hold)
Peak and Hold injector circuits actually use two circuits to energize the injectors.
Both circuits come on to energize the injector, this sends a high initial current to
the injector, allowing it to open quickly.
Then, after the injector opens, one circuit releases, leaving the second circuit to
hold the injector open through the duration of its on time. This circuit adds a
resistance to the circuit, to reduce the current flow through the injector.
When the second circuit shuts off, the injector closes, ending the injector's on
time. To measure on-time, look for the falling edge of the on-time pulse, and the
second rising edge, which indicates where the second circuit shut off.
Throttle Body Injection (TBI)
The throttle body assembly was designed to replace the carburetor. The pulse
width represents the amount of time the injector is energized or ON. The pulse
width is varied by the ECU in response to changes in engine operation and
driving conditions.
Conventional (Saturated Switch)
The injector driver transistor applies constant current to the injector. Some
injectors use a resistor to limit the current flow; others have a high internal
resistance. These injectors have a single rising edge.
Automotive Applications
5 - 47
Pulse Width Modulated Injectors
Pulse modulated injectors have a high initial current applied to energize the
injector quickly. Then, after the injector is open, the ground begins pulsing on
and off to extend injector on time, while limiting the current applied to the injector.
Measurement Conditions
Engine RUNNING after you have connected the test tool to the ground side
of the fuel injector by using a back probe, jumper wire, or breakout box. Begin
the test with the engine idling, and slowly increase engine speed while
monitoring the injector signal.
Increase engine load by varying the MAP sensor signal or by changing the
output signal from the oxygen sensor.
One method is to disconnect the oxygen sensor from its harness and ground
the lead (harness side.) This will cause the voltage signal going to the ECU to
decrease. The ECU will respond by widening the injector pulse width.
However, this method may set an error code.
Hold the harness connector in one hand and touch the + (positive) side of the
battery. This will cause an increase in oxygen sensor signal voltage going to
the ECU. The ECU will respond by narrowing the pulse width of the fuel
injector.
•
•
•
•
Test Tool Key Sequence
1
SELECT
2
SELECT
3
4
Connect the test leads as displayed by the test tool's Connection Help
and shown in Figure 5-28.
OK
5
Starts the Fuel Injector test.
5 - 48
Fluke 98
Users Manual
Figure 5-28. Testing a Fuel Injector
Figure 5-29. Result Display from a Fuel Injector Test
Automotive Applications
5 - 49
Conventional (Saturated Switch Driver) Fuel Injector
Peak voltage caused by the
collaps of the injector coil
Driver transistor
turns on, pulling
the injector pintle
away from its
seat, starting fuel flow
Battery voltage
(or source voltage)
supplied to the injector
Driver transitor turns off,
discontinuing fuel flow
Injector ON-Time
Specifications may vary. Consult manufacturer’s specifications.
5 - 50
Fluke 98
Users Manual
Pulse-Width Modulated Fuel Injector
Current flow
pulsed on and
off enough to
keep hold in
winding activated
Peak voltage caused
by the collapse of the
injector coil, when
current is reduced
Battery voltage
(or source voltage)
supplied to the
injector
Driver transistor
turns on, pulling
the injector pintle
away from its
seat, starting fuel
flow
Return to battery
(or source) voltage
Injector On-Time
Specifications may vary. Consult manufacturer’s specifications.
Figure 5-30. Testing a Throttle Body Injection System
Automotive Applications
5 - 51
Current-Controlled (peak and Hold) Fuel Injector (Throttle Body and
Port Fuel Injection Systems)
Peak voltage caused by
the collapse of the
injector coil, when
current is reduced
Current reduced
enough to keep hold
in winding activated
Driver transistor turns
on, pulling the injector
pintle away from its
seat, initiating fuel flow
Battery voltage (or source voltage)
supplied to the injector
Injector On-Time
Driver transistor turns
off, ending fuel flow
Specifications may vary. Consult manufacturer’s specifications.
5 - 52
12
Fluke 98
Users Manual
Mixture Control Solenoid (MC) ( Pulse Width
Computer controlled systems use a mixture control solenoid and stepper motor
to control fuel metering, along with throttle position sensors and oxygen sensors
which help control injection times by sending signals back to the ECU.
The MC solenoid is duty cycled by a solid-state grounding switch in the ECU.
When the solenoid is activated, metering rods are forced downward restricting
fuel flow. When the ECU opens the circuit, the restriction in the main metering
system is removed, thus providing a rich mixture.
Measurement Conditions
Engine RUNNING after you have connected the test tool to the
mixture-control solenoid by using a back probe or jumper wire. (Some
vehicles have a pigtail harness near the solenoid for ease of connection.)
Insure that the engine management system is under fuel control (pulse width
varying) and that the engine is in closed loop.
Create a large vacuum leak (brake booster), and watch the signal change as
the ECU enriches the mixture to compensate for the vacuum leak.
Close the choke or use propane enrichment to enrich the mixture. Watch the
signal change as the ECU compensates for the lack of oxygen at the oxygen
sensor.
•
•
•
Test Tool Key Sequence
1
SELECT
2
SELECT
3
4
Connect the test leads as displayed by the test tool's Connection Help
and shown in Figure 5-31.
OK
5
Starts the Mixture Control test.
Automotive Applications
Figure 5-31. Testing a Mixture Control Solenoid
Figure 5-32. Result Display from a Mixture Control Solenoid Test
5 - 53
5 - 54
13
Fluke 98
Users Manual
Idle Air Control / Idle Speed Control (IAC/ISC)
Duty Cycle and Voltage
The idle air control (IAC) is controlled by the ECU to regulate or adjust engine
idle speed and prevent stalling. Some idle air-control systems use a stepper
motor to control the amount of air allowed to bypass the throttle plate, and others
use a bypass valve that receives a square wave signal from the ECU.
Due to solenoidsoleniod reactance, this signal may be shaped differently.
Measurement Conditions
Engine RUNNINGafter you have connected the test tool to the Idle Air
Control valve. Monitor the valve's operation with the engine cold, warming
up, and hot.
Introduce a small vacuum (false air) leak, and watch the signal from the ECU
as it adjusts the valve's opening.
•
•
Test Tool Key Sequence
SELECT
1
SELECT
2
3
Connect the test leads as displayed by the test tool's Connection Help
and shown in Figure 5-33.
OK
4
Starts the Idle Air Control test.
Automotive Applications
Figure 5-33. Testing an Idle Air Control Valve
Figure 5-34. Result Display from an Idle Air Control Valve Test
5 - 55
5 - 56
Fluke 98
Users Manual
Idle Air Compensation Valves
Idle Air Bypass waveforms may have unique shapes such as these and have a
saw-curved appearance due to inductance reactance.
Specifications may vary. Consult manufacturer’s specifications.
Automotive Applications
5 - 57
IGNITION
14
Knock Sensor Piezo Crystal (Burst Pattern)
To optimize performance and fuel economy, ignition timing should be adjusted so
that combustion occurs during a specific number of degrees of crankshaft
rotation, beginning at TDC of the power stroke. If ignition occurs later, less power
is produced by that cylinder, and if it occurs too soon, detonation will occur.
Most knock sensors contain a piezoelectric crystal that is screwed into the
engine block. This is a special type of crystal that generates a voltage when it is
subjected to mechanical stress. The crystal produces an electrical signal that
has a unique signature based on the knock condition.
The output voltage is used by the ECU to adjust ignition timing to optimize
engine performance.
Measurement Conditions
Out-Of-Circuit Test (Sensor Disconnected)
Disconnect the knock sensor from the vehicle's wiring harness. Connect the
test tool to the sensor.
Use a small mallet and gently tap the engine block near the sensor to
generate a signal.
•
•
In-Circuit Test of the Knock Sensor (Retarding Test)
Perform the Timing Advance test as described in Application #19.
Use a small mallet and gently tap the engine block near the sensor to
activate the knock sensor.
Watch the ignition timing to insure that the timing retards as a knock signal is
received by the ECU.
•
•
•
5 - 58
Fluke 98
Users Manual
Test Tool Key Sequence for the Out-of-circuit Knock Sensor Test
SELECT
1
SELECT
2
3
Connect the test leads as displayed by the test tool's Connection Help
and shown in Figure 5-35.
OK
4
Starts the Knock Sensor test.
If necessary, use the arrow keys to adjust the range, and
press F3 to repeat the test.
Figure 5-35. Testing a Knock Sensor (Disconnected)
Automotive Applications
5 - 59
Figure 5-36. Result Display from a Knock Sensor Test
Knock Sensor
Amplitude
changes
Frequency
change
The pattern from this sensor is directly related to the cause and severity of the
knock. For this reason each signal looks slightly different.
The main thing is to check for the presence of a signal.
On most vehicles, when the ECU receives a knock signal from the knock sensor,
it retards ignition timing until the knock disappears.
Specifications may vary. Consult manufacturer’s specifications.
5 - 60
15
Fluke 98
Users Manual
Secondary Ignition
Conventional Single, Conventional Parade, and DIS Single
Secondary ignition patterns are useful when diagnosing ignition related
malfunctions.
The secondary scope pattern is divided into three sections:
1. Firing
2. Intermediate
3. Dwell
4. Observe these sections during diagnosis.
SECONDARY FIRING SECTION
The firing section has a firing line and a spark line. The firing line is a vertical line
that represents the voltage required to overcome the gap of the spark plug. The
spark line is a semi-horizontal line that represents the voltage required to
maintain current flow across the spark gap.
SECONDARY INTERMEDIATE SECTION
The intermediate section displays the remaining coil energy as it dissipates itself
by oscillating between the primary and secondary side of the coil (with the points
open or transistor off).
SECONDARY DWELL SECTION
The dwell section represents coil saturation, which is the period of time the
points are closed or the transistor is ON.
When PARADE is selected, the Fluke 98 will present a parade of all the
cylinders, starting at the left with the spark line of the number 1 cylinder. The
scope will display the pattern for each cylinder's ignition cycle in the engine's
firing order. For example: if the firing order for a given engine is 1,4,3,2, the
scope will display the ignition cycles for each cylinder as shown starting with
cylinder number 1, then 4, then 3, and then 2.
DISTRIBUTORLESS IGNITION SYSTEM (DIS) Single
Most distributorless ignition systems use a waste spark method of spark
distribution. Each cylinder is paired with the cylinder opposite to it (1-4, or 3-6,
or 2-5). The spark occurs simultaneously in the cylinder coming up on the
compression stroke and in the cylinder coming up on the exhaust stroke.
The cylinder on the exhaust stroke requires very little of the available energy to
fire the spark plug. The remaining energy is used as required by the cylinder on
the compression stroke. The same process is repeated when the cylinders
reverse roles.
Automotive Applications
5 - 61
Measurement Conditions
•
Follow the test tool's instructions for probe selection and connection
information.
•
Engine RUNNING. Test the ignition system under varying load and speed
conditions to verify component integrity. Spark plugs, ignition wires, and other
secondary ignition components may fail when a high demand is present. Run
these tests under load (on a dyno or road test) to accurately determine
system malfunctions.
Test Tool Key Sequence
OK
1
At power on, check the settings in the VEHICLE DATA
MENU. The following steps (2 to 9) describe the procedure
for a conventional ignition system (IGNITION: CONV).
2
Press this key if the Vehicle Data are correct.
SELECT
3
SELECT
4
5
Connect the test leads as displayed by the test tool's Connection Help
and shown in Figure 5-37. The Inductive Pickup must be clamped on the
spark plug wire close to the spark plug.
OK
6
Starts the Secondary Ignition tests.
5 - 62
Fluke 98
Users Manual
If you want to test SECONDARY IGNITION SINGLE, do the following:
7
8
PARADE
SINGLE
Press to highlight SINGLE.
Connect the test leads as displayed by the test tool's Connection Help
and shown in Figure 5-37. The Inductive Pickup must be clamped on the
spark plug wire close to the spark plug.
OK
Starts the SINGLE Secondary Ignition test.
9
If you want to test SECONDARY IGNITION on a DIS, you have to setup the test
tool as follows (assumed that you are in the secondary ignition test already):
VEHICLE
DATA
7
SELECT
8
SELECT
9
OK
Selects DIS as the default ignition system.
10
11
Repeat steps 3 and 4 to re-select INGITION Î SECONDARY.
12
Connect the test leads as displayed by the test tool's Connection Help
and shown in Figure 5-39 and Figure 5-41.
OK
13
Starts the Secondary Ignition (DIS) test.
Automotive Applications
5 - 63
Figure 5-37. Testing Secondary Ignition Conventional Single and Parade
SINGLE Cylinder Display
PARADE Display
Figure 5-38. Result Display from Secondary Ignition Conventional
5 - 64
Fluke 98
Figure 5-39.
Users Manual
Testing Secondary Ignition DIS Single
Use the F3 key to set the optimal RPM
SENSitivity level:
•
Set RPM SENS LOW if the RPM
reading is clearly too high, due to a
high noise level.
•
Set RPM SENS HIGH (common
setting) when the RPM reading gets
unstable, most likely under high load
and high RPM conditions.
Figure 5-40. Result Display from Secondary Ignition DIS Single
Automotive Applications
5 - 65
GM HEI System Connection
TOYOTA HEI System Connection
HONDA HEI System Connection
Figure 5-41. HEI System Connections with the CAP90 Secondary Pickup
5 - 66
Fluke 98
Users Manual
Secondary Conventional (Single)
Firing Line (spark initiated)
Points close or
transistor turns ON
Spark Line
Spark is extinguished
Points open or
transistor turns OFF
Coil oscillations
Dwell Section
Intermediate Section
Firing
Section
Secondary Conventional (Parade)
Firing lines should be equal. A short line
indicates low resistance in the wire. A high
line indicates high resistance in the wire
Firing lines clearly displayed
for easy comparison
Available voltage
should be about 10 kV
on a conventional ignition
system and even greater
with an electronic system
Spark lines can be viewed side- by-side
for ease of comparison
Cylinders are displayed in firing order
Specifications may vary. Consult manufacturer’s specifications.
Automotive Applications
16
5 - 67
Primary Ignition
DWELL
Each time the breaker points or transistor opens, the coil secondary winding
discharges high voltage to a spark plug. When closed, the points or transistor
allow magnetic saturation to develop in the coil. The distributor, or ignition, dwell
angle is the number of degrees of distributor rotation during which the points or
transistor are closed (or magnetic saturation time in degrees).
It normally takes about 10 to 15 milliseconds (.010 to .015 second) for an ignition
coil to develop complete magnetic saturation from primary current.
Measurement Conditions
Follow the test tool's instructions for probe selection and connection
information.
Engine RUNNING. Test the ignition system under varying load conditions to
verify component integrity. Primary ignition modules tend to fail under high
demand and temperature conditions.
•
•
Test Tool Key Sequence
1
SELECT
2
SELECT
3
4
Connect the test leads as displayed by the test tool's Connection Help
and shown in Figure 5-42.
OK
5
Starts the dwell test.
5 - 68
Fluke 98
Figure 5-42. Testing Dwell
Figure 5-43. Result Display from a Dwell Test
Users Manual
Automotive Applications
17
5 - 69
Distributor Triggering
Magnetic, Hall-Effect, and Optical Triggering Devices
MAGNETIC DISTRIBUTOR TRIGGERING
Magnetic sensors used for distributor triggering have a permanent magnet and a
pole piece. Fine wire is wrapped around the pole piece to form a pickup coil. A
non-magnetic trigger wheel is attached to the distributor shaft and has as many
teeth as the engine has cylinders. As a tooth of the trigger wheel passes through
the magnetic field (built up around the pickup coil), a signal is generated.
Magnetic, or variable reluctance sensors, typically have only two wires and
generate their own signal voltage.
HALL-EFFECT DISTRIBUTOR TRIGGERING
A Hall-effect switch has a stationary sensor and a rotating trigger wheel and
requires a small input voltage to generate an output voltage. When a shutter
blade enters the gap between the magnet and the Hall element, the output
voltage changes. This signal is sent as a square wave to the ignition module to
trigger the coil.
OPTICAL DISTRIBUTOR TRIGGERING
An optical signal alternator uses the light from a light-emitting diode (LED) to
strike a photo transistor and generate a voltage signal. The trigger wheel is a
slotted disc that passes between the LED and the photo transistor.
Measurement Conditions
If you are diagnosing a NO START CONDITION, connect the test tool as
described in the test tool's Connection Help and crank the engine. Look for
presence of a signal. If there is a signal, the problem is somewhere else. If
there is no signal or the amplitude is small, look for a defective sensor or a
wiring problem.
If the engine runs, connect the test tool as described in the test tool's
Connection Help and start the engine. Run the test at idle and at different
rpm's, and under various load conditions
•
•
5 - 70
Fluke 98
Users Manual
Test Tool Key Sequence
SELECT
1
SELECT
2
3
Connect the test leads as displayed by the test tool's Connection Help
and shown in Figure 5-44.
OK
4
Starts the distributor triggering test.
Figure 5-44. Testing a Hall Effect Distributor Triggering System
Automotive Applications
5 - 71
Figure 5-45. Result Display from a Hall Effect Distributor Triggering Test
Primary Distributor Triggering (Hall Effect)
The upper horizontal
lines should reach
reference voltage
Voltage transitions
should be straight
and vertical
Peak to peak
voltages should
equal reference
voltage
The lower horizontal lines
should almost reach ground
The duty cycle of the signal remains fixed, determined by the spacing between
shutter blades.
Frequency of the signal increases as the speed of the engine increases.
Specifications may vary. Consult manufacturer’s specifications.
5 - 72
Fluke 98
Users Manual
Primary Distributor Triggering (Magnetic)
Maximum peak
levels should
be equal to
each other.
If one is shorter
than the other,
look for a chipped
or bent tooth on
the trigger wheel.
The waveform
signature is
created from the
unique shape of
the trigger wheel
tooth,passing
the pickup coil.
Minimum peak levels should be equal
to each other. If one is shorter than the
other, look for a chipped or bent tooth
on the trigger wheel.
Primary Distributor Triggering (Optical)
Voltage transitions should
be straight and vertical
The Upper horizontal
lines should reach
reference voltage
Peak-to-peak
voltages should
equal reference
voltage
The lower horizontal lines
should almost reach ground
SIGNAL PULSE WIDTH MAY
VARY DUE TO SIZE
VARIATIONS IN THE
TRIGGER WHEEL WINDOW
Specifications may vary. Consult manufacturer’s specifications.
Automotive Applications
18
5 - 73
Relative Compression
The test tool calculates the relative compression of the cylinders by measuring the
voltage drop or current increase created from each cylinder during cranking. For
the synchronized (SYNC) relative compression test, the Trigger Pickup clamped
on the spark plug wire of cylinder #1, is used to identify the cylinders in the result
display. This is a very useful test to determine compression differences between
cylinders and identify a weak cylinder. The Synchronized Relative Compression
test does not work on DIS and COP systems, and on Diesel engines.
Measurement Conditions
•
•
•
•
This test requires several conditions to get test results that can be interpreted
properly and are not misleading. Verify test result by physical compression
test prior to mechanical repair.
Interpretation of test results is easier for engines with 6 cylinders or less. It
becomes increasingly more difficult as the number of cylinders increase, due
to more compression overlap and less difference in current draw of the
starter motor.
Disable engine run by momentarily interrupting the fuel supply. (Pull the fuel
pump fuse or clamp the flexible fuel pressure line.)
On some engines, holding the throttle wide open during cranking will give the
best results to get an evenly distributed air intake.
Test Tool Key Sequence
1
SELECT
2
SELECT
3
4
Read the display for connection information and instructions to perform
the test. See the test setup in Figure 5-46. Don’t forget to connect the
blue Filter Adapter on INPUT A. The Inductive Pickup must be clamped
on the spark plug wire of the first cylinder close to the spark plug,
otherwise the test may not work.
OK
5
Starts the Synchronized Relative Compression test
5 - 74
Fluke 98
Users Manual
1
)
2
)
Figure 5-46. Testing Relative Compression (Synchronized)
1):
2):
If accessible, connection to the starter motor terminal is preferred.
The RPM90 Inductive Pickup is not used for the unsynchronized (UNSYN)
Relative Compression test.
Figure 5-47. Result Display from a (Synced) Relative Compression Test
Automotive Applications
5 - 75
When using the synchronized Relative Compression test (REL. COMPRESSION
SYNC), do not interrupt the ignition system to disable engine run, as the ignition
system is needed to trigger the measurement via the RPM90 Inductive Pickup.
Instead, disable fuel supply, e.g. remove the fuel pump fuse or disconnect fuel
injector wires.
Tip:
To speed your diagnosis, start your evaluation of the engine's mechanical
condition by using the REL. COMPRESSION UNSYNC mode. This will
quickly identify any low compression cylinders causing problems. To identify
which cylinder is at fault, use the REL. COMPRESSION SYNC mode.
Remember that the REL. COMPRESSION SYNC mode needs an electrical
signal from cylinder number one's spark plug firing, so disable fuel not spark.
5 - 76
19
Fluke 98
Users Manual
Timing Advance
Two channels of the ScopeMeter test tool are utilized to determine actual timing
advance of the ignition system. INPUT A is connected to cylinder number one or
the primary side of the ignition coil (module), and INPUT B is connected to the
TDC signal.
Using the cursors, the calculated timing advance is shown in degrees of
advance.
This test can also be used to test a knock sensor. See application #14.
Measurement Conditions
Connect the test tool to cylinder number one and to the Top Dead Center
signal (TDC). Do not connect ground to the test lead on INPUT B (see
Figure 5-48).
Start the engine and allow the engine to idle. Slowly accelerate the engine
while watching the display.
As electronic and mechanical timing (where applicable) take over, an
increase in ignition timing will be noted.
•
•
•
Test Tool Key Sequence
1
SELECT
2
SELECT
3
4
Connect the test leads as displayed by the test tool's Connection Help
and shown in Figure 5-48. The Inductive Pickup must be clamped on the
spark plug wire close to the spark plug.
OK
5
6
Starts the timing advance test.
Move cursor 2 to the positions shown in Figure 5-49.
Automotive Applications
5 - 77
Figure 5-48. Testing Advance
Figure 5-49. Result Display from an Advance Test
5 - 78
Fluke 98
Users Manual
Timing Advance
Fixed signal typically from the
crankshaft position sensor
Coil ON
Coil OFF
DWELL
Timing advance calculated from
fixed pulse width signal (top trace)
to variable calculated signal
(bottom trace)
Calculated variable
signal from ignition
or timing module
Specifications may vary. Consult manufacturer’s specifications.
Automotive Applications
5 - 79
ELECTRICAL SYSTEM
20
Battery Test
Charging system problems often come to you as a "no-start" complaint. The
battery will have discharged and the starter will not crank the engine. The first
step is to test the battery and charge it if necessary.
Measuring System Voltage
Bleed the surface charge from the battery by turning on the headlights for a
minute. Now turn the lights off and measure the voltage across the battery
terminals. When possible, individual cell specific gravity should be checked with
a hydrometer. A load test should be done to indicate battery performance under
load. Voltage tests only tell the state of charge, not the battery condition.
Measurement Conditions
Connect the test tool to the vehicle's battery as described on the test tool's
help screen.
Crank the engine while watching the instrument's display.
•
•
Test Tool Key Sequence
1
SELECT
2
SELECT
3
4
Read the display for connection information and instructions to perform
the test. See the test setup in Figure 5-50.
OK
5
The battery test will now start.
5 - 80
Fluke 98
Users Manual
Figure 5-50. Testing Battery Condition
Figure 5-51. Result Display from a Battery Condition Test
Automotive Applications
21
5 - 81
Charging
Ripple Voltage, Output Voltage, Diode Test and Field Control
CHARGING OUTPUT TEST
Late model electronic voltage regulators maintain a charging voltage of about 13
to 15 volts. Sufficient output from the charging system is required to maintain
battery charge and meet vehicle demands.
RIPPLE VOLTAGE MEASUREMENT
An alternator generates current and voltage by the principles of electromagnetic
induction. Accessories connected to the vehicle's charging system require a
steady supply of direct current at a relatively steady voltage level. You can't
charge a battery with alternating current, so it must be rectified to direct current.
A set of diodes, part of the alternator's rectifier bridge, modifies the ac voltage,
produced in the alternator, to the dc voltage used by the car's systems. When
analyzing a charging system, look for both ac and dc levels. The ac level is
called ripple voltage and is a clear indication of diode condition. Too high a level
of ac voltage can indicate a defective diode and discharge the battery.
RECTIFIER DIODE TEST
Three-phase alternators use three pairs of diodes to rectify output current. These
diodes are typically found in an insulated heat sink or rectifier bridge. A diode
must pass current in one direction and block it in the other. If a diode is shorted,
it will pass current in both directions. If it is open, it will block current in both
directions.
To test a diode for an open or a short circuit, touch one test lead of the
instrument to the diode lead and the other lead to the heat sink or alternator
frame. Then reverse the test leads. The instrument should show continuity in one
direction but not in the other.
If continuity is indicated in both directions, the diode is shorted. If continuity is not
indicated in either direction, the diode is open.
CHARGING FIELD CONTROL TEST
A voltage regulator controls alternator output by adjusting the amount of current
flowing through the rotor field windings. To increase alternator output, the
electronic voltage regulator allows more current to flow through the rotor
windings.
If the battery is discharged, the regulator may cycle the field current on 90% of
the time. This will increase output. If the electrical load is low, the regulator may
cycle the field current off 90% of the time to decrease output.
Depending on the vehicle type, the signal may be a pulsewidth modulated
square wave or a fixed voltage level.
5 - 82
Fluke 98
Users Manual
Measurement Conditions
CHARGING OUTPUT TEST
Connect the test tool to the vehicle's alternator.
Engine RUNNING. Test the alternator at idle and under load. Slowly increase
engine speed.
Load the charging system by turning on vehicle accessories, such as the
headlights, heater blower motor fan, and windshield wipers.
•
•
•
RIPPLE VOLTAGE MEASUREMENT
NOTE:
This measurement is made at the rear case half of the alternator and not the
battery. The battery can act as a capacitor and absorb the ac voltage.
•
•
•
•
Connect the test tool to the vehicle's alternator BAT terminal.
Engine RUNNING. Test the alternator at idle and under load. Slowly increase
engine speed.
Load the charging system by turning on vehicle accessories, such as the
headlights, heater blower motor fan, and windshield wipers.
AC ripple voltage should not exceed 500 mV ac.
CHARGING FIELD CONTROL TEST
Connect the test tool to the alternator's field connection.
Engine RUNNING. Test the field control with the engine idling and under
load.
•
•
RECTIFIER DIODE TEST
Test the alternator's rectifier bridge diode set and trio with the alternator
disassembled.
Follow the vehicle manufacturers recommendations for diagnosing a
defective alternator.
•
•
Automotive Applications
5 - 83
Test Tool Key Sequence
1
SELECT
2
SELECT
3
4
Connect the test leads as displayed by the test tool's Connection Help
and shown in Figure 5-52.
OK
5
Starts the charging (dc) voltage test.
Use the F2 key to measure the charging ripple voltage.
Use the F3 key to measure the charging current with a Current Clamp.
Use the F4 key to measure the charging ripple current with a Current Clamp.
When using a Current Clamp, you must set it to zero before using it for
measurements.
5 - 84
Fluke 98
Users Manual
Figure 5-52. Testing Charging System Output Voltage
Figure 5-53. Result Display from Charging System Voltage Test
Automotive Applications
22
5 - 85
Solenoid and Clamping Diode Test
When an electromagnetically controlled device is de-energized, a voltage spike
can be induced by the collapse of the magnetic field. Clamping (or suppression)
diodes are used to filter out these inductive spikes. Horn circuits, relays, blower
motors, air conditioning clutches, and some injectors are examples of devices
that use diodes for this purpose.
A faulty diode can cause induced noise, often detectable over a car's audio
system. These noise spikes are seen as large overshoots when the waveform
transitions from one level to another. They can also cause interference in other
more sensitive areas of the car's sensor and control system.
Measurement Conditions
Activate the item under test and watch the test tool's display .
•
Test Tool Key Sequence
1
SELECT
2
SELECT
3
4
Connect the test leads as displayed by the test tool's Connection Help
and shown in Figure 5-54.
OK
5
Starts the Solenoid and Clamping Diode test.
5 - 86
Fluke 98
Users Manual
Figure 5-54. Testing a Solenoid and Clamping Diode
Figure 5-55. Result Display from a Solenoid and Clamping Diode Test
Automotive Applications
5 - 87
Clamping Diodes
Voltage increases
due to the collapse
of coil voltage
Peak is clamped
against the diode
threshold voltage
Battery voltage
Ground
Specifications may vary. Consult manufacturer’s specifications.
5 - 88
23
Fluke 98
Users Manual
Voltage Drop
In automotive circuits even the smallest loss of voltage will cause poor
performance. Connect the instruments + lead to the side of the device nearer the
battery positive terminal and the - lead to the side nearer the battery negative
terminal or ground. Current must be flowing for the instrument to register the
voltage drop found. The Voltage Drop test is helpful on components and
connections (both on the + feed side and - ground side) except solenoids, which
read battery voltage if you measure across them when the engine is being
cranked.
Voltage drops should not exceed the following:
200 mV
Wire or cable
300 mV
Switch
100 mV
Ground
0 mV to <50 mV
Sensor Connections
0.0V
Connections
Measurement Conditions
Current must be flowing for the instrument to register the voltage drop found.
The positive lead should be connected to the side of the device nearer the
positive terminal of battery.
•
•
Test Tool Key Sequence
1
SELECT
2
SELECT
3
4
Connect the test leads as displayed by the test tool's Connection Help
and shown in Figure 5-56.
OK
5
Starts the Voltage Drop test.
Automotive Applications
Figure 5-56. Testing Voltage Drop
Figure 5-57. Result Display from a Voltage Drop Test
5 - 89
5 - 90
24
Fluke 98
Users Manual
Voltage Tests
Voltage Reference and Ground
High resistance among grounds can be among the most frustrating of electrical
problems. They can produce bizarre symptoms that don't seem to have anything
to do with the cause, once you finally find it. The symptoms include lights that
glow dimly, lights that come on when others should, gauges that change when
the headlights are turned on, or lights that don't come on at all.
Voltage sources below the specified amounts can cause similar symptoms.
Measurement Conditions
Refer to the vehicle manufacturer's wiring diagram for additional information
on pin location and circuit descriptions.
•
Test Tool Key Sequence
1
SELECT
2
SELECT
3
4
Connect the test leads as displayed by the test tool's Connection Help
and shown in Figure 5-58.
OK
5
Starts the Voltage test.
Automotive Applications
5 - 91
Figure 5-58. Testing Voltage
Figure 5-59. Result Display from a Voltage Test
5 - 92
Fluke 98
Users Manual
DIESEL
Introduction
During the compression stroke of a diesel engine, the intake air is compressed to
about 50 Bar (735 psi). The Temperature hereby increases to 700 to 900GC. This
temperature is sufficient to cause automatic ignition of the Diesel fuel which is
injected into the cylinder, shortly before the end of the compression stroke and
very near to the TDC.
Fuel is delivered to the individual cylinders at a pressure of between 350 and
1200 Bar (5145 psi and 17,640 psi). The start of the injection cycle must be
timed within 1G Crankshaft to achieve the optimum compromise between engine
fuel consumption and combustion noise. A timing device controls the start of the
injection and will also compensate for the propagation times in the fuel delivery
lines.
Diesel rpm measurements are necessary for idle speed adjustments, maximum
RPM checks and for smoke tests at fixed rpm values.
Measurement Conditions:
Cleaning
The fuel lines to measure on, should be cleaned in order to assure a good
(metal) contact of the fuel line itself to the piezo pickup and ground clip. Use
sandpaper and preferably a de-greaser to clean the lines.
Positioning and Probe connection
The Piezo adapter should be placed as close as possible to the Diesel injector
on a straight part of the fuel line. Use the piezo-to-probe tip adapter and slide the
faston to the pickup. clamp the ground clip close to the piezo pickup. Make sure
that the groundclip does not make contact to the piezo itself or to adjacent fuel
lines. Slide the probe tip onto the probe tip adapter and connect the Probe to
your ScopeMeter. Notice that the groundwire is shorter than the signal wire, in
order to have the weight of probe and cable on the groundwire and not on the
signal wire.
The piezo element may not bounce or rattle on the line or make contact to other
fuel lines or any other material close by.
Caution: The piezo adapter is made of a ceramic material and may be
damaged if it falls on a concrete floor. Be careful.
Automotive Applications
5 - 93
Some general suggestions to keep in mind:
Always position the piezo pickup on the fuel line at about the same distance
frome the Injector.
Place the pickup on a straight part of the fuel line. Do not place it on a bent
part of the line.
Always compare results with signals performed on a good engine to get
acquainted with the signal shape.
Always compare signals at the same engine speed.
Pump timing is critical and should occur within 1degree of crankshaft
rotation. The test tool is not a pump timing device. The test tool can be used
to reveal ECU problems concerning timing and delivery start.
•
•
•
•
•
5 - 94
25
Fluke 98
Users Manual
Diesel RPM Measurements and Diesel Injection Pattern Display
Test Tool Key Sequence
Set DIESEL in the VEHICLE DATA MENU as follows:
Displays the main MENU.
1
SELECT
2
SELECT
3
SELECT
4
OK
Return to the main MENU.
5
Proceed as follows to select the Diesel Injector test:
SELECT
6
SELECT
7
8
Connect the test leads as displayed by the test tool’s Connection Help
and shown in Figure 5-60.
OK
9
Starts the Diesel Injector test.
Automotive Applications
5 - 95
Figure 5-60. Testing Diesel Injection.
Analysis of Injection Pattern at Idle Speed
The delivery valve
opens and a pressure
wave proceeds toward
the injector
The injection pumps
plunger moves in
the supply direction
and thus generating
a high pressure in
the pressure gallery
When the injector
opening pressure is
reached (>100Bar or
1,470 psi), the needle
valve overcomes its
needle spring force and lifts.
The injection process ends,
the delivery valve closes and
the pressure in the line drops.
This quick drop causes the
nozzle to close instantly,
preventing the nozzle from
opening again, and preventing
backflow of combustion
gases.
Figure 5-61. Injection Pattern Analysis.
5 - 96
26
Fluke 98
Users Manual
Diesel Advance Measurement
Diesel pump testers are used to calibrate pumps exactly to the engine’s
requirements. They monitor pulses from the reference on the engine’s flywheel.
The start of the delivery is monitored and timing adjustments can be made at
different speeds.
The advance measurement with the test tool is intended to reveal problems in
the timing of the start of fuel delivery compared to the TDC signal of the flywheel
sensor. This measurement is not meant to be an absolute and accurate diesel
pump adjustment test.
The piezo pickup is clamped on the fuel line of the first cylinder, close to the
injector and connected via the blue filter probe to INPUT A. (See Figure 5-62).
The TDC sensor signal is connected to INPUT B
Do not use the ground lead of Channel B, since the instrument is already
grounded through the pickup adapter to the fuel line.
Test Tool Key Sequence
1
SELECT
2
SELECT
3
4
Connect the test leads as displayed by the test tool’s Connection Help
and shown in Figure 5-62.
OK
5
Starts the Diesel Advance test.
6
Position the cursors as shown in Figure 5-63.
Automotive Applications
5 - 97
Figure 5-62. Testing Diesel Advance.
The following Figures show the results on the instrument screen.
Figure 5-63. Advance at Idle.
Figure 5-64. Advance at 1700
RPM.
Chapter2 -61
User Maintenance
Introducing your Automotive ScopeMeter Test Tool
CLEANING . . . . . . . . . . . . . . . . . . . . . . . . . . . . . . . . . . . . . . . . . . . . . . . . . 6-2
KEEPING BATTERIES IN OPTIMAL CONDITION . . . . . . . . . . . . . . . 6-2
REPLACING AND DISPOSING OF BATTERIES . . . . . . . . . . . . . . . . 6-4
FUSES NOT REQUIRED . . . . . . . . . . . . . . . . . . . . . . . . . . . . . . . . . . . . . 6-5
CALIBRATING 10:1 TEST LEADS . . . . . . . . . . . . . . . . . . . . . . . . . . . . 6-6
6-2
Fluke 98
Users Manual
WARNING
RISK OF ELECTRIC SHOCK OR FIRE:
USE ONLY INSULATED PROBES, TEST LEADS, AND CONNECTORS
SPECIFIED IN THIS MANUAL WHEN MAKING MEASUREMENTS >42V PEAK
(30V RMS) ABOVE EARTH GROUND OR ON CIRCUITS >4800 VA.
USE PROBES AND TEST LEADS WITHIN RATINGS AND INSPECT BEFORE USE.
REMOVE UNUSED PROBES AND TEST LEADS.
REMOVE PROBES AND TEST LEADS BEFORE OPENING CASE OR BATTERY
COVER.
WHEN THE TEST TOOL IS CONNECTED TO ITS POWER ADAPTER/BATTERY
CHARGER, TERMINALS MAY BE LIVE, AND THE OPENING OF COVERS OR
REMOVAL OF PARTS (EXCEPT THOSE THAT CAN BE ACCESSED BY HAND) IS
LIKELY TO EXPOSE LIVE PARTS.
THE TEST TOOL MUST BE DISCONNECTED FROM ALL VOLTAGE SOURCES
BEFORE IT IS OPENED FOR ANY ADJUSTMENT, REPLACEMENT,
MAINTENANCE, OR REPAIR.
CAPACITORS INSIDE MAY STILL BE CHARGED EVEN IF THE TEST TOOL HAS
BEEN DISCONNECTED FROM ALL VOLTAGE SOURCES.
CLEANING
Clean the test tool with a damp cloth and a mild detergent. Do not use abrasives,
solvents, or alcohol.
Do not use any type of paper to clean the display screen. This will cause
scratches and diminish the transparency of the plastic screen. Use only a soft
cloth with a mild detergent.
KEEPING BATTERIES IN OPTIMAL CONDITION
When new, the batteries typically provide 4 hours of use. To keep batteries in
optimal condition, do the following:
Always operate the test tool on batteries until a blinking
appears in the top
right of the display. This indicates that the battery level is too low and the
batteries need to be recharged.
CAUTION
Frequent charging of the batteries when they are not completely empty can
cause a "memory effect". This means that the capacity of the NiCad batteries
decrease, causing a decrease in the operating time of the test tool.
User Maintenance
6-3
You can revitalize a NiCad battery pack with too low capacity as follows:
1
Ensure that the test tool is battery operated (Power Adapter disconnected).
Press the power-on key to turn the test tool on.
2
OK
4
5
SELECT
Press to select SENSORS.
SELECT
Press to select GENERAL SENSORS.
If Connection Help information is displayed, press F1.
Press to display the RECORD menu.
6
7
OK
Press this key twice to enter the main MENU.
3
SELECT
Press to select PLOT READINGS.
If a message is displayed telling that memory data will be
lost, press F1 (YES) to start recording.
The recording function disables the battery save feature when no key entry is
made for 5 minutes. Wait until the test tool is automatically turned off. Then the
NiCad batteries are completely discharged. Depending on the condition of the
NiCad batteries, the discharging can last up to 8 hours.
8
When the test tool is turned off, connect the Power Adapter/Battery
Charger PM8907 to the test tool and the local line power.
9
Charge for more than 21 hours.
10
Repeat steps 1 through 9 once more.
6-4
Fluke 98
Users Manual
REPLACING AND DISPOSING OF BATTERIES
WARNING
TO AVOID ELECTRICAL SHOCK, REMOVE THE TEST LEADS, PROBES, AND
BATTERY CHARGER BEFORE REPLACING THE BATTERIES.
1
Disconnect the test leads, probes, and battery charger both at the source
and at the test tool.
2
Separate the test tool from its holster.
3
Locate the battery cover on the bottom rear. Loosen the two screws with a
flat-blade screwdriver.
4
Lift the battery cover away from the test tool.
5
Remove the NiCad battery pack (or alkaline batteries, type KR27/50 or
R14) from the battery compartment.
NOTE
Ni-Cd
This instrument contains a Nickel-Cadmium battery. Do not dispose of this
battery with other solid waste. Used batteries should be disposed of by a
qualified recycler or hazardous materials handler. Contact your authorized Fluke
Service Center for recycling information.
6
Install a new NiCad battery pack (PM9086) or new alkaline (C Cell)
batteries (type KR27/50 or R14) as shown in Figure 6.1.
NOTE
Ensure that the NiCad battery pack charging contact is aligned in the battery
compartment as shown in Figure 6.1. Use only the PM9086 NiCad battery pack.
7
Reinstall the battery cover and secure the two screws.
User Maintenance
6-5
Charging
contact
Figure 6-1. Battery Replacement
FUSES NOT REQUIRED
Since the test tool uses electronically protected inputs, no fuses are required.
6-6
Fluke 98
Users Manual
CALIBRATING 10:1 TEST LEADS
The following procedure describes dc calibration for 10:1 test leads. Other test
leads need no calibration.
NOTE:
To meet full user specifications, use a 10:1 test lead only with the input on which
it has been calibrated.
10:1 Test Lead Calibration Procedure
1
Make sure that the test lead to be calibrated is a 10:1 test lead.
Select 10: 1 TEST LEAD setting in the INSTRUMENT SETUP MENU for
INPUT A and/or INPUT B, depending on which input the test lead is to be
calibrated. Refer to ‘Changing Test Lead Setup’ in Chapter 3.
Set the test tool in SCOPE Î DUAL INPUT SCOPE. This enables
calibration on both inputs. Perform the following procedure with the DUAL
INPUT SCOPE function active.
2
Press to display the menu.
3
Use the arrow keys to highlight INSTRUMENT SETUP
4
OK
Use the arrow keys to highlight TEST LEAD INPUT A or
TEST LEAD INPUT B.
5
6
SELECT
Press this key to select TEST LEAD SETUP for INPUT A
or INPUT B. Check that TEST LEAD (displayed in the
present menu) is set to 10:1. Otherwise set it to 10:1.
Use the arrow keys to highlight CALIBRATE TEST LEAD
7
8
Press to select the INSTRUMENT SETUP MENU
OK
Press to select the CALIBRATE TEST LEAD procedure.
User Maintenance
6-7
9
Make the connections as displayed by the test tool.
(See Figure 6-2.)
10
Read the instructions displayed, to complete the calibration procedure.
INPUT A
Test Lead Calibration Setup
INPUT B
Test Lead Calibration Setup
Figure 6-2. Test Lead Calibration Setup
Introducing your Automotive ScopeMeter Test Tool
Chapter2 -71
Appendixes
APPENDIX 7A
Specifications . . . . . . . . . . . . . . . . . . . . . . . . . . . . . 7-1
APPENDIX 7B
Parts and Accessories . . . . . . . . . . . . . . . . . . . . 7-14
APPENDIX 7C
PM8907 Information . . . . . . . . . . . . . . . . . . . . . . 7-17
APPENDIX 7D
Warranty and Service Centers . . . . . . . . . . . . . 7-19
APPENDIX 7E
Terminology . . . . . . . . . . . . . . . . . . . . . . . . . . . . . 7-25
Appendixes
7-1
APPENDIX 7A Specifications
INTRODUCTION
Performance Characteristics
FLUKE guarantees the properties expressed in numerical values with the stated
tolerance. Specified non-tolerance numerical values indicate those that could be
nominally expected from the mean of a range of identical ScopeMeter test tools.
Automated tests including Engine, Diesel, Sensor, Electrical System, and Meter
tests are specified for input A. Scope specifications apply to both inputs A and B.
Banana jacks are used for external trigger input only.
For definitions of terms, refer to IEC Publication 351-1.
Safety Characteristics
The ScopeMeter test tool has been designed and tested in accordance with IEC
Publication 1010, Safety Requirements for Electronic Measuring Apparatus. This
manual contains information and warnings that must be followed by the user to
ensure safe operation and to keep the instrument in a safe condition. Use of this
equipment in a manner not specified by the manufacturer may impair protection
provided by the equipment.
Environmental Data
The environmental data mentioned in this manual are based on the results of the
manufacturer's verification procedures.
Engine Tests
RPM
600 - 15,000 RPM, 1 RPM resolution <1000 RPM,
10 RPM resolution >1000 RPM
Dwell Range
Degree: 0 to 360°, 1° resolution
Milliseconds: 0 to 1,000 ms (1 ms resolution)
Percentage: 0% - 100%, resolution 3 digits
Timing Advance (TDC) in degrees (°) crankshaft rotation
•
( indicates the test tool can measure it.)
Ignition Patterns
IGNITION
PRIMARY
SECONDARY
TYPE
SINGLE
PARADE
SINGLE
PARADE
Conventional
•
•
•
•
•
•
•
DIS
Coil on Plug
7-2
Primary Voltage
Secondary Voltage
Burn Time
Burn Voltage
Relative Compression
Alternator Ripple Voltage
Battery Condition Test
Fluke 98
Users Manual
0 to 300V
0 to 80 kV
0.6 ms to 5 ms
0 to 80 kV
0 to -100% contribution
0 to 300V
0 to 40V
Fuel Injection Pulse Width
0 to 1800 ms
Systems Automatically Tested: Saturated Driver
Conventional
Throttle Body Injection Systems
Current Controlled
Peak And Hold
Pulse Modulated
Diesel Tests (with Optional DPS90 Diesel Probe Set)
Engine Speed
400 to 10,000 RPM
Advance (Diesel Pump Timing) in ° of crankshaft rotation
Injection Pulse
10 Ps to 1200 ms
Automated Sensor Tests
The Sensors menu gives direct access to a wide variety of sensor measurements.
The best operating mode is automatically selected. A few of the sensors tested
automatically include:
Mass Air Flow Sensor (MAF)
Manifold Absolute Pressure (MAP)
Oxygen Sensor (Zirconium and Titanium)
Dual Oxygen Sensor
Temperature Sensors
Position Sensors
Camshaft Position
Exhaust Gas Recirculation (EGR)
Ride Height Sensors
Magnetic Sensors
Speed Sensors
Knock Sensors
Distributor Triggering
Appendixes
7-3
Air/fuel Systems Tested:
Mixture Control (Feedback)
Frequency Control Valve (CIS E)
Air Flow Meter
Idle Air Compensation
Exhaust Gas Recirculation (EGR)
Electrical System Tests
Battery Condition Test
Charging
Diode Test
Field Control
Ripple Voltage Measurement
Cranking
Voltage Reference And Ground
Voltage Drop
Clamping Diode
Solenoid Tests
Stepper Motor
Scope Mode
Continuous AutoRange
Hands-off signal probing. Continuously tracks input signals from 4 Hz to 5 MHz
and automatically selects the proper time base, input range, trigger level, trigger
slope, and trigger source.
40 ns Glitch detect
Sweep speeds 1 ms per division or slower.
Vertical
Frequency Response, -3 dB ..........................................................DC to > 5 MHz
with Filter Adapter DC to > 2.5 kHz
AC coupled....................................................................................... <10 Hz direct
Coupling .................................................................................................... AC, DC
Sensitivity .................................................................................. 5 mV to 100 V/div
Modes .................................................................................................A, -A, B, -B
Input Impedance..................... 1 M://55 pF direct, 10 M://4 pF with Filter Adapter
Vertical Resolution ...................................................................... 8 bit (256 levels)
Accuracy r(2% +1 pixel)
7-4
Fluke 98
Users Manual
Horizontal
Modes ....................................................................... Recurrent, Single Shot, Roll
RANGES:
Recurrent ...................................................................................... 20 Ps to 1 s/div
Dual input alternating ........................................................... 1 Ps to 20 Ps/div
Dual input chopped ................................................................ 50 Ps to 1 s/div
Single Shot............................................................................... 1 Ps to 200 ms/div
Roll ........................................................................................... 500 ms to 60 s/div
Dual input chopped .................................................................... 20 Ps to 60 s/div
Accuracy r(0.1% + 1 pixel)
Record Length............................................................. 512 samples (20 divisions)
Trigger
Sources ..................................................................... A, B or TRIGGER (external)
Sensitivity: A or B ...................................................................... <0.5 div to 1 MHz
............................................................................................... <1.5 div to 5.5 MHz
Sensitivity: TRIGGER............................... +0.2V and 2.0V (TTL level compatible)
External Input Impedance .............................................................1.5 M://40 pF direct
Delay Time ....................................................................................................-1 div
Cursor Measurements
Single input (INPUT A) cursor measurements:
Voltage at CURSOR 1.
Voltage at CURSOR 2.
Voltage difference ('V) between the CURSOR 1 and CURSOR 2 positions.
Time difference ('t) between the CURSOR 1 and CURSOR 2 positions.
Dual input cursor measurements:
Voltage at CURSOR 1 on the INPUT A signal waveform.
Voltage at CURSOR 1 on the INPUT B signal waveform.
Voltage at CURSOR 2 on the INPUT B signal waveform.
Voltage at CURSOR 2 on the INPUT A signal waveform.
Time difference ('t) between the CURSOR 1 and CURSOR 2 positions.
Meter Mode
Displays numeric reading and waveform of the signal on INPUT A.
Measurement readout: ............................... Absolute, relative (set zero function).
Appendixes
7-5
DC Voltage
Ranges
direct input with STL90 leads ..... 100 mV, 300 mV, 1V, 3V, 10V, 30V, 100V, 300V
Accuracy r(0.5% +5 counts)
Full Scale Reading ................................................................1000 or 3000 counts
Normal Mode Rejection...................................................... >50 dB at 50 or 60 Hz
Common Mode Rejection................................. >100 dB at DC, 50, 60, or 400 Hz
AC or AC+DC True RMS Voltage
Ranges
direct input................................... 100 mV, 300 mV, 1V, 3V, 10V, 30V, 100V, 250V
Accuracy (valid from 5% range) ...................... 50 Hz to 60 Hz r(1% +10 counts)
........................................................................20 Hz to 20 kHz r(2% +15 counts)
.......................................................................... 5 Hz to 1 MHz r(3% +20 counts)
Full Scale Reading ................................................................1000 or 3000 counts
Crest Factor ....................................... Automatic ranging on crest factor overload
Common Mode Rejection Ratio ........................................... >60 dB, DC to 60 Hz
Frequency ......................................................................................1 Hz to 5 MHz
Resolution .................................................................................................. 4 digits
Accuracy r(0.5% +2 counts)
RPM ............................................................................. selectable: n pulses/720°.
Range.............................................................................. 600 RPM to 5,000 RPM
Resolution .................................................................................................. 4 digits
Accuracyr(1% +5 counts)
Duty Cycle
positive or negative pulse
Range............................................................................................. 2.0% to 98.0%
Accuracy (logic or pulse waveforms) r(0.5% +2 counts)
Pulse Width
positive or negative pulse.
Range...........................................................................................250 Ps to 50 ms
Resolution .................................................................................................. 3 digits
Accuracy r(0.5% +2 counts)
°C / °F Temperature
for optional temperature probes
TR90: Range......................................................... -50 °C to +200 °C (-58 to +392 °F)
Accuracy r(1% +0.5 °C)
Other: Scaling........................................................................................... 1 mV/degree
Amperes
for optional current probes
Scaling ........................................ 1 mV/A, 10 mV/A, 100 mV/A, 1 V/A (1 mV/mA)
Coupling ....................................................................DC, AC rms, or AC+DC rms
Range..........................................................................................2000A maximum
7-6
Fluke 98
Users Manual
Resistance
Ranges........................................ 30:, 300:, 3 k:, 30 k:, 300 k:, 3 M:, 30 M:
Accuracy (300: to 30 M:) r(0.5% +5 counts)
Accuracy (30:) r(2.5% +25 counts)
Full Scale Reading ............................................................................. 3000 counts
Measurement Current ......... 500 PA, 500 PA, 70 PA, 7 PA, 700 nA, 70 nA, 70 nA
Open Circuit Voltage ....................................................................................... <4V
Full Scale Voltage ............................................. <250 mV to 3 M:, <2V to 30 M:
Diode Test
Open Circuit Voltage d4V
Full Scale voltage....................................................................................... 2.800V
Measuring Current ..................................................................................... 0.5 mA
Measurement Modifying Functions
SMOOTH ................................ Moving average of readings up to last 8 seconds.
Fast Update.......................Fast display update for IGNITION single cylinder test.
FREEZE (HOLD).................................... Holding of last stable reading on display
SET ZERO ........................................Zeros present reading as a reference value
Record Capabilities
Plot Readings
Plots up to 4 readings over time simultaneously.
Min Max Trendplot
Logs minimum, maximum, and average readings to memory at full accuracy and
displays all three as graphs. Uses automatic vertical scaling and horizontal time
compression for hands-off recording from a minimum of 60 seconds to a maximum
32 days full screen. The horizontal time compression process records data until
the screen is full. Then it selects the greater maximum and the lesser minimum
between each pair of readings. These readings are then compressed to fill half the
screen. The process then repeats itself until up to 32 days have passed.
Intermittent Record
Monitors and records signal continuously for a full 128 screens (single channel) or
64 screens (dual channel) of data. Intermittent recording is initiated on entry and
is terminated at any time by pressing any key on the instrument (except ON/OFF).
Time base ranges 20 ms per division and slower (> 20 ms/division).
Flight Record
Records up to 40 successive screen snapshots in memory. Preserves the last
40 screens in an endless loop fashion. Time base ranges 200 ms per division
and faster (< 200 ms/division).
Appendixes
7-7
Screen Memories (Save or Recall)
Memory ........................................... 15 complete display screens including setup
Test Lead Calibration ..........................DC adjustment for 10:1 test leads only
General Specifications
Functional on These Engine Types:
Number of Cylinders ................................................................... 1, 2, 3, 4, 5, 6, 8
Engine Stroke.....................................................................................2 or 4 stroke
Fuel Types................................................................................... Gasoline, Diesel
Ignition Systems..................................................Conventional, DIS, Coil-on-Plug
Electrical System Voltages.................................................................... 6, 12, 24V
(Use gasoline settings for alternative fuel tests)
The accuracy of all measurements are within +(% of reading + number of counts)
from 18 °C to 28 °C. Add 0.1 x (specific accuracy) for each °C <18 °C or >28 °C.
Display
Type ...........................................Foil Compensated Super Twisted Liquid Crystal
Size ............................................................................ 84 x 84 mm (4.7" diagonal)
Resolution ....................................................................................240 x 240 pixels
Contrast.........................................................................................User adjustable
Backlight................................................. Cold Cathode Fluorescent (CCFL) Tube
High Brightness....................................................................................... 50 cd/m2
External Power Requirements
Internal Battery Pack..............................................................NiCad 4.8V nominal
Operating Time ...........................................................................Typically 4 hours
Power Adapter/Battery Charger
Charging Time .....................................................................Typically 16 hours
Alternate battery..........................................4 Alkaline C cells (non-rechargeable)
External Supply ....................................... 8 to 20V DC, 5 W typical via 5 mm jack
WARNING
THE MINUS VOLTAGE IS CONNECTED TO COMMON. WHEN USING A POWER
SUPPLY THAT IS NOT DOUBLE INSULATED, CONNECT COMMON TO
PROTECTIVE GROUNDING.
Memory back-up battery .......................................................................... CR2032
save screens for up three years with main batteries removed
7-8
Fluke 98
Users Manual
Environmental
Temperature
Operating.................................................................................... 0 °C to 50 °C
Storage .................................................................................... -20 °C to 70 °C
Humidity
Operating..........................................20 °C to 30 °C, 90% RH noncondensing
30 °C to 50 °C, 70% RH noncondensing
Storage ....................................................................................................... 95% RH
Altitude
Operating................................................................................. 3 km (10,000ft)
Storage .................................................................................. 12 km (40,000ft)
Shock and Vibration ..................................................per MIL-T-28800 for Class 3
Electro-Magnetic Interference .......................... meets the following specifications
(see also “DECLARATION OF CONFORMITY” on page X)
The Fluke 98 series II, including standard accessories, conforms with the EEC
Directive 89/336 for EMI immunity, as defined by IEC 801-3, with the addition of
the following tables (1 to 12).
Scope Mode:
Table 1:
Susceptibility: no visible disturbance
Frequency range:
10 kHz - 25 MHz
E = < 0.1 V/m
E = 1 V/m
E = 3 V/m
Stand alone / with
STL90
5 mV/div - 100 V/div
5 mV/div - 100 V/div
5 mV/div - 100 V/div
Table 2:
Susceptibility: no visible disturbance
Frequency range:
25 MHz ... 1 GHz
E = < 0.1 V/m
E = 1 V/m
E = 3 V/m
Stand alone
5 mV/div - 100 V/div
5 mV/div - 100 V/div
5 mV/div - 100 V/div
With STL90
5 mV/div - 100 V/div 200 mV/div - 100 V/div 500 mV/div-100 V/div
Appendixes
7-9
Table 3:
Susceptibility: disturbance less than 10% of full scale
Frequency range:
25 MHz ... 1 GHz
E = < 0.1 V/m
E = 1 V/m
E = 3 V/m
Stand alone
N/A
N/A
N/A
With STL90
N/A
50 mV/div - 100mV/div 100 mV/div - 200 mV/div
For conditions not specified in tables 1,2, and 3, a susceptibility effect of more
than 10% is possible.
N/A = Not Applicable
Multimeter Mode:
Table 4:
Susceptibility: no visible disturbance
Frequency range:
10 kHz ... 25 MHz
E = < 0.1 V/m
E = 1 V/m
E = 3 V/m
Stand alone / with
STL90
100 mV - 300V
100 mV - 300V
300 mV - 300V
Table 5:
Susceptibility: no visible disturbance
Frequency range:
25 MHz ... 1 GHz
E = < 0.1 V/m
E = 1 V/m
E = 3 V/m
Stand alone
100 mV - 300V
100 mV - 300V
100 mV - 300V
With STL90
100 mV - 300V
100 mV - 300V
300 mV - 300V
Table 6:
Susceptibility: disturbance less than 10% of full scale
Frequency range:
25 MHz ... 1 GHz
E = < 0.1 V/m
E = 1 V/m
E = 3 V/m
Stand alone
N/A
N/A
N/A
With STL90
N/A
N/A
100 mV
N/A = Not Applicable
7 - 10
Fluke 98
Users Manual
Automated Oxygen Sensor Test:
Table 7:
Susceptibility: no visible disturbance
Frequency range:
10 kHz ... 25 MHz
E = < 0.1 V/m
E = 1 V/m
E = 3 V/m
Stand alone / with
STL90 + filter
adapter
50 mV/div - 10 V/div
50 mV/div - 10 V/div
50 mV/div - 10 V/div
Table 8:
Susceptibility: no visible disturbance
Frequency range:
25 MHz ... 1 GHz
E = < 0.1 V/m
E = 1 V/m
E = 3 V/m
50 mV/div - 10 V/div
Stand alone
50 mV/div - 10 V/div
50 mV/div - 10 V/div
With STL90 + filter
adapter
50 mV/div - 10 V/div
100 mV/div - 10 V/div 200 mV/div - 10 V/div
Table 9:
Susceptibility: disturbance less than 10% of full scale
Frequency range:
25 MHz ... 1 GHz
E = < 0.1 V/m
E = 1 V/m
E = 3 V/m
Stand alone
N/A
N/A
N/A
With STL90
N/A
50 mV/div
100 mV/div
For conditions not specified in tables 7,8 , and 9, a susceptibility effect of more
than 10% is possible.
N/A = Not Applicable
Engine Test, ignition pattern: Secondary DIS:
Table 10:
Susceptibility: no visible disturbance
Frequency range:
10 kHz ... 25 MHz
E = < 0.1 V/m
E = 1 V/m
E = 3 V/m
Stand alone / with
PM9096/101
500 V/div - 20 kV/div
500 V/div - 20 kV/div
500 V/div - 20 kV/div
Appendixes
7 - 11
Table 11:
Susceptibility: no visible disturbance
Frequency range:
25 MHz ... 1 GHz
E = < 0.1 V/m
E = 1 V/m
E = 3 V/m
Stand alone
500 V/div - 20 kV/div
500 V/div - 20 kV/div
500 V/div - 20 kV/div
With PM9096/101
500 V/div - 20 kV/div
500 V/div - 20 kV/div
1 kV/div - 20 kV/div
Table 12:
Susceptibility: disturbance less than 10% of full scale
Frequency range:
25 MHz ... 1 GHz
E = < 0.1 V/m
E = 1 V/m
E = 3 V/m
Stand alone
N/A
N/A
N/A
With STL90
N/A
N/A
500 V/div
N/A = Not Applicable
Mechanical
Size exclusive holster....................60 x 130m x 260 mm (2.4 x 5.1 x 10.2 inches)
Size inclusive holster........................65 x 140 x 275 mm (2.5 x 5.5 x 10.8 inches)
Weight exclusive holster ................................................................1.5 kg (3.3 lbs)
Weight inclusive holster .................................................................1.8 kg (4.0 lbs)
Safety
Designed to Category III per IEC 1010 approved for 600V measurements
on industrial power distribution systems.
Overload protection on INPUT A or INPUT B ........................................ 300 Vrms
Overload protection on EXTernal input .................................................. 300 Vrms
Surge Protection ............................................................................................ 4 kV
per IEC 664 and ANSI/IEEE C62.41 test method
Maximum Isolation to Earth....................................... 600 Vrms from any terminal
Optical Interface ..................................................... Optically Isolated to 600 Vrms
NOTE
The input impedance of INPUT A or INPUT B drops significantly when the
voltage on the input exceeds 400 Vrms.
7 - 12
Fluke 98
Users Manual
Accessory Information
Standard Accessories (included with your Automotive ScopeMeter Test Tool)
Shielded Test Leads (STL90)
Bandwidth .........................................................................................0 to 200 Mhz
Test lead capacitance ................................................................................ 240 pF
Voltage to ground .......................................................................................... 600V
Maximum input voltage ................................................................................. 300V
Maximum current .............................................................................................. 3A
Maximum cable resistance........................................................................100 m:
Temperature .......................................................................... 0 - 50 °C (operating)
-40 - 70 °C (non-operating)
Inductive Trigger Pickup (RPM90)
Maximum RPM..............................................16,000 RPM @ 4 stroke / 4 cylinder
8,000 RPM @ 2 stroke / 1 cylinder
Accuracy ......................................................................................... 5% of reading
Current range (of measured conductor)...................................... 0 to 10 amperes
Cable length .............................................................................. 3 meters (10 feet)
Suitable spark plug lead diameter............................................. 10 mm. maximum
Capacitive Secondary Pickup (PM9096/101, Europe only)
Attenuation ............................................................................................... 10000:1
Cable length .............................................................................. 3 meters (10 feet)
Suitable spark plug lead diameter......................................................... 6 to 8 mm
Capacitive Secondary Pickup (CAP90-2)
Attenuation ............................................................................................... 10000:1
Cable length ............................................................................... 1.5 meter (5 feet)
Suitable spark plug lead diameter............................................................. > 6 mm
Clamp width ............................................................................... 25.4 mm (1 inch)
Clamp heat-resistance .................................................................> 110°C (230°F)
HEI adapters for ..................................................................... GM, Toyota, Honda
10:1 Filter Adapter
(This adapter raises the input impedance of your Automotive ScopeMeter to
10 M:. It also eliminates noise over 4 kHz. It is useful for high impedance, low
voltage measurements.)
Attenuation ..................................................................................................... 10:1
Bandwidth .................................................................................................... 4 kHz
Input impedance.......................................................10 M: in parallel with 3.5 pF
Load impedance..........................................................1 M: in parallel with 30 pF
Maximum input voltage ................................................................................. 300V
Appendixes
7 - 13
Optional Accessories (abbreviated specifications)
Current Probe (90i-610s)
Current ranges .............................................................0.5 to 100 A dc or ac peak
0.5 to 600 A dc or ac peak
Working Voltages (clamps jaws to ground).......600V ac rms (Installation Category II)
Accuracy ...............................................................2% to 3.5% (range dependent)
Temperature Probe (TR90)
Temperature Range ................................................. -40 to 200 °C (-40 to 392 °F)
Accuracy ............................................................................................ 1% ± 0.5 °C
Response Time .............................................30 seconds in static oil environment
Diesel Probe Set (DPS90)
Piezo Pickup Diameter.............................................................................6.00 mm
Useful Bandwidth ............................................................................... DC to 4 kHz
Input Impedance at DC .............................................10 M: in parallel with 12 pF
Cable Length.................................................................................... 2.5 m (8 feet)
Optically isolated RS-232 Adapter/Cable (PM9080/001)
Serial Printer Interface ......................... EPSON FX/LQ, HP Thinkjet, HP Laserjet
Print screens
Full PC Interface .......................... Transfer setups, screens, measurements, etc.
7 - 14
Fluke 98
Users Manual
APPENDIX 7B Parts and Accessories
Service Manual
Part Number: 4822 872 05371
Replacement Parts for the Standard Kit Contents
PART
ORDERING NUMBER
Yellow Holster
PM9083/001
NiCad Battery Pack
PM9086/001
Power Adapter/Battery Charger
PM8907/80*
(See Appendix 7C.)
* = 1 for Universal Europe,
230V, 50 Hz
* = 3 for North America,
120V, 60 Hz
* = 4 for United Kingdom,
240V, 50 Hz
* = 6 for Japan,
100V, 60 Hz
* = 7 for Australia
240V, 50 Hz
* = 8 Universal 115V/230V
(US Plug)
Automotive Hard Carrying Case
C98
Shielded Test Lead STL90 (Red)
5322 321 63017
Shielded Test Lead STL90 (Grey)
5322 321 63018
Ground Leads for STL90 Shielded Test Leads
(25 cm, 10 inch), Black
5322 321 63019
Ground Lead (unshielded) with banana plugs,
1.5 m, 60 inch (Black)
5322 397 60156
Ground Extension Lead (unshielded), 1.5 m,
60 inch (Black)
5322 321 61945
BNC Extension Lead for STL90
5322 321 63021
Secondary Pickup with Ground Lead, or
Secondary Pickup with three HEI plates
PM9096/101 (Europe only)
CAP 90-2
Inductive Pickup
RPM90
Filter Adapter (Blue)
5322 263 50246
Alligator Clips (Red and Black)
AC85A
Alligator Clip (Grey)
5322 290 40472
Appendixes
7 - 15
PART
ORDERING NUMBER
4 mm Banana Adapter (Red)
5322 263 50242
4 mm Banana Adapter (Grey)
5322 263 50239
4 mm Banana Adapter (Black)
5322 263 50241
2 mm Adapter (Red)
5322 263 50238
2 mm Adapter (Grey)
5322 263 50236
2 mm Adapter (Black)
5322 263 50237
Back Probe Pin (Red)
5322 264 20104
Back Probe Pin, (Grey)
5322 264 20105
Back Probe Pin, (Black)
5322 264 20103
Users Manual English
4822 872 00786
Users Manual French
4822 872 00787
Users Manual Spanish
4822 872 00788
Shielded Test Lead Set
STL90
Consists of the following:
•
•
•
•
•
•
Two Shielded Test Leads 1.5 m, 60 inch
(Red and Grey)
Two 2 mm Adapters (Red and Grey)
Two 4 mm Banana Adapters
(Red and Grey)
Three Backprobe Pins (Red, Grey, and
Black)
Two Ground Leads for the Shielded Test
Leads (25 cm, 10 inch)
Two AC85A Alligator Clips (Black)
All parts for the STL90
Shielded Test Lead Set are
included in the Standard Kit
Contents and are listed
above with ordering
numbers.
7 - 16
Fluke 98
Users Manual
Optional Accessories
PART
ORDERING NUMBER
AC/DC Current Probe
90i-610s
Temperature Probe
TR90
Diesel Probe Set
DPS90
Diesel Extension Set
Consists of the following:
Piezo Pickup, 4.55 mm
Probe-to-Piezo Pickup Adapter
•
•
No replacement part
5322 264 20087
5322 264 20096
AC85
5322 210 70136
5322 263 50244
5322 263 50245
DPE90
No replacement part
5322 263 50245
Optically isolated RS-232 Adapter/Cable
(for connection to a printer or a computer)
PM9080/001
FlukeView 98 Software
(Optically isolated RS-232 Adapter/Cable
for connection to the computer is included)
SW98W/011
Isolated 12V Charging Adapter
(fits automotive cigarette lighter socket)
PM9087/002
Isolated 24V Charging Adapter
(fits automotive cigarette lighter socket)
PM9087/021
PM8918/301
Consists of the following:
10:1 Low Pass Filter Probe
Probe Tip Adapter, with 2 mm tip
Probe Tip Adapter, with 4 mm banana
plug
Two Alligator Clips (Red and Black)
Retractable Hook Tip with Ground
Lead (Red)
Piezo Pickup, 6 mm
Probe-to-Piezo Pickup Adapter
•
•
•
•
•
•
•
Appendixes
7 - 17
APPENDIX 7C PM8907 Information
Your ScopeMeter test tool is powered by a PM8907 Power Adapter /Battery
Charger. The version you use depends on the configuration ordered.
WARNING
TO AVOID ELECTRICAL SHOCK, CONNECT THE PM8907 POWER ADAPTER
TO THE AC OUTLET BEFORE CONNECTION TO THE TEST TOOL.
The following versions are used with the test tool:
•
•
•
•
•
•
PM8907/801
PM8907/803
PM8907/804
PM8907/806
PM8907/807
PM8907/808
Universal European line plug 230V r10%
North American line plug 120V r10%
United Kingdom line plug 240V r10%
Japanese line plug 100V r 10%
Australian line plug 240V r 10%
North American line plug and switchable line voltage 115V
r10% or 230V r15%.
The line frequencies for all units are 50, 60, and 400 Hz r10%.
7 - 18
Fluke 98
Users Manual
PM8907/801
PM8907/804
PM8907/808
PM8907/803
PM8907/806
PM8907/807
Figure 7C-1 PM8907 Versions
CAUTION
At delivery, the PM8907/808 is set to 230V and is provided with a Power Supply
Cord and Attachment Plug that is for use at the 115V setting only. When operating
the unit at the 230V setting, you need a North American-to-European line plug
adapter.
Before you connect the PM8907/808 to the local line, first check the preselected
voltage setting on this unit. You can find the voltage selector switch on the bottom
of the PM8907/808. If necessary, select the corresponding line voltage with the
slide switch and ensure that the proper voltage is visible in the window of the slide
selector (see Figure 7C-1).
Appendixes
7 - 19
APPENDIX 7D Warranty and Service Centers
LIMITED WARRANTY & LIMITATION OF LIABILITY
Each Fluke product is warranted to be free from defects in material and
workmanship under normal use and service. The warranty period is three years
and begins on the date of shipment. Parts, product repairs and services are
warranted for 90 days. This warranty extends only to the original buyer or enduser customer of a Fluke authorized reseller, and does not apply to fuses,
disposable batteries or to any product which, in Fluke's opinion, has been
misused, altered, neglected or damaged by accident or abnormal conditions of
operation or handling. Fluke warrants that software will operate substantially in
accordance with its functional specifications for 90 days and that it has been
properly recorded on non-defective media. Fluke does not warrant that software
will be error free or operate without interruption.
Fluke authorized resellers shall extend this warranty on new and unused
products to end-user customers only but have no authority to extend a greater or
different warranty on behalf of Fluke. Warranty support is available if product is
purchased through a Fluke authorized sales outlet or Buyer has paid the
applicable international price. Fluke reserves the right to invoice Buyer for
importation costs of repair/replacement parts when product purchased in one
country is submitted for repair in another country.
Fluke's warranty obligation is limited, at Fluke's option, to refund of the purchase
price, free of charge repair, or replacement of a defective product which is
returned to a Fluke authorized service center within the warranty period.
To obtain warranty service, contact your nearest Fluke authorized service center
or send the product, with a description of the difficulty, postage and insurance
prepaid (FOB Destination), to the nearest Fluke authorized service center. Fluke
assumes no risk for damage in transit. Following warranty repair, the product will
be returned to Buyer, transportation prepaid (FOB Destination). If Fluke
determines that the failure was caused by misuse, alteration, accident or abnormal
condition of operation or handling, Fluke will provide an estimate of repair costs
and obtain authorization before commencing the work. Following repair, the
product will be returned to the Buyer transportation prepaid and the Buyer will be
billed for the repair and return transportation charges (FOB Shipping Point).
7 - 20
Fluke 98
Users Manual
THIS WARRANTY IS BUYER'S SOLE AND EXCLUSIVE REMEDY AND IS IN
LIEU OF ALL OTHER WARRANTIES, EXPRESS OR IMPLIED, INCLUDING
BUT NOT LIMITED TO ANY IMPLIED WARRANTY OF MERCHANTABILITY
OR FITNESS FOR A PARTICULAR PURPOSE. FLUKE SHALL NOT BE
LIABLE FOR ANY SPECIAL, INDIRECT, INCIDENTAL OR CONSEQUENTIAL
DAMAGES OR LOSSES, INCLUDING LOSS OF DATA, WHETHER ARISING
FROM BREACH OF WARRANTY OR BASED ON CONTRACT, TORT,
RELIANCE OR ANY OTHER THEORY.
Since some countries or states do not allow limitation of the term of an implied
warranty, or exclusion or limitation of incidental or consequential damages, the
limitations and exclusions of this warranty may not apply to every buyer. If any
provision of this Warranty is held invalid or unenforceable by a court of
competent jurisdiction, such holding will not affect the validity or enforceability of
any other provision.
Fluke Corporation
P.O. Box 9090
Everett, WA
98206-9090
USA
or
Fluke Industrial B.V.
P.O. Box 680
7600 AR
Almelo
The Netherlands
Service Centers
To locate an authorized service center, visit us on the World Wide Web:
http://www.fluke.com
or call Fluke using any of the phone numbers listed below:
+1-800-443-5853 in U.S.A. and Canada
+31-402-678-200 in Europe
+1-206-356-5500 from other countries
Appendixes
7 - 21
APPENDIX 7E Terminology
TERM
DESCRIPTION
ABS
Antilock Brake System
AC
Alternating Current.
AC Coupling
A mode of signal transmission that passes the dynamic
(AC) signal component to the input (INPUT A or INPUT
B), but blocks the DC component. Useful to observe an
AC signal that is normally riding on a DC signal, e.g.
charging ripple.
Acquisition
The process of gathering measuring data into the test
tool's memory.
Acquisition Rate
The number of acquisitions performed per second.
Alternating Current.
An electrical signal in which current and voltage vary in
a repeating pattern over time.
Amplitude
The difference between the highest and lowest level of
a waveform.
Attenuation
The decrease in amplitude of a signal.
Auto Range
Activates an automatic adaptation of the test tool to the
input signal in amplitude, timebase, and triggering.
Backlight
Light that illuminates the test tool's display from the
back of the LCD.
Baud Rate
Communication parameter that indicates the data
transfer rate in bits per second.
BNC
Coaxial-type input connector used for INPUT A and
INPUT B.
Bottom Display
The lower part of the display, where the function key
menu is listed.
Coil On Plug Ignition
System
An ignition system without a distributor, where each
spark plug is integrated with an ignition coil.
Continuity
Instrument setup to check wiring, circuits, connectors,
or switches for breaks (open circuit) or short circuits
(closed circuit).
Contrast
This setting, expressed as a percentage, determines
the contrast ratio between display text or graphics and
the LCD background.
0% is all white.
100% is all black.
7 - 22
Fluke 98
TERM
Users Manual
DESCRIPTION
Conventional Ignition
System
Ignition system that uses a distributor.
Cursor
A vertical line (kind of ruler) that you can place on the
and move horizontally to measure values at certain
points of the waveform.
DC
Direct Current.
DC Coupling
A mode of signal transmission that passes both AC
and DC signal components to the input (INPUT A or
INPUT B) of the test tool. (See also AC Coupling.)
Default Setup
The setup that exists as long as there are no changes
made to the settings.
Diesel Probe
A test probe that has a pickup element to measure the
pressure pulse in the diesel fuel pipe. It converts fuel
pipe expansion into voltage.
Differential
Measurement (delta)
Measurement of the difference between the waveform
sample values at the positions of the two cursors.
Diode
An electrical device that allows current to flow in one
direction only.
Direct Current
A signal with constant voltage and current.
DIS
Distributorless Ignition System.
Division
A specific segment of a waveform, as defined by the
grid on the display.
Dot
One, two, or three vertically adjoining display pixels,
depending on the dot size, forming a graphical unit for
waveform display.
Duty Cycle
On-time or off-time to period time ratio expressed in a
percentage.
ECM
Electronic Control Module on a vehicle.
ECU
Electronic Control Unit on a vehicle.
EIA-232-D/RS-232-C
International standard for serial data communication to
which the optical interface (PM9080) of the FLUKE 98
conforms.
Electromagnetic
Interference
Mutual disturbance of signals, mostly caused by
signals from adjacent wiring.
EMI
Electromagnetic Interference.
Appendixes
TERM
7 - 23
DESCRIPTION
Feed Controlled
Circuit
A circuit that energizes by applying voltage; it already
has a ground.
Filter
Electrical device that only passes or blocks certain
signal frequencies. An application can be removing
noise from a signal.
Frequency
The number of times a waveform repeats in one
second, measured in Hertz (Hz), where 1 Hz equals
one cycle per second.
Function Key Labels
Labels shown on the bottom display that indicate the
function of the blue function keys F1 to F5.
Function Key Menu
The function key labels listed on the bottom display.
Glitch
A momentary spike in a waveform. This can be caused
by a momentary disruption in the tested circuit.
Ground-Controlled
Circuit
A circuit that energizes by applying ground; voltage is
already supplied.
Hall-Effect Sensor
A semiconductor moving relative to a magnetic field,
creating a variable voltage output. Used to determine
position.
Inductance
The signal caused by the sudden change of a
magnetic field. For example when you turn off the
current through a solenoid, a voltage spike is
generated across the solenoid.
Intermittent
Irregular; a condition that happens with no apparent or
predictable pattern.
Invert
To change to the opposite polarity. Puts the waveform
display upside down.
Lambda Sensor
Oxygen sensor or O2 sensor.
Liquid Crystal
Display
A display that uses liquid crystals to display waveforms
and text on its screen.
LCD
Liquid Crystal Display.
Master Reset
Resets the test tool to the factory "Default Set-up." You
can do this by turning power on while pressing the F5
function key.
Menu
A list of choices for selecting a test, a function, or a
setting.
7 - 24
Fluke 98
TERM
Users Manual
DESCRIPTION
Noise
Extraneous electrical signal that can interfere with other
electrical signals. The noise can disturb the function of
the signal when it exceeds a certain electrical level.
NTC
A resistor that has a Negative Temperature Coefficient;
resistance decreases as temperatue increases.
O2 Sensor
Oxygen sensor.
Off-time
The part of an electrical signal during which an
electrical device is energized.
On-time
The part of an electrical signal during which an
electrical device is de-energized.
Optically Isolated
RS-232 Adapter/
Cable
An accessory that allows data communication between
the FLUKE 98 and a computer with RS-232 (serial)
port, or it allows you to print.
Peak Value
The highest and lowest value of a waveform.
Peak-and-Hold
A method for regulating the current flow through
electronic fuel injectors. Supplies higher current
necessary to energize the injector, then drops to a
lower level just enough to keep the injector energized.
Pixel
The smallest graphic detail possible for the liquid
crystal display (LCD).
PTC
A resistor having a Positive Temperature Coefficient;
resistance increases as temperature increases.
Pulse
A voltage signal that increases or decreases from a
constant value, then returns to the original value.
Pulse Modulated
A circuit that maintains average voltage levels by
pulsing the voltage on and off.
Range
Specified limits in which measurements are done.
Reference Voltage
An unaltered voltage applied to a circuit. Battery plus
and ground are examples of reference voltages.
Roll
Visual log of a waveform activity that is useful when
measuring lower frequencies.
Root Mean Square
(RMS)
Conversion of AC voltages to the effective DC value.
RPM
Engine speed expressed in Revolutions Per Minute of
the crankshaft.
Appendixes
7 - 25
TERM
DESCRIPTION
RS-232-C/EIA-232-D
International standard for serial data communication to
which the optical interface of the FLUKE 98 conforms.
Sample
A reading taken from an electrical signal. A waveform
is created from a successive number of samples.
Sampling Rate
The number of readings taken from an electrical signal
every second.
Saturated Driver
Fuel injection circuit that maintains the same voltage
level throughout its on-time. See 'Injector.'
Secondary Pickup
An accessory that can be clamped on the high voltage
coil wire used to measure secondary ignition patterns.
Shielded Test Lead
A test lead that is surrounded by a conductive screen to
protect the measurement signal against environmental
influences, such as electrical noise or radiation.
Spike
A (high) voltage pulse during a short period of time
(sharp pulse).
Timebase
The time defined per each horizontal division on the
display.
Trace
The displayed waveform that shows the variations of
the input signal as a function of time.
Trigger
Determines the beginning point of a waveform.
Trigger Level
The voltage level that a waveform must reach to start
display.
Trigger Slope
The voltage direction that a waveform must have to
start display. A positive Slope requires the voltage to
be increasing as it crosses the Trigger Level; a
negative Slope requires the voltage to be decreasing.
Trigger Source
The test tool input that supplies the signal to provide
the trigger.
Vertical Scale
The scale used for vertical display (vertical sensitivity)
expressed in certain units per division.
Voltage Drop
Voltage loss across a wire, connector, or any other
conductor. Voltage drop equals resistance in ohms
times current in amperes (Ohm's Law).
Waveform
The pattern defined by an electrical signal.
Index
I-1
A
AC coupling. . . . . . . . . . . . . . . . . . . . . . . . . . . . . . . . . . . . . . . . . . . . . . . . . . 3-40
Adapters . . . . . . . . . . . . . . . . . . . . . . . . . . . . . . . . . . . . . . . . . . . . . . . . . . VI, 3-4
Advance . . . . . . . . . . . . . . . . . . . . . . . . . . . . . . . . . . . . . . . . . . . . . . . . . . . . 3-26
Advance (Diesel). . . . . . . . . . . . . . . . . . . . . . . . . . . . . . . . . . . . . . . . . . . . . . 3-29
Air Flow Sensors . . . . . . . . . . . . . . . . . . . . . . . . . . . . . . . . . . . . . . . . . . . . . . 5-37
Alligator Clips . . . . . . . . . . . . . . . . . . . . . . . . . . . . . . . . . . . . . . . . . . . . . . VI, 3-5
Amplitude . . . . . . . . . . . . . . . . . . . . . . . . . . . . . . . . . . . . . . . . . . . . . . . . . . . 1-14
Anti-Lock Wheel Speed Sensor . . . . . . . . . . . . . . . . . . . . . . . . . . . . . . . . . . 5-33
Auto Range . . . . . . . . . . . . . . . . . . . . . . . . . . . . . . . . . . . . . 1-3, 1-15, 3-39, 3-48
Automatic Power Shutdown . . . . . . . . . . . . . . . . . . . . . . . . . . . . . . . . . . . . . 1-12
B
Back Probe Pins . . . . . . . . . . . . . . . . . . . . . . . . . . . . . . . . . . . . . . . . . . . . VI, 3-5
Backlight . . . . . . . . . . . . . . . . . . . . . . . . . . . . . . . . . . . . . . . . . . . . . . . . 1-14, 2-3
Banana Adapters . . . . . . . . . . . . . . . . . . . . . . . . . . . . . . . . . . . . . . . . . . . . . . 3-5
Batteries in Optimal Condition. . . . . . . . . . . . . . . . . . . . . . . . . . . . . . . . . . . . . 6-2
Battery Charger. . . . . . . . . . . . . . . . . . . . . . . . . . . . . . . . . . . . . . . . . . . . . V, 7-17
Battery Life . . . . . . . . . . . . . . . . . . . . . . . . . . . . . . . . . . . . . . . . . . . . . . . . . . 1-12
Battery Replacement. . . . . . . . . . . . . . . . . . . . . . . . . . . . . . . . . . . . . . . . . . . . 6-5
Battery Test. . . . . . . . . . . . . . . . . . . . . . . . . . . . . . . . . . . . . . . . . . . . . 3-32, 5-79
Baud Rate . . . . . . . . . . . . . . . . . . . . . . . . . . . . . . . . . . . . . . . . . . . . . . . . . . . 3-60
BNC Extension Leads . . . . . . . . . . . . . . . . . . . . . . . . . . . . . . . . . . . . . . . . . . . . VI
Burn Time . . . . . . . . . . . . . . . . . . . . . . . . . . . . . . . . . . . . . . . . . . . . . . 3-24, 3-25
Burn Voltage . . . . . . . . . . . . . . . . . . . . . . . . . . . . . . . . . . . . . . . . . . . . 3-24, 3-25
C
Calibrating the Test Leads . . . . . . . . . . . . . . . . . . . . . . . . . . . . . . . . . . 3-62, 6-6
Charging . . . . . . . . . . . . . . . . . . . . . . . . . . . . . . . . . . . . . . . . . . . . . . . 3-31, 5-81
Charging Adapter . . . . . . . . . . . . . . . . . . . . . . . . . . . . . . . . . . . . . . . . . . . . . 1-11
Charging Current. . . . . . . . . . . . . . . . . . . . . . . . . . . . . . . . . . . . . . . . . . . . . . 3-31
Charging the Batteries . . . . . . . . . . . . . . . . . . . . . . . . . . . . . . . . . . . . . . . . . . 6-2
Charging the Battery . . . . . . . . . . . . . . . . . . . . . . . . . . . . . . . . . . . . . . . . . . . 1-12
Charging Voltage . . . . . . . . . . . . . . . . . . . . . . . . . . . . . . . . . . . . . . . . . . . . . 3-31
Clamping Diode Test. . . . . . . . . . . . . . . . . . . . . . . . . . . . . . . . . . . . . . . . . . . 5-85
Cleaning . . . . . . . . . . . . . . . . . . . . . . . . . . . . . . . . . . . . . . . . . . . . . . . . . . . . . 6-2
Compression Test . . . . . . . . . . . . . . . . . . . . . . . . . . . . . . . . . . . . . . . . . . . . . 5-73
Compression test . . . . . . . . . . . . . . . . . . . . . . . . . . . . . . . . . . . . . . . . . . . . . 3-45
Connection Help . . . . . . . . . . . . . . . . . . . . . . . . . . . . . . . . . . . . . . 1-10, 3-9, 3-61
Connection Information . . . . . . . . . . . . . . . . . . . . . . . . . . . . . . . . . . . . . . . . . 1-10
Connections . . . . . . . . . . . . . . . . . . . . . . . . . . . . . . . . . . . . . . . . . . . . . . . . . 1-19
Continuity . . . . . . . . . . . . . . . . . . . . . . . . . . . . . . . . . . . . . . . . . . . . . . . . . . . 3-49
I-2
Fluke 98
Users Manual
Contrast . . . . . . . . . . . . . . . . . . . . . . . . . . . . . . . . . . . . . . . . . . . . 1-14, 2-3, 3-58
Conventional Systems . . . . . . . . . . . . . . . . . . . . . . . . . . . . . . . . . . . . . 3-24, 3-25
Coolant Temperature Sensor. . . . . . . . . . . . . . . . . . . . . . . . . . . . . . . . . . . . 5-13
Crankshaft/Camshaft Position . . . . . . . . . . . . . . . . . . . . . . . . . . . . . . . . . . . 5-21
Current . . . . . . . . . . . . . . . . . . . . . . . . . . . . . . . . . . . . . . . . . . . . . . . . . . . . . 3-54
Current Probe. . . . . . . . . . . . . . . . . . . . . . . . . . . . . . . . . . . . . . . . . 1-3, 3-5, 3-62
Cursors. . . . . . . . . . . . . . . . . . . . . . . . . . . . . . . . . . . . . . . . 1-14, 1-15, 2-32, 4-14
D
Damping. . . . . . . . . . . . . . . . . . . . . . . . . . . . . . . . . . . . . . . . . . . . . . . . . . . . 1-14
DC Coupling. . . . . . . . . . . . . . . . . . . . . . . . . . . . . . . . . . . . . . . . . . . . . . . . . 3-40
Demo Board . . . . . . . . . . . . . . . . . . . . . . . . . . . . . . . . . . . . . . . . . . . . . . . . VI, 2-2
Diesel . . . . . . . . . . . . . . . . . . . . . . . . . . . . . . . . . . . . . . . . . . . . . . . . . . . . . . 5-92
Diesel Advance . . . . . . . . . . . . . . . . . . . . . . . . . . . . . . . . . . . . . . . . . . . . . . 5-96
Diesel Extension Set . . . . . . . . . . . . . . . . . . . . . . . . . . . . . . . . . . . . . . . . . . . 3-6
Diesel Injection Pattern Display . . . . . . . . . . . . . . . . . . . . . . . . . . . . . . . . . . 5-94
Diesel Injector . . . . . . . . . . . . . . . . . . . . . . . . . . . . . . . . . . . . . . . . . . . . . . . 3-28
Diesel Probe Set . . . . . . . . . . . . . . . . . . . . . . . . . . . . . . . . . . . . . . . . . . . . . . 3-6
Diesel RPM Measurements . . . . . . . . . . . . . . . . . . . . . . . . . . . . . . . . . . . . . 5-94
Diesel Test Functions. . . . . . . . . . . . . . . . . . . . . . . . . . . . . . . . . . . . . . . . . . 3-28
Diode . . . . . . . . . . . . . . . . . . . . . . . . . . . . . . . . . . . . . . . . . . . . . . . . . . . . . . 3-49
Display Contrast. . . . . . . . . . . . . . . . . . . . . . . . . . . . . . . . . . . . . . . . . . . . . . . 1-7
Display Recorded Signal . . . . . . . . . . . . . . . . . . . . . . . . . . . . . . . . . . . . . . . . 4-9
Disposing of Batteries . . . . . . . . . . . . . . . . . . . . . . . . . . . . . . . . . . . . . . . . . . 6-4
Distributor Triggering . . . . . . . . . . . . . . . . . . . . . . . . . . . . . . . . . . . . . . . . . . 5-69
Distributorless Ignition System. . . . . . . . . . . . . . . . . . . . . . . . . . . . . . . . . . . 5-60
Divisions. . . . . . . . . . . . . . . . . . . . . . . . . . . . . . . . . . . . . . . . . . . . . . . . . . . . 3-12
Dot Join . . . . . . . . . . . . . . . . . . . . . . . . . . . . . . . . . . . . . . . . . . . . . . . . . . . . 3-58
Dot Size . . . . . . . . . . . . . . . . . . . . . . . . . . . . . . . . . . . . . . . . . . . . . . . . . . . . 3-58
Dual Input Scope . . . . . . . . . . . . . . . . . . . . . . . . . . . . . . . . . . . . . . . . . . . . . 3-38
Duty Cycle . . . . . . . . . . . . . . . . . . . . . . . . . . . . . . . . . . . . . . . . . . . . . . . . . . 3-52
Dwell . . . . . . . . . . . . . . . . . . . . . . . . . . . . . . . . . . . . . . . . . . . . . . . . . . 3-27, 5-67
E
Electrical System . . . . . . . . . . . . . . . . . . . . . . . . . . . . . . . . . . . . . . . . . . . . . 3-30
Environmental Data . . . . . . . . . . . . . . . . . . . . . . . . . . . . . . . . . . . . . . . . . . . . 7-1
Exhaust Gas Recirculation. . . . . . . . . . . . . . . . . . . . . . . . . . . . . . . . . . . . . . 5-43
F
Filter Adapter . . . . . . . . . . . . . . . . . . . . . . . . . . . . . . . . . . . . . . . . . . . . . . . . . 3-4
Filter Adapters . . . . . . . . . . . . . . . . . . . . . . . . . . . . . . . . . . . . . . . . . . . . . . . . . VI
Free Run . . . . . . . . . . . . . . . . . . . . . . . . . . . . . . . . . . . . . . . . . . . . . . . 3-43, 3-44
Freeze . . . . . . . . . . . . . . . . . . . . . . . . . . . . . . . . . . . . . . . . . . . . . . . . . . . . . 1-15
Index
I-3
Frequency . . . . . . . . . . . . . . . . . . . . . . . . . . . . . . . . . . . . . . . . . . . . . . . . . . . 3-52
Fuel Injection. . . . . . . . . . . . . . . . . . . . . . . . . . . . . . . . . . . . . . . . . . . . . . . . . 5-46
Function Key Labels . . . . . . . . . . . . . . . . . . . . . . . . . . . . . . . . . . . . . . 1-14, 3-10
Function Key Menu . . . . . . . . . . . . . . . . . . . . . . . . . . . . . . . . . . . . . . . 1-16, 1-17
Function Keys . . . . . . . . . . . . . . . . . . . . . . . . . . . . . . . . . . . . . . . . . . . 1-14, 3-10
Fuses . . . . . . . . . . . . . . . . . . . . . . . . . . . . . . . . . . . . . . . . . . . . . . . . . . . . . . . 6-5
G
Glitch Detection. . . . . . . . . . . . . . . . . . . . . . . . . . . . . . . . . . . . . . 3-40, 3-41, 4-16
Glitches . . . . . . . . . . . . . . . . . . . . . . . . . . . . . . . . . . . . . . . . . . . . . . . . . . . . . 1-14
Graticule . . . . . . . . . . . . . . . . . . . . . . . . . . . . . . . . . . . . . . . . . . . . . . . . . . . . 3-12
Ground Extension Lead . . . . . . . . . . . . . . . . . . . . . . . . . . . . . . . . . . . . . . . . . . VI
Ground Lead . . . . . . . . . . . . . . . . . . . . . . . . . . . . . . . . . . . . . . . . . . . . . . . . . . 3-4
Ground Lead Extension . . . . . . . . . . . . . . . . . . . . . . . . . . . . . . . . . . . . . . . . . 3-4
Ground Leads . . . . . . . . . . . . . . . . . . . . . . . . . . . . . . . . . . . . . . . . . . . . . . . . . . VI
Grounding . . . . . . . . . . . . . . . . . . . . . . . . . . . . . . . . . . . . . . . . . . . . . . . . . . . 1-22
Grounding Guidelines . . . . . . . . . . . . . . . . . . . . . . . . . . . . . . . . . . . . . . . . . . 1-21
H
Hard Carrying Case . . . . . . . . . . . . . . . . . . . . . . . . . . . . . . . . . . . . . . . . . . . . . V
HEI Adapter. . . . . . . . . . . . . . . . . . . . . . . . . . . . . . . . . . . . . . . . . . . . VI, 3-4, 5-65
HOLD . . . . . . . . . . . . . . . . . . . . . . . . . . . . . . . . . . . . . . . . . . . . . . . . . 1-15, 4-12
Holster. . . . . . . . . . . . . . . . . . . . . . . . . . . . . . . . . . . . . . . . . . . . . . . . . . . . . . . . V
Horizontal Range . . . . . . . . . . . . . . . . . . . . . . . . . . . . . . . . . . . . . . . . . . . . . 1-17
Horizontal Timebase . . . . . . . . . . . . . . . . . . . . . . . . . . . . . . . . . . . . . . . . . . . 3-12
I
Idle Air Control / Idle Speed Control . . . . . . . . . . . . . . . . . . . . . . . . . . . . . . . 5-54
Inductive Pickup . . . . . . . . . . . . . . . . . . . . . . . . . . . . . . . . . . . . . . . . . . . . VI, 3-4
Information Key . . . . . . . . . . . . . . . . . . . . . . . . . . . . . . . . . 1-10, 1-14, 1-16, 1-18
Instrument Setup Overview. . . . . . . . . . . . . . . . . . . . . . . . . . . . . . . . . . . . . . 3-56
Intake Air Temperature Sensor . . . . . . . . . . . . . . . . . . . . . . . . . . . . . . . . . . . 5-13
Inverse Video . . . . . . . . . . . . . . . . . . . . . . . . . . . . . . . . . . . . . . . . . . . . . . . . 3-59
K
Key Descriptions . . . . . . . . . . . . . . . . . . . . . . . . . . . . . . . . . . . . . . . . . . . . . . 1-14
Keypad Overview . . . . . . . . . . . . . . . . . . . . . . . . . . . . . . . . . . . . . . . . . . . . . 1-13
Knock Sensor . . . . . . . . . . . . . . . . . . . . . . . . . . . . . . . . . . . . . . . . . . . . . . . . 5-57
L
Language . . . . . . . . . . . . . . . . . . . . . . . . . . . . . . . . . . . . . . . . . . . . . . . . . . . 3-61
Limitation of Liability . . . . . . . . . . . . . . . . . . . . . . . . . . . . . . . . . . . . . . . . . . . 7-19
Low Pass Filter Probe . . . . . . . . . . . . . . . . . . . . . . . . . . . . . . . . . . . . . . . . . . . 3-6
I-4
Fluke 98
Users Manual
M
Manifold Absolute Pressure (MAP) . . . . . . . . . . . . . . . . . . . . . . . . . . . . . . . . 5-3
Master Reset . . . . . . . . . . . . . . . . . . . . . . . . . . . . . . . . . . . . . . . . . . . . . . 1-7, 2-3
Menu Overview . . . . . . . . . . . . . . . . . . . . . . . . . . . . . . . . . . . . . . . . . . . . . . . 3-8
Min/Max Trendplot . . . . . . . . . . . . . . . . . . . . . . . . . . . . . . . . . . . . . . 1-3, 4-2, 4-6
Mixture Control Solenoid . . . . . . . . . . . . . . . . . . . . . . . . . . . . . . . . . . . . . . . 5-52
Multimeter Functions . . . . . . . . . . . . . . . . . . . . . . . . . . . . . . . . . . . . . . . . . . 3-47
N
Navigating the Menu . . . . . . . . . . . . . . . . . . . . . . . . . . . . . . . . . . . . . . . . . . . 3-9
NiCad Battery Pack . . . . . . . . . . . . . . . . . . . . . . . . . . . . . . . . . . V, 1-6, 1-11, 6-2
Noise . . . . . . . . . . . . . . . . . . . . . . . . . . . . . . . . . . . . . . . . . . . . . . . . . . . . . . 1-14
Noise Pickup . . . . . . . . . . . . . . . . . . . . . . . . . . . . . . . . . . . . . . . . . . . . . . . . 1-21
Noise Rejection . . . . . . . . . . . . . . . . . . . . . . . . . . . . . . . . . . . . . . . . . . . . . . 1-11
Numerical Results . . . . . . . . . . . . . . . . . . . . . . . . . . . . . . . . . . . . . . . . . . . . 1-17
O
On-Line Help . . . . . . . . . . . . . . . . . . . . . . . . . . . . . . . . . . . . . . . . . . . . . . . . 1-16
Optional Accessories . . . . . . . . . . . . . . . . . . . . . . . . . . . . . . . . . . . . . . . . . . 7-16
Optional Probes . . . . . . . . . . . . . . . . . . . . . . . . . . . . . . . . . . . . . . . . . . . . . . . 3-5
Options Menu. . . . . . . . . . . . . . . . . . . . . . . . . . . . . . . . . . . . . . . . . . . . 3-58, 3-61
Oxygen Sensor . . . . . . . . . . . . . . . . . . . . . . . . . . . . . . . . . . . . . . . . . . . . . . . 5-6
P
Parade Result Screen . . . . . . . . . . . . . . . . . . . . . . . . . . . . . . . . . . . . . 3-24, 3-25
Parts and Accessories . . . . . . . . . . . . . . . . . . . . . . . . . . . . . . . . . . . . . . . . . 7-14
Performance Characteristics . . . . . . . . . . . . . . . . . . . . . . . . . . . . . . . . . . . . . 7-1
Piezo Pickup . . . . . . . . . . . . . . . . . . . . . . . . . . . . . . . . . . . . . . . . . . . . . . . . . 3-6
Plot Readings. . . . . . . . . . . . . . . . . . . . . . . . . . . . . . . . . . . . . . . . . . . . . . 1-3, 4-2
Power Adapter/Battery Charger . . . . . . . . . . . . . . . . . . . V, 1-6, 1-11, 1-12, 7-17
Power Sources. . . . . . . . . . . . . . . . . . . . . . . . . . . . . . . . . . . . . . . . . . . . . . . 1-11
Powering the Test Tool . . . . . . . . . . . . . . . . . . . . . . . . . . . . . . . . . 1-6, 1-11, 2-3
Primary Ignition . . . . . . . . . . . . . . . . . . . . . . . . . . . . . . . . . . . . . . . . . . . . . . 5-67
Print Grey . . . . . . . . . . . . . . . . . . . . . . . . . . . . . . . . . . . . . . . . . . . . . . . . . . . 3-60
Printer Menu. . . . . . . . . . . . . . . . . . . . . . . . . . . . . . . . . . . . . . . . . . . . . . . . . 3-60
Printer Settings. . . . . . . . . . . . . . . . . . . . . . . . . . . . . . . . . . . . . . . . . . . . . . . 3-60
Printer Type . . . . . . . . . . . . . . . . . . . . . . . . . . . . . . . . . . . . . . . . . . . . . . . . . 3-60
Probe Identification . . . . . . . . . . . . . . . . . . . . . . . . . . . . . . . . . . . . . . . . . . . 3-39
Probes . . . . . . . . . . . . . . . . . . . . . . . . . . . . . . . . . . . . . . . . . . . . . . . . . . . . . . 3-3
Pulse Width . . . . . . . . . . . . . . . . . . . . . . . . . . . . . . . . . . . . . . . . . . . . . . . . . 3-52
Index
I-5
R
Ranging. . . . . . . . . . . . . . . . . . . . . . . . . . . . . . . . . . . . . . . . . . . . . . . . 1-15, 3-12
Record Functions . . . . . . . . . . . . . . . . . . . . . . . . . . . . . . . . . . . . . . . . . 1-14, 4-2
Relative Compression . . . . . . . . . . . . . . . . . . . . . . . . . . . . . . . . . . 1-3, 3-45, 5-73
Replacement Parts . . . . . . . . . . . . . . . . . . . . . . . . . . . . . . . . . . . . . . . . . . . . 7-14
Replacing the Batteries . . . . . . . . . . . . . . . . . . . . . . . . . . . . . . . . . . . . . . . . . . 6-4
Resetting the Test Tool . . . . . . . . . . . . . . . . . . . . . . . . . . . . . . . . . . . . . . . . . . 1-7
Resistance measurement . . . . . . . . . . . . . . . . . . . . . . . . . . . . . . . . . . . 2-7, 3-49
Ride Height (Position) . . . . . . . . . . . . . . . . . . . . . . . . . . . . . . . . . . . . . . . . . . 5-26
Ripple Voltage. . . . . . . . . . . . . . . . . . . . . . . . . . . . . . . . . . . . . . . . . . . . . . . . 3-31
RMS Voltage . . . . . . . . . . . . . . . . . . . . . . . . . . . . . . . . . . . . . . . . . . . . . . . . . 3-48
Road Test . . . . . . . . . . . . . . . . . . . . . . . . . . . . . . . . . . . . . . . . . . . . . . . . . . . . 1-3
RPM . . . . . . . . . . . . . . . . . . . . . . . . . . . . . . . . . . . . . . . . . . . . . . . . . . . . . . . 3-51
S
Safety Characteristics . . . . . . . . . . . . . . . . . . . . . . . . . . . . . . . . . . . . . . . . . . . 7-1
Safety Grounding . . . . . . . . . . . . . . . . . . . . . . . . . . . . . . . . . . . . . . . . . . . . . 1-20
Safety Precautions . . . . . . . . . . . . . . . . . . . . . . . . . . . . . . . . . . . . . . . . . . . . . . VI
Save/Recall . . . . . . . . . . . . . . . . . . . . . . . . . . . . . . . . . . . . . . . . . . . . . 1-15, 2-29
Scope Functions . . . . . . . . . . . . . . . . . . . . . . . . . . . . . . . . . . . . . . . . . . . . . . 3-37
Secondary Ignition . . . . . . . . . . . . . . . . . . . . . . . . . . . . . . . . . . . . . . . . . . . . 5-60
Secondary Pickup . . . . . . . . . . . . . . . . . . . . . . . . . . . . . . . . . . . . . . . . . 3-3, 3-62
Service Centers. . . . . . . . . . . . . . . . . . . . . . . . . . . . . . . . . . . . . . . . . . . . . . . 7-19
Set Zero . . . . . . . . . . . . . . . . . . . . . . . . . . . . . . . . . . . . . . . . . . . . . . . . . . . . 3-48
Shielded Test Leads . . . . . . . . . . . . . . . . . . . . . . . . . . . . . . . . . . . . . VI, 1-11, 3-3
Signal Noise . . . . . . . . . . . . . . . . . . . . . . . . . . . . . . . . . . . . . . . . . . . . . . . . . 1-11
Single Cylinder Result Screen . . . . . . . . . . . . . . . . . . . . . . . . . . . . . . 3-24, 3-25
Single Input Scope . . . . . . . . . . . . . . . . . . . . . . . . . . . . . . . . . . . . . . . . . . . . 3-38
Single-Shot Function. . . . . . . . . . . . . . . . . . . . . . . . . . . . . . . . . . . . . . . . . . . 3-42
Smooth . . . . . . . . . . . . . . . . . . . . . . . . . . . . . . . . . . . . . . . . . . . . . . . . . . . . . 4-16
Solenoid and Clamping Diode. . . . . . . . . . . . . . . . . . . . . . . . . . . . . . . . . . . . 3-34
Solenoid Test . . . . . . . . . . . . . . . . . . . . . . . . . . . . . . . . . . . . . . . . . . . . . . . . 5-85
Spark Voltage . . . . . . . . . . . . . . . . . . . . . . . . . . . . . . . . . . . . . . . . . . . . . . . . 3-25
Specifications . . . . . . . . . . . . . . . . . . . . . . . . . . . . . . . . . . . . . . . . . . . . . . . . . 7-1
Spikes . . . . . . . . . . . . . . . . . . . . . . . . . . . . . . . . . . . . . . . . . . . . . . . . . . . . . . 1-14
Standard Kit Contents . . . . . . . . . . . . . . . . . . . . . . . . . . . . . . . . . . . . . . . . . . 7-14
Symbols . . . . . . . . . . . . . . . . . . . . . . . . . . . . . . . . . . . . . . . . . . . . . . . . . . . . . VII
T
TDC Sensor . . . . . . . . . . . . . . . . . . . . . . . . . . . . . . . . . . . . . . . . . . . . 3-26, 3-29
Temperature . . . . . . . . . . . . . . . . . . . . . . . . . . . . . . . . . . . . . . . . . . . . 3-55, 5-13
I-6
Fluke 98
Users Manual
Temperature Probe . . . . . . . . . . . . . . . . . . . . . . . . . . . . . . . . 1-3, 3-6, 3-55, 3-62
Terminology . . . . . . . . . . . . . . . . . . . . . . . . . . . . . . . . . . . . . . . . . . . . . . . . . 7-21
Test Lead Setup. . . . . . . . . . . . . . . . . . . . . . . . . . . . . . . . . . . . . . . . . . . . . . 3-62
Test Leads . . . . . . . . . . . . . . . . . . . . . . . . . . . . . . . . . . . . . . . . . . . . . . . . . . . 3-3
Throttle Body Injection System . . . . . . . . . . . . . . . . . . . . . . . . . . . . . . . . . . 5-50
Throttle Position Sensor. . . . . . . . . . . . . . . . . . . . . . . . . . . . . . . . . . . . . . . . 5-16
Timebase . . . . . . . . . . . . . . . . . . . . . . . . . . . . . . . . . . . . . . 1-14, 1-15, 3-12, 3-39
Timing Advance . . . . . . . . . . . . . . . . . . . . . . . . . . . . . . . . . . . . . . . . . . . . . . 5-76
Trace Persistence . . . . . . . . . . . . . . . . . . . . . . . . . . . . . . . . . . . . . . . . . . . . 3-59
Trigger Control Functions. . . . . . . . . . . . . . . . . . . . . . . . . . . . . . . . . . . . . . . 3-43
Trigger Level . . . . . . . . . . . . . . . . . . . . . . . . . . . . . . . . . . . 1-14, 3-39, 3-43, 3-44
Trigger Slope . . . . . . . . . . . . . . . . . . . . . . . . . . . . . . . . . . . . . . . . . . . . . . . . 3-44
Trigger Source . . . . . . . . . . . . . . . . . . . . . . . . . . . . . . . . . . . . . . . . . . . 3-39, 3-44
U
Unpacking . . . . . . . . . . . . . . . . . . . . . . . . . . . . . . . . . . . . . . . . . . . . . . . . . . . . . V
V
Vehicle Data. . . . . . . . . . . . . . . . . . . . . . . . . . . . . . . . . . . . . . . . . . . . . . . . . 3-57
Vehicle Speed Sensor . . . . . . . . . . . . . . . . . . . . . . . . . . . . . . . . . . . . . . . . . 5-29
Vertical Range . . . . . . . . . . . . . . . . . . . . . . . . . . . . . . . . . . . . . . 1-17, 3-12, 3-39
Volt DC, AC . . . . . . . . . . . . . . . . . . . . . . . . . . . . . . . . . . . . . . . . . . . . . . . . . 3-48
Voltage Drop . . . . . . . . . . . . . . . . . . . . . . . . . . . . . . . . . . . . . . . . . . . . 3-35, 5-88
Voltage Reference and Ground . . . . . . . . . . . . . . . . . . . . . . . . . . . . . . . . . . 5-90
Voltage Test . . . . . . . . . . . . . . . . . . . . . . . . . . . . . . . . . . . . . . . . . . . . . . . . . . 2-5
W
Warranty. . . . . . . . . . . . . . . . . . . . . . . . . . . . . . . . . . . . . . . . . . . . . . . . . . . . 7-19
Waveform. . . . . . . . . . . . . . . . . . . . . . . . . . . . . . . . . . . . . . . . . . . . . . . . . . . 1-14