1
92B/96B/99B/105B
ScopeMeter
Users Manual
4822 872 00724
March 1996, Rev. 4, 1/99
1996, 1999 Fluke Corporation. All rights reserved. Printed in the Netherlands
All product names are trademarks of their respective companies.
I
TABLE OF CONTENTS
CHAPTER 1
INTRODUCING YOUR SCOPEMETER TEST TOOL
SCOPEMETER TEST TOOL FEATURES . . . . . . . . . . . . . . . . . . . . . . . . . . . . . . . . . . . . . . . . . . . . . . . 1-2
USING THE HOLSTER AND THE TILT STAND . . . . . . . . . . . . . . . . . . . . . . . . . . . . . . . . . . . . . . . . . . 1-3
POWERING THE SCOPEMETER TEST TOOL . . . . . . . . . . . . . . . . . . . . . . . . . . . . . . . . . . . . . . . . . . 1-4
MINIMIZING SIGNAL NOISE . . . . . . . . . . . . . . . . . . . . . . . . . . . . . . . . . . . . . . . . . . . . . . . . . . . . . . . . . 1-5
CHARGING THE BATTERY . . . . . . . . . . . . . . . . . . . . . . . . . . . . . . . . . . . . . . . . . . . . . . . . . . . . . . . . . 1-6
LOOKING AT ALL MEASUREMENT CONNECTIONS . . . . . . . . . . . . . . . . . . . . . . . . . . . . . . . . . . . . 1-7
READING THE DISPLAY . . . . . . . . . . . . . . . . . . . . . . . . . . . . . . . . . . . . . . . . . . . . . . . . . . . . . . . . . . . 1-8
USING THE KEYS . . . . . . . . . . . . . . . . . . . . . . . . . . . . . . . . . . . . . . . . . . . . . . . . . . . . . . . . . . . . . . . . 1-10
STEPPING THROUGH A WINDOW . . . . . . . . . . . . . . . . . . . . . . . . . . . . . . . . . . . . . . . . . . . . . . . . . . 1-12
USING ON-LINE INFORMATION . . . . . . . . . . . . . . . . . . . . . . . . . . . . . . . . . . . . . . . . . . . . . . . . . . . . 1-13
CHAPTER 2
GETTING STARTED
ADJUSTING THE DISPLAY . . . . . . . . . . . . . . . . . . . . . . . . . . . . . . . . . . . . . . . . . . . . . . . . . . . . . . . . . 2-3
SELECTING THE PROBE TYPE . . . . . . . . . . . . . . . . . . . . . . . . . . . . . . . . . . . . . . . . . . . . . . . . . . . . . . 2-4
POWER-ON CONFIGURATIONS . . . . . . . . . . . . . . . . . . . . . . . . . . . . . . . . . . . . . . . . . . . . . . . . . . . . . 2-4
PERFORMING AN EASY SETUP . . . . . . . . . . . . . . . . . . . . . . . . . . . . . . . . . . . . . . . . . . . . . . . . . . . . . 2-5
CHAPTER 3
MAKING MEASUREMENTS
MAKING CONNECTIONS . . . . . . . . . . . . . . . . . . . . . . . . . . . . . . . . . . . . . . . . . . . . . . . . . . . . . . . . . . . 3-2
USING THE MEASUREMENT FUNCTIONS . . . . . . . . . . . . . . . . . . . . . . . . . . . . . . . . . . . . . . . . . . . . . 3-3
USING A SHORTCUT TO MOST COMMONLY MEASUREMENTS . . . . . . . . . . . . . . . . . . . . . . . . . . 3-9
ORDERING MEASUREMENT READINGS . . . . . . . . . . . . . . . . . . . . . . . . . . . . . . . . . . . . . . . . . . . . . 3-10
MEASURING FUNCTIONS NOT AVAILABLE FROM THE MEASURE MENU . . . . . . . . . . . . . . . . . 3-10
MEASUREMENTS MAP . . . . . . . . . . . . . . . . . . . . . . . . . . . . . . . . . . . . . . . . . . . . . . . . . . . . . . . . . . . 3-12
92B/96B/99B/105B
II
CHAPTER 4
Users Manual
USING THE DUAL DISPLAY MODE FUNCTIONS
MAKING CONNECTIONS . . . . . . . . . . . . . . . . . . . . . . . . . . . . . . . . . . . . . . . . . . . . . . . . . . . . . . . . . . . 4-2
SELECTING A MAIN MODE . . . . . . . . . . . . . . . . . . . . . . . . . . . . . . . . . . . . . . . . . . . . . . . . . . . . . . . . . 4-3
SELECTING RANGES (MANUAL/AUTO RANGE) . . . . . . . . . . . . . . . . . . . . . . . . . . . . . . . . . . . . . . . 4-7
HOLDING A STABLE MEASUREMENT (TOUCH HOLD) . . . . . . . . . . . . . . . . . . . . . . . . . . . . . . . . . 4-8
DISPLAYING MINIMUM MAXIMUM READINGS WITH RELATED TRENDPLOT . . . . . . . . . . . . . . . 4-9
SELECTING THE SCOPEMETER KEY SUBMENU . . . . . . . . . . . . . . . . . . . . . . . . . . . . . . . . . . . . . . 4-13
MAKING MEASUREMENTS IN METER AND EXT.mV MODE . . . . . . . . . . . . . . . . . . . . . . . . . . . . . 4-14
TAKING RELATIVE READINGS (SCALING) . . . . . . . . . . . . . . . . . . . . . . . . . . . . . . . . . . . . . . . . . . . 4-14
CHAPTER 5
USING IN SCOPE MODE
MAKING CONNECTIONS . . . . . . . . . . . . . . . . . . . . . . . . . . . . . . . . . . . . . . . . . . . . . . . . . . . . . . . . . . . 5-3
MAKING AN EASY SETUP . . . . . . . . . . . . . . . . . . . . . . . . . . . . . . . . . . . . . . . . . . . . . . . . . . . . . . . . . . 5-4
CONTROLLING INPUTS A AND B . . . . . . . . . . . . . . . . . . . . . . . . . . . . . . . . . . . . . . . . . . . . . . . . . . . . 5-4
ADJUSTING THE AMPLITUDE . . . . . . . . . . . . . . . . . . . . . . . . . . . . . . . . . . . . . . . . . . . . . . . . . . . . . . 5-5
ADJUSTING THE TIME BASE . . . . . . . . . . . . . . . . . . . . . . . . . . . . . . . . . . . . . . . . . . . . . . . . . . . . . . . 5-6
POSITIONING THE WAVEFORM ON THE DISPLAY . . . . . . . . . . . . . . . . . . . . . . . . . . . . . . . . . . . . . 5-7
ACQUIRING WAVEFORMS . . . . . . . . . . . . . . . . . . . . . . . . . . . . . . . . . . . . . . . . . . . . . . . . . . . . . . . . . 5-8
SELECTING THE SCOPE SUBMENU . . . . . . . . . . . . . . . . . . . . . . . . . . . . . . . . . . . . . . . . . . . . . . . . 5-10
TRIGGERING . . . . . . . . . . . . . . . . . . . . . . . . . . . . . . . . . . . . . . . . . . . . . . . . . . . . . . . . . . . . . . . . . . . 5-12
USING THE MIN MAX ENVELOPE FUNCTION OF THE FLUKE 92B . . . . . . . . . . . . . . . . . . . . . . . 5-21
USING THE SCOPE RECORD AND MIN MAX ENVELOPE FUNCTIONS OF
THE FLUKE 96B, 99B, or 105B . . . . . . . . . . . . . . . . . . . . . . . . . . . . . . . . . . . . . . . . . . . . . . . . . . . . . 5-22
MAKING COMBINATIONS WITH INPUT A AND INPUT B . . . . . . . . . . . . . . . . . . . . . . . . . . . . . . . . 5-26
DISPLAYING MULTIPLE WAVEFORMS . . . . . . . . . . . . . . . . . . . . . . . . . . . . . . . . . . . . . . . . . . . . . . 5-26
ADAPTING THE DISPLAY . . . . . . . . . . . . . . . . . . . . . . . . . . . . . . . . . . . . . . . . . . . . . . . . . . . . . . . . . 5-27
III
CHAPTER 6
USING ADDITIONAL CAPABILITIES
MAKING MEASUREMENTS USING THE CURSORS . . . . . . . . . . . . . . . . . . . . . . . . . . . . . . . . . . . . . 6-2
DELETING MEMORIES . . . . . . . . . . . . . . . . . . . . . . . . . . . . . . . . . . . . . . . . . . . . . . . . . . . . . . . . . . . . . 6-6
SAVING TO MEMORY . . . . . . . . . . . . . . . . . . . . . . . . . . . . . . . . . . . . . . . . . . . . . . . . . . . . . . . . . . . . . . 6-7
RECALLING FROM MEMORY . . . . . . . . . . . . . . . . . . . . . . . . . . . . . . . . . . . . . . . . . . . . . . . . . . . . . . . 6-8
USING WAVEFORM MATH FUNCTIONS . . . . . . . . . . . . . . . . . . . . . . . . . . . . . . . . . . . . . . . . . . . . . 6-11
USING A PRINTER . . . . . . . . . . . . . . . . . . . . . . . . . . . . . . . . . . . . . . . . . . . . . . . . . . . . . . . . . . . . . . . 6-14
USING THE WAVEFORM GENERATOR . . . . . . . . . . . . . . . . . . . . . . . . . . . . . . . . . . . . . . . . . . . . . . 6-17
TESTING COMPONENTS . . . . . . . . . . . . . . . . . . . . . . . . . . . . . . . . . . . . . . . . . . . . . . . . . . . . . . . . . . 6-17
SETTING THE DATE AND TIME . . . . . . . . . . . . . . . . . . . . . . . . . . . . . . . . . . . . . . . . . . . . . . . . . . . . . 6-19
CHANGING THE RESET CONFIGURATIONS . . . . . . . . . . . . . . . . . . . . . . . . . . . . . . . . . . . . . . . . . . 6-20
ALTERING THE CONTINUOUS AUTO SET CONFIGURATION . . . . . . . . . . . . . . . . . . . . . . . . . . . . 6-22
CHAPTER 7
MEASURING EXAMPLES
MEASURING TEMPERATURE . . . . . . . . . . . . . . . . . . . . . . . . . . . . . . . . . . . . . . . . . . . . . . . . . . . . . . . 7-2
MEASURING CURRENT . . . . . . . . . . . . . . . . . . . . . . . . . . . . . . . . . . . . . . . . . . . . . . . . . . . . . . . . . . . . 7-4
MEASURING POWER WITH MATH FUNCTION . . . . . . . . . . . . . . . . . . . . . . . . . . . . . . . . . . . . . . . . . 7-7
MEASURING THREE-PHASE ON A DUAL INPUT . . . . . . . . . . . . . . . . . . . . . . . . . . . . . . . . . . . . . . . 7-9
MEASURING PHASE USING THE CURSORS . . . . . . . . . . . . . . . . . . . . . . . . . . . . . . . . . . . . . . . . . . 7-12
MEASURING PULSE RESPONSE OF AN AMPLIFIER . . . . . . . . . . . . . . . . . . . . . . . . . . . . . . . . . . . 7-14
CHAPTER 8
USER MAINTENANCE
CLEANING . . . . . . . . . . . . . . . . . . . . . . . . . . . . . . . . . . . . . . . . . . . . . . . . . . . . . . . . . . . . . . . . . . . . . . . 8-2
KEEPING BATTERIES IN OPTIMAL CONDITION . . . . . . . . . . . . . . . . . . . . . . . . . . . . . . . . . . . . . . . . 8-2
REPLACING AND DISPOSING OF BATTERIES . . . . . . . . . . . . . . . . . . . . . . . . . . . . . . . . . . . . . . . . . 8-3
REPLACING FUSES . . . . . . . . . . . . . . . . . . . . . . . . . . . . . . . . . . . . . . . . . . . . . . . . . . . . . . . . . . . . . . . 8-5
CALIBRATING THE PROBES . . . . . . . . . . . . . . . . . . . . . . . . . . . . . . . . . . . . . . . . . . . . . . . . . . . . . . . 8-5
92B/96B/99B/105B
IV
CHAPTER 9
Users Manual
APPENDIXES
APPENDIX 9A
APPENDIX 9B
APPENDIX 9C
APPENDIX 9D
APPENDIX 9E
SPECIFICATIONS . . . . . . . . . . . . . . . . . . . . . . . . . . . . . . . . . . . . . . . . . . . . . . . . . . . . 9-3
PARTS AND ACCESSORIES . . . . . . . . . . . . . . . . . . . . . . . . . . . . . . . . . . . . . . . . . . 9-15
PM8907 INFORMATION . . . . . . . . . . . . . . . . . . . . . . . . . . . . . . . . . . . . . . . . . . . . . . 9-19
WARRANTY AND SERVICE CENTERS . . . . . . . . . . . . . . . . . . . . . . . . . . . . . . . . . . 9-21
TERMINOLOGY . . . . . . . . . . . . . . . . . . . . . . . . . . . . . . . . . . . . . . . . . . . . . . . . . . . . . 9-23
V
VI
ABOUT THIS MANUAL
Chapter 1 Introducing the ScopeMeter Test Tool
This chapter introduces features and capabilities of your
ScopeMeter test tool.
Chapter 2 Getting Started
This chapter provides a 15-minute demonstration intended
for those who are not familiar with the ScopeMeter test
tool.
Chapter 3 Making Measurements
This chapter explores all measurements and specifies the
use of the direct Measure Menu key. At any time, you can
choose over 30 measurements to get an immediate
reading on the display.
92B/96B/99B/105B
Users Manual
Chapter 6 Using Additional Capabilities
This chapter explores the additional capabilities available
with your ScopeMeter test tool. The chapter covers
subjects, such as Scope measurements using the cursors,
saving and recalling screens, waveforms, or setups, and
making a hard copy on your printer.
Chapter 7 Measuring Examples
This chapter outlines step-by-step procedures necessary
to make some typical measurements.
Chapter 8 User Maintenance
This chapter describes the cleaning of the ScopeMeter test
tool and proper use and replacement of the battery pack.
Periodic probe calibration is also covered here.
Chapter 9 Appendixes
Chapter 4 Using the Dual Display Mode
This chapter addresses the use of four Dual Display Mode
Functions of the ScopeMeter test tool:
, , , and
. You will learn how to set up the test tool for ac and
dc voltage measurements, diode tests, resistance
measurements, and trend plotting. Chapter 5 contains all
the Scope mode information.
Chapter 5 Using the Scope Mode
This chapter explores the specific use of the test tool as a
digital storage oscilloscope. You will learn how to make,
store, and compare measurements.
A. Specifications: Operating characteristics.
B. Parts and Accessories: Model numbers and replacement
codes for all parts and accessories delivered with your
ScopeMeter test tool.
C. PM8907 Power Adapter/ Battery Charger.
D. Warranty Information and Service Centers: Warranty
terms and Service Center addresses.
E. Terminology: Glossary of special terms.
VII
Index
The index at the end of the manual lists words
alphabetically. Consult this list to find an item quickly.
NOTE
Throughout this manual an
through a model number
( 92B ) indicates that the function being discussed does not
apply to that specific model number.
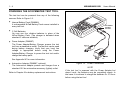
UNPACKING THE SCOPEMETER TEST
TOOL KIT
The following items should be included in your ScopeMeter®
test tool kit (also see the yellow shipment card):
1. ScopeMeter test tool
2. NiCad Battery Pack (installed)
3. Protective Holster
4. Users Manual (this book)
5. Accessory Case, which includes the following:
6. Set of two Probes
7. Set of two Industrial Alligator Clips for Scope Probes
8. Multimeter Test Lead Set, which includes the following:
9. Test Leads (red and black)
10. Industrial Test Probes (red and black)
11. Industrial Alligator Clip (black)
12. Banana Adapters (red and black)
13. Power Adapter/Battery Charger
14. Probe Accessory Set, which includes the following:
15. HF Adapters (2 x black)
16. Mini Test Hooks (red and grey)
17. Trim Screwdrivers (red and grey)
18. Probe Tip to Banana Adapters (red and grey)
19. Hight Voltage Test Pins (red and grey)
20 FlukeView Software with RS-232 Adapter/Cable for
communication with a computer 92B 96B 99B .
92B/96B/99B/105B
VIII
WARNING
READ "SAFETY" CAREFULLY BEFORE USING YOUR
SCOPEMETER TEST TOOL.
Users Manual
International electrical symbols used are explained below.
Caution (see explanation in
manual)
DOUBLE INSULATION
(Protection Class)
SAFETY
Common (Lo) input symbol,
equal potential
Recycling symbol
The instrument described in this manual is designed to be
used only by qualified personnel.
High BNC input symbol
DC-Direct Current
Earth
AC-Alternating Current
Safety Precautions
To use this instrument safely, it is essential that operating
and servicing personnel follow both generally accepted
safety procedures and the safety precautions specified in
this manual.
Specific warning and caution statements, where they
apply, will be found throughout the manual.
Where necessary, the warning and caution statements
and/or symbols are marked on the instrument.
A CAUTION identifies conditions and actions that may
damage the test tool.
A WARNING IDENTIFIES CONDITIONS AND ACTIONS
THAT POSE HAZARD(S) TO THE USER.
The terms "Isolated" or "Electrically floating" are used in
this manual to indicate a measurement in which the
ScopeMeter test tool COM (common, also called ground) is
connected to a voltage different from earth ground. The
term "Grounded" is used in this manual to indicate a
measurement in which the ScopeMeter test tool COM
(common) is connected to an earth ground potential.
The ScopeMeter test tool COM (common) inputs (red
INPUT A BNC shield, grey INPUT B BNC shield, and black
4-mm banana jack) are connected internally via selfrecovering fault protection. The input connectors have no
exposed metal and are fully insulated to protect against
electrical shock. The black 4-mm banana jack COM
(common) can be connected to a voltage above earth
ground for isolated (electrically floating) measurements
and is rated up to 600V rms above earth ground.
IX
The ScopeMeter test tool uses a three-lead connection system for dual input, isolated (electrically floating) measurements. The connections for isolated and grounded
measurements are shown in the following illustration.
WARNING
DO THE FOLLOWING TO AVOID ELECTRICAL SHOCK
COM (COMMON)
IF A SCOPEMETER TEST TOOL
INPUT IS CONNECTED TO >42V PEAK (30V RMS):
1. USE ONLY THE TEST LEAD/PROBE SET SUPPLIED
WITH THE SCOPEMETER TEST TOOL (OR
SAFETY-DESIGNED
EQUIVALENTS
WITHOUT
EXPOSED METAL CONNECTORS).
2. DO NOT USE CONVENTIONAL EXPOSED METAL
BNC OR BANANA PLUG CONNECTORS IF THE
COM (COMMON) IS >42V PEAK (30V RMS).
3. USE ONLY ONE
COM (COMMON) CONNECTION
(THE 4-MM BLACK BANANA JACK).
4. REMOVE ALL PROBES AND TEST LEADS THAT
ARE NOT IN USE.
5. USE 600V RATED PROBE TIP ADAPTERS.
"600V" IS PRINTED ON EQUIPMENT SO RATED.
Figure 1. Common (Ground) Connections
6. CONNECT THE PM8907 POWER ADAPTER TO THE
AC OUTLET BEFORE CONNECTION TO THE
SCOPEMETER TEST TOOL.
X
If Safety-Protection is Impaired
Use of equipment in a manner not specified may
impair the protection provided by the equipment.
Before use, inspect probes for mechanical damage
and replace damaged probes!
Whenever it is likely that safety has been impaired, the
instrument must be turned off and disconnected from line
power. The matter should then be referred to qualified
personnel. Safety is likely to be impaired if, for example,
the instrument fails to perform the intended measurements
or shows visible damage.
MAKING ISOLATED MEASUREMENTS
Isolating from Earth Ground
The ScopeMeter test tool uses a three-lead connection
system for dual input, isolated (electrically floating)
measurements. Use a test lead connected to the black 4-mm
banana jack as common ground.
There are only three wires to connect for dual input isolated
ground operation, useful for three-phase industrial voltage
measurements. You can connect the three leads on the
test tool (INPUT A, INPUT B, and common) to a threephase electrical power line in any order. Use the A-B mode
(see Chapter 5) to display all three phases of electrical
power at the same time.
92B/96B/99B/105B
Users Manual
For three-phase electrical or other isolated ground
industrial measurements, we strongly recommend that you
use the black Industrial Alligator Clip and the red and grey
Industrial Probe Alligator Clips (see Figure 4). These parts
are included with original purchase ScopeMeter test tools
and are also available as accessories from your FLUKE
representative.
Isolating from Input to Input
The ScopeMeter test tool is not isolated between inputs but
uses the black 4-mm banana jack for measurements
isolated from earth ground.
Complete isolation between INPUT A and INPUT B is
useful for some floating measurement applications, such
as measuring different isolated transformer windings at the
same time.
For those applications requiring true isolated grounds
(commons) between inputs, we recommend that you make
two separate measurements or use two ScopeMeter test
tools.
XI
DECLARATION OF CONFORMITY
for
Sample tests
Standards used:
FLUKE 92B/96B/99B/105B
ScopeMeter® Series II Test Tool
EN 61010-1 (1993)
Safety Requirements for Electrical Equipment
for Measurement, Control, and Laboratory Use
Manufacturer
Fluke Industrial B.V.
Lelyweg 1
7602 EA Almelo
The Netherlands
Statement of Conformity
Based on test results using appropriate standards, the
product is in conformity with
Electromagnetic Compatibility Directive 89/336/EEC
Low Voltage Directive 73/23/EEC
EN 50081-1 (1992)
Electromagnetic Compatibility Generic Emission Standard:
EN55022 and EN60555-2
EN 50082-1 (1992)
Electromagnetic Compatibility Generic Immunity Standard:
IEC801-2, -3, -4, -5
The tests have been performed in a typical configuration.
This Conformity is indicated by the symbol
'Conformité européenne'.
, i.e.
92B/96B/99B/105B
XII
Single Input Connection
with Mini Test Hook
Single Input Connection
with HF Adapter
Dual Input Connections
with Mini Test Hooks
Dual Input Connections
with HF Adapters
Users Manual
Figure 2. Input Connections for High Frequency Electronic Measurement
WARNING
To prevent electric shock and personal injury, Mini Test Hooks and HF Adapters must not be connected to any
voltage higher than 42V peak (30V rms) to earth. Always pay attention to the markings on the accessories.
XIII
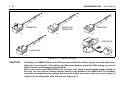
Single Input Connection
with High Voltage
Test Pin
Single Input Connection with
Industrial Alligator Clips
(PM9084/001 & AC20)
Single Input Connection
with High Voltage
Test Pin & AC20
Dual Input Connections with
Industrial Alligator Clips
(PM9084/001 & AC20)
Figure 3. Input Connections for Isolated Heavy Duty Industrial Measurements
XIV
92B/96B/99B/105B
Users Manual
Chapter 1
Introducing your ScopeMeter Test Tool
SCOPEMETER TEST TOOL FEATURES . . . . . . . . .
ScopeMeter Features . . . . . . . . . . . . . . . . . . . . . . .
Scope Capabilities . . . . . . . . . . . . . . . . . . . . . . . . .
Digital MultiMeter Capabilities . . . . . . . . . . . . . . . .
USING THE HOLSTER AND THE TILT STAND . . . .
POWERING THE SCOPEMETER TEST TOOL . . . . .
MINIMIZING SIGNAL NOISE . . . . . . . . . . . . . . . . . . .
CHARGING THE BATTERY . . . . . . . . . . . . . . . . . . . .
Saving Battery Life . . . . . . . . . . . . . . . . . . . . . . . . .
LOOKING AT ALL
MEASUREMENT CONNECTIONS . . . . . . . . . . . . . . .
Common Ground, Inputs A B . . . . . . . . . . . . . . . . .
Input/Output Terminal Ratings . . . . . . . . . . . . . . . .
RS-232 Optical Interface Connection . . . . . . . . . . .
1-2
1-2
1-2
1-2
1-3
1-4
1-5
1-6
1-6
1-7
1-7
1-7
1-8
READING THE DISPLAY . . . . . . . . . . . . . . . . . . . . . 1-8
Reading a Dual Display . . . . . . . . . . . . . . . . . . . . . 1-9
Reading a Scope Display . . . . . . . . . . . . . . . . . . . 1-9
Reading a Window Display . . . . . . . . . . . . . . . . . . 1-9
USING THE KEYS . . . . . . . . . . . . . . . . . . . . . . . . . . 1-10
STEPPING THROUGH A WINDOW . . . . . . . . . . . . 1-12
USING ON-LINE INFORMATION . . . . . . . . . . . . . . 1-13
1-2
92B/96B/99B/105B
Users Manual
SCOPEMETER TEST TOOL FEATURES
Scope Capabilities
Your ScopeMeter test tool combines the capabilities of an
easy-to-use digital storage oscilloscope with the versatility
of a digital multimeter. When you select a measurement
function, the test tool automatically chooses the best setup
to analyze and compare complex waveforms, or simply to
read voltage levels.
•
Triggering includes external triggering and TV line
selector.
•
Five giga samples in recurrent mode for full resolution
display of high frequency signals. (2.5 giga samples for
Fluke 92B and 96B)
•
Continuous Auto Set for hands-free probing without
adjustments to test the tool.
•
MIN MAX Envelope mode for recording changes in
waveforms.
•
ScopeRecord™ allows you to capture and view
waveforms spanning 120 screens 92B .
ScopeMeter Features
•
Rugged, dual-input oscilloscope and high bandwidth
true RMS Meter in one instrument.
•
•
Four hours of battery operation.
•
•
Optically isolated PC/Printer interface.
•
Separate memories for storage
instrument setups, and screens.
Allows you to measure floating from mains with the
600V insulated probes.
Digital MultiMeter Capabilities
Information key to access on line information on all
functions.
of
waveforms,
•
•
•
•
3000 count, 5 MHz bandwidth true RMS.
Each Meter reading is accompanied by a Scope display.
Displays up to four simultaneous readings.
MIN MAX TrendPlot automatically graphs meter
readings and shows minimum and maximum peak
values with the actual or relative time.
Introducing The ScopeMeter Test Tool
1-3
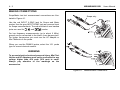
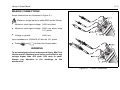
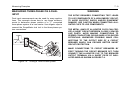
USING THE HOLSTER AND THE TILT STAND
The ScopeMeter test tool is cradled in a holster that provides
shock protection during rough handling. All keys and
connections are accessible with the holster in place. You will
need to remove the holster only to replace the batteries.
(See Chapter 8 for battery replacement instructions.)
RELEASE
HERE
The test tool is also equipped with a multiposition tilt stand,
allowing viewing from different angles. The stand can also
be used to hang the test tool at a convenient viewing
position. Simply push up on the quick release and tilt the
stand. The tilt stand/bracket is fully usable with the holster
in place. Typical positions are shown in Figure 1-1.
Figure 1-1. Multiposition Stand
1-4
92B/96B/99B/105B
Users Manual
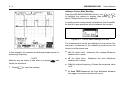
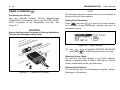
POWERING THE SCOPEMETER TEST TOOL
The test tool can be powered from any of the following
sources. Refer to Figure 1-2.
•
Internal Battery Pack (PM9086)
A rechargeable NiCad Battery Pack comes installed in
every test tool.
•
C Cell Batteries
You can use four alkaline batteries in place of the
NiCad Battery Pack. (The charger is defeated when
standard C cells are installed).
•
Power Adapter (PM8907)
The Power Adapter/Battery Charger powers the test
tool from a standard ac outlet. The test tool can be used
during battery charging. Verify that your local line
voltage is appropriate before using the Power
Adapter/Battery Charger to power the test tool and/or
charge the battery pack.
EXTERNAL
POWER
SOCKET
See Appendix 9C for more information.
•
Automotive Adapter (PM9087, optional)
The Automotive Adapter powers and charges from a
standard 12V dc automotive accessory (lighter) outlet.
Refer to Chapter 8 for battery replacement instructions.
Figure 1-2. Power Connections
NOTE
If the test tool is powered with the Power Adapter but
doesn’t work, the batteries may be completely empty. In
that case it is advised to charge the batteries for 21 hours
before using the test tool.
Introducing The ScopeMeter Test Tool
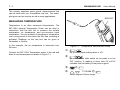
MINIMIZING SIGNAL NOISE
In general, using your test tool on battery power only will
minimize noise pickup. Using the 10:1 probe will help in
noise rejection.
If you use the Power Adapter (PM8907), connect a test
lead from the black 4-mm banana jack COM (common) to
the measurement common (ground) of the system under
test. This technique reduces or eliminates any power line
related noise.
1-5
1-6
92B/96B/99B/105B
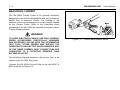
CHARGING THE BATTERY
WARNING
TO AVOID ELECTRICAL SHOCK, USE ONLY A BATTERY
CHARGER THAT IS AUTHORIZED FOR USE WITH
SCOPEMETER TEST TOOL.
Use the following procedure to charge the battery pack and
power the instrument:
1. Connect the Power Adapter/Battery Charger to line
voltage.
2. Insert the Power Adapter/Battery Charger low voltage
plug into the Power Adapter connector of the
ScopeMeter test tool. The test tool can now be used
while the NiCad batteries charge slowly. If the test tool
is turned off, the batteries charge more quickly.
NOTE
When the batteries are completely empty, the test tool
can not work during charging. In that case it is advised
to charge the batteries for 21 hours before using the
test tool.
During operation, when the batteries are low, a blinking
battery symbol
appears on the top right of the
display. When this occurs there is typically more than
30 minutes of operating time left.
Users Manual
3. The Power Adapter/Battery Charger uses a trickle charge
for the batteries, so no damage can occur if you leave it
charging for long periods, e.g., through the weekend.
Typically a 21-hour recharge provides 4 hours of use.
Saving Battery Life
When operated only on batteries, the test tool conserves
power by shutting itself down. If no new keys have been
pressed for 6 minutes or if the battery level is too low, the
test tool beeps and displays a message. This prompts you to
turn off the test tool or to continue. If no key is pressed
during the next 5 minutes, the test tool turns itself off
automatically.
When the
is pressed ON, the last configuration prior to
the automatic shutdown will be restored.
Automatic power shutdown will not occur if Min Max
TrendPlot™ or ScopeRecord™ is active or if any key is
pressed. Although recording will continue if the batteries
are low, memory retention is not jeopardized.
If the Power Adapter is connected, there is no automatic
power shutdown.
Introducing The ScopeMeter Test Tool
LOOKING AT ALL
MEASUREMENT CONNECTIONS
The ScopeMeter test tool provides four signal connection
points: two safety BNC jack inputs (red INPUT A and grey
INPUT B) and two safety 4-mm banana jack inputs (COM
EXT.mV). This arrangement is shown in Figure
and Ω
1-3. All connections are positioned within a protective recess
at the top of the instrument. The banana jacks are also used
as Waveform Generator Output. 92B 96B
1-7
In
mode, you can use the red INPUT A BNC jack
and the grey INPUT B BNC jack as input.
In
mode, only the red INPUT A BNC jack is used
as input.
In , , and
modes, use the red and black 4-mm
banana jacks.
For low frequency measurements (up to about 2 MHz),
ground can be connected to the black 4-mm banana jack.
For higher frequencies you must use the HF Adapter or
Mini Testhook on the probe.
The red 4-mm banana jack also serves as an input
connection for an external trigger in Scope mode or as an
output connection for the waveform generator. This
waveform generator can provide voltage or current output.
Figure 1-3. Measurement Connections
Common Ground, Inputs A B
The test tool uses a three-lead connection system for dual
input, isolated (electrically floating) measurements.
Input/Output Terminal Ratings
Maximum voltage ratings are defined near the related
terminal. Refer to the Specifications in Appendix 10A for
complete terminal rating information.
1-8
92B/96B/99B/105B
Users Manual
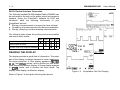
RS-232 Optical Interface Connection
The Optically Isolated RS-232 Adapter/Cable (PM9080) can
be connected to the test tool for printer output and computer
interface. Using the FlukeView software for DOS and
Windows adds the following functionality to your
ScopeMeter test tool:
Storing of measurements in memory for later retrieval.
Comparing of measurements with reference examples.
Storing, analyzing, and documenting measurements.
•
•
•
The following table shows the printing and communication
features for each model:
92B
96B
99B
105B
Screen dump using FlukeView
Direct output to printer
Remote control via computer software
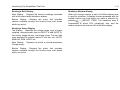
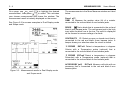
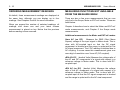
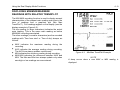
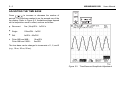
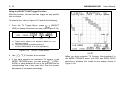
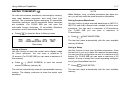
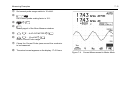
READING THE DISPLAY
The display provides a great deal of information. The major
part of the display is always devoted to meter readings or
the scope waveform. A Dual display appears in
,
, , and
modes, and is divided into two areas:
Main display and Bottom display. A Scope display appears
in
mode, and is divided into three areas: Top
display, Main display, and Bottom display.
Refer to Figure 1-4 during the following discussions.
Figure 1-4. ScopeMeter Test Tool Display
Introducing The ScopeMeter Test Tool
Reading a Dual Display
Main Display: Displays the numeric readings combined
with a full screen-width waveform display.
Bottom Display: Displays the menu that provides
choices available through the function keys and shows
which are active.
Reading a Scope Display
Top Display: Identifies the voltage range, type of signal
coupling, selected probe type for INPUT A and INPUT B,
time scale, trigger source, and trigger slope. The top right
area displays the present status of the test tool, AUTO,
MANUAL, RUN, HOLD, etc.
Main Display: Displays the actual or stored waveforms
(Scope mode).
Bottom Display: Displays the menu that provides
choices available through the function keys and shows
which are active.
1-9
Reading a Window Display
When you change a setup, a part of the Main display area
is used for a window. It displays choices accessed with the
related function key from which you make a selection by
pressing
(SELECT ITEM). The waveform area is
compressed to about 50% (amplitude) size, and the
window replaces the bottom half of the Main display.
1 - 10
92B/96B/99B/105B
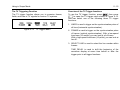
USING THE KEYS
Users Manual
The keys with a predefined function, regardless of the test
tool's mode, are called keys or hard keys. Usally they give
access to a menu, where items can be selected.
The two yellow keys
and
ways to find your measurement.
provide the possible
gives immediate access to a list of measurements.
When you choose a measurement, the test tool automatically selects the related main mode.
gives access to the Main menu. Here you can
choose from the five main modes:
,
, , ,
and
. Pressing
gives you more control over
the selected main mode.
Figure 1-5. The Keypad
Introducing The ScopeMeter Test Tool
1 - 11
Figure 1-6 shows the basic navigation of the test tool.
Yellow
Yellow
Dark grey
Hard key
Dark grey
SubMenu Structure
Most common Functions
also found under
Figure 1-6. Basic Navigation
,
,
,
The five blue keys
, and
are
called function keys. These keys change function based on
the present active menu. Actual function key definitions
appear on the bottom display. Function keys and windows
work together to provide a complete menu-driven user
interface.
is the MORE function key, which opens the window
assigned to the key.
When you press the Submenu key for any main function,
the
,
,
, and
keys allow immediate
access to the more common functions that are also under
the
(MORE function key).
keys are used to choose an item in a box,
The
or directly from the window. These keys are indicated by
two arrows.
1 - 12
92B/96B/99B/105B
STEPPING THROUGH A WINDOW
The fixed sequence is as follows:
When a window appears, the assignments to the function
keys change as follows:
is the 'CLOSE' key, which closes the active window.
is the 'CANCEL' key, which ignores changed
selections and closes the active window.
is the 'SELECT ITEM' key, which opens and closes a
list box and selects the highlighted item.
1.
Stepping through a window has a fixed sequence as
shown in Figure 1-7.
3.
Users Manual
Press a MORE function key. This opens a
window.
(Press
(NEXT PAGE) or
(PREVIOUS PAGE) to
choose an item on page 2 or page 3.)
2.
4.
5.
or
Choose the item that has to be changed.
Open the list box.
or
Choose the new parameter.
This selects the new parameter and closes the
list box.
Repeat steps 2 through 5 for more items.
6.
Figure 1-7. Sequence to Go Through a Window
Close the window and continue measurements.
Introducing The ScopeMeter Test Tool
1 - 13
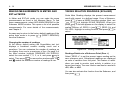
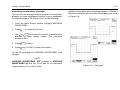
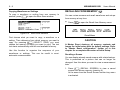
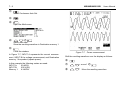
USING ON-LINE INFORMATION
You can get information about functions at any time by
pressing
. The short descriptions will help you understand how the test tool functions.
When you operate the ScopeMeter test tool, the display
provides information about the present condition or
explains procedures taking place and asks for confirmation.
These messages are always displayed in a box.
More information is available by pressing
. This
displays one or more pages of extended on-line information.
More information is available under the following conditions:
-
In a menu (F1 to F5) you always can get information on
the functions for every function key.
-
In a window you can get more information about the
highlighted function when the
icon is displayed.
-
In a message you can get more information about the
conflict with the present setup when the
icon is displayed. If necessary, the test tool asks for confirmation
and disables the conflicting situation.
Figure 1-8 hows an example of a "function info" screen.
You can set the information level for on-line information to
high or low. This is explained in Chapter 6.
Figure 1-8. Using On-Line Information
•
When you have read the displayed information, press
to exit the information mode.
This returns the test tool to the latest setup before you
pressed
, and you can continue your measurement.
1 - 14
92B/96B/99B/105B
Users Manual
Chapter 2
Getting Started
ADJUSTING THE DISPLAY . . . . . . . . . . . . . . . . . . . .
Adjusting the Contrast . . . . . . . . . . . . . . . . . . . . . .
Using the Backlight . . . . . . . . . . . . . . . . . . . . . . . .
SELECTING THE PROBE TYPE . . . . . . . . . . . . . . . .
2-3
2-3
2-3
2-4
POWER-ON CONFIGURATIONS . . . . . . . . . . . . . . .
Master Reset (Default Startup) . . . . . . . . . . . . . . .
Power-on/save memory . . . . . . . . . . . . . . . . . . . .
PERFORMING AN EASY SETUP . . . . . . . . . . . . . . .
2-4
2-4
2-5
2-5
2-2
92B/96B/99B/105B
This chapter provides a 15-minute demonstration intended
for those who are not familiar with the ScopeMeter test
tool. It gives some hands-on experience, with an emphasis
on learning by seeing and doing. Those who are familiar
with the test tool can skip the following pages and continue
to Chapter 3.
•
Press
to turn on the test tool.
Operation begins in the last-known configuration. Factory
default settings are used at the first power-on. Subsequent
power-ons maintain configuration changes made with
keystrokes or through recall of a setup memory during the
previous session.
Users Manual
Getting Started
2-3
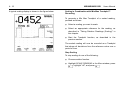
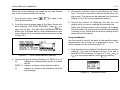
ADJUSTING THE DISPLAY
Using the Backlight
Adjusting the Contrast
You can set the backlight to high or low intensity. At poweron, the backlight is set to high intensity.
High intensity becomes extra high when the test tool is
connected to the line power.
•
Use
to adjust the contrast of the display to
your preference. Note that new contrast adjustment of
the display is stored in memory until a new adjustment
is made.
To set the backlight intensity, do the following:
1. Press
to set the backlight to low intensity.
If you do not set the backlight to low intensity within 5
minutes after power-on, when the testool is battery
powered, the backlight automatically switches to low
intensity to save battery power.
If you want to work with a bright display, do the
following:
Figure 2-1. Contrast adjustment
Contrast adjustment can also be made after you have
pressed
, and you have highlighted the contrast with
, and pressed
to select.
is then
visible in the right bottom of the display.
2. Press
to set the backlight to high intensity.
The actual power source, BATTERIES or POWER
ADAPTER, appears for a moment on the display.
The backlight will now remain at high intensity until you
set it to low intensity.
NOTE
Using the backlight at low intensity lengthens battery life.
2-4
92B/96B/99B/105B
Users Manual
SELECTING THE PROBE TYPE
POWER-ON CONFIGURATIONS
To prevent measurement errors, ensure that your test tool
is adapted to your probe at power-on. Note that the
PM8918 probes, delivered with the test tool, have an
attenuation of 10:1.
There are two different ways to reset the ScopeMeter test
tool: the Master Reset, and the power-on/save memory.
For accurate measurement, periodic probe calibrations are
necessary. This is explained in Chapter 8, "User Maintenance".
WARNING
To prevent electric shock and personal injury, Mini Test
Hooks and HF Adapters must not be connected to any
voltage higher than 42V peak (30V rms) to earth.
Always pay attention to the markings on the
accessories.
Master Reset (Default Startup)
CAUTION
A Master Reset clears everything saved in memory.
Never perform a Master Reset unless you are prepared
to lose everything you saved in memory.
1. Turn the ScopeMeter test tool off.
2. Press and hold
.
3. Press and release
.
The test tool turns on, and you should hear a double
beep, indicating the Master Reset was successful. The
screen should display input: A PROBE 10:1 on top of
the waveform area.
4. Release
.
Perform a Master Reset only to make sure that your test
tool is in the initial settings condition. Master Reset sets the
test tool for using 10:1 probes.
See Chapter 6 for more information about Master Reset
conditions.
Getting Started
2-5
Power-on/save memory
This procedure also resets the ScopeMeter test tool and
sets the probe range to 10:1. The Reset does not clear the
memories.
1. Turn the test tool off.
2. Press and hold
.
3. Press and release
.
The test tool turns on, and you should hear a double
beep. input: A PROBE 10:1 appears on the display.
4. Release
.
Use this feature when you have saved a setup, screen, or
waveforn in memory.
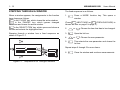
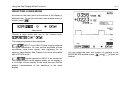
PERFORMING AN EASY SETUP
For quick operation, the test tool is equipped with a
Continuous Auto Set function. This function optimizes the
range and the time in all modes and assures a stable
picture on nearly all waveforms. You only need to press
to activate. Once activated this function permits
hands-off probing.
You can redefine the Continuous Auto Set configuration to
your own preference. Refer to Chapter 6 for more information.
2-6
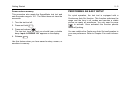
1.
92B/96B/99B/105B
+
Users Manual
Perform a Reset at Power ON.
At power-on, all five function key definitions in the bottom display are assigned to the Main
menu. Notice that METER is highlighted.
Ensure the probe range is 10:1, as indicated on the display.
The screen displays a True-rms AC voltage and a DC voltage in large numbers, and the
frequency (in Hz) in smaller numbers. An additional scope trace gives a graphical
representation of the waveform.
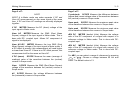
2.
Open the Measure menu; the five function keys now are assigned to: MORE MEASURE, V,
Hz, dB, or TIME.
Continued on next page
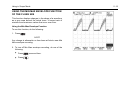
QUICK MEASUREMENTS DEMONSTRATION
Getting Started
2-7
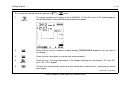
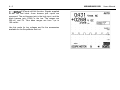
3.
4.
Open the VOLT measurement menu; a list of the voltage measurements appears on the
display
+
Use these keys to choose a measurement. For now, highlight Vrms AC+DC.
5.
Press this function key to select Vrms AC+DC. The selected Vrms AC+DC reading appears
as the main top reading on the display. The previous readings are now shifted down one.
Note that the Hz has been removed.
6.
Open the TIME measurement menu; a list of the time-related measurements appears on the
display.
7.
+
Choose another measurement. For now, highlight rise time. 92B
Continued on next page
QUICK MEASUREMENTS DEMONSTRATION
2-8
92B/96B/99B/105B
Users Manual
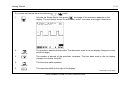
8.
Some measurements are done in another mode. This message appears in a double-lined
box on the display: "This measurement is possible in SCOPE mode. Change to SCOPE
mode now ?".
9.
The test tool changes automatically to the Scope mode. You can now find the Rise Time
measurement result below the waveform area.
10.
The left and right cursors move across the display. The intersection of waveform and cursor
mark the level for the two horizontal cursors.
This completes the Quick Measurements Demonstration; continue with the Meter Operations.
QUICK MEASUREMENTS DEMONSTRATION
Getting Started
2-9
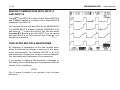
If you have not already done so, perform a
1.
Input A
+
reset.
The range increases and ranging is set to MANUAL. A Vrms AC and a V DC reading appear,
and the amplitude of the graphical representation decreases.
2.
Press this key once to measure a stable display. TOUCH HOLD appears in the top right of
the display.
3.
Press this key once again to resume new measurements.
4.
Press this key. The range decreases. If the voltage readings are overloaded, "OL Vrms AC"
and "+OL V DC" appear.
Input A
5.
The test tool automatically assumes a new setup that is optimized for measuring the actual
input signal.
Continued on next page
PERFORMING SOME METER OPERATIONS
2 - 10
92B/96B/99B/105B
Users Manual
6.
Open the Meter-submenu mode. The five function keys are now assigned to the metersubmenu identifiers.
7.
Open the More Meter window. The window enables you to change several settings in Meter
mode.
8.
Go to the next page and find more settings that you can change.
9.
Close the window again, without changing the setup configuration of the test tool.
This completes the Meter Operations demo; continue with the Scope Operations.
PERFORMING SOME METER OPERATIONS
Getting Started
2 - 11
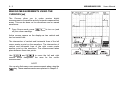
If you have not already done so perform a
+
reset.
1.
Activate the Scope Mode, then press
. An image of the waveform appears on the
display. The top display shows the attenuator, probe, time base, and trigger information.
2.
The waveform amplitude decreases. The attenuator scale in the top display changes to a less
sensitive range.
Input A
3.
The number of periods of the waveform increases. The time base scale in the top display
changes to a slower time/DIV.
4.
The waveform shifts upwards.
Input A
5.
The waveform shifts to the right of the display.
Continued on next page
PERFORMING SOME SCOPE OPERATIONS
2 - 12
92B/96B/99B/105B
Users Manual
6.
The test tool automatically selects attenuation, time base, and triggering to give you a
readable display of the waveform.
7.
Press this to look at the Trigger menu now.
8.
This begins to display as the waveform rises above the trigger level (+SLOPE) or falls below
the trigger level (-SLOPE). Watch the display; the waveform starts at a different place as
trigger + or - is selected. Continue with +SLOPE selected.
9.
This activates the ADJUST LEVEL function. The level value is displayed in the right bottom,
and is visualized by the " a " icon on the left edge of the display. Ensure also that RUN is
displayed in the top right of the display as an indication that your test tool is triggered.
Continued on next page
PERFORMING SOME SCOPE OPERATIONS
Getting Started
2 - 13
10.
Adjust the trigger level: the " a " icon moves upward as you change the trigger level. When
the level is more than the waveform value, RUN changes into NOTRIG, and the display
becomes unstable; your test tool is no longer triggered.
11.
Adjust the trigger level to about 50% of the waveform amplitude, so that your test tool is
triggered again.
12.
Turn your ScopeMeter test tool off.
You are now able to operate basic functions in routine applications. Continue with Chapters 3 and 4 for a more detailed
discussion of the ScopeMeter test tool functions.
PERFORMING SOME SCOPE OPERATIONS
2 - 14
92B/96B/99B/105B
Users Manual
Chapter 3
Making Measurements
MAKING CONNECTIONS . . . . . . . . . . . . . . . . . . . . . . 3-2
USING THE MEASUREMENT FUNCTIONS . . . . . . . 3-3
USING A SHORTCUT TO MOST
COMMONLY MEASUREMENTS . . . . . . . . . . . . . . . . 3-9
ORDERING MEASUREMENT READINGS . . . . . . . 3-10
MEASURING FUNCTIONS NOT
AVAILABLE FROM THE MEASURE MENU . . . . . .
Additional measurements for Meter
and EXT.mV modes . . . . . . . . . . . . . . . . . . . . . .
Additional measurements for the Scope mode . .
MEASUREMENTS MAP . . . . . . . . . . . . . . . . . . . . .
3-10
3-10
3-11
3-12
3-2
92B/96B/99B/105B
Users Manual
MAKING CONNECTIONS
ScopeMeter test tool measurement connections are
illustrated in Figure 3-1.
Use the red INPUT A BNC jack or the red and black 4 mm
banana jacks for measurements. The ScopeMeter test tool
informs you when to use INPUT A or the banana jacks.
The red 4-mm banana jack is used for diode test, continuity
test, Ohm measurement, and when you use a Current or
Temperature probe with banana jacks.
When you use the PM8918 probe, select the 10:1 probe
type for correct decimal readout.
WARNING
To prevent electric shock and personal injury, Mini Test
Hooks and HF Adapters must not be connected to any
voltage higher than 42V peak (30V rms) to earth.
Always pay attention to the markings on the
accessories.
Figure 3-1. Measurement Connections
Making Measurements
3-3
USING THE MEASUREMENT FUNCTIONS
Use the Measure menu to choose one or more automatic
measurements. Simply choose your desired measurement
and the test tool sets itself up and displays the result.
•
Regardless of the mode you are in, press
access the Measure menu.
to
Measure Menu
Press
(MORE MEASURE) to access a multipaged
(seven pages) list of all possible measurements. Press
(PREVIOUS PAGE) and
(NEXT PAGE) to step
through the pages in the More Measure window.
ATTENTION
The listed SCOPE mode measurements are not
available for the FLUKE 92B.
3-4
On a page, use
and
to highlight the desired
measurement, then press
to select. This activates
your chosen measurement and closes the window. The
measurement result is instantly displayed on the screen.
See Figure 3-2 for screen examples in Dual Display mode
and Scope mode.
92B/96B/99B/105B
Users Manual
The measurements in the More Measure window are listed
below.
Page 1 of 7:
OHM Ω Measure the resistor value (Ω) of a resistor
connected to the red and black 4-mm banana jacks.
DIODE
Test a diode that is connected to the red and
black 4-mm banana jacks. The red banana jack is the high
input while the black one is the low. The result is displayed
as the forward or reverse voltage of a diode.
CONTINUITY Ω Detect an open or closed circuit that is
connected to the red and black 4-mm banana jacks. A
beeper draws your attention when the circuit is closed.
°C PROBE EXT.mV Detect a temperature in degrees
Celsius with a Temperature probe (optional) that is
connected to the red and black 4-mm banana jacks.
°F PROBE EXT.mV Detect a temperature in degrees
Fahrenheit with a Temperature probe (optional) that is
connected to the red and black 4-mm banana jacks.
ACCESSORY (mV) EXT.mV Measure millivolts with an
accessory that is connected to the red and black 4-mm
banana jacks.
Figure 3-2. Measurement results in Dual Display mode
and Scope mode
Making Measurements
3-5
Page 2 of 7:
NOTE
INPUT A in Meter mode can make separate V DC and
Vrms AC measurements on the same signal at the same
time. V DC and Vrms AC readings are normally displayed
together.
V DC METER Measure the DC (direct) voltage of the
input signal in Meter mode.
Vrms AC METER Measure the RMS (Root Mean
Square) voltage of the input signal in Meter mode. This is
done with DC- coupled input. Allows AC component of
signal to be displayed
Vrms AC+DC METER Measure the true RMS (Root
Mean Square) voltage of the input signal in Meter mode. If
a DC-offset is present, this measurement will read higher
or lower than Vrms AC. If there is no DC offset present, this
measurement will be the same as Vrms AC.
V DC (mean) SCOPE Measure the mean (average of
readings) value of the waveform between the (vertical)
cursors in Scope mode.
Vrms SCOPE Measure the RMS (Root Mean Square)
voltage of the waveform between the (vertical) cursors in
Scope mode.
dV SCOPE Measure the voltage difference between
the (horizontal) cursors in Scope mode.
Page 3 of 7:
V peak/peak SCOPE Measure the difference between
highest and lowest voltage value of the waveform between
the (vertical) cursors in Scope mode.
Vmax peak SCOPE Measure the maximum peak value
of the waveform between the cursors in Scope mode.
Vmin peak SCOPE Measure the minimum peak value
of the waveform between the cursors in Scope mode.
dBV DC METER (decibel Volts) Measure the voltage
ratio of the DC component of a signal with respect to a
reference voltage in Meter mode. This is done with DCcoupled input.
dBV AC METER (decibel Volts) Measure the voltage
ratio of the AC component of a signal with respect to a
reference voltage in Meter mode. This is done with DCcoupled input.
For dBV, you can select a range of references by pressing
or
. Choose a voltage between 50 mV and
9.99V. The default value is 1V.
3-6
Page 4 of 7:
A DC METER Measure the DC current in Meter mode
with a Current probe (available as an option) that is
connected to the INPUT A BNC. This is done with DCcoupled input. A list box enables you to select the proper
range: 1, 10, 100 mV/A, or 1 V/A.
A AC METER Measure the AC current in Meter mode
with a Current probe (available as an option) that is
connected to the INPUT A BNC. This is done with DCcoupled input. A list box enables you to select the proper
range: 1, 10, 100 mV/A, or 1 V/A.
A AC+DC METER Measure the AC+DC current in
Meter mode with a Current probe (available as an option)
that is connected to the INPUT A BNC. This is done with
DC-coupled input. A list box enables you to select the
proper range: 1, 10, 100 mV/A, or 1 V/A.
92B/96B/99B/105B
Users Manual
A DC EXTmV Measure the DC current in EXT.mV
mode with a Current probe (available as an option) that is
connected to the red and black 4-mm banana jacks. This is
done with DC-coupled input. A list box enables you to
select the proper range: 1, 10, 100 mV/A, or 1 V/A.
A AC EXTmV Measure the AC current in EXT.mV
mode with a Current probe (available as an option) that is
connected to the red and black 4-mm banana jacks. This is
done with DC-coupled input. A list box enables you to
select the proper range: 1, 10, 100 mV/A, or 1 V/A.
A AC+DC EXTmV Measure the AC+DC current in
EXT.mV mode with a Current probe (available as an option)
that is connected to the red and black 4-mm banana jacks.
This is done with DC-coupled input. A list box enables you
to select the proper range: 1, 10, 100 mV/A, or 1 V/A.
Making Measurements
Page 5 of 7:
Hz METER Measure the frequency of the input signal in
Meter mode.
Hz SCOPE Measure the frequency of the waveform in
Scope mode. At least 11/2 cycles of this waveform must
occur between the cursors.
duty cycle + METER Measure the ratio between the
time the signal is positive to the total period time in Meter
mode. It is shown as a percentage figure.
duty cycle - METER Measure the ratio between the
time the signal is negative to the total period time in Meter
mode. It is shown as a percentage figure.
pulse width + METER Measure the duration of the
average positive pulse of the waveform in Meter mode.
3-7
dBm AC METER (decibel milliwatt) Measure the power
ratio of the AC component of a signal with respect to 1 mW
in Meter mode. This is done with DC-coupled input. You
can choose 50, 60, 75, 93, 110, 125, 135, 150, 250, 300,
500, 600, 800, 900, 1000, or 1200Ω as reference
impedance.
dBW DC METER (decibel Watt) Measure the power
ratio of the DC component of a signal with respect to 1W in
Meter mode. This is done with DC-coupled input. You can
choose 1, 2, 4, 8, 16, or 50Ω as reference impedance.
dBW AC METER (decibel Watt) Measure the power
ratio of the AC component of a signal with respect to 1W in
Meter mode. This is done with DC-coupled input. You can
choose 1, 2, 4, 8, 16, or 50Ω as reference impedance.
pulse width - METER Measure the duration of the
average negative pulse of the waveform in Meter mode.
WATT DC METER Measure the DC audio watts from
the signal in Meter mode. This is done with DC-coupled
input. You can choose 1, 2, 4, 8, 16, or 50Ω as reference
impedance.
Page 6 of 7:
dBm DC METER (decibel milliwatt) Measure the power
ratio of the DC component of a signal with respect to 1 mW
in Meter mode. This is done with DC-coupled input.
WATT AC METER Measure the AC audio watts from
the signal in Meter mode. This is done with DC-coupled
input. You can choose 1, 2, 4, 8, 16, or 50Ω as reference
impedance.
You can choose 50, 60, 75, 93, 110, 125, 135, 150, 250,
300, 500, 600, 800, 900, 1000, or 1200Ω as reference
impedance.
For dBm , dBW, and WATT, you can select a range of
references by pressing
or
.
3-8
92B/96B/99B/105B
Users Manual
Page 7 of 7:
RPM 1 METER (revolutions per minute) Measure one
count per revolution in Meter mode.
RPM 2 METER (revolutions per minute) Measure one
count per two revolutions in Meter mode.
dt (delta time) SCOPE Measure the time difference
between the (vertical) cursors in Scope mode.
1/dt
(frequency) SCOPE Measure
the
relative
frequency of the waveform in Scope mode. It is shown as
the reciprocal value of the time difference (dt) between the
vertical cursors.
rise time SCOPE Measure the rise time between 10%
and 90% points of the first rising slope of the waveform in
Scope mode. First use
and
to determine the
0% and 100% points of the waveform. These are the
intersection of the cursors with the waveform. Set the rising
slope to at least four time divisions for a precise
measurement. The rise time is now instantly displayed.
Figure 3-3. Rise Time Measurement
Making Measurements
3-9
USING A SHORTCUT TO MOST COMMONLY
MEASUREMENTS
•
From the Measure menu, you can also find many most
commonly used measurements directly under one of the
function keys
,
,
, or
. Press one of
the four function keys to choose the type of measurement:
V, Hz, dB, or TIME. This opens a single window with a list
of measurements within the chosen type.
•
Press
(V)
measurements:
to
open
a
list
with
voltage
Volt List Box
•
Press
(Hz) to open a list with frequency
measurements:
Frequency List Box
Press
(dB)
measurements:
to
open
a
list
with
power
dB List Box
•
Press
(TIME) to open a list with time
measurements:
TIME List Box
CANCEL ignores the TIME window selection and returns
to the Measure menu again.
3 - 10
ORDERING MEASUREMENT READINGS
At default, three measurement readings are displayed at
the same time, although you can display up to four
readings. See Chapters 4 and 6 for more information.
When you exceed the number of selected readings, all
readings shift down one and your latest chosen
measurement is placed on top. Notice that the previous
bottom reading is then removed.
92B/96B/99B/105B
Users Manual
MEASURING FUNCTIONS NOT AVAILABLE
FROM THE MEASURE MENU
There are also a few more measurements that you can
only find in the Scope, Meter or EXT.mV modes. These are
listed below.
Chapter 4 describes how to select the Meter and EXT.mV
mode measurements, and Chapter 5 the Scope mode
measurements.
Additional measurements for Meter and EXT.mV modes
Vrms AC (no DC)
Measure the RMS (Root Mean
Square) voltage of the input signal in Meter mode. This is
done with AC-coupled input so that the DC signal
component is blocked and the range is optimized for the
AC signal component. The V DC reading is inhibited due to
AC coupling. In some cases this measurement gives one
more digit of resolution over Vrms AC (DC coupled).
dBV AC+DC (decibel Volts) Measure the voltage ratio of
the AC and DC components of a signal with respect to a
reference voltage in Meter mode. This is done with DCcoupled input.
dBV AC (no DC) (decibel Volts) Measure the voltage
ratio of the AC component of a signal with respect to a
reference voltage in Meter mode. This is done with ACcoupled input so that the DC signal component is blocked
and the range is optimized for the AC sinal component.
Making Measurements
dBm AC (decibel milliwatt) Measure the power ratio of
the AC component of a signal with respect to 1 mW in
Meter mode. This is done with DC-coupled input.
dBm AC (no DC) (decibel milliwatt) Measure the power
ratio of the AC and DC components of a signal with respect
to 1 mW in Meter mode. This is done with AC-coupled
input so that the DC signal component is blocked and the
range is optimized for the AC sinal component.
dBW AC+DC (decibel Watt) Measure the power ratio of
the AC and DC components of a signal with respect to 1W
in Meter mode. This is done with DC-coupled input.
dBW AC (no DC) (decibel Watt) Measure the power ratio
of the AC component of a signal with respect to 1W in
Meter mode. This is done with AC-coupled input so that the
DC signal component is blocked and the range is
optimized for the AC sinal component.
WATT AC+DC Measure the AC and DC audio watts from
the signal in Meter mode. This is done with DC-coupled
input. You can choose 1, 2, 4, 8, 16, or 50Ω as reference
impedance.
WATT AC (no DC) Measure the AC audio watts from the
signal in Meter mode. This is done with AC-coupled input
so that the DC signal component is blocked and the range
is optimized for the AC sinal component. You can choose
1, 2, 4, 8, 16, or 50Ω as reference impedance.
3 - 11
For dBV, dBm and dBW, you can select a range of
references by pressing
or
.
dBV: Choose a voltage between 50 mV and 9.99V. The
default value is 1V.
dBm: Choose one of the following reference impedances:
50, 60, 75, 93, 110, 125, 135, 150, 250, 300, 500, 600, 800,
900, 1000, or 1200Ω.
dBW: Choose one of the following references: 1, 2, 4, 8,
16, or 50Ω.
Additional measurements for the Scope mode
t1 from TRIG Measure the time difference between the
trigger occurrence and the left cursor.
t2 from TRIG Measure the time difference between the
trigger occurrence and the right cursor.
V1 Measure the voltage amplitude where the left cursor
crosses the waveform.
V2 Measure the voltage amplitude where the right cursor
crosses the waveform.
phase Measure the phase shift between two waveforms. A
maximum of three phase shift measurements between the
reference waveform and three other waveforms are possible.
3 - 12
92B/96B/99B/105B
Users Manual
MEASUREMENTS MAP
The measurements can be selected in various menus. The following Measurements map shows where you can find all
measurements.
MAIN MENU
MEASURE
MENU
Voltage Measurements
V DC
Vrms AC
Vrms AC+DC
Vrms AC (No DC)
V DC (mean)
Vrms
dV
Vpeak/peak
V max peak
V min peak
V1
V2
ACCESSORY (mV)
Frequency Measurements
Hz (frequency)
duty cycle
RPM 1
RPM 2
•
•
•
•
•
•
•
•
•
•
•
•
•
•
•
•
•
•
•
•
•
•
•
•
•
•
•
•
•
•
•
•
•
•
•
•
•
•
•
Making Measurements
3 - 13
MAIN MENU
MEASURE
MENU
Power Measurements
dBV DC
dBV AC
dBV AC+DC
dBV AC (no DC)
dBm DC
dBm AC
dBm AC+DC
dBm AC (no DC)
dBW DC
dBW AC
dBW AC+DC
dBW AC (no DC)
WATT DC
WATT AC
WATT AC+DC
WATT AC (no DC)
Time Measurements
pulse width
dt
1/dt
rise time
t1 from TRIG
t2 from TRIG
phase
•
•
•
•
•
•
•
•
•
•
•
•
•
•
•
•
•
•
•
•
•
•
•
•
•
•
•
•
•
•
•
•
•
•
•
•
•
•
•
•
•
•
•
•
•
•
•
•
3 - 14
92B/96B/99B/105B
Users Manual
MAIN MENU
MEASURE
MENU
Ampere Measurements
A DC
A AC
A AC+DC
A AC (no DC)
Temperature Measurements
°C
°F
Resistance Measurements
Ohm
Continuity
Diode Measurements
Diode
•
•
•
•
•
•
•
•
•
•
•
•
•
•
•
•
•
•
Chapter 4
Using the Dual Display Mode Functions
MAKING CONNECTIONS . . . . . . . . . . . . . . . . . . . . . . 4-2
SELECTING A MAIN MODE . . . . . . . . . . . . . . . . . . . . 4-3
SELECTING RANGES
(MANUAL/AUTO RANGE) . . . . . . . . . . . . . . . . . . . . . 4-7
HOLDING A STABLE MEASUREMENT
(TOUCH HOLD) . . . . . . . . . . . . . . . . . . . . . . . . . . . . 4-8
DISPLAYING MINIMUM MAXIMUM
READINGS WITH RELATED TRENDPLOT . . . . . . . . 4-9
Generating a Min Max TrendPlot
with the Fluke 92B . . . . . . . . . . . . . . . . . . . . . . . . 4-10
Generating a Min Max TrendPlot
with the Fluke 96B, 99B, or 105B . . . . . . . . . . . . . 4-10
Using 'Time from start' or 'Time of day' stamps
with the Fluke 96B, 99B, or 105B . . . . . . . . . . . . . 4-11
Looking at the Graphical Plot (TrendPlot™) . . . . 4-11
Stopping Recording, Freezing the Display,
and Examining the Results . . . . . . . . . . . . . . . . . 4-12
Examining a Record from Memory
with the Fluke 96B, 99B, or 105B . . . . . . . . . . . . . 4-12
SELECTING THE SCOPEMETER KEY
SUBMENU . . . . . . . . . . . . . . . . . . . . . . . . . . . . . . . .
Enabling and Disabling the
Change Alert™ Function . . . . . . . . . . . . . . . . . . .
Changing the Refresh Rate of the Display . . . . .
MAKING MEASUREMENTS IN
METER AND EXT.mV MODE . . . . . . . . . . . . . . . . .
Changing the number of readings . . . . . . . . . . . .
TAKING RELATIVE READINGS (SCALING) . . . . .
Readings Relative to a
Reference Point (Zero ∆) . . . . . . . . . . . . . . . . . .
Readings as a Percent Change from
Reference Point (Zero %∆) . . . . . . . . . . . . . . . . .
Readings Displayed as a
Percent of Scale (0%-100%) . . . . . . . . . . . . . . . .
Scaling in Combination with
Min Max Trendplot™ Recording . . . . . . . . . . . . .
Stop Scaling . . . . . . . . . . . . . . . . . . . . . . . . . . . .
4-13
4-13
4-13
4-14
4-14
4-14
4-14
4-15
4-15
4-16
4-16
4-2
92B/96B/99B/105B
Users Manual
MAKING CONNECTIONS
ScopeMeter test tool measurement connections are illustrated in Figure 4-1.
Scope only
Use the red INPUT A BNC jack for Scope and Meter
modes. Use the grey INPUT B BNC jack as a second input
for Scope measurements. The red and black 4-mm banana
jacks are used for , , and
modes.
For low frequency measurements (up to about 2 MHz),
ground can be connected to the black 4-mm banana jack.
For higher frequencies you must use the HF Adapter or
Mini Testhook on the probe.
When you use the PM8918 probe, select the 10:1 probe
type for correct decimal readout.
WARNING
To prevent electric shock and personal injury, Mini Test
Hooks and HF Adapters must not be connected to any
voltage higher than 42V peak (30V rms) to earth.
Always pay attention to the markings on the
accessories.
Figure 4-1. Measurement Connections
Using the Dual Display Mode Functions
4-3
SELECTING A MAIN MODE
At power-on, the main menu at the bottom of the display is
always shown. To get the main menu from another menu or
screen, press
.
Main menu
Choose a main mode with any of the function keys:
,
, , , or
.
The measuring result is then displayed.
INPUT A and INPUT B are used to measure
the signal waveforms. You can set the amplitude of both
waveforms, time base speed, and triggering for an
optimum trace display. See Chapter 5 for more information
about SCOPE mode.
Signals supplied to INPUT A are measured.
Two measurement results appear initially on the display in
a 3 2/3-digit numeric display. At the same time you find the
graphic representation of the waveform in the lower
display.
You can select the type and number of readings in the
MORE METER window; press
and
to open the
window.
4-4
92B/96B/99B/105B
If necessary, you can select the range of both the scope
trace and meter display, and the time base speed.
•
Press
to select the desired attenuation.
Ranges are from 1V to 3 kV (Vrms: 2.5 kV) with 10:1
probe, or from 100 mV to 300V (Vrms: 250V) with direct
1:1 input.
•
Press
to select the desired time base; ranges
are from 1 µs to 100 ms/div.
Resistance mode. A resistor connected to the red
and black 4-mm banana jack inputs is measured. The red
banana jack is the high input, and the black banana jack
(COM) is the low. The time base is fixed at 5 ms/DIV.
NOTE
In the diode and resistance modes, the black COMmon
banana jack is not connected internally to the common of
BNC INPUTS A and B.
Users Manual
Using the Dual Display Mode Functions
The measurement result is displayed as a 3 2/3-digit
display. The ranges are 30Ω (manual only), 300Ω, 3 kΩ,
30 kΩ, 300 kΩ, 3 MΩ, and 30 MΩ. A beeper alert is
generated at <5% of a selected range in Manual Range
mode. The beeper alert is turned on with ALERT ))).
Diode test mode. A diode connected to the red
and black 4-mm banana jack inputs is tested. The
measurement current through the diode is 0.5 mA. The red
banana jack is the high input, and the black banana jack
(COM) is the low.
The result is displayed as the forward or reverse voltage of
the diode. A beeper alert is generated at forward voltage.
The beeper alert is turned on with ALERT ))).
The time base is fixed at 5 ms/DIV and the attenuator at
3V.
NOTE
In the diode and resistance modes, the black COMmon
banana jack is not connected internally to the common of
BNC INPUTS A and B.
4-5
4-6
EXTernal milliVolt function. Signals supplied
to the red and black 4-mm banana jack inputs are
measured. The red banana jack is the high input, and the
black banana jack (COM) is the low. The ranges are
300 mV, and 3V. Time base ranges are from 1 µs to
100 ms/div.
Use this mode for low voltages and for the accessories
available for the ScopeMeter test tool.
92B/96B/99B/105B
Users Manual
Using the Dual Display Mode Functions
SELECTING RANGES
(MANUAL/AUTO RANGE)
In manual range, the input attenuator range can be
changed by pressing the INPUT A
key or
, when these are assigned to
. If in auto
range, this switches automatically to manual range, and
MANUAL appears in the top right of the display. The
selected attenuator and time base ranges are shown on
the display.
The desired time base range can be selected by pressing
.
Auto ranging (automatic setting of the attenuator and time
base) is selected when you press
.
4-7
4-8
92B/96B/99B/105B
Users Manual
HOLDING A STABLE MEASUREMENT
(TOUCH HOLD)
The Touch Hold function captures the next stable
measurement and a beep indicates that a stable
measurement has been made. When the Touch Hold
function is turned on, the numeric display is frozen (held)
until a stable measurement is detected. Stable
measurements are defined as:
•
•
•
•
Within +/-100 display counts for 1s.
Above 200 display counts for dc signals.
Above 300 display counts for ac signals.
Below overload (OL) in Ω and diode test.
TOUCH HOLD appears in the top right of the display when
the function is active.
NOTE
The Touch Hold function is not available in Min Max.
Figure 4-2. The Touch Hold function
The following procedure can be used for Touch Hold:
1. Press
and measure the signal.
2. Wait until the ScopeMeter test tool produces a beeper
signal to indicate a stable signal.
3. Remove the measuring leads and read the result from
the display.
4. Measure a new signal, wait for the beeper, remove the
leads, and read again.
5. Press
to return to normal measurement mode.
Using the Dual Display Mode Functions
4-9
DISPLAYING MINIMUM MAXIMUM
READINGS WITH RELATED TRENDPLOT
The MIN MAX recording function is used to display several
characteristics of the present main reading over time in the
form of readings and a graphical plot (Min Max
TrendPlot™). Five readings appear on the display (see the
display example in Figure 4-3).
The top reading (in large characters) indicates the actual
main reading. This is the same main reading as before
MIN/MAX recording was started.
The other readings (in smaller characters) are the recorded
readings with 'Time from start' or 'Time of day' stamps, as
follows:
•
•
•
•
MAX indicates the maximum reading during the
recording.
AVG indicates the average reading during recording.
The AVG time stamp updates continuously.
MIN indicates the minimum reading during recording.
MAX-MIN indicates the difference between MAX and
MIN. The Max and Min time stamps update only when
new high or low readings are encountered.
Figure 4-3. Min Max TrendPlot Example
NOTE
A beep occurs when a new MAX or MIN reading is
displayed.
4 - 10
92B/96B/99B/105B
Generating a Min Max TrendPlot with the Fluke 92B
With the Fluke 92B, you can generate a Min Max TrendPlot
of the present main reading, as follows:
1. Press
•
•
Recording is now in progress.
3. Press
to stop recording. The display freezes to
allow you to examine the results. Notice that you can
use
and
to change the time stamp
preference selected under step 2.
to exit TrendPlot.
5. A message appears asking you to make the following
choice:
To exit TrendPlot and to return to the function that
was active before you entered the Min Max
(YES).
TrendPlot function, press
To stay in TrendPlot and keep the present record on
the display, press
(NO).
•
•
Generating a Min Max TrendPlot with the Fluke 96B,
99B, or 105B
With the Fluke 96B, 99B, or 105B, you can generate a Min
Max TrendPlot of the present main reading, as follows:
.
2. A message appears on the display to make the
following choice for the time stamp:
To select time stamps that indicate the internal clock
time and date, press
To select time stamps that indicate the time relative
to the start of recording, press
.
4. Press
Users Manual
1. Press
to open the Min Max TrendPlot menu.
2. Press
(START).
3. If there is still data in memory from the previous
recording, a message appears asking you to make the
following choice:
To start recording, press
(YES).
To cancel Min Max recording and preserve the
record data in memory, press
(NO).
•
•
4. Press
results.
to stop recording and to examine the
5. Press
TrendPlot.
a second time to start a new Min Max
Using the Dual Display Mode Functions
Using 'Time from start' or 'Time of day' stamps with the
Fluke 96B, 99B, or 105B
You can select the recording time stamps to indicate the
time relative to the start of recording ('Time from start') or to
indicate the internal clock time and date ('Time of day').
To make this selection, do the following:
1. Press
to open the Min Max TrendPlot menu.
2. Press
menu.
(MORE) to open the MORE TRENDPLOT
3. Use
press
to highlight TIME REFERENCE; then
to select.
4. Use
press
to highlight the desired setting; then
to select.
Looking at the Graphical Plot (TrendPlot™)
The test tool continuously logs the maximum, average, and
minimum readings, and displays all values as a graph, as
shown in Figure 4-3. Vertical scaling and horizontal time
compression are automatically resized to fit the TrendPlot
on the display. The TrendPlot is slowly traced on the
display from left to right until the screen is written and the
time scale is resized. The initial time scale is 15s/DIV; after
a full screen the scale is compressed to 30s, 1 min, 2 min,
etc., to a maximum of 40 days over a whole display.
4 - 11
ATTENTION
An overload of MAX or MIN will stop the Min Max
record mode. The overloaded value (Min or Max) and
the AVG are then displayed in reverse video, and the
time stamp of the overloaded value is stopped. The
TrendPlot will continue.
4 - 12
92B/96B/99B/105B
Stopping Recording, Freezing the Display, and
Examining the Results
While recording is in progress, you can press
at any
time to stop recording. HOLD appears in the top right of the
display and the display is frozen. This allows you to
examine the results.
If you press
TrendPlot.
Users Manual
Examining a Record from Memory with the Fluke 96B,
99B, or 105B
When you generate a Min Max TrendPlot, then exit this
function, the record is automatically stored in memory.
Also, when you turn off the test tool, the last recorded Min
Max TrendPlot remains stored in memory. You can
examine this TrendPlot as follows:
again, the test tool starts a new Min Max
1. Press
to turn on the test tool.
2. Press
to open the Min Max recording menu.
3. Press
to enter the examine mode.
The display shows the last recorded Min Max
TrendPlot.
4. Press
to exit the examine mode.
Using the Dual Display Mode Functions
4 - 13
SELECTING THE SCOPEMETER KEY
SUBMENU
From any main mode, you can access the main mode submenu by pressing
for more control over the selected
mode. Figure 4-4 shows the METER mode submenu.
Figure 4-5. More Meter Mode
Figure 4-4. METER Mode Submenus
In
, , , and
modes you can choose the
functions ALERT ))), Zero ∆, FAST/SMOOTH, and RESET
READING directly with one of the function keys. Or you can
find these functions in the Submenu MORE window. For
more information about the SCOPE submenu, see
Chapter 5.
The Submenu MORE window also offers advanced
measurement adaptations, such as Scaling and Value
Result. To open the window, press
. Make your
selections and press
(CLOSE) to close the window.
Enabling and Disabling the Change Alert™ Function
Press
to enable an audible alert signal. The test tool
draws your attention with a beep when the measurement
changes more than 100 digits. In Ω mode the alert warns
you when the measurement falls to less than 5% of the
measurement range.
Changing the Refresh Rate of the Display
Select
(FAST) to speed up the refresh rate in the
measurement result display. A fast refresh rate is useful
when you are making adjustments and must see the
resulting reading as quickly as possible.
Select
(SMOOTH) to average readings over the last
measurements (8 seconds at 5 ms/div). It reduces the
influence of noise or unstable input signals.
Select
(no highlight) to get the normal readings.
4 - 14
MAKING MEASUREMENTS IN METER AND
EXT.mV MODE
In Meter and EXT.mV mode you can make the same
measurements as found in the Measure Menu. To find
these measurements, select ADD MAIN READING in the
Submenu MORE window. This opens a list of all possible
measurements. For more details of the measurements,
see Chapter 3.
92B/96B/99B/105B
Users Manual
TAKING RELATIVE READINGS (SCALING)
Scale Main Reading displays the present measurement
result with respect to a defined range. From a Submenu,
press
to open a MORE functions window. Next, use
or
to highlight SCALE READING. When you
press
, a list box appears on the display to select the
scaling function: off, ZERO ∆ (see
), ZERO %∆, and
0%-100%. Highlight a scaling function, and press
to
select.
An easy way to return to the factory default readings of the
active main mode is to press
(RESET READING)
from the Submenu.
Changing the number of readings
At the factory default setting the ScopeMeter test tool
displays a combined numeric reading result and a
waveform. You can customize the number of readings on
the display from one to a maximum of four. On page 2 of
the More window, highlight READINGS ON DISPLAY,
select the new number 1, 2, 3, or 4, and press
to
select. Then press
to remove the window again. In
and
modes the maximum number of readings is two.
Figure 4-6. Scaling Functions
Readings Relative to a Reference Point (Zero ∆)
Select "ZERO ∆" to set the present upper reading as the
zero reference point. Subsequent readings are displayed
as units of variation from this point. This feature is useful
when you need to monitor input activity in relation to a
known good value. The zero function can also be used with
dBV, dBm, or dBW.
You can also activate this function from the Submenu, and
then press
.
Using the Dual Display Mode Functions
Readings as a Percent Change from Reference Point
(Zero %∆)
Select "ZERO %∆" to set the present upper reading as the
relative reference. Subsequent readings are displayed as a
percentage of variation (delta) from this point.
The figure below shows percentage change (tolerance)
when measuring a resistor:
4 - 15
Readings Displayed as a Percent of Scale (0%-100%)
Scaling starts automatically when both 0% and 100%
values have been entered as the scaled reference values.
Use the following procedure (example for Meter mode):
1. From the SCALE READING list box, highlight 0%100% and press
.
2. Use
press
to highlight REFERENCE 100% and
.
3. Measure the value that will represent 100%.
4. Highlight NOW (as the present 100% value) and press
to save the displayed value as 100%.
5. Repeat actions 2 to 4 for the 0% value.
6. Press
(CLOSE) to activate scaling and remove
the window.
The present measurement result with respect to the
defined range with a 0% and 100% value appears now as
a scaled % readout.
4 - 16
A typical scaling display is shown in the figure below:
92B/96B/99B/105B
Users Manual
Scaling in Combination with Min Max Trendplot™
Recording
To generate a Min Max Trendplot of a scaled reading,
proceed as follows:
•
•
Select a reading you want to scale.
•
Start the Trendplot function, as described in the
previous section.
Select an appropriate reference for the reading, as
described in "Taking Relative Readings (Scaling)" in
this chapter.
The scaled reading will now be recorded as a Trendplot
that shows all deviations from the reference value over a
period of time.
Stop Scaling
To stop scaling do one of the following:
•
•
Choose another function.
Highlight SCALE READING in the More window, press
, highlight "off", and press
.
Using the Dual Display Mode Functions
4 - 17
Chapter 5
Using in Scope Mode
MAKING CONNECTIONS . . . . . . . . . . . . . . . . . . . . . .
MAKING AN EASY SETUP . . . . . . . . . . . . . . . . . . . .
CONTROLLING INPUTS A AND B . . . . . . . . . . . . . .
Selecting the Input . . . . . . . . . . . . . . . . . . . . . . . . .
Selecting the Input Coupling . . . . . . . . . . . . . . . . .
Capturing Glitches . . . . . . . . . . . . . . . . . . . . . . . . .
Reversing the Polarity of
the Displayed Waveform . . . . . . . . . . . . . . . . . . . .
ADJUSTING THE AMPLITUDE . . . . . . . . . . . . . . . . .
ADJUSTING THE TIME BASE . . . . . . . . . . . . . . . . . .
POSITIONING THE WAVEFORM
ON THE DISPLAY . . . . . . . . . . . . . . . . . . . . . . . . . . . .
ACQUIRING WAVEFORMS . . . . . . . . . . . . . . . . . . . .
Choosing Recurrent or Single Acquisition . . . . . . .
Roll Mode . . . . . . . . . . . . . . . . . . . . . . . . . . . . . . . .
Using "Zoom" to Increase or
Decrease Time Resolution . . . . . . . . . . . . . . . . . . .
5-3
5-4
5-4
5-4
5-4
5-5
5-5
5-5
5-6
5-7
5-8
5-8
5-8
5-9
SELECTING THE SCOPE SUBMENU . . . . . . . . . .
Capturing 10 or 20 Divisions . . . . . . . . . . . . . . . .
Smoothing the Waveform (Average) . . . . . . . . . .
TRIGGERING . . . . . . . . . . . . . . . . . . . . . . . . . . . . . .
Trigger Basics . . . . . . . . . . . . . . . . . . . . . . . . . . .
Selecting a Trigger Source . . . . . . . . . . . . . . . . .
Defining the Trace Start . . . . . . . . . . . . . . . . . . .
Selecting a Trigger Slope . . . . . . . . . . . . . . . . . .
Adjusting the Trigger Level . . . . . . . . . . . . . . . . .
Automatic Trigger Level . . . . . . . . . . . . . . . . . . .
Choosing a Trigger Delay . . . . . . . . . . . . . . . . . .
The TV Triggering Function . . . . . . . . . . . . . . . .
Overview of the TV Trigger functions . . . . . . . . .
Selecting TV System and Scan Rate . . . . . . . . .
Using the LINES Trigger Function . . . . . . . . . . .
Using the FRAME Trigger Function . . . . . . . . . .
Using the SELECT LINE Trigger Function . . . . .
Using the 4-field Sequence Function . . . . . . . . .
5-10
5-10
5-11
5-12
5-12
5-13
5-13
5-13
5-14
5-14
5-14
5-15
5-15
5-16
5-17
5-17
5-18
5-19
USING THE MIN MAX ENVELOPE
FUNCTION OF THE FLUKE 92B . . . . . . . . . . . . . . .
Using the Min Max Envelope Function . . . . . . . .
USING THE SCOPE RECORD AND
MIN MAX ENVELOPE FUNCTIONS OF
THE FLUKE 96B, 99B, or 105B . . . . . . . . . . . . . . . .
Using the ScopeRecord™ function . . . . . . . . . . .
Examining the ScopeRecord™ . . . . . . . . . . . . . .
Using the Min Max Envelope Function . . . . . . . .
5-21
5-21
5-22
5-23
5-24
5-25
MAKING COMBINATIONS WITH
INPUT A AND INPUT B . . . . . . . . . . . . . . . . . . . . . . .
DISPLAYING MULTIPLE WAVEFORMS . . . . . . . . .
ADAPTING THE DISPLAY . . . . . . . . . . . . . . . . . . . .
Selecting a Dot Size . . . . . . . . . . . . . . . . . . . . . . .
Selecting a Display Grid . . . . . . . . . . . . . . . . . . . .
Adjusting the Trace Quality . . . . . . . . . . . . . . . . . .
5-26
5-26
5-27
5-27
5-27
5-27
Using in Scope Mode
5-3
MAKING CONNECTIONS
Scope connections are illustrated in Figure 5-1.
Maximum scope inputs on either BNC are as follows:
•
•
Maximum input signal voltage: 300V rms direct
•
Voltage to ground:
Maximum input signal voltage: 600V rms when using
10:1 probe
600V rms
Input impedance is 10 MΩ/15 pF with the 10:1 probe.
•
Press
and
to select the Scope mode.
WARNING
To prevent electric shock and personal injury, Mini Test
Hooks and HF Adapters must not be connected to any
voltage higher than 42V peak (30V rms) to earth.
Always pay attention to the markings on the
accessories.
Figure 5-1. Scope Connections
92B/96B/99B/105B
5-4
MAKING AN EASY SETUP
CONTROLLING INPUTS A AND B
Continuous Auto Set automatically selects the optimum
settings for connected input signals and keeps track of any
variation of the signal. Start Continuous Auto Set by
pressing
. For most signals, the ScopeMeter test tool
will automatically set inputs, amplitudes, time base setting,
and triggering for an optimum display.
Press
or
Users Manual
to open the input settings menu.
Figure 5-2. Input A Menu
Pressing
sets the following:
•
INPUT A and/or INPUT B is switched on depending on
signal input. All other waveform displays are switched off.
•
Between two and five periods of the waveform with the
lowest frequency are displayed.
•
The attenuation per input is set so that the waveform
occupies about four vertical divisions.
•
The trigger source is chosen as the input signal with the
lowest frequency.
If no triggerable waveform is found when you press
,
approximate settings are used. If the input signal
subsequently changes, the test tool readjusts itself; you will
always have a meaningful picture on the display.
Continuous Auto Set can be configured through the
Menu. Refer to Chapter 6 for a complete description.
Selecting the Input
Press
on the appropriate input to turn it on and off.
Selecting the Input Coupling
Press
on the appropriate input to select the input
signal coupling. The selection is shown in the upper line of
the top display. AC-coupling allows for reading ac voltages
above 40 Hz only. DC-coupling allows for reading ac and
dc voltages.
The GND selection disconnects the input signal and
displays the ground or zero level as a horizontal line.
Ground provides a useful tool for setting up the display to
show a high dc level or voltage spike. For example, if you
anticipate a high positive dc level, select GND and press
to move the ground level lower on the display. A small
marker box ( ) on the right side of the display identifies the
ground level.
Using in Scope Mode
Capturing Glitches
Press
on INPUT A to turn GLITCH DETECTion on.
This function displays the events that occur between two
samples on INPUT A. INPUT B is turned off. The events
can be glitches or other asynchronous waveforms that are
40 ns (nanoseconds) or wider.
Reversing the Polarity of the Displayed Waveform
Press
to open the MORE INPUT window. Highlight
INPUT A (or INPUT B) and press
to open the list box.
You can turn on and off an input and invert the INPUT A
and INPUT B display.
Invert reverses the polarity of the displayed waveform.
This is identified by the trace identifier
on the display.
For example, a negative-going waveform would be
displayed as positive-going, providing a more meaningful
viewing perspective in some cases.
5-5
ADJUSTING THE AMPLITUDE
You can use
for INPUT A or INPUT B to adjust
input waveform attenuation. Sixteen ranges are available.
A 1:1 probe can accommodate 1 mV to a maximum of
100V per division, and a 10:1 probe can accommodate
10 mV to a maximum of 1 kV per division. The amplitude
can be changed in increments of 1, 2, and 5 (e.g., 100 mV,
200 mV, 500 mV). The upper row of the top display shows
the range and the type of probe for each input.
When a 10:1 probe is used with the 10 mV or 20 mV range,
averaging is turned on automatically. (AVG 4 appears on
the display.)
92B/96B/99B/105B
5-6
Users Manual
ADJUSTING THE TIME BASE
Press
to increase or decrease the number of
periods. The time base readout is on the second row of the
top display. Refer to Figure 5-3. Available settings depend
on the acquisition mode in effect, and are as follows:
•
•
•
Recurrent
5ns (10ns)/DIV - 1s/DIV
Single
100ns/DIV - 1s/DIV
Roll
2s/DIV - 60s/DIV
*
Fluke 92B and 96B :
Fluke 99B and 105B :
*
10ns/DIV
5ns/DIV
The time base can be changed in increments of 1, 2, and 5
(e.g., 10 ns, 20 ns, 50 ns).
Figure 5-3. Time Base and Amplitude Adjustment
Using in Scope Mode
5-7
POSITIONING THE WAVEFORM ON THE
DISPLAY
Considerable flexibility is offered in moving the trace(s)
around the display.
and
reposition the trace up or
down maximum four divisions. This operation can be done
separately for each input. The
key simultaneously
repositions all traces left or right from -4 to +16.5 divisions.
Waveform positioning is demonstrated in Figure 5-4.
Figure 5-4. Positioning the Waveform
92B/96B/99B/105B
5-8
ACQUIRING WAVEFORMS
Choosing Recurrent or Single Acquisition
You can instruct the ScopeMeter test tool to continuously
update its display, giving you a dynamic look at waveform
activity as it occurs (RECURRENT). You can also tell the
test tool to update its display only once, yielding a snapshot
record of waveform activity (SINGLE), termed "SingleShot" elsewhere in this manual.
From the Scope Submenu, press
to highlight
RECURRENT for continuous display updates. Pressing
stops and starts an acquisition. A HOLD on the top
right of the display indicates that acquisition is stopped.
The time base range is 5ns (10ns)/DIV to 1s/DIV.
Set up the ScopeMeter test tool for "Single-Shot" acquisitions with the following procedure:
1. Press
to select SINGLE (highlighted).
NO TRIG begins flashing on the display. The instrument is waiting for a trigger.
RUN appears on the display when the single acquisition is triggered. HOLD then reappears when acquisition is completed.
2. Now press
again and wait for another single
acquisition trigger.
The time base range is 100ns/DIV to 1s/DIV.
Users Manual
Roll Mode
Roll mode supplies a visual log of waveform activity and is
especially useful when measuring lower frequency
waveforms. To enter the Roll mode, press
to select
RECURRENT, then press
to select 2s/DIV, 5s/DIV,
10s/DIV, 20s/DIV, or 60s/DIV.
The waveform is now slowly traced on the display from left
to right until the full screen is written. Then the trace slowly
shifts from right to left like a pen-recorder. The Roll mode is
automatically turned off if a time base of 1s/DIV or faster is
selected.
Roll is an untriggered mode. The Capture length and
Single-Shot functions are not available. However, the
waveform can be frozen on the display by pressing
.
Using in Scope Mode
5-9
Using "Zoom" to Increase or Decrease Time Resolution
Zoom displays a waveform with increased time resolution,
giving up to 1000x magnification. Use the following
procedure to Zoom in a waveform:
1. Press
2. Use the
zoom".
and
3. Press
to select.
bottom of the display.
keys to highlight "scope
appears in the right
4. Press
to enlarge the waveform (speed up the
time base) or press
to shrink the waveform (slow
down the time base).
The ScopeMeter test tool zooms in and out one step at a
time and, if necessary, the trigger delay is recalculated.
The focal point for this activity is waveform activity at the
fourth time division. The zoom feature is useful as a quick
examination of a live waveform. Zoom cannot be used on
saved waveforms recalled from memory or when the
waveform is frozen (HOLD).
Figure 5-5. Zoom in a Waveform
92B/96B/99B/105B
5 - 10
SELECTING THE SCOPE SUBMENU
From the Scope mode, press
to open the Scope
mode submenu. This gives you more control over the
Scope mode. Figure 5-6 shows the Scope Submenu.
Figure 5-6. Scope Submenu
Refer to Chapter 6 for descriptions of the
and
(CURSOR READING) function key.
(ZERO
Capturing 10 or 20 Divisions
This enables you to capture either 10 or 20 divisions of
waveform detail.
Selecting 10 divisions, or one full screen, is sufficient for
most applications.
For fast single shots, selecting 20 divisions enables you to
capture more information, but on slow waveforms it lowers
the screen update speed by a factor of 2. Now you can use
to move the acquired waveform right and left
across the display.
∆)
The MORE Scope window gives you access to all control
over the Scope mode. In addition to the functions shown in
Figure 5-6, you will also find functions, such as Capture
Length, Average Waveforms, and Scope measurements.
To use these functions, press
to open the MORE
SCOPE window.
Figure 5-7. More Scope Window
Users Manual
Figure 5-8. Capture length
Using in Scope Mode
5 - 11
Smoothing the Waveform (Average)
The test tool can average multiple samples of a waveform,
allowing for noise suppression without loss of bandwidth.
To select average in the Scope mode, do the following:
Additional information about smoothing appears in Chapter 6.
Waveform samples with and without averaging are shown
in Figure 5-9.
1. From the More Scope window, highlight AVERAGE
WAVEFORMS.
2. Press
to open the list box.
3. Use
to choose the number of waveforms to
average for each display update. The maximum
number is 256.
4. Press
to select.
5. Press
(CLOSE) to close the window.
To turn off averaging, set AVERAGE WAVEFORMS to be
off again.
NOTE
AVERAGE WAVEFORMS: OFF changes to AVERAGE
WAVEFORMS: by 4 in the 10 mV and 20 mV attenuator
ranges when a 10:1 probe is used.
Figure 5-9. Averaging
92B/96B/99B/105B
5 - 12
Users Manual
TRIGGERING
Trigger Basics
Triggering tells the ScopeMeter test tool when to begin
displaying the waveform. You can select which input signal
should be used as the source, on which edge this should
occur, and at what waveform level it should occur. Finally,
you can tell the test tool to delay the waveform to be
displayed with a specified time delay, number of cycles, or
number of events.
The second top row on the display identifies the trigger
parameters being used. Trigger icons on the display
indicate the position of the trigger delay and the trigger
level. Refer to Figure 5-10.
For example,
20 ms/DIV TRIG:A
+120EVT -5DIV
means that INPUT A is used as the trigger source with a
positive slope. The amount of trigger delay in time divisions
is -5, and that the amount of trigger delay in events is +120.
Figure 5-10. Display with All Trigger Information
Using in Scope Mode
•
Press
5 - 13
to open the Trigger menu.
•
GENERATOR 92B 96B . See Chapter 6 for more
information.
NOTE
EXTERN and GENERATOR are mutually exclusive;
selecting one deactivates the other.
Figure 5-11. Trigger Menu
Selecting a Trigger Source
Press
to enter the MORE TRIGGER window, then
highlight TRIGGER SOURCE and press
to open the
list box. Select one of the following trigger sources:
INPUT A, INPUT B, EXTERN 2V (via external trigger
input), EXTERN 0.2V (via external trigger input), or
GENERATOR 92B 96B (via internal waveform generator).
NOTE
You can also find the trigger source selection under the
appropriate INPUT A or INPUT B More window.
•
EXTERN 2V or EXTERN 0.2V are available as trigger
source selections. You can connect an external trigger
at the red 4-mm banana jack. Make your selection for
the
appropriate
TTL-compatible
(Transistor-toTransistor Logic) trigger level (0.2V or 2V).
Defining the Trace Start
In the MORE TRIGGER menu, highlight TRACE START
and press
to open the list box.
When Wait for trigger is selected, the test tool needs a
trigger to display a waveform.
When free run is selected, and if no trigger is detected for
100 ms, the test tool provides its own trigger and the trace
still appears on the display. Use this mode for a continuous
display of a waveform.
Selecting a Trigger Slope
From the Trigger menu, press
to select triggering on
either the +SLOPE or -SLOPE of the chosen input.
92B/96B/99B/105B
5 - 14
Users Manual
Adjusting the Trigger Level
To adjust the test tool’s trigger level, do the following:
Types of trigger delays are discussed below. In many
instances, you can select more than one type of delay.
1. Select INPUT A or INPUT B as trigger source. (The
trigger levels of the other sources are fixed.)
Press
2. Press
to open the ADJUST LEVEL box. Use
and
to adjust the trigger level. Observe the
trigger icon (e.g. a ) as you adjust the trigger level.
3. Press
to enter the Time Delay list box. Use
or
to set the trigger time delay in increments of the
existing time base divisions. The range of divisions is -20 to
+640. For example, if the time base is set to 2ms/DIV, +16
defines a delay of 16 time divisions (32 milliseconds) after
the trigger is detected. Press
to accept the new
delay.
to accept the selected trigger level.
Automatic Trigger Level
To give you a stable display, the ScopeMeter test tool can
find the best trigger level automatically. To activate this
feature, press
to open the ADJUST LEVEL box; then
press
a second time to select AUTO LEVEL. Press
to accept the selection.
The trigger level will now be set and continuously adjusted
to the optimal level, even when the signal changes.
Choosing a Trigger Delay
You can also begin to display the waveform at some time
before or after the trigger point is detected. This is
identified by the delay icon "T" on the top of the display.
From the second page of the MORE TRIGGER window,
select RESET DELAY to reset all the selected trigger
delays to their initial values (TIME DELAY : -2, TRIGGER
SPECIAL DELAY: OFF).
From the second page of the MORE TRIGGER window,
select TRIGGER SPECIAL DELAY (off, Events, or
N-Cycle).
N-CYCLE
The trigger waveform is divided by the
number of cycles "N" to create a stable picture for
waveforms with a cyclic character. (N-CYCLE can be used
only on INPUT A.) Use
or
to select the number
of cycles. A total of +2 to +255 cycles can be selected.
EVENTS
Triggering via the external input is delayed
for a number of events that occur on INPUT A. Use
or
to select the number of events (+1 to +1023).
External trigger starts the delay, and after the number of
events on INPUT A is equal to the selected number, the
test tool acquires the INPUT A signal.
Using in Scope Mode
The TV Triggering Function
The TV trigger function allows you to examine frames,
fields, and lines of TV signals for various TV systems.
5 - 15
Overview of the TV Trigger functions
To use the TV trigger function, press
; then press
to open the TV trigger menu shown in Figure 5-12.
You can select one of the following three TV trigger
functions:
1. LINES is used to trigger on the synchronization pulse of
all lines (horizontal synchronization).
Figure 5-12. TV Trigger Menu
2. FRAME is used to trigger on the synchronization pulse
of frames (vertical synchronization). With a low-speed
time base (10 ms/div) you can look at a full frame.
With a high-speed time base (10 µs/div) you can look at
line #1.
3. SELECT LINE is used to select the line number within
frames.
TIME DELAY is used to shift the beginning of the
waveform display at some time before or after the
trigger point in all trigger functions.
92B/96B/99B/105B
5 - 16
Users Manual
Selecting TV System and Scan Rate
To verify or change TV trigger settings, do the following:
Before using TV triggering, make sure that the test tool is
set for the correct TV system and scan rate.
The TV system setting is shown at the top of the display, as
shown in Figure 5-13.
1. From the TV Trigger Menu (see Figure 5-12):
Press
to display the TV trigger settings in the
MORE TRIGGER menu.
This menu lists all of the present TV trigger settings.
2. Use
then press
TV System
PAL
Video
=Positive
PAL/M
NTSC
TV Trigger
Function
LINES
FRAME
=Negative
LINE :###
SECAM
NON-INTERLACED
Figure 5-13. TV system and trigger function indicator
3. Use
press
to highlight the setting to be changed;
to select.
to highlight the desired setting; then
to select.
NOTE
If the TV trigger settings are incompatible with the TV
system under test, the test tool might not display a stable
picture or might select a wrong line number.
Using in Scope Mode
5 - 17
Using the LINES Trigger Function
With this function, all lines are displayed. The test tool
triggers on the horizontal synchronization pulse (line sync).
Using the FRAME Trigger Function
With this function, the test tool triggers on vertical
synchronization pulses (frame sync).
To activate the LINES trigger function, open the TV trigger
menu (see Figure 5-12); then press
to highlight
LINES. The top of the display now indicates the Lines
function (see Figure 5-13).
To activate the FRAME trigger function, open the TV trigger
menu (see Figure 5-12); then press
to highlight
FRAME. The top of the display now indicates the Frame
function (see Figure 5-13)
92B/96B/99B/105B
5 - 18
Users Manual
Using the SELECT LINE Trigger Function
With this function, the test tool can trigger on any specific
line in a frame.
To select a line, refer to Figure 5-12 and do the following:
1. From the TV Trigger Menu, press
(SELECT
LINE) to display the select line menu (see Figure 5-14).
1)
1) 2)
1)
1) These menu options are disabled (blank) for noninterlaced setting.
2) This menu option is disabled (blank) if
4-FIELD SEQUENCE is off (not highlighted).
Figure 5-14. SELECT LINE menu
2. Use
to select a line number.
3. If you have selected an interlaced TV system in the
MORE TRIGGER menu, you can press
(ODD /
EVEN) to swap between a line in the odd field and its
corresponding line in the even field. The line counter
decreases or increases accordingly.
NOTE
When you have selected 'TV System: Non-interlaced' in
the MORE TRIGGER menu, the ODD and EVEN FIELD
selection is disabled (not visible on the display shown in
Figure 5-14).
Using in Scope Mode
5 - 19
NOTE
When viewing signals from an interlaced video system, you
may need to use the 4-field sequence function to get a
stable display, as described in the next section, "Using the
4-Field Sequence Function".
4. To begin the waveform display at some time before or
after the trigger point, press
(TIME DELAY) on
the TV trigger menu; then use
to increase
or decrease the time delay. Note that the waveform
shifts to the right or the left while doing so.
To return to the original time delay, press
.
Using the 4-field Sequence Function
In interlaced video systems the color information in a
selected line may be alternating between two phases or
between two amplitudes. This depends on the video
system under test. If you use the 4-field sequence function,
each second frame is discarded (i.e. the test tool displays
the line in a 4-field sequence) and the alternating image
gets stable. Using the AVERAGE WAVEFORM function
(under the
key), with the 4-field sequence function
gives you more accurate measurements.
Figure 5-15 shows the effect of the 4-Field Sequence and
Next Frame functions on a color burst display.
92B/96B/99B/105B
5 - 20
Users Manual
To use the 4-field sequence function, do the following:
1. From the TV trigger menu, press
SEQUENCE).
(4-FIELD
OFF
NOTE
4-FIELD
SEQUENCE
When you have set 'TV system: VIDEO Non-interlaced' in
the MORE TRIGGER menu, the 4-FIELD SEQUENCE
menu option is disabled (not visible on the display shown in
Figure 5-14).
ON
2. To look at the other phase or amplitude, press
(NEXT FRAME). The 4-field sequencer then triggers on
the other frames and discards the previous frames.
NEXT
FRAME
NOTE
The NEXT FRAME function is not available (not visible on
the display) when 4-FIELD SEQUENCE (F3) is off (not
highlighted on the display shown in Figure 5-14).
Figure 5-15. Measuring a color burst with 4-FIELD
SEQUENCE and NEXT FRAME functions
Using in Scope Mode
5 - 21
USING THE MIN MAX ENVELOPE FUNCTION
OF THE FLUKE 92B
This function displays changes in the shape of a waveform
as a grey area around the actual trace. It keeps track of
minimum and maximum values that occur over time.
Using the Min Max Envelope Function
To use this function, do the following:
1. Press
.
NOTE
Any change in attenuation or time base will start a new Min
Max envelope recording.
2. To turn off Min Max envelope recording, do one of the
following:
•
•
Press
a second time.
Press
.
92B/96B/99B/105B
5 - 22
USING THE SCOPE RECORD AND MIN MAX
ENVELOPE FUNCTIONS OF THE
FLUKE 96B, 99B, or 105B
In SCOPE mode, press
to access the waveform
recording functions (see Figure 5.16). You can use these
functions to examine waveform changes over time.
Figure 5-16. Recording Menu
Users Manual
The recording functions are as follows:
SCOPE RECORD
This is a fast electronic 'chart recorder' kind of function with
30k of memory. The large memory allows you to record
startup events. The recorder stores 125 successive
screens with single channel use, or 62.5 screens with dual
channel use, within the time base range from 20 ms/DIV to
60 s/DIV.
This gives you a recording time from 24 s to 20 hours with
single channel use, and from 12 s to 10 hours with dual
channel use.
You can use cursors and zoom functions to examine
waveform details.
MIN-MAX ENVELOPE
This function displays changes in the shape of a live
waveform as a grey area around the actual trace. It keeps
track of minimum and maximum values that occur over
time. This can be used for waveforms A and B and A±B.
Using in Scope Mode
Using the ScopeRecord™ function
Before you start the ScopeRecord, make the following
preparations:
1. Determine whether you need a single ScopeRecord
that stops when the record memory is full (SINGLE
SWEEP), or a continuous ScopeRecord that stops only
by pressing
.
To make this selection, do the following:
(a) From the Min Max Record menu, press
(MORE) to open the menu.
(b) Use
to highlight TRACE REPEAT; then
press
to select.
(c) Highlight the desired option; then press
to
select.
2. Use
to set the appropriate range for the
expected signal. During ScopeRecord, the test tool
maintains the present range.
3. Use
to set the best time base in the range
from 20 ms/DIV to 60 s/DIV. During ScopeRecord the
test tool maintains the present time base.
5 - 23
Do the following to start a ScopeRecord:
1. From the Min Max Record menu press
(START).
2. If there is still data in memory from the previous
recording, a message appears asking you to confirm
that you want to start recording.
NOTE
Starting a recording overwrites data stored from the
previous recording.
Press
Press
(YES) to start the ScopeRecord.
(NO) to cancel the ScopeRecord function.
3. To stop ScopeRecord, press
.
Use the menu on the bottom display to examine the
results, as described in the next section starting with
step 2.
92B/96B/99B/105B
5 - 24
Examining the ScopeRecord™
To examine a ScopeRecord, do the following:
1. From the Min Max Record menu press
(EXAMINE). See Figure 5-16.
The following menu appears:
Figure 5-17. Examine menu
2. Use
to scroll horizontally through the
ScopeRecord. The box above the
and
keys
(zoom box) moves in the corresponding direction to
indicate the ScopeRecord location currently displayed.
Users Manual
3. Use
(ZOOM in) and
(ZOOM out) to
increase and decrease the time resolution.
increases the time resolution. The zoom box above
and
becomes smaller to indicate that a
smaller, but more detailed part of the ScopeRecord is
displayed.
decreases the time resolution. The zoom box
becomes larger to indicate that a larger, but less
detailed part of the ScopeRecord is displayed.
4. To measure the waveform with cursors, press
to
set CURSORS on. To change cursor settings, press
(MORE) to open the setup menu. Refer to
Chapter 6 for additional information about the use of
cursors.
Using in Scope Mode
5 - 25
Using the Min Max Envelope Function
To start this function, do the following:
1. From the Min Max Record menu press
ENVELOPE).
(MIN MAX
NOTE
Any change in attenuation or time base will start a new Min
Max envelope recording.
2. To turn off Min Max envelope recording, do one of the
following:
•
•
Press
,
Press
.
.
92B/96B/99B/105B
5 - 26
MAKING COMBINATIONS WITH INPUT A
AND INPUT B
Press
on INPUT B to select A+B to show INPUTS A
and B added together or to select A-B to show INPUT B
subtracted from INPUT A.
You can also choose A+B and A-B from the MORE INPUT
A or MORE INPUT B window. Highlight COMBINE A & B,
and press
to open the list box. You can also select
A versus B to provide a plot with INPUT A on the vertical
axis and INPUT B on the horizontal axis. Press
to
activate your selection.
DISPLAYING MULTIPLE WAVEFORMS
By displaying a combination of live and recalled waveforms, the test tool can display a maximum of four waveforms simultaneously. For example, INPUTS A, B, A+B,
and waveforms recalled from memory could be displayed.
You can display any combination of four waveforms.
If you attempt to display a fifth waveform, a message on
the display lets you know that you exceeded the maximum
number of four waveforms.
NOTE
The A versus B display is not counted in the four-trace
maximum.
Users Manual
Using in Scope Mode
ADAPTING THE DISPLAY
5 - 27
FULL adds a crosshatch pattern based on the horizontal
time and vertical amplitude divisions on the display.
You can adapt the display to your preference as follows:
1. Press
2. Press
.
to open the Display Menu window.
Selecting a Dot Size
3. Use
to highlight DOT SIZE and press
to open the list box.
Figure 5-18. Grid Selection
4. Choose a dotsize: SMALL, MEDIUM, or LARGE and
press
to select. This selects the trace to be
single, double, or triple width.
Selecting a Display Grid
Adjusting the Trace Quality
7. Use
to highlight PERSISTENCE, and press
to open the list box.
6. Use
to choose between FULL, QUADRANT, or BORDER. Press
to select any of the
three.
Persistence improves the trace quality when you measure
on complex waveforms. Choose one of the five persistence
states: short, normal, medium, high, or infinite to obtain
the best image on the display. Press
to select.
Initially the ScopeMeter test tool is set to normal
persistence.
BORDER provides time and amplitude division marks
around the display.
QUADRANT adds horizontal and vertical division points as
added reference points to the border display.
Contrast and Persistence work interactively. So when you
readjust persistence, it may be necessary to choose
another contrast again.
5. Use
to highlight SCOPE GRID and press
to open the list box.
NOTE
5 - 28
92B/96B/99B/105B
Users Manual
In the DISPLAY window you can also choose the DOT
JOIN function, which either shows the individual measurement samples or joins them together to give a continuous
trace.
DISPLAY MODE allows you to select normal or reverse
video.
8. Press
(CLOSE) to remove the window. The test
tool displays the USER OPTIONS menu again.
Chapter 6
Using Additional Capabilities
MAKING MEASUREMENTS USING
THE CURSORS . . . . . . . . . . . . . . . . . . . . . . . . . . . . . . 6-2
Using the Markers . . . . . . . . . . . . . . . . . . . . . . . . . 6-3
Adding a Cursor Main Reading . . . . . . . . . . . . . . . 6-4
DELETING MEMORIES . . . . . . . . . . . . . . . . . . . . . . . 6-6
SAVING TO MEMORY . . . . . . . . . . . . . . . . . . . . . . . . 6-7
Saving a Screen . . . . . . . . . . . . . . . . . . . . . . . . . . . 6-7
Saving Acquired Waveforms . . . . . . . . . . . . . . . . . 6-7
Saving a Setup . . . . . . . . . . . . . . . . . . . . . . . . . . . . 6-7
Copying Waveforms or Settings . . . . . . . . . . . . . . . 6-8
RECALLING FROM MEMORY . . . . . . . . . . . . . . . . . . 6-8
Recalling a Screen . . . . . . . . . . . . . . . . . . . . . . . . . 6-8
Recalling a Waveform . . . . . . . . . . . . . . . . . . . . . . 6-9
Recalling a Setup Configuration . . . . . . . . . . . . . . 6-10
USING WAVEFORM MATH FUNCTIONS . . . . . . . . 6-11
Scaling the Display . . . . . . . . . . . . . . . . . . . . . . . . 6-11
Choosing a Math Operation . . . . . . . . . . . . . . . . . 6-11
USING A PRINTER . . . . . . . . . . . . . . . . . . . . . . . . .
Connecting to a Printer . . . . . . . . . . . . . . . . . . . .
Setting Print Parameters . . . . . . . . . . . . . . . . . . .
Selecting Printer Types . . . . . . . . . . . . . . . . . . . .
Selecting Print Options . . . . . . . . . . . . . . . . . . . .
Printing Grey in White or Black . . . . . . . . . . . . . .
Sending to a Printer . . . . . . . . . . . . . . . . . . . . . .
USING THE WAVEFORM GENERATOR . . . . . . . .
TESTING COMPONENTS . . . . . . . . . . . . . . . . . . . .
SETTING THE DATE AND TIME . . . . . . . . . . . . . . .
Setting the Time . . . . . . . . . . . . . . . . . . . . . . . . .
Setting the Date . . . . . . . . . . . . . . . . . . . . . . . . .
CHANGING THE RESET CONFIGURATIONS . . . .
ALTERING THE CONTINUOUS
AUTO SET CONFIGURATION . . . . . . . . . . . . . . . .
Using Manual Override . . . . . . . . . . . . . . . . . . . .
Changing Continuous Auto Set Options . . . . . . .
6-14
6-14
6-14
6-14
6-14
6-16
6-16
6-17
6-17
6-19
6-19
6-20
6-20
6-22
6-22
6-22
6-2
92B/96B/99B/105B
MAKING MEASUREMENTS USING THE
CURSORS 92B
The Cursors allow you to make precise digital
measurements of waveform activity between measurement
areas. This can be done on live waveforms and on saved
waveforms.
•
From Scope mode, press
off) the cursor readings.
to turn on (and
Active cursors appear on the display as two vertical and
two horizontal lines.
The intersection of vertical and horizontal lines of the left
cursor marks a point on the waveform. The intersection of
vertical and horizontal lines of the right cursor marks
another point on the waveform. The measurement takes
place between these two points.
Use
and
to move the left and right
cursors which designates the area for the cursor
measurement.
NOTE
You can also find many cursor measurements when using the
key. These measurements are explained in Chapter 3.
Users Manual
Using Additional Capabilities
6-3
When the cursor readings are turned on, you can choose
one or more measurements as follows:
1. From Scope mode, press
More Scope window.
to open to the
2. From the second screen page of the More Scope window, highlight ADD MAIN READING. Press
to
open the list box. The ADD MAIN READING list box
allows you to choose which cursor measurement reading to display. A list of possible measurements is shown
in Figure 6-1.
4. Choose the waveform source with Measure on Waveform. The source selection is determined by active display traces. The traces can be obtained from the active
display (A, B, A±B) or from waveform memory.
5. Choose the number of Readings; the test tool can
display up to five cursor readings at the same time.
When you choose another main readings, all readings
will shift down one, and your last chosen measurement
is placed on top. Notice that the bottom reading is then
removed from the display.
Using the Markers
Use the marker to identify the point on the waveform that a
measurement has occurred or is expected to occur. The
marker appears on the waveform as an "X".
Figure 6-1. Cursor Measurements Window
6. From the third screen page of the More Scope window,
press
to open the Markers list box. A list box of
markers in use is shown in Figure 6-2. Use
or
to choose the marker. Press
to select.
3. Choose the type of Scaling Reading: off, ZERO ∆, or %
off
displays the measurement results in normal
values.
ZERO ∆ displays a change to the reference value.
%
displays a change to the reference value as
a percentage.
Figure 6-2. Markers List Box
6-4
92B/96B/99B/105B
Users Manual
Adding a Cursor Main Reading
From the ADD MAIN READING list box, use
or
to highlight the reading to display, then press
select. Repeat this for more readings.
to
In making cursor measurement calculations, the ScopeMeter test tool uses waveform activity between the cursors.
Figure 6-3. Cursor Main Readings List Box
The measurement results are displayed in the bottom display area. A maximum of five measuring functions can be
turned on at the same time.
In this example, the markers are defining sample points for
measuring frequency.
•
dV (for delta volts) Measures the voltage difference
between the cursors.
NOTE
•
dt (for delta time)
between the cursors.
•
1/dt (for relative frequency) Shows the reciprocal value
of dt.
•
t1 from TRIG Measures the time difference between
the trigger occurrence and the left cursor.
Markers may be easier to see when you press
freeze the waveform.
7. Press
to close the window.
and
Measures the time difference
Using Additional Capabilities
•
t2 from TRIG Measures the time difference between
the trigger occurrence and the right cursor.
•
V1 Measures the voltage amplitude where the left
cursor crosses the waveform.
•
V2 Measures the voltage amplitude where the right
cursor crosses the waveform.
•
Vrms Measures the Root Mean Square (rms) voltage
between the cursors.
•
V DC (mean) Measures the MEAN (average of readings) value of waveform between the cursors.
•
Vpeak/peak Measures the PEAK to PEAK value of the
waveform between the cursors.
•
Vmax peak Measures the maximum peak value of the
waveform between the cursors.
•
Vmin peak Measures the minimum peak value of the
waveform between the cursors.
•
frequency Measures the frequency of the waveform
between the cursors. At least 11/2 cycles of this waveform must occur between the cursors. You can scroll a
waveform through the cursors by pressing
.
Read the frequency change in the bottom display.
6-5
•
rise time Measures the rise time between 10% and
90% points of the waveform. The 0% and 100% points
are determined by the intersection of the waveform and
the cursors. Set the rising slope to at least four time
divisions for a precise measurement.
•
phase Measures the phase shift between two
waveforms. You can select upto three waveforms for
phase measurements to a reference waveform as
selected with Measure on Waveform.
6-6
92B/96B/99B/105B
DELETING MEMORIES 92B
Open the Delete Menu at any time by pressing
.
Users Manual
CAUTION
and
Figure 6-4. Delete Memory List Box
You can now delete all memories or selected memories
(Screen memories, Waveform memories, or Setup
memories). A message appears prompting you to confirm
that you want to delete all memory.
A Master Reset destroys all memory contents and
leaves initial setup with its default settings. Refer to
"Master Reset configuration" further on in this chapter
for a complete discussion of Initial Setup.
You can also delete a single memory location. From the
More Save window, first choose the type of memory
(DELETE what?) you want to delete: Screen, Waveform, or
Setup memory. Press
(SELECT ITEM) to open a list
box and choose the memory location you want to delete.
Use
or
to highlight the memory number. Press
to delete the selected memory location.
Using Additional Capabilities
6-7
SAVING TO MEMORY 92B
You can save screens, waveforms, and setups to memory,
copy them between memories, and recall them from
memory. Ten nonvolatile Screen memories, 20 nonvolatile
Waveform memories, and 40 nonvolatile Setup memories
are available. (For FLUKE 96B you can save five
nonvolatile Screen memories, 10 nonvolatile Waveform
memories, and 20 nonvolatile Setup memories).
•
Press
to open the Save to Memory menu.
When Medium, Long, or Infinite persistence has been chosen, you will only save the actual waveform information.
Saving Acquired Waveforms
Use this function to save acquired waveforms on INPUT A,
INPUT B, and A±B in Scope mode, needed for future measurements. You can save a maximum of 20 waveforms
(For FLUKE 96B you can save a maximum of
10 waveforms).
•
Save menu
Saving a Screen
Use this function to save the current active display image
for future reference. You can save a maximum of
10 screens (For FLUKE 96B you can save a maximum of
five screens).
•
NOTE
Press
(SAVE SCREEN) to save the current
screen in memory (memory #).
The test tool automatically uses the next available memory
location. The display continues to show the actual input
waveform.
Press
(SAVE WAVEFORM).
The test tool starts automatically with the next available
memory locations.
Saving a Setup
Use this function to save your keystroke sequences. Once
the test tool is set up to make the required measurement,
you can save this configuration as one of a maximum of 40
setups (For FLUKE 96B you can save a maximum of 20
setups). A setup is simply the current operating configuration of your ScopeMeter test tool.
•
Press
(SAVE SETUP).
The test tool starts automatically with the next available
memory.
6-8
92B/96B/99B/105B
Copying Waveforms or Settings
To copy a waveform or setting from one memory to
another, press
to open the More Save window.
RECALLING FROM MEMORY 92B
You can review screens and recall waveforms and setups
from memory at any time.
•
Figure 6-5. More Save Window
First choose what you want to copy, a waveform or a
setting. Then determine from which memory you want to
copy. On pressing
(SELECT ITEM), you must
choose the memory to which you want to copy. The test
tool starts automatically with the next available memory.
Use this function to organize the sequence of your
waveforms or settings. This can be useful in semiautomatic measurements.
Users Manual
Press
to open the Recall from Memory menu.
Recall Menu
CAUTION
A Master Reset destroys all memory contents and
leaves the initial setup with its default settings. Refer
to "Master Reset configuration" further on in this
chapter for a complete discussion of Initial Setup.
Recalling a Screen
You can display already saved screens with related setups.
This is presented as a picture that can no longer be
changed. Use this when you want to view a measurement
later.
1. Press
(RECALL SCREEN) to view a saved
screen from screen memory (memory #).
At the same time the Recall Screen function key menu
is activated.
Using Additional Capabilities
2. Use
(PREVIOUS SCREEN) or
SCREEN) to step through the saved screens.
6-9
(NEXT
3. Press
to replace the actual setup with the
recalled setup that belongs to the saved screen.
Recall Screen Menu
Recalling a Waveform
1. Press
(RECALL WAVEFORM) to recall a saved
waveform from waveform memory. A list of all used
waveform memories now appears.
2. Use
and
to highlight the required
waveform. The View Area displays the saved waveform
in compressed form.
3. Press
to recall the selected waveform. A
displayed memory waveform is indicated with the
waveform memory number.
You can display a maximum of four waveforms at a time. If
you attempt to display a fifth waveform, a message lets you
know you have exceeded the maximum number allowed
and suggests that you remove the oldest recalled
waveform.
6 - 10
92B/96B/99B/105B
To reposition any of the recalled waveforms on the display,
first select the appropriate waveform separately by
pressing
, highlight "move #" in the list box with
and
, and press
to select.
appears in
the right bottom of the display. Now use
and
to
reposition the waveform.
Press
(CLEAR WAVEFORM) to remove all recalled
waveforms from the display. The live waveforms (A, B, and
A±B) remain displayed, and the present setup
configuration will not change.
Recalling a Setup Configuration
Press
(RECALL SETUP) to recall a saved setup
configuration from setup memory. A list of all used
setup memories now appears.
•
•
•
Use
or
to highlight the required setup.
Press
to recall the selected setup, that replaces
the present setup configuration.
Users Manual
Using Additional Capabilities
6 - 11
USING WAVEFORM MATH FUNCTIONS
92B 96B
You can perform several math functions on the various
waveforms or memories.
•
•
ADD, SUBTRACT, and MULTIPLY require two operands (SOURCE 1 and SOURCE 2). The operands can
be selected from acquisition memories or waveform
memories.
INVERT, INTEGRATE, and FILTER require one operand (SOURCE 1) from acquisition memories or waveform memories.
•
All operations require a DESTINATION waveform
memory selection.
NOTE
Leaving the Math function active will cause a continuous
update of the destination memory if the source(s) are active
waveform(s).
1. Press
to open the Special Functions menu.
2. Press
to open the MATH menu.
3. Start or stop the math function by turning the MATH
FUNCTION on or off.
4. The MATH OPERATION list box lists all math operations available. Choose one and press
to select.
to highlight the source(s) and destination
5. Use
items. Press
to open the list boxes. Now choose
the source(s) and destination. Press
to select.
Figure 6-6. Math Window for Multiply
Scaling the Display
The Scale factor allows you to adjust the display to
accommodate the math result. Use
or
to
highlight SCALE RESULT, and press
to open the list
box. You can now use
and
to highlight: off, /5,
/25, or /125, and press
to select.
Choosing a Math Operation
You can choose from the following six math operations:
Add
Adds two waveforms (each sourced from an
active input or a memory location) and stores the result in a
waveform memory. For example, waveforms from INPUT A
(SOURCE 1) and Waveform 1 (SOURCE 2) can be added,
resulting in a waveform stored in Waveform 4 memory
(DESTINATION).
Subtract Subtracts the SOURCE 2 waveform from the
SOURCE 1 waveform and stores the result in the next free
waveform memory. As with ADD, active inputs or memory
locations can be used in any combination for the sources.
6 - 12
Multiply
Multiplies two waveforms (each sourced from
an active input or a memory location) and stores the result
in the next free waveform memory. For example, power
can be calculated with MULTIPLY if SOURCE1 represents
the voltage drop across a device and SOURCE 2
represents current through that device. In the following
Figure, waveforms from Waveform 4 memory (upper) and
INPUT A (middle) are multiplied, resulting in the waveform
stored in Waveform 5 memory (lower).
Invert
INVERT allows you to reverse the polarity on
an active input or memory waveform and store the new
waveform in another memory location.
Integrate This function calculates and displays the area
of the selected waveform. Integrate allows you to totalize
the waveform over a period of time, showing the real power
dissipation when the waveform changes levels.
92B/96B/99B/105B
Users Manual
Using Additional Capabilities
Filter
Any waveform (active input or memory) can be
filtered, with the resulting waveform stored in a new
memory location. Noise suppression or simply waveform
smoothing is thereby possible. Filtering is especially useful
with single-shot waveforms, where averaging of multiple
waveform samples is not otherwise available. In the
following figure, the upper waveform represents the INPUT
A waveform as measured, and the lower waveform
represents the filtered version recalled from Waveform 4
memory.
NOTE
In FILTER function, the -3 dB frequency is 0.8/time-perdivision.
6 - 13
6 - 14
92B/96B/99B/105B
USING A PRINTER 92B
Connecting to a Printer
Use the Optically Isolated RS-232 Adapter/Cable
(PM9080/001) to connect a printer to the OPTICAL INTERFACE connection of the ScopeMeter test tool. See
Figure 6-7.
Users Manual
NOTE
The following instructions relate to actions you must take at
the test tool end of this operation.
Setting Print Parameters
Press
and then
to open the Printer window.
You can now choose the printer settings and type of
information to print.
CAUTION
Ensure that the printer is turned off during installation.
This prevents damage to the printer.
Figure 6-8. Printer Window
Tip: Use
and press
to highlight PRINTER BAUDRATE
to read more about printer settings.
Selecting Printer Types
The test tool can print directly to an FX/LQ (Epson),
deskjet, or laserjet printer at 1200 or 9600 baud. From the
list box, make these printer type selections.
Figure 6-7. PM9080/001 Hookup
Selecting Print Options
You can choose from the following print options: Screen,
Readings, or Waveforms.
Using Additional Capabilities
SCREEN (default setting) Print a graphic copy of the
actual display (Scope, Meter, or in any other mode).
6 - 15
READINGS
Print a numerical representation of the
measured values in table form. Printing can be done once
(single) or repetitively with a selected interval time.
6 - 16
WAVEFORMS Print the selected waveform. The
waveform is printed in a numerical format that represents
sample data points (Scope mode only). You can calculate
the real voltage of each data point by subtracting the Y-pos
from the data point value (3-0=3, etc), then multiplying this
with the 200 mV/dot parameter (3 * 200 mV = 600 mV).
The time distance between two dots is 20.0 µs here.
Printing Grey in White or Black
Print the grey persistence of the display as white or as
black on paper.
Sending to a Printer
Press
to start printing via the OPTICAL INTERFACE
port. The settings you made in the User Options menu will
be used.
92B/96B/99B/105B
Users Manual
Using Additional Capabilities
6 - 17
USING THE WAVEFORM GENERATOR
TESTING COMPONENTS 92B 96B
92B 96B
Press
and then
to open the GENERATE menu.
You can now select a waveform output at the red (GENERATOR OUT) and black (COMmon) 4-mm banana jacks.
Figure 6-9. Generator Menu
1. Select GENERATOR OUTPUT and turn the generator
on and off.
2. Choose one of the six waveforms:
Square wave:
1.95kHz, 976Hz, or 488Hz (all at
5V p-p)
Sine wave:
976 Hz (1V p-p)
Slow ramp:
Voltage (-2V to +2V, 1 mA maximum)
Current (0 to 3 mA, 2V maximum)
The generator is automatically disabled in the
and
mode.
,
,
The generator output can also be selected as trigger
source; when turned on, it replaces the EXT (external)
trigger source in the TRIGGER menu.
Figure 6-10. Component Test Setup
From the Special Functions menu, press
to use the
ScopeMeter test tool as a predefined measuring tool for
components. This opens the Component Test menu.
1. Select COMPONENT MENU and turn the component
test on and off.
6 - 18
2. Choose the type of TEST WAVEFORM: the test tool
outputs a slow voltage sweep (-2V to +2V) or current
sweep (0 to +3mA).
3. Choose the TEST PROBE COUPLING: AC or DC
coupling.
Connect the component to be tested between the red
(GENERATOR OUT) and black (COMmon) 4-mm banana
jacks. Measure the component on INPUT A. It's characteristics are shown on the special measure display.
Auto Set cannot be used with the Component measurement mode.
The given display shows a diode test with a slow voltage
sweep (-2 to +2V).
92B/96B/99B/105B
Users Manual
Using Additional Capabilities
6 - 19
SETTING THE DATE AND TIME
The ScopeMeter test tool has a real time clock that keeps
track of date and time. The clock function is useful in
combination with Min Max Trendplot™ if you want to know
when a particular event occurred.
Setting the Time
You can set the time as follows:
1. From the User Options menu, press
TIME) to open the Date and Time menu.
(DATE AND
2. Press
(SET TIME) to open the time setting menu.
Figure 6-11 shows an example of this menu.
3. To change the hours, press
(SET HOURS). The
time progresses one hour per key press. Hold down
to speed up this progression.
4. To change the minutes, press
(SET MINUTES).
The time progresses one minute per key press. Hold
down
to speed up this progression.
5. To choose between a 12-hour clock or a 24-hour clock,
press
(12 / 24 HOUR) .
6. Press
(CLOSE) twice to accept the new time.
Figure 6-11. Menu for Setting the Time
6 - 20
92B/96B/99B/105B
Users Manual
Setting the Date
CHANGING THE RESET CONFIGURATIONS
You can set the date as follows:
When you turn the test tool on, it begins operation in the
last-known configuration, and the main SCOPEMETER
function menu appears. Subsequent power-ons maintain
configuration changes made with keystrokes or through
recall of a setup memory during the previous session.
Default settings are used at the first power-on or after a
reset. You can reset the test tool at any time. The
ScopeMeter test tool can be reset in the following way:
1. From the User Options menu, press
TIME) to open the Date and Time menu.
2. Press
(DATE AND
(SET DATE) to open the date menu.
3. To change the month, press
(SET MONTH). The
date progresses one month per key press. Hold down
to speed up this progression.
-
Master Reset (
+
). A definition of Master
Reset is given below.
Reset
+
. Same as Master Reset, but does
not clear the memories.
4. To change the day, press
(SET DAY). The date
progresses one day per key press. Hold down
to
speed up this progression.
-
5. To change the year, press
(SET YEAR). The year
progresses one year per key press. Hold down
to
speed up this progression.
A Master Reset clears all Screen, Waveform, and Setup
memories.
CAUTION
6. To change the day format, press
between the following:
•
•
. You can choose
mm-dd-yy (month, day, year) e.g. 02-26-1996
dd-mm-yy (day, month, year) e.g. 26-02-1996
7. Press,
(CLOSE) twice to accept the new date and
date format.
The Master Reset includes the following settings:
Meter Mode
Three Readings for Meter Mode, and two Readings for
Scope Mode
Autoranging
Backlight On
Probe Scaling 10:1
All Memories Cleared
Generator Off
Print Format Screen
Printer Setup FX/LQ Graph, 1200 Baud
•
•
•
•
•
•
•
•
•
Using Additional Capabilities
6 - 21
To perform a selective reset, do the following:
1. From the User Options menu, press
MORE OPTIONS menu.
2. Press
to open the
to open the RESET menu (see Figure 6-12).
3. Choose the reset options which include: the default
settings for Master Reset, or selectively resetting any of
the main modes, e.g., Scope, Meter, Ohm, Diode, or
EXT.mV.
Figure 6-12. Reset Menu Window
4. Press
to reset.
Some of the configuration settings can be preset to
become active at every power on.
1. From the User Options menu, press
(MORE
OPTIONS), and open the STARTUP MENU window
(see Figure 6-13).
Figure 6-13. Startup Menu Window
2. Specify on or off for each of the following:
- whether or not to identify the waveform (trace)
source (TRACE IDENTIFIERS).
- whether or not to identify the trigger source, slope,
level, and delay (TRIGGER IDENTIFIER)
- whether or not to CLEAR at RUN. When Clear at
Run is set to on, and you perform a single shot, the
old waveform is cleared first each time the test tool
writes a new waveform.
- whether or not to select high or low INFORMATION
LEVEL facility. When the Information Level is set to
high, you will get all on-line information available in
your ScopeMeter test tool.
Factory defaults place all four of these items on.
3. Press
to select the new Default Settings.
4. Press
to close the window.
6 - 22
ALTERING THE CONTINUOUS AUTO SET
CONFIGURATION
When
is pressed, the instrument assumes the
Continuous Auto Set configuration.
There are ways to alter the Continuous Auto Set configuration. These two methods are discussed below.
92B/96B/99B/105B
Users Manual
Changing Continuous Auto Set Options
Change the Continuous Auto set configuration as follows:
1. From the User Options menu, press
(MORE
OPTIONS) and use
to highlight AUTO SET.
Press
to open the window (see Figure 6-14).
Using Manual Override
Pressing
disables autoranging for voltage attenuation only. Press
to resume the normal mode of operation for Continuous Auto Set.
Pressing
disables autoranging for the time base
setting only. Press
to resume the normal mode of
operation for Continuous Auto Set.
Changing any of the trigger settings disables autoranging for
voltage, time base, and triggering. Press
to resume
the normal mode of operation for Continuous Auto Set.
Figure 6-14. Continuous Auto Set Window
Using Additional Capabilities
The items shown in this window are divided into three
pages. Select a page with
(PREVIOUS PAGE) or
(NEXT PAGE).
2. The first page in the window defines some basic actions
taken during Auto Set. Specify whether the Continuous
Auto Set will optimize trigger source and trigger slope
during measurement. The factory default is "auto". Also
specify whether Auto Set will reset trigger delay (default
is that any delay set will be turned off).
3. The second page defines the input setup or items that
are turned off when the Continuous Auto Set is active.
A B SEPARATION (Default is auto: both waveforms
appear, separated by two divisions).
A B COUPLING (Default is DC: both inputs are DC
coupled).
TURN OFF AVERAGING (Default is yes: smooth
function is turned off).
TURN OFF X-MOVE (Default is yes: waveform in
center of the display).
TURN OFF Y-MOVE (Default is yes: waveform in
center of the display).
TURN OFF A versus B (Default is yes: A vs B function
is turned off).
6 - 23
4. The third page defines functions that are turned off
when the Continuous Auto Set is active.
TURN OFF CURSORS (Default is no : Cursors are not
turned off).
TURN OFF MATHEMATICS (Default is yes : Mathematic function is turned off).
TURN OFF GENERATOR (Default is no : Generator is
not turned off).
TURN OFF DOT JOIN (Default is no : Dot Join remains
active).
6 - 24
92B/96B/99B/105B
Users Manual
Chapter 7
Measuring Examples
MEASURING TEMPERATURE . . . . . . . . . . . . . . . . .
MEASURING CURRENT . . . . . . . . . . . . . . . . . . . . . .
MEASURING POWER WITH MATH FUNCTION . . . .
MEASURING THREE-PHASE ON A DUAL INPUT . .
7-2
7-4
7-7
7-9
MEASURING PHASE USING THE CURSORS . . . . 7-12
MEASURING PULSE RESPONSE
OF AN AMPLIFIER . . . . . . . . . . . . . . . . . . . . . . . . . 7-14
7-2
92B/96B/99B/105B
Users Manual
This chapter examines some typical measurements that
can be made with your ScopeMeter test tool. The examples given can be used as an aid in many applications.
RED DOT
MEASURING TEMPERATURE
Temperature is an often measured characteristic. The
80T-150U optional Temperature Probe can be used in
conjunction with the test tool to measure the surface
temperature, air temperature, and non-corrosive liquid
temperature. You can measure fluctuations in temperature
over a long period of time when the Min Max recording is
activated. Readings on the test tool can be given in
Fahrenheit or Celsius.
In this example, the air temperature is measured over
24 hours.
Connect the 80T-150U Temperature probe to the red and
black 4-mm banana jacks as shown in Figure 7-1.
Figure 7-1. Temperature Measurement Setup
+
Do a Reset; probe scaling factor is 10:1.
(
)
Be sure that the slide switch on the probe is in the
OFF position. A reading of more than 65 mV DC
indicates that the battery of the probe is good.
: °C PROBE
Select degrees Celsius range.
Measuring Examples
Move the slide switch on the probe to the °C position.
The actual air temperature appears on the display.
7-3
The test tool starts continuously recording the air
temperature and graphs the minimum, maximum, and
average temperatures on the display. After about
24 hours the display appears as shown in Figure 7-2.
Figure 7-2. Temperature Measurement with Trend Plot
7-4
92B/96B/99B/105B
Users Manual
MEASURING CURRENT
The 80i-1000s Current Probe is an optional accessory
designed for use with the ScopeMeter test tool to measure
current flow in electrical circuits. The reading in the
Measure menu can be assigned to current (amps) sensed
by the Current Probe. Refer to the instruction sheet
provided with the 80i-1000s for complete information about
Current Probe operation.
WARNING
TO AVOID ELECTRICAL SHOCK, USE ONLY CURRENT
PROBE ACCESSORIES SPECIFICALLY DESIGNED
AND APPROVED FOR USE WITH THE SCOPEMETER
TEST TOOL. OTHER PROBES MAY EXPOSE THE
OPERATOR TO AN ELECTRIC SHOCK HAZARD IF ANY
OF THE THREE COMMON INPUT CONNECTIONS ARE
CONNECTED TO A POTENTIAL GREATER THAN
30V RMS OR 42V DC.
The following example measures the current flow in an
electric motor for 220V line power.
Connect the 80i-1000s Current Probe to the red INPUT A
BNC as shown in Figure 7-3.
Figure 7-3. Current Measurement Setup
Measuring Examples
7-5
Set current probe range switch to 10 mV/A.
+
Do a Reset; probe scaling factor is 10:1.
Select page 4 of the More Measure window.
: A AC+DC METER : 10 mV/A Select Current Probe range.
Clamp the Current Probe jaws around the conductor
to be measured.
The actual current appears on the display: 17.43 Arms.
Figure 7-4. Current Measurement in Meter Mode
7-6
92B/96B/99B/105B
Users Manual
To see the current as a waveform, set the test tool as
follows:
Set Current Probe range switch to 10 mV/A.
+
Do a Reset; probe scaling factor is 10:1.
Select Scope mode.
Select Continuous Auto Set.
Select the Probe A menu.
Open the Probe on INPUT A box.
:10 mV/A Select current range.
Close the window.
The test tool displays the current as a waveform,
which can be analyzed using all other functions. The
selected range appears on the top display.
Figure 7-5. Current Measurement in Scope Mode
Measuring Examples
7-7
MEASURING POWER WITH MATH
FUNCTION 92B 96B
When used with the optional 80i-1000s Current Probe, the
ScopeMeter test tool is able to measure voltage and
current at the same time. This may be used to measure
average power consumption of an electrical load on a
single-phase circuit. This measurement is reliable over a
wide range of frequencies, irrespective of the wave shapes
of voltage or current.
In this example you make use of the previous
measurement setup, measuring current with the 80i-1000s
on INPUT A, and will add the voltage measurement using
the grey 10:1 probe on INPUT B. Be sure that INPUT A is
set to 10 mV/A, and INPUT B is set for a 10:1 probe.
This example shows the connection method and MATH
function operation that accomplishes this.
Figure 7-6. Power Measurement Setup
7-8
92B/96B/99B/105B
Users Manual
Select Continuous Auto Set.
Open the Math menu.
Select each item.
Store the resulting waveform in Destination memory 1.
Close the window.
In Figure 7-7, INPUT A represents the current measurement, INPUT B the voltage measurement, and Destination
memory 1 the product (equals power).
In this example the following scales are used:
INPUT A:
20 A/DIV
INPUT B:
200 V/DIV
Memory 1:
4 kW/DIV
Figure 7-7. Power measurement
Shift the resulting waveform over the display as follows:
: move 1 Move the resulting waveform.
Measuring Examples
MEASURING THREE-PHASE ON A DUAL
INPUT
Dual input measurements can be used for many applications. This example shows how to use these measurements to determine phase rotation of a "Y" connected
three-phase system at a load center. Use alligator clips to
connect the ScopeMeter test tool to the three-phase system connections.
7-9
WARNING
THE SETUP REQUIRES CONNECTING TEST LEADS
TO LIVE COMPONENTS OF A HIGH ENERGY CIRCUIT.
TO AVOID ELECTRIC SHOCK AND/OR EQUIPMENT
DAMAGE, USE CAUTION WHEN CONNECTING ALLIGATOR CLIPS TO LIVE COMPONENTS.
THE METAL JAWS OF ALLIGATOR CLIPS CAN CREATE A SHORT CIRCUIT BETWEEN CLOSELY SPACED
LIVE PARTS. AVOID MAKING CONNECTIONS TO
FEEDER CONDUCTORS OR BUS BARS AT ELEVATED
POTENTIALS. WHENEVER POSSIBLE, MAKE CONNECTIONS TO THE OUTPUT SIDE OF A CIRCUIT
BREAKER WHICH CAN PROVIDE BETTER SHORT
CIRCUIT PROTECTION.
MAKE CONNECTIONS TO CIRCUIT BREAKERS BY
FIRST TURNING THE CIRCUIT BREAKER OFF. THEN
CONNECT THE ALLIGATOR CLIP TO THE BREAKER
OUTPUT TERMINAL VIA A SHORT PIECE OF INSULATED WIRE AS SHOWN IN FIGURE 7-9.
Figure 7-8. Testing a Three-Phase System
7 - 10
92B/96B/99B/105B
Make sure the circuit breaker is turned off. Connect the test
tool to two circuit breakers of two different phases and the
neutral bus bar as shown in Figure 7-9. Use the alligator
clips for the red and grey 10:1 probes and black multimeter
test lead.
Figure 7-9. Connecting the Wires
Users Manual
+
Do a Reset; probe scaling factor is 10:1.
Set the test tool to Scope mode.
Select Continuous Auto Set.
Turn circuit breaker on.
Measure connection 1 and connection 2 (see
Figure 7-10.)
Measuring Examples
The upper display in Figure 7-10 shows that phase 2
(INPUT B) follows phase 1 (INPUT A). The lower display
shows that phase 3 follows phase 1.
7 - 11
: Vrms AC (METER) The Volt RMS readout (about 230 Vrms) appears on the
display. (see Figure 7-11.)
Figure 7-10. Phase Measurements
Figure 7-11. AC Volt RMS Measurement
7 - 12
92B/96B/99B/105B
MEASURING PHASE USING THE CURSORS
92B
In this example you will use the cursors to measure the
phase difference between the waveforms on INPUT A and
B. Use the two waveforms from the dual input three-phase
measurement in the previous exercise. Cursors allow you
to make accurate digital measurements. It is advised that
you first press
to freeze the waveforms to be
measured.
Measure the two sine wave waveforms as explained
in the previous example.
Return to the main menu.
Set the test tool to Scope mode.
Freeze the display; HOLD appears in the upper right
display.
Activate the Cursor readings.
Go to page 2 within the More Scope window.
Users Manual
Choose ADD MAIN READING.
Open the list box.
: phase A>B .
Close the window.
11
Position the two cursors on the waveforms; see
Figure 7-12.
Measuring Examples
7 - 13
The display shows the phase between the waveforms on
INPUT A and INPUT B: "phase A>B -120°" (see
Figure 7-12).
To identify the point on the waveforms where the measurement has occurred, you can use the markers on page 3
within the More Scope window.
Figure 7-12. Phase Measurement (with Markers)
7 - 14
MEASURING PULSE RESPONSE OF AN
AMPLIFIER 92B
In this example you will use cursors to measure the rise
time of a pulse. Rise time is an indication of the bandwidth
limitation of an analog amplifier. First you determine the 0%
and 100% reference points of the waveform to be
measured. These are the intersections of the waveform
and the cursors. This manual determination of the
reference points enables you to ignore unwanted
overshoot, undershoot, or ringing. The test tool instantly
measures the rise time between 10% and 90%. For precise
measurements, set the slope to at least four time divisions.
92B/96B/99B/105B
Users Manual
+
Do a Reset; probe scaling factor is 10:1.
Set the test tool to Scope mode.
Select Continuous Auto Set.
Press as many times as necessary until you have a
rising slope of more than four time divisions.
Make sure that the complete slope is displayed. If
necessary you can use the trigger time delay to shift the
detail on the display.
Open the TIME window.
: rise time Select the rise time measurement.
Now you are ready to do a precise rise time measurement.
Figure 7-13. Measuring the rise time of a pulse.
Measuring Examples
7 - 15
Set the left cursor to the low level of the waveform:
see Figure 7-14. This is the 0% reference point.
Set the right cursor to the high level of the waveform:
see Figure 7-14. This is the 100% reference point.
The test tool instantly displays the rise time: "156 ns".
(See Figure 7-14.)
To identify the points on the slope where the measurement
has occurred, you can use the markers on page 3 within
the More Scope window.
Figure 7-14. Rise Time Measurement (with markers)
7 - 16
92B/96B/99B/105B
Users Manual
Chapter 8
User Maintenance
CLEANING . . . . . . . . . . . . . . . . . . . . . . . . . . . . . . . . .
KEEPING BATTERIES IN OPTIMAL CONDITION . .
REPLACING AND DISPOSING OF BATTERIES . . .
REPLACING FUSES . . . . . . . . . . . . . . . . . . . . . . . . . .
8-2
8-2
8-3
8-5
CALIBRATING THE PROBES . . . . . . . . . . . . . . . . . . 8-5
INPUT A Probe Calibration . . . . . . . . . . . . . . . . . . . 8-5
INPUT B Probe Calibration . . . . . . . . . . . . . . . . . . . 8-6
8-2
92B/96B/99B/105B
WARNING
RISK OF ELECTRIC SHOCK OR FIRE:
USE ONLY INSULATED PROBES, TEST LEADS, AND
CONNECTORS SPECIFIED IN THIS MANUAL WHEN
MAKING MEASUREMENTS >42V PEAK (30V RMS)
ABOVE EARTH GROUND OR ON CIRCUITS >4800 VA.
USE PROBES AND TEST LEADS WITHIN RATINGS
AND INSPECT BEFORE USE.
REMOVE UNUSED PROBES AND TEST LEADS.
REMOVE PROBES AND TEST LEADS BEFORE
OPENING CASE OR BATTERY COVER.
WHEN
THE
SCOPEMETER
TEST
TOOL
IS
CONNECTED TO ITS POWER ADAPTER/BATTERY
CHARGER, TERMINALS MAY BE LIVE, AND THE
OPENING OF COVERS OR REMOVAL OF PARTS
(EXCEPT THOSE THAT CAN BE ACCESSED BY HAND)
IS LIKELY TO EXPOSE LIVE PARTS.
THE TEST TOOL MUST BE DISCONNECTED FROM
ALL VOLTAGE SOURCES BEFORE IT IS OPENED FOR
ANY ADJUSTMENT, REPLACEMENT, MAINTENANCE,
OR REPAIR.
CAPACITORS INSIDE MAY STILL BE CHARGED EVEN
IF THE TEST TOOL HAS BEEN DISCONNECTED FROM
ALL VOLTAGE SOURCES.
Users Manual
CLEANING
Clean the ScopeMeter test tool with a damp cloth and a
mild detergent. Do not use abrasives, solvents, or alcohol.
KEEPING BATTERIES IN OPTIMAL
CONDITION
When new, the batteries typically provide 4 hours of use.
To keep batteries in optimal condition, do the following:
Always operate the test tool on batteries until a blinking
appears in the top right of the display. This indicates
that the battery level is too low and the batteries need to be
recharged.
CAUTION
Frequent charging of the batteries when they are not
completely empty can cause a "memory effect". This
means that the capacity of the NiCad batteries
decrease, causing a decrease in the operating time of
the test tool.
User Maintenance
8-3
You can revitalize a battery pack with too low capacity as
follows:
1.
Reset the ScopeMeter test tool (
+
ensure that the test tool is battery operated.
2.
Press
3.
92B Press
REPLACING AND DISPOSING OF
BATTERIES
), and
.
This disables the battery save feature when no key entry is
made for 5 minutes. Wait until the test tool is automatically
turned off. When it is turned off, the batteries are
completely discharged. Depending on the condition of the
batteries, the discharging can last up to 8 hours.
WARNING
TO AVOID ELECTRICAL SHOCK, REMOVE THE TEST
LEADS, PROBES, AND BATTERY CHARGER BEFORE
REPLACING THE BATTERIES.
1.
Disconnect the test leads, probes, and battery
charger both at the source and at the ScopeMeter
test tool.
2.
Separate the test tool from its holster.
3.
When the test tool is turned off, connect the Power
Adapter/Battery Charger PM8907 to the test tool and
to local line power.
Locate the battery cover on the bottom rear. Loosen
the two screws with a flat-blade screwdriver.
4.
Lift the battery cover away from the test tool.
5.
Charge for more than 21 hours.
5.
Remove the NiCad battery pack (or alkaline batteries,
type KR27/50 or R14) from the battery compartment.
6.
Repeat steps 1 through 5 once more.
4.
NOTE
Ni-Cd
This instrument contains a Nickel-Cadmium battery. Do not
dispose of this battery with other solid waste. Used
batteries should be disposed of by a qualified recycler or
hazardous materials handler. Contact your authorized
Fluke Service Center for recycling information.
8-4
6.
92B/96B/99B/105B
Users Manual
Install a new NiCad battery pack (PM9086) or new
alkaline (C Cell) batteries (type KR27/50 or R14) as
shown in Figure 8.1.
NOTE
Ensure that the NiCad battery pack charging contact is
aligned in the battery compartment as shown in Figure 8.1.
Use only the PM9086 NiCad battery pack.
7.
Reinstall the battery cover and secure the two
screws.
Figure 8-1. Battery Replacement
User Maintenance
8-5
REPLACING FUSES
Since the test tool uses electronically protected inputs, no
fuses are required.
CALIBRATING THE PROBES
The following procedures describe dc calibration and ac
adjustment for the 10:1 probe used on INPUT A (red scope
probe) and INPUT B (grey scope probe).
NOTE
To meet full user specifications, use the 10:1 probes only
with the inputs on which they have been calibrated.
INPUT A Probe Calibration
1.
Connect the INPUT A BNC input to the GENERATOR
OUT red banana jack. See Figure 8-2. Use the red
scope probe and the red 4-mm banana adapter.
2.
Turn the ScopeMeter test tool on.
3.
Press
4.
Press
5.
Use
press
Figure 8-2. INPUT A Probe Calibration Setup
.
to open the PROBES MENU window.
to highlight PROBE on INPUT A, and
. This opens the list box.
8-6
92B/96B/99B/105B
6.
Use
select.
7.
Use
press
to highlight 10:1, and press
to
Users Manual
INPUT B Probe Calibration
1.
to select CALIBRATE PROBE on A, and
to calibrate.
Connect the INPUT B BNC input to the GENERATOR
OUT red banana jack. See Figure 8-4. Use the grey
scope probe and the grey 4-mm banana adapter.
The test tool outputs a voltage on the GENERATOR OUT
banana jack to the connected probe.
8.
Adjust the trimmer screw in the probe housing of
INPUT A to give an optimum square wave within the
equal markers on the display (see Figure 8-3).
Figure 8-3. Adjusting the Probe
9.
Press
to continue.
The test tool automatically calibrates itself to the probe.
A message appears on the display indicating that
calibration is successfully completed.
10. Press
Figure 8-4. INPUT B Probe Calibration Setup
to close the procedure.
2.
Repeat steps 2 trough 10 of the INPUT A calibration.
Chapter 9
Appendixes
9A
9B
9C
Specifications . . . . . . . . . . . . . . . . . . . . . . . . . . 9-3
Parts and Accessories . . . . . . . . . . . . . . . . . . 9-15
PM8907 Information . . . . . . . . . . . . . . . . . . . . 9-19
9D
9E
Warranty and Service Centers . . . . . . . . . . . 9-21
Terminology . . . . . . . . . . . . . . . . . . . . . . . . . . 9-23
1-2
91/92/96/99/105
Users Manual
Appendixes
9-3
Appendix 9A
Specifications
INTRODUCTION
Performance Characteristics
FLUKE guarantees the properties expressed in numerical
values with the stated tolerance. Specified non-tolerance
numerical values indicate those that could be nominally
expected from the mean of a range of identical
ScopeMeter test tools.
For definitions of terms, refer to IEC Publication 351-1.
Safety Characteristics
The ScopeMeter test tool has been designed and tested in
accordance with IEC Publication 1010, Safety
Requirements for Electrical Equipment for Measurement,
Control, and Laboratory Use. This manual contains
information and warnings that must be followed by the user
to ensure safe operation and to keep the instrument in a
safe condition. Use of this equipment in a manner not
specified by the manufacturer may impair protection
provided by the equipment.
Environmental Data
The environmental data mentioned in this manual are
based on the results of the manufacturer's verification
procedures.
9-4
MEASURE MENU
The Measure menu gives direct access to over 30
measurements; the best operating mode is automatically
selected.
SCOPE MODE
Continuous Auto Set
Hands-free signal probing. Continuously follows input
signals from 15 Hz to 50 MHz and automatically selects the
proper time base, input range, and trigger level.
Min Max Envelope
Records the waveform excursions with a grey scale
envelope on both inputs.
40 ns Glitch detect
Sweep speeds 1 µs per division or slower on INPUT A.
Grey-scale display
Analog-like Grey-scale display.
Waveform Average
Smoothing up to 256 waveforms. 10 samples in Roll mode.
Vertical
Frequency Response, -3 dB..................... DC to >100 MHz
(Fluke 99B, 105B)
DC to >60 MHz (Fluke 92B, 96B)
92B/96B/99B/105B
Users Manual
AC coupled ................<10 Hz direct, <1 Hz with 10:1 probe
Coupling .................................................... AC, DC, Ground
Rise Time .................................. <3,5 ns (Fluke 99B, 105B)
<7 ns (Fluke 92B, 96B)
Sensitivity ................................................1 mV to 100 V/div
to 1 kV/div with 10:1 probe
Current probe scaling ................. 1 mA/div to 100,000 A/div
Modes ...............................A, -A, B, -B, A+B, A-B, A=x B=y
Input Impedance................................... 1 MΩ//25 pF direct,
10 MΩ//15 pF with 10:1 probe
Vertical Resolution.................................... 8 bit (256 levels)
Accuracy ........................................................... ±(2% +1 pixel),
add 3% for 1 and 2 mV/div
Horizontal
Modes......................................Recurrent, Single Shot, Roll
RANGES:
Recurrent ........................ 5 ns to 1 s/div (Fluke 99B, 105B)
10 ns to 1 s/div (Fluke 92B, 96B)
Dual input alternating .................5 ns (10 ns) to 20 µs/div
Dual input chopped ..................................50 µs to 1 s/div
Maximum equivalent sampling rate
(for repetitive signals) ............... 5 GS/s Fluke 99B, 105B)
2.5 GS/s (Fluke 92B, 96B)
Maximum real time sampling rate (for normal mode
and single channel single shot) ...........................25 MS/s
Appendixes
Single Shot ..............................................100 ns to 1 s/div
Dual input alternating .........................100 ns to 20 µs/div
Dual input chopped ..................................50 µs to 1 s/div
Roll ................................................................2 s to 60 s/div
Dual input chopped ....................................2 s to 60 s/div
Accuracy ...................................................+(0.1% + 1 pixel)
Record Length .......256 or 512 samples (10 or 20 division)
ScopeRecord™ (Fluke 99B, 105B) .................30k samples
from 20 ms/div to 60s/div
Trigger (NORMAL mode)
Sources.................................................... A, B, or EXTernal
Sensitivity: A or B...................................<0.8 div to 10 MHz
<1.5 div to 60 MHz
<4.0 div to 100 MHz
Sensitivity: EXTernal ......................................+0.2V or 2.0V
(TTL level compatible)
External Input Impedance..................... 1 MΩ//25 pF direct,
10 MΩ//15 pF with 10:1 probe
Delay Time .................................................. -20 to +640 div
N-cycle Trigger........Retriggers after 2 to 255 trigger cycles
Delay by events ............1 to 1023 events after EXT trigger
TV Trigger (on INPUT A only)
TV Trigger Modes .............. Lines, Frame, Odd/Even fields,
Line Number, 4-Field Sequence
Video Modes ........................... Positive and Negative Video
TV Systems .........................................NTSC, PAL, PAL-M,
SECAM, Non-Interlaced
9-5
Scan Rates .... 14 to 21 kHz, 19 to 33 kHz (non-interlaced),
31 to 65 kHz (non-interlaced)
TV Trigger Sensitivity..........1.5 division (with a minimum of
(on INPUT A)
30 mV) to 21 divisions peak-peak
Cursor Measurements 92B
Up to five displayed simultaneously. All voltage
measurements can be ampere measurements with optional
Current Probes.
Single cursor measurements:
V1, V2, t1 from TRIG, t2 from TRIG.
Dual cursor measurements:
Hz, Vrms, VDC (mean), Vpeak/peak, V max peak, V min
peak, rise time, phase, dV, dt, and 1/dt.
Measurement readout:
absolute, relative (zero), or % change.
Markers selectable on:
Hz, Vpeak/peak, V max peak, V min peak, rise time, and
phase
Waveform Mathematics 92B 96B
Add, Subtract, Multiply, Invert, Filter, or Integrate input
waveforms.
Calculate instantaneous or mean (real) electrical watts with
optional Current Probes.
Zoom
Magnifies waveform around the fourth division at the next
acquisition (sweep).
9-6
METER MODE
Displays up to four readings and a full screen scope
waveform of INPUT A.
DC Voltage
Ranges
direct input .................100 mV, 300 mV, 1V, 3V, 10V, 30V,
100V, 300V
with 10:1 probe .........1V, 3V, 10V, 30V, 100V, 300V, 1 kV,
3 kV (limit 600V)
Accuracy ...................................................... ±(0.5% +5 counts)
Full Scale Reading ............................. 1000 or 3000 counts
Normal Mode Rejection ................... >50 dB at 50 or 60 Hz
Common Mode Rejection .............. >100 dB at DC, 50, 60,
or 400 Hz
AC or AC+DC True RMS Voltage
Ranges
direct input ................100 mV, 300 mV, 1V, 3V, 10V, 30V,
100V, 250V
with 10:1 probe .........1V, 3V, 10V, 30V, 100V, 300V, 1 kV,
2.5 kV (limit 600V)
Accuracy .................... 50 Hz to 60 Hz ±(1% +10 counts)
(valid from
1 Hz [20 Hz] to 20 kHz ±(2% +15 counts)
5% range)
1 Hz [5 Hz] to 1 MHz ±(3% +20 counts)
1 Hz [5 Hz] to 5 MHz ±(10% +25 counts)
•
•
[values] for "Vrms AC (no DC)", AC coupled input.
In "AC+DC", the DC component is included in the
measurement result and does not influence the accuracy.
92B/96B/99B/105B
Users Manual
Full Scale Reading ............................. 1000 or 3000 counts
Crest Factor .... Automatic ranging on crest factor overload
Common Mode Rejection Ratio.......... >60 dB, DC to 60 Hz
Additional Meter Mode Measurements
FREQUENCY .............................................. 1 Hz to 5 MHz
Resolution.................................................................4 digits
Accuracy ......................................................±(0.5% +2 counts)
RPM ..................... selectable: 1 pulse/rev. or 1 pulse/2 rev.
Range .......... 60RPM (120 @ 1 pulse/2 rev.) to 99.99kRPM
Resolution..................... 1 RPM (10RPM for RPM >10,000)
Accuracy .......................................................±(1% +10 counts)
DUTY CYCLE ............................ positive or negative pulse
Range ...........................................................2.0% to 98.0%
Resolution.................................................................... 0.1%
Accuracy (logic or pulse waveforms).......±(0.5% +2 counts)
PULSE WIDTH ......................... positive or negative pulse.
Range ........................................................ 250 µs to 50 ms
Resolution.................................................................3 digits
Accuracy ......................................................±(0.5% +2 counts)
dBV ............................................................ 1 volt reference
dBm ........................ reference @ 50, 60, 75, 93, 110, 125,
135, 150, 250, 300, 500, 600, 800,
900, 1000 or 1200Ω
dBW or WATTS ................. 1, 2, 4, 8, 16 or 50Ω reference
Appendixes
9-7
Ω MODE
Full Scale Reading........................................... 3000 counts
Normal Mode Rejection ...................>50 dB at 50 or 60 Hz
Common Mode Rejection .............. >100 dB at DC, 50, 60,
or 400 Hz
(external 4-mm banana jack inputs)
Ranges ..... 30Ω, 300Ω, 3 kΩ, 30 kΩ, 300 kΩ, 3 MΩ, 30 MΩ
Accuracy (300Ω to 30 MΩ)....................... ±(0.5% +5 counts)
Accuracy (30Ω)......................................... ±(2.5% +25 counts)
Full Scale Reading........................................... 3000 counts
Measurement Current........... 500 µA, 500 µA, 70 µA, 7 µA,
700 nA, 70 nA, 70 nA
Open Circuit Voltage..................................................... <4V
Full Scale Voltage ........... <250 mV to 3 MΩ, <2V to 30 MΩ
Continuity Beeper ................................ audible for readings
<5% of selected range
DIODE TEST MODE
(external 4 mm banana jack inputs)
Open Circuit Voltage............................................................≤4V
Full Scale Voltage .................................................... 2.800V
Measurement Current.............................................. 0.5 mA
Continuity Beeper .........................audible for readings <1V
EXTERNAL mV MODE
Displays up to four readings and a full size waveform of the
4 mm banana jack input.
DC Voltage
Ranges ............................................................. 300 mV, 3V
Accuracy...................................................... ±(0.5% +5 counts)
AC or AC+DC True RMS Voltage
Ranges ............................................................. 300 mV, 3V
Accuracy ..........................................DC, 50 Hz, and 60 Hz.
(valid from >5% of range)
±(2% +15 counts)
OL at >2250 counts in 3V range
Full Scale Reading........................................... 3000 counts
Crest Factor .... Automatic ranging on crest factor overload
Common Mode Rejection Ratio ..........>60 dB, DC to 60 Hz
Additional EXTernal mV mode measurements
Frequency, RPM, Duty Cycle and Pulse Width
measurements and waveforms can also be made with
reduced accuracy.
°C / °F TEMPERATURE SCALING ................. for optional
temperature probes
Scaling ............................................................ 1 mV/degree
AMPERE SCALING ..................for optional current probes
Scaling ...... 1 mV/A, 10 mV/A, 100 mV/A, 1 V/A (1 mV/mA)
for DC, AC rms, or AC+DC rms
9-8
METER, Ω, DIODE, and EXTERNAL mV
MODE FUNCTIONS
Smooth .... Moving average of readings for about last 8 sec.
Normal ........<3.5 seconds response time for inputs >50 Hz
Fast .................<1 second response time for inputs >50 Hz
Change Alert™ ......... Audible beep when reading changes
Touch Hold .......Audible beep & hold of last stable reading
Relative .......... Zeros present reading as a reference value
% Change...............% change relative to a reference value
% Scale .................% of user set 0% and 100% references
Min Max ..........Simultaneous display of present, maximum,
minimum, and average values with time
Min Max TrendPlot™
Logs minimum, maximum, and average readings to
memory at full accuracy and displays all three as graphs.
Uses automatic vertical scaling and horizontal time
compression for hands-free recording from 120 seconds to
40 days full screen.
Minimum, maximum, and average full accuracy (16 bit)
waveforms available to PC interface 92B 96B .
92B/96B/99B/105B
Users Manual
MEMORIES (SAVE OR RECALL) 92B
Screen ................... all displayed waveforms, readings, and
setup, 10 for Fluke 99B and 105B, 5 for Fluke 96B
Waveforms ....................individual waveforms with setting,
20 for Fluke 99B and 105B, 10 for Fluke 96B
Setups ....................................... complete test tool setting,
40 for Fluke 99B and 105B, 20 for Fluke 96B
SIGNAL GENERATOR 92B 96B
Sine Wave ............................................ 1V pk-pk at 976 Hz
Source resistance .................................................... 400Ω
Square Wave .......5V pk-pk at 488 Hz, 976 Hz, or 1.95 kHz
Source resistance .................................................... 400Ω
PROBE CALIBRATOR
AC probe adjust at 5pk-pk at 1.95 kHz
COMPONENT TESTER 92B 96B
Current Mode........................ 0 to +3 mA in max. 128 steps
Max. voltage ...................................................................... ≤2V
Voltage Mode.........................-2V to +2V in max. 128 steps
Max. Current ..................................................... +or- 1 mA
Appendixes
9-9
GENERAL SPECIFICATIONS
The accuracy of all measurements is within +(% of reading
+ number of counts) from 18 °C to 28 °C. Add 0.1 x
(specific accuracy) for each °C <18 °C or >28 °C.
Display
Foil Compensated Super Twisted Liquid Crystal
Size...........................................84 x 84 mm (4.7" diagonal)
Resolution.................................................240 x 240 pixels,
25 pixels/div. in SCOPE mode
Contrast .....................................................User adjustable
Backlight ............. Cold Cathode Fluorescent (CCFL) Tube
High Brightness .................................................... 50 cd/m2
Power
Internal Battery Pack .........................NiCad 4.8V nominal
Operating Time .............................................Typical 4hours
Power Adapter/Battery Charger
Charging Time.........................................Typical 21 hours
Alternate battery ......... 4 Alkaline C cells (nonrechargable)
External Supply ......8 to 20V DC, 6W typical via 5 mm jack
WARNING
THE MINUS VOLTAGE IS CONNECTED TO COMMON.
WHEN USING A POWER SUPPLY THAT IS NOT
DOUBLE INSULATED, CONNECT COMMON TO
PROTECTIVE GROUNDING.
Memory back-up battery 92B .................................CR2032
save screens, waveforms, and setups for up to three
years after main batteries removed
Mechanical
Size excluding holster ........................... 60 x 130 x 260 mm
(2.4 x 5.1 x 10.2 inches)
Size including holster ............................ 65 x 140 x 275 mm
(2.5 x 5.5 x 10.8 inches)
Weight excluding holster.............................. 1.5 kg (3.3 lbs)
Weight including holster............................... 1.8 kg (4.0 lbs)
Environmental
Temperature
Operating .....................................................0 °C to 50 °C
Operating with Power Adapter .....................0 °C to 40 °C
Storage .................................................... -20 °C to 70 °C
Humidity
Operating .......... 20 °C to 30 °C, 90% RH noncondensing
30 °C to 50 °C, 70% RH noncondensing
Storage ............................................................... 95% RH
Altitude
Operating ..................................................3 km (10,000ft)
Storage ...................................................12 km (40,000ft)
Shock and Vibration ..............per MIL-T-28800 for Class 3
9 - 10
92B/96B/99B/105B
Users Manual
Environmental (continued)
Electromagnetic Interference ..................................................................................................meets the following specifications
(see also "DECLARATION OF CONFORMITY" on page XI)
The Fluke 92B, 96B, 99B, and 105B, including standard accessories, conforms with the EEC Directive 89/336 for EMI
immunity, as defined by IEC 801-3, with the addition of the following tables.
Scope mode (excluding probe factor):
Table 1
Susceptibility: no visible disturbance
Frequency range:
10 kHz to 25 MHz
E = < 0.1V/m
E = 1 V/m
E = 3 V/m
Stand alone
1 mV/div to 100 V/div
1 mV/div to 100 V/div
1 mV/div to 100 V/div
With PM8918
1 mV/div to 100 V/div
1 mV/div to 100 V/div
5 mV/div to 100 V/div
Table 2
Susceptibility: no visible disturbance
Frequency range:
25 MHz to 1 GHz
E = < 0.1V/m
E = 1 V/m
E = 3 V/m
Stand alone
1 mV/div to 100 V/div
2 mV/div to 100 V/div
5 mV/div to 100 V/div
With PM8918
1 mV/div to 100 V/div
500 mV/div to 100 V/div
1V/div to 100 V/div
Appendixes
9 - 11
Table 3
Susceptibility: disturbance less than 10% of full scale
Frequency range:
10 kHz to 25 MHz
E = < 0.1V/m
E = 1 V/m
E = 3 V/m
Stand alone
-
-
-
With PM8918
-
-
1 mV/div to 2 mV/div
Table 4
Susceptibility: disturbance less than 10% of full scale
Frequency range:
25 MHz to 1 GHz
E = < 0.1V/m
E = 1 V/m
E = 3 V/m
Stand alone
-
1 mV/div
1 mV/div to 2 mV/div
With PM8918
-
50 mV/div to 200 V/div
1 V/div to 100 V/div
For conditions not specified in tables 1 to 4, a susceptibility effect of more than 10 % is possible
9 - 12
92B/96B/99B/105B
Users Manual
Multimeter mode (V dc, excluding probe factor):
Table 5
Susceptibility: no visible disturbance
Frequency range:
10 kHz to 25 MHz
E = < 0.1V/m
E = 1 V/m
E = 3 V/m
Stand alone
100 mV to 300V
100 mV to 300V
100 mV to 300V
With PM8918
100 mV to 300V
100 mV to 300V
100 mV to 300V
Table 6
Susceptibility: no visible disturbance
E = < 0.1V/m
E = 1 V/m
E = 3 V/m
Stand alone
100 mV to 300V
100 mV to 300V
100 mV to 300V
With PM8918
100 mV to 300V
300 mV to 300V
3V to 300V
Frequency range:
25 MHz to 1 GHz
Table 7
Susceptibility: disturbance less than 10 % of full scale
Frequency range:
25 MHz to 1 GHz
E = < 0.1V/m
E = 1 V/m
E = 3 V/m
Stand alone
-
-
-
With PM8918
-
100 mV
100 mV to 300 mV
Appendixes
9 - 13
ACCESSORY INFORMATION
Safety
Designed to Installation Category III per IEC 1010,
CSA C22.2 (including approval), and UL1244
(including approval) for 600V measurements on
industrial power distributions systems.
MAX. Input voltage on ................300V rms, 600V rms with
INPUT A or INPUT B
10:1 probe
MAX. Input voltage on EXTernal input ................ 300 V rms
Surge Protection ....................... 4 kV, 6 kV with 10:1 probe
per IEC 664 and ANSI/IEEE C62.41 test method
Maximum Isolation to Earth .....600V rms from any terminal
Optical Interface .................. Optically Isolated to 600V rms
Passive Probe 10:1 (PM8918)
Attenuation: x10
Useful Bandwidth: 100 MHz
Input resistance: 10 MΩ
Input capacitance: 15 pF
Max. V x Hz: 109
Cable length: 1.5m
Max. signal Voltage: 600V rms
Max. surge Voltage: 6 kV
Max. Voltage to Ground: 600V rms
Double insulated per IEC1010-1 for 600V.
Optically Isolated RS-232 Adapter /Cable (PM9080/001)
Serial Printer Interface 92B .......................EPSON FX/LQ,
Deskjet Thinkjet, Deskjet, Laserjet
Print screens and waveforms or
log meter and cursor readings
Full PC Interface 92B 96B .......................Transfer setups,
waveforms, measurements, etc.
Capture Screen.........................With FlukeView™ software
(optional for Fluke 92B, 96B and 99B)
9 - 14
92B/96B/99B/105B
Users Manual
Appendixes
9 - 15
Appendix 9B
Parts and Accessories
SERVICE MANUAL
Part Number: 4822 872 05368
STANDARD KIT CONTENTS
DESCRIPTION
MODEL
PART NUMBER
Yellow Holster
PM9083/001
---
NiCad Battery Pack (installed)
PM9086/011
---
Power Adapter/Battery Charger models available:
Universal Europe 230V, 50 Hz
North America 120V, 60 Hz
United Kingdom 240V, 50 Hz
Japan 100V, 60 Hz
Australia 240V, 50 Hz
Universal 115V/230V
PM8907/801
PM8907/803
PM8907/804
PM8907/806
PM8907/807
PM8907/808
-------------
Accessory Case, Soft
C 75
---
REMARK
9 - 16
92B/96B/99B/105B
DESCRIPTION
MODEL
PART NUMBER
REMARK
Probe Set 10:1
10:1 Probe (Red)
10:1 Probe (Grey)
HF Adapter (2 x Black)
Adapter Probe Tip to Banana (Red)
Adapter Probe Tip to Banana (Grey)
High Voltage Test Pin (Red)
High Voltage Test Pin (Grey)
Mini Test Hook (Red)
Mini Test Hook (Grey)
Trim Screwdriver (Red)
Trim Screwdriver (Grey)
PM8918/002
--5322 210 70139
5322 210 70138
5322 263 50193
5322 264 20096
5322 264 20097
5322 264 20087
5322 264 20088
5322 210 70131
5322 210 70129
5322 395 50417
5322 395 50416
set of two
Industrial Alligator Clips
(Red and Grey)
PM9084/001
Multimeter Test Lead Set
Test Leads (Red and Black)
Test Pins (Red and Black)
Industrial Alligator Clip (Black)
Banana Adapter (Red)
Banana Adapter (Black)
TL24
TP20
AC20
set of two
5322 310 32086
------5322 264 20051
5322 264 20052
set of two
set of two
set of two
Users Manual
Appendixes
9 - 17
DESCRIPTION
MODEL
PART NUMBER
Probe Accessory Set
HF Adapter (2 x Black)
Adapter Probe Tip to Banana (Red)
Adapter Probe Tip to Banana (Grey)
High Voltage Test Pin (Red)
High Voltage Test Pin (Grey)
Mini Test Hook (Red)
Mini Test Hook (Grey)
Trim Screwdriver (Red)
Trim Screwdriver (Grey)
PM9094/002
--5322 263 50193
5322 264 20096
5322 264 20097
5322 264 20087
5322 264 20088
5322 210 70131
5322 210 70129
5322 395 50417
5322 395 50416
Demo Board *)
5322 216 51279
Self Training Manual *)
English/German/French/ Spanish/Italian
English/Korean/Japanese/Chinese
4822 872 00768
4822 872 00769
REMARK
*) This item is part of the Self Training Package, supplied on request by product registration within 6 weeks.
9 - 18
DESCRIPTION
Users Manual (English)
Users Manual (German)
Users Manual (French)
Users Manual (Dutch)
Users Manual (Spanish)
Users Manual (Italian)
Users Manual (Danish)
Users Manual (Norwegian)
Users Manual (Swedish)
Users Manual (Finnish)
Users Manual (Chinese)
Users Manual (Japanese)
Users Manual (Korean)
92B/96B/99B/105B
MODEL
PART NUMBER
4822 872 00724
4822 872 00725
4822 872 00726
4822 872 00727
4822 872 00728
4822 872 00729
4822 872 00734
4822 872 00732
4822 872 00733
4822 872 00731
4822 872 00737
4822 872 00735
4822 872 00736
REMARK
Users Manual
Appendixes
9 - 19
Appendix 9C
PM8907 Information
Your ScopeMeter test tool is powered by a PM8907 Power
Adapter /Battery Charger. The version you use depends on
the configuration ordered.
WARNING
TO AVOID ELECTRICAL SHOCK, CONNECT THE
PM8907 POWER ADAPTER TO THE AC OUTLET
BEFORE CONNECTION TO THE SCOPEMETER TEST
TOOL.
Five versions are used with the ScopeMeter test tool:
•
•
•
•
•
•
PM8907/801
PM8907/803
PM8907/804
PM8907/806
PM8907/807
PM8907/808
Universal European line plug 230V
±10%
North American line plug 120V ±10%
United Kingdom line plug 240V ±10%
Japanese line plug 100V ±10%
Australian line plug 240V ±10%
North American line plug and
switchable line voltage 115V ±15% or
230V ±15%.
The line frequencies for all units are 50, 60, and 400 Hz
±10%.
9 - 20
92B/96B/99B/105B
PM8907/801
PM8907/803
PM8907/806
Users Manual
PM8907/807
PM8907/808
PM8907/804
Figure 9C-1. PM8907 Versions
CAUTION
At delivery, the PM8907/808 is set to 230V and is provided with a Power Supply Cord and Attachment
Plug that is for use at the 115V setting only. When operating the unit at the 230V setting, you need a
North American-to-European line plug adapter.
Before you connect the PM8907/808 to the local line, first check the preselected voltage setting on
this unit. You can find the voltage selector switch on the bottom of the PM8907/808. If necessary,
select the corresponding line voltage with the slide switch and ensure that the proper voltage is
visible in the window of the slide selector (see Figure 9C-1).
Appendixes
9 - 21
Appendix 9D
Warranty and Service Centers
LIMITED WARRANTY & LIMITATION OF LIABILITY
Each Fluke product is warranted to be free from defects in material and workmanship under normal use and service. The
warranty period is three years and begins on the date of shipment. Parts, product repairs and services are warranted for 90
days. This warranty extends only to the original buyer or end-user customer of a Fluke authorized reseller, and does not apply
to fuses, disposable batteries or to any product which, in Fluke's opinion, has been misused, altered, neglected or damaged
by accident or abnormal conditions of operation or handling. Fluke warrants that software will operate substantially in
accordance with its functional specifications for 90 days and that it has been properly recorded on non-defective media. Fluke
does not warrant that software will be error free or operate without interruption.
Fluke authorized resellers shall extend this warranty on new and unused products to end-user customers only but have no
authority to extend a greater or different warranty on behalf of Fluke. Warranty support is available if product is purchased
through a Fluke authorized sales outlet or Buyer has paid the applicable international price. Fluke reserves the right to invoice
Buyer for importation costs of repair/replacement parts when product purchased in one country is submitted for repair in
another country.
Fluke's warranty obligation is limited, at Fluke's option, to refund of the purchase price, free of charge repair, or replacement of
a defective product which is returned to a Fluke authorized service center within the warranty period.
9 - 22
92B/96B/99B/105B
Users Manual
To obtain warranty service, contact your nearest Fluke authorized service center or send the product, with a description of the
difficulty, postage and insurance prepaid (FOB Destination), to the nearest Fluke authorized service center. Fluke assumes no
risk for damage in transit. Following warranty repair, the product will be returned to Buyer, transportation prepaid (FOB
Destination). If Fluke determines that the failure was caused by misuse, alteration, accident or abnormal condition of
operation or handling, Fluke will provide an estimate of repair costs and obtain authorization before commencing the work.
Following repair, the product will be returned to the Buyer transportation prepaid and the Buyer will be billed for the repair and
return transportation charges (FOB Shipping Point).
THIS WARRANTY IS BUYER'S SOLE AND EXCLUSIVE REMEDY AND IS IN LIEU OF ALL OTHER WARRANTIES,
EXPRESS OR IMPLIED, INCLUDING BUT NOT LIMITED TO ANY IMPLIED WARRANTY OF MERCHANTABILITY OR
FITNESS FOR A PARTICULAR PURPOSE. FLUKE SHALL NOT BE LIABLE FOR ANY SPECIAL, INDIRECT, INCIDENTAL
OR CONSEQUENTIAL DAMAGES OR LOSSES, INCLUDING LOSS OF DATA, WHETHER ARISING FROM BREACH OF
WARRANTY OR BASED ON CONTRACT, TORT, RELIANCE OR ANY OTHER THEORY.
Since some countries or states do not allow limitation of the term of an implied warranty, or exclusion or limitation of incidental
or consequential damages, the limitations and exclusions of this warranty may not apply to every buyer. If any provision of this
Warranty is held invalid or unenforceable by a court of competent jurisdiction, such holding will not affect the validity or
enforceability of any other provision.
Fluke Corporation, P.O. Box 9090, Everett, WA, 98206-9090, USA or Fluke Industrial B.V., P.O. Box 680, 7600 AR, Almelo,
The Netherlands
SERVICE CENTERS
To locate an authorized service center, visit us on the World Wide Web:
http://www.fluke.com
or call Fluke using any of the phone numbers listed below:
+1-800-443-5853 in U.S.A. and Canada
+31-402-678-200 in Europe
+1-425-356-5500 from other countries
Appendixes
9 - 23
Appendix 9E
Terminology
The following list defines special terms used in this manual.
The terms are listed in alphabetical order. Words shown in
italics can be found elsewhere in the list.
AC
See "Alternating Current."
AC Coupling A mode of signal transmission that passes
the dynamic AC signal component to INPUT A and INPUT
B but blocks the DC component. Useful to observe an AC
signal that is normally riding on a DC signal.
Alternating Current An electrical signal in which current
and voltage vary in a repeating pattern over time.
Amplitude The difference between the highest and
lowest level of a waveform.
Attenuation
The decrease in amplitude of a signal.
Average A processing technique to obtain the average
value of a repetitive signal, useful to eliminate noise.
Auto Set Adjusts voltage scale and time base based on
the characteristic of the active waveform, and automatically
produces a stable waveform of usable size.
Backlight A light that brightens the display, useful for
improving visibility in dark surroundings.
Bandwidth The range of frequencies that the
ScopeMeter test tool can display accurately with no more
than -3 dB (.7x) attenuation of the original signal.
Battery Save This feature enables the ScopeMeter test
tool to shut itself down when running on batteries if the
battery level is too low or if the test tool is not operated.
9 - 24
92B/96B/99B/105B
Users Manual
BNC Coaxial-type input connector used for INPUT A
and INPUT B.
Decibel Measurements that indicate voltage or power
comparison in a logaritmic scale.
Bottom Display The lower part of the display, where the
function key menu is listed.
Delta % Percentage change (delta) uses the present
numerical reading as a relative reference. The display then
shows a percentage that represents the difference
between each new reading and the relative reference.
Capture 10 Divisions
divisions.
Records and displays 10 time
Capture 20 Divisions Records and displays 20 time
divisions although the display shows only 10 at a time.
Horizontal "Move" allows you to view the additional 10
divisions.
Continuous Auto Set Automatically selects the optimum
settings for connected input signals and keeps track of any
variation of the signal.
Contrast
desired.
Contrast of the LCD. Can be adjusted as
Cursors Movable display lines that allow you to make
measurements between two locations on a waveform.
dB
See "decibel."
DC
See "Direct Current."
DC Coupling A mode of signal transmission that passes
both AC and DC signal components to the INPUT A and
INPUT B circuit (see also AC Coupling).
Delay Time The time between the trigger event and the
real acquisition of the waveform.
Delta Time (dt) The change in time. The ScopeMeter
test tool displays the amount of time displayed between the
(vertical) cursors.
Digital Storage Capability Because of the design of
digital oscilloscopes, signals are not displayed at the
moment they are acquired. Instead, signals are first stored
in memory, then sent to the display. This enables the
ScopeMeter test tool to present several options when
displaying information, including "negative delay."
Direct Current
current.
A signal with a constant voltage and
Display The Liquid Crystal Display area of the
ScopeMeter test tool that is used to display all information,
such as readings, waveforms, and text.
Division A part of a waveform, as defined alongside the
lines of the grid on the display.
Appendixes
9 - 25
Dual Trace A feature that allows the ScopeMeter test
tool to display two separate live waveforms at the same
time.
Frequency The number of times a waveform repeats in
1 second, measured in Hertz (Hz) where one Hz is one
cycle per second.
Duty Cycle Ratio of a waveform with respect to the total
waveform period, as measured in percent.
Function keys The five blue keys along the top of the
keypad. They change function based on the present mode
or settings. Function key definitions appear in the Bottom
Display.
Earth Ground Reference point that is directly connected
to the ground via a conductor.
Envelope The display of a waveform that shows the
variation extremes of several acquisitions (see also Min
Max).
Events Triggering via red 4-mm banana jack input
(EXT) is delayed by a number of events that occur on
INPUT A.
Falling Slope The part of a waveform that shows the
voltage decreasing.
Filter Reduces
or
removes
certain
electrical
components from a waveform (active input or memory). Is
useful to suppress noise or to smooth a waveform.
Free Run Allows the ScopeMeter test tool to display a
waveform without a trigger.
Freeze Holds a waveform acquisition: freezes the
display for closer examination (see also Hold).
Glitch
A momentary spike in a waveform.
Glitch Detect Feature of ScopeMeter that increases its
sampling rate to maximum so that glitches can be
detected.
GND
See "Ground level."
Ground level The voltage reference point in a circuit. It
is indicated with "-" on the display.
Hard Copy A copy on paper of the display, made by a
printer via the optical RS-232 interface.
Hertz (Hz) Unit of measure to count the number of times
that an electrical cycle repeats every second. One Hertz is
one cycle per second.
Hold Allows you to freeze the display for closer
examination.
9 - 26
92B/96B/99B/105B
Users Manual
Input Coupling Modes of signal transmission for INPUT
A and INPUT B: AC coupling, DC coupling, and GND
(Scope only).
Meter Mode In this setting, the ScopeMeter test tool
works like a digital multimeter, presenting information in
numerical readings, and with a reduced Scope display.
Input selection Select if and how the INPUTS A and B
are displayed in Scope mode. This can be normal display,
inverted display, or neither.
Minimum Peak
Interface Isolated optical to RS-232 Interface port for
printer output and computer interfacing.
Liquid Crystal Display (LCD) A display that uses liquid
crystals to display waveforms and text on its screen.
Main Display The center display area that shows
measurement results or displays the waveform(s).
Marker Identifies the point on the waveform on which a
measurement has occurred or is expected to occur. The
marker appears as an "X".
Master Reset Procedure to restore the ScopeMeter test
tool to a set of initial standard settings.
Maximum Peak
waveform.
The highest voltage value of a
Menu A list of choices on the display to select functions
via the five function keys.
Messages On-line information for the user, provided in
situations where there is a conflict.
The lowest voltage value of a waveform.
Min Max Envelope Scope mode feature that displays
changes in the shape of a live waveform as a grey area
around the actual trace.
N-Cycle Trigger function, the input signal is divided by N
before a trigger occurs. This creates a stable picture for
waveforms with a cyclic character.
Noise
Extraneous electrical signal, mostly unwanted.
Non-Repetitive Pulse A random electrical waveform,
with no specific pattern or frequency.
Oscillations The up-and-down peaks of a waveform.
One oscillation consists of one complete up-peak and one
complete down-peak.
Oscilloscope A device for viewing and diagnosing
electrical signals such as waveforms.
Peak-to-Peak
waveform.
The highest and lowest voltage value of a
Percentage of Pulse Width The ratio of signal on-time
to its total cycle time, as measured in percent.
Appendixes
9 - 27
Probe Calibration A procedure that adjusts the
ScopeMeter test tool internally to compensate for
resistance variations between probes.
Probes Measuring conductor that connects the
ScopeMeter test tool to a circuit; specifically for use in the
BNC jacks.
Pulse A waveform that increases from a constant value,
then decreases to its original value.
Pulse Trains
A repetitive series of pulses.
Pulse Width The duration from the beginning to the end
of a signal's on-time or off-time.
Range
The quantity between two points or levels.
Recall The function of loading a stored Setup, Screen,
or Waveform back into the ScopeMeter test tool.
Recurrent The ScopeMeter test tool continuously
(recurrently) updates the display. This gives a dynamic look
at the waveform activity as it occurs.
Repetitive Pulse
frequency.
A signal with a regular pattern or
Rise Time The time between the 10% and 90% points of
the first slope after the left cursor of a waveform.
Rising Slope
voltage.
The part of a waveform displaying a rise in
Root Mean Square (RMS)
to the effective DC value.
Conversion of AC voltages
Roll Visual log of a waveform activity that is useful when
measuring lower frequency signals.
RPM Engine speed expressed in Revolutions Per
Minute.
Sample A momentary reading taken from an input
signal. The ScopeMeter test tool takes a series of samples
to display a waveform.
Sampling Rate The number of samples taken from a
signal every second.
Screen
The complete image of the display.
Scope Mode In this mode, the ScopeMeter test tool
works like a digital oscilloscope.
Setup Series of adjustments necessary for the
ScopeMeter test tool to display a waveform or reading.
Sine Wave A common curved waveform that is
mathematically defined.
Single Shot Allows the ScopeMeter test tool to capture
a single event.
9 - 28
92B/96B/99B/105B
Smooth (Scope) Averages multiple samples of a
waveform. Useful to suppress noise without loss of
bandwidth.
Square Wave A common waveform that consists of
repeating square pulses.
Sweep Speed
see "Time Base"
Users Manual
Trigger Slope The voltage direction necessary for the
ScopeMeter test tool to begin its trace. A positive slope
requires the voltage to rise as it crosses the trigger level. A
negative slope requires the voltage to fall.
Trigger Source The signal that triggers the ScopeMeter
test tool. This can be the waveform being viewed, or it can
come from another waveform.
Time Base The time defined per horizontal division on
the display, expressed in seconds per division.
Voltage Spike A momentary increase or decrease in
voltage (see also Glitch).
Time Delay The time between the trigger event and the
real acquisition of the waveform.
Waveform
Top Display The upper edge of the display, where the
ScopeMeter test tool lists probe calibration, voltage scale,
time base, input coupling, and trigger information.
Trace The displayed waveform that shows the voltage
variations of the input signal as a function of time.
Trigger
Determines the beginning point of a waveform.
Trigger Level The voltage level that a waveform must
reach before the ScopeMeter test tool will read in.
The pattern defined by an electrical signal.
Window A list of functions from which you can choose.
You open a window with the F1-(MORE) function key. You
close the window with the F1-(CLOSE) function key.
Zoom Displays a live waveform with increased time
resolution, giving up to 1000x magnification.
Index
Symbol
°C Probe, 3-4
°F Probe, 3-4
Ω Mode, 3-4, 4-4, 9-7
Mode, 3-4, 4-5, 9-7
, 1-13
Numerics
0%-100%, 4-15
1/dt, 3-8, 3-13, 6-4
10:1 Probes, 2-4
15-Minute Demonstration, 2-2
20 Divisions, 5-10
4-Field Sequence, 5-18, 5-19
4-mm Banana Jack, 1-7
A
A AC, 3-6
A AC+DC, 3-6
A DC, 3-6
Ampere Measurements, 3-6
A versus B, 5-26
A+B, 5-26
A-B, 5-26
AC-Coupling, 5-4
Accesory Information, 9-9
Accessories, 9-13
I-1
Accessory, 3-4
Adapter/Cable, 1-8, 6-14
Adapting the Display, 5-27
Add, 5-26, 6-11
Add Main Reading, 4-14, 6-3
Adjust Level, 5-14
Adjusting the Amplitude, 5-5
Alert, 4-5, 4-13
Alkaline C Cells, 9-8
Alligator Clips, 9-16
Altitude, 9-9
Ampere Scaling, 9-7
Amplitude, 5-5
Auto Level, 5-14
Auto Range, 4-7
Auto Set, 2-5, 6-22
Auto Set Configuration, 6-22
Automotive Adapter, 1-4
Average, 5-11, 9-4
Average Readings, 4-13
B
Backlight, 2-3, 9-8
Banana Jack, 4-2
Banana Jack Inputs, 1-7
Basic Functions, 2-14
Batteries in Optimal Condition, 8-2
Battery Charger, 1-4, 9-19
Battery Pack, 1-4, 9-8
I-2
Battery Replacement, 8-4
Battery Save Feature, 8-3
Beeper Alert, 4-5, 4-13
BNC Jack, 1-7
Bottom Display, 1-9
C
Calibrating the Probes, 8-5
CANCEL Key, 1-12
Capabilities, 1-2
Capturing 10 or 20 Divisions, 5-10
Capturing Glitches, 5-5
Caution Statements, VIII
CE, XI, 9-10
Change Alert, 4-13, 9-7
Characteristics, 9-3
Charger, 1-4
Charging the Battery, 1-6, 8-2
Cleaning, 8-2
Clear at Run, 6-21
Close key, 1-12
COM (Common), VIII
Combinations with INPUT A and INPUT B, 5-26
Common Ground, 1-7
Common Measurements, 3-9
Common Mode Rejection, 9-5, 9-7
Component Test, 6-17, 9-8
Computer Interface, 1-7
Connections, 1-7, 3-2, 4-2, 5-3
92B/96B/99B/105B
Continuity, 3-4
Continuity Test, 3-2
Continuous Auto Set, 2-5, 5-4, 9-4
Continuous Auto Set Configuration, 6-21
Contrast, 2-3, 9-8
Controlling the inputs A and B, 5-4
Copying Waveforms, 6-8
Crest Factor, 9-6, 9-7
Current Measurement, 7-4
Current Probe, 7-4, 9-7
Cursor Measurements, 9-5
Cursors, 6-2, 9-5
D
Date and Time, 6-19
Date Setting, 6-20
dB List Box, 3-9
dBm, 3-7, 9-6
dBm AC, 3-7
dBm AC (no DC), 3-10
dBV, 3-5, 9-6
dBV AC (no DC), 3-11
dBV AC+DC, 3-11
dBW, 3-7, 9-6
dBW AC (no DC), 3-11
dBW AC+DC, 3-11
DC-Coupling, 5-4
DC Voltage, 9-5, 9-7
Default Readings, 4-14
Users Manual
Index
Default Settings, 6-20
Default Startup, 2-4
Delay, 5-14
Delay Time, 9-5
Delete Menu, 6-6
Deleting Memories, 6-6
Delta Time, 3-8
Diode, 3-4
Diode Test, 3-2, 4-5, 9-7
Display, 1-8, 2-3, 9-9
Disposing of Batteries, 8-3
Dot Size, 5-27
dt, 3-8, 3-12, 6-4
Dual Display, 1-9
Duty Cycle, 3-7, 9-6
dV, 3-5, 6-4
E
Earth Ground, VIII
Easy Setup, 2-5
Electrical Shock, IX
Electrically Floating, VIII
Electro-Magnetic Interference, 9-9
Environmental, 9-9
Environmental Data, 9-3
Error messages, 1-13
Events, 5-14, 9-5
External mV Mode, 4-6, 9-7
External Trigger, 5-13
I-3
F
Fast Refresh Rate, 4-13
Fault Protection, VIII
Features, 1-2
Field Odd/Even, 5-18
Filter, 6-13
Frame, 5-15
Freeze, 4-10
Frequency, 3-8, 6-5, 9-6
Frequency Measurements, 3-9
Function Keys, 1-11
Fuses, 8-5
G
Generator, 6-17, 9-8
Glitch detection, 5-5, 9-4
Grey-Scale Display, 9-4
Grid, 5-27
Ground, VIII
I-4
H
Heavy Duty Industrial Measurements, XIII
Help Function, 1-13
Help Level, 6-21
HF Adapter, 1-7, 4-2
High Frequency Electronic Measurement, XII
Hold, 4-10
Holster, 1-3, 9-15
Humidity, 9-9
Hz, 3-7, 6-5, 9-6
I
Industrial Alligator Clips, 9-16
Information Level, 6-21
Information Mode, 1-13
INPUT A, 1-7, 5-4
INPUT A BNC jack, 4-2
INPUT B, 1-7, 5-4
INPUT B BNC jack, 4-2
Input Connectors, VIII
Input Coupling, 5-4
Input Impedance, 9-4
Integrate, 6-12
Invert, 5-5, 6-12
Isolated, VIII
Isolated Measurement, X
92B/96B/99B/105B
K
Keypad, 1-10
L
Level, 5-14
Limitation of Liability, 9-21
Lines, 5-15
Low Frequency Measurements, 1-7
M
Main Display, 1-9
Main Mode, 4-3
Main Reading, 6-4
Manual Range, 4-5, 4-7
Markers, 6-3, 9-5
Master Reset, 2-4, 6-20
Math Functions, 6-11, 7-7
Mathematics, 9-5
Measure Menu, 3-3, 9-4
Measurement Connections, 4-2
Measurements, 6-3
Mechanical, 9-9
Memories, 9-8
Memory Back-Up Battery, 9-9
Messages, 1-13
Meter, 4-4
Users Manual
Index
Meter Operations, 2-10, 2-11, 2-12
Min Max, 4-9, 9-7
Min Max Envelope, 5-21, 5-22, 9-4
MIN MAX Recording, 4-9
Min Max Scaling, 4-16
Min Max Zero ∆, 4-16
Mini Testhook, 1-7, 4-2
MORE Function Key, 1-11
More INPUT A, 5-26
More INPUT B, 5-26
More Measure, 3-3
More Save, 6-6
More Scope, 6-3
More Scope Window, 5-10
More Submenu, 4-13
More Trigger, 5-13
Multimeter Test Lead Set, 9-16
Multiple Waveforms, 5-26
Multiply, 6-12
N
N-Cycle, 5-14, 9-5
NiCad Batteries, 1-4, 8-2, 9-8
Noise, 1-5
Noise Suppression, 6-13
Normal Mode Rejection, 9-5, 9-7
Number of Readings, 4-14
I-5
O
Ohm, 3-4, 4-4, 9-6
Ohm Measurement, 3-2
On-Line Information, 1-13
Optical Interface, 1-7, 6-14, 9-9
Ordering Measurement Readings, 3-10
Overload Protection, 9-9
P
Parts, 9-13
PC Interface, 9-13
Percent Change, 4-15
Percent of Scale, 4-15
Persistence, 5-27, 6-16
Phase, 3-11, 6-5
Phase Measurement, 7-12
Positioning the Waveform, 5-7
Power Adapter, 1-4, 9-19
Power Measurements, 3-9, 7-7
Powering, 1-4
Print Options, 6-14
Printer, 6-14
Printer Types, 6-14
Probe, 9-9
Probe Accessory Set, 9-16
Probe Calibration, 8-5
Probe Calibrator, 9-8
I-6
Probe Set 10:1, 9-16
Probe Type, 2-4
Protection, X
Pulse Response, 7-14
Pulse Width, 3-7, 9-6
Q
Quick Measurement Demonstration, 2-7, 2-8, 2-9
Quick Operating Guide, 1-3, 9-18
R
Recall, 9-8
Recalling a Screen, 6-8
Recalling a Setup Configuration, 6-10
Record, 4-9
Record Length, 9-5
Recurrent, 5-6, 9-4
Recycling, 8-3
Replacing the Batteries, 8-3
Reset Configurations, 6-20
Resistance Mode, 4-4
Reversing the Polarity, 5-5
Rise Time, 3-8, 6-5, 7-15, 9-4
Roll, 5-6, 9-4
RPM, 9-6
RPM 1, 3-8
RPM 2, 3-8
RS-232, 1-8, 6-14
RS-232 Adapter, 9-13
92B/96B/99B/105B
S
Safety, VIII, 9-13
Safety Characteristics, 9-3
Safety-Protection, X
Save, 9-8
Save Waveform, 6-7
Saving a Screen, 6-7
Saving a Setup, 6-7
Saving Battery Life, 1-6
Scale Result, 6-11
Scaling, 4-14, 6-3
Scaling the Display, 6-11
Scan Rate, 5-16
Scope, 4-3
Scope Display, 1-9
Scope Mode, 1-7
Scope Operations, 2-13, 2-14, 2-15
ScopeRecord, 5-22
Scope Submenu, 5-10
Screen, 6-7, 9-8
SELECT ITEM Key, 1-12
Select Line, 5-18
Selecting the Input, 5-4
Serial Printer Interface, 9-13
Setup, 6-7
Setups, 9-8
Shock, 9-9
Single Shot, 9-4
Single-Phase Circuit, 7-7
Slow Ramp, 6-17
Users Manual
Index
Smooth, 4-13, 9-7
Smoothing, 6-13
Special Functions Menu, 6-11, 6-17
Specifications, 9-3
Speed Up the Refresh Rate, 4-13
Stable Measurement, 4-8
Stand, 1-3
Start Printing, 6-16
Submenu, 4-13
Subtract, 5-26, 6-11
Supply, 9-8
Surge Protection, 9-9
Symbols, VIII
T
Temperature, 9-9
Temperature Measurement, 7-2
Temperature Probe, 3-4, 7-2
Temperature Scaling, 9-7
Testing Components, 6-17, 9-8
Three Lead Connection, IX
Three-Phase, X
Three-Phase Measurement, 7-9
Tilt Stand, 1-3
Time Base, 5-6
Time Delay, 5-14
Time Measurements, 3-9
Time Setting, 6-19
Top Display, 1-9
Touch Hold, 4-8, 9-7
I-7
Trace Quality, 5-27
Trace Start, 5-13
Trend Plot, 4-9, 9-7
t1 from TRIG, 3-11, 6-5
t2 from TRIG, 3-11, 6-5
Trigger, 9-5
Trigger Basics, 5-12
Trigger Delay, 5-14
Trigger Icon, 5-5
Trigger Level, 5-14
Trigger Slope, 5-13
Trigger Source, 5-13
True RMS Voltage, 9-6
TV Triggering, 5-15
TV System, 5-16
U
Unpacking, VII
User Options Menu, 6-21
Users Manual, 9-18
I-8
V
V1 left, 3-11, 6-5
V2 right, 3-11, 6-5
V DC, 3-5
V DC (mean), 3-5, 6-5
V Max Peak, 3-5, 6-5
V Min Peak, 3-5, 6-5
V peak/peak, 3-5, 6-5
Vertical Resolution, 9-4
Vibration, 9-9
Video, 5-16
Voltage Measurements, 3-9
Vrms, 3-5, 6-5
Vrms AC, 3-5
Vrms AC (no DC), 3-10
Vrms AC+DC, 3-5
W
Wait for Trigger, 5-13
Warning And Caution Statements, VIII
Warranty, 9-21
Watt, 3-11, 9-6
WATT AC (no DC), 3-11
WATT AC+DC, 3-11
Waveform Area, 1-9
Waveform Generator, 1-7
Waveform Math Functions, 6-11
92B/96B/99B/105B
Waveforms, 6-7, 9-8
Window, 1-11
Window Display, 1-9
Y
Yellow Holster, 1-3, 9-15
Z
Zero ∆, 4-14
Zero ∆%, 4-15
Zoom, 5-8, 9-5
Users Manual