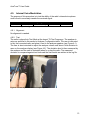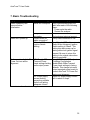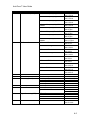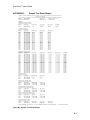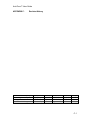
1
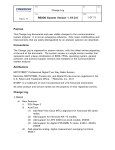
R8000 Series Communications Systems Analyzer AUTOTUNE USER GUIDE Portable Radios Motorola APX™ 2000 Motorola APX™ 4000 Motorola APX™ 6000 Motorola APX™ 7000 Mobile Radios Motorola APX™ 2500 Motorola APX™ 4500 Motorola APX™ 6500 Motorola APX™ 7500 Freedom Communication Technologies 2002 Synergy Blvd, Suite 200 Kilgore, Texas 75662 Copyright 2015 Freedom Communication Technologies All Rights Reserved Printed in U.S.A. CG-1215 Rev. C AutoTune™ User Guide AUTOTUNE™ SOFTWARE LICENSE AGREEMENT The software license agreement governing use of the R8000 Series Communications Systems Analyzer AutoTune™ software is located in CG-1365 R8000 Series Communications Systems Analyzer Operator’s Manual. TRADEMARKS The Freedom Communication Technologies logo and Freedom Communication Technologies are registered ® trademarks of Freedom Communication Technologies. MOTOROLA, MOTO, MOTOROLA SOLUTIONS and the Stylized M logo are trademarks or registered trademarks of Motorola Trademark Holdings, LLC and are used under license. All other trademarks are the property of their respective owners. © 2011–2013 Motorola Solutions, Inc. All rights reserved. OpenG License Copyright (c) 2002, Cal-Bay Systems, Inc. <[email protected]> Copyright (c) 2002, Jean-Pierre Drolet <[email protected]> Copyright (c) 2002-2007, Jim Kring <[email protected]> Copyright (c) 2002-2005, Rolf Kalbermatter <[email protected]> Copyright (c) 2003-2004, Paul F. Sullivan <[email protected]> Copyright (c) 2004, Enrique Vargas <[email protected]> Copyright (c) 2004, Heiko Fettig <[email protected]> Copyright (c) 2004, Michael C. Ashe <[email protected]> Copyright (c) 2005-2006, MKS Instruments, Inc., author: Doug Femec <[email protected]>, IM dafemec Copyright (c) 2006, JKI <[email protected]> Copyright (c) 2006, JKI <[email protected]>; Authors: Jim Kring <[email protected]>, Philippe Guerit <[email protected]> Copyright (c) 2007, JKI <[email protected]> (Author: Jim Kring <[email protected]>) Copyright (c) 2008, Ton Plomp <[email protected]> All rights reserved. Redistribution and use in source and binary forms, with or without modification, are permitted provided that the following conditions are met: - Redistributions of source code must retain the above copyright notice, this list of conditions and the following disclaimer. - Redistributions in binary form must reproduce the above copyright notice, this list of conditions and the following disclaimer in the documentation and/or other materials provided with the distribution. i AutoTune™ User Guide - Neither the name of the SciWare, James Kring, Inc., nor the names of its contributors may be used to endorse or promote products derived from this software without specific prior written permission. THIS SOFTWARE IS PROVIDED BY THE COPYRIGHT HOLDERS AND CONTRIBUTORS "AS IS" AND ANY EXPRESS OR IMPLIED WARRANTIES, INCLUDING, BUT NOT LIMITED TO, THE IMPLIED WARRANTIES OF MERCHANTABILITY AND FITNESS FOR A PARTICULAR PURPOSE ARE DISCLAIMED. IN NO EVENT SHALL THE COPYRIGHT HOLDER OR CONTRIBUTORS BE LIABLE FOR ANY DIRECT, INDIRECT, INCIDENTAL, SPECIAL, EXEMPLARY, OR CONSEQUENTIAL DAMAGES (INCLUDING, BUT NOT LIMITED TO, PROCUREMENT OF SUBSTITUTE GOODS OR SERVICES; LOSS OF USE, DATA, OR PROFITS; OR BUSINESS INTERRUPTION) HOWEVER CAUSED AND ON ANY THEORY OF LIABILITY, WHETHER IN CONTRACT, STRICT LIABILITY, OR TORT (INCLUDING NEGLIGENCE OR OTHERWISE) ARISING IN ANY WAY OUT OF THE USE OF THIS SOFTWARE, EVEN IF ADVISED OF THE POSSIBILITY OF SUCH DAMAGE. EXPORT CONTROL EXPORT CONTROL WARNING – Do not disclose or provide this document or item (including its contents) to non-U.S. Citizens or non-U.S. Permanent Residents, or transmit this document or item (including its contents) outside the U.S. without the written permission of Freedom Communication Technologies and required U.S. Government export approvals. ii AutoTune™ User Guide TABLE OF CONTENTS 1. 2. 3. Introduction .................................................................................................... 1 Scope ............................................................................................................ 1 Motorola APX™ Portable Radio Test Setup .................................................. 2 3.1. APX™ Test Setup .................................................................................... 2 4. Motorola APX™ Portable Alignment and Test Descriptions .......................... 3 4.1. Reference Frequency .............................................................................. 3 4.2. TX Power Out .......................................................................................... 5 4.3. Deviation Balance .................................................................................... 7 4.4. Distortion.................................................................................................. 8 4.5. Sensitivity (SINAD) .................................................................................. 9 4.6. Noise Squelch Threshold ....................................................................... 10 4.7. P25 Tx Tests.......................................................................................... 11 4.8. Digital Sensitivity (BER) ......................................................................... 12 4.9. Internal Voice Modulation ...................................................................... 13 4.10. External Voice Modulation .................................................................. 15 5. Motorola APX™ Mobile Radio Test Setup ................................................... 16 5.1. Motorola APX™ Mobile Test Setup ....................................................... 16 5.2. Motorola APX™ Mobile High Power Test Setup .................................... 16 6. Motorola APX™ Mobile Alignment and Test Descriptions .......................... 18 6.1. Reference Frequency ............................................................................ 19 6.2. TX Power Out ........................................................................................ 21 6.3. Deviation Balance .................................................................................. 23 6.4. Distortion................................................................................................ 25 6.5. Sensitivity (SINAD) ................................................................................ 26 6.6. Noise Squelch Threshold ....................................................................... 27 6.7. P25 Tx Tests.......................................................................................... 28 6.8. Digital Sensitivity (BER) ......................................................................... 29 6.9. Voice Modulation ................................................................................... 30 7. Basic Troubleshooting ................................................................................. 32 8. Support Information ..................................................................................... 33 8.1. Technical Support .................................................................................. 33 8.2. Sales Support ........................................................................................ 33 9. References .................................................................................................. 34 APPENDIX A. Test Limits .............................................................................. A-1 APPENDIX B. Sample Test Result Report ..................................................... B-1 APPENDIX C. Revision History ...................................................................... C-1 LIST OF FIGURES Figure 3-1. APX™ Portable Test Setup Diagram .................................................. 2 Figure 4-1. Place keyed radio next to analyzer speaker. .................................... 13 iii AutoTune™ User Guide Figure 4-2. Adjust analyzer volume until about 4 kHz deviation is measured. .... 14 Figure 5-1. Motorola APX™ Mobile Test Setup Diagram ................................... 16 Figure 5-2. Motorola APX™ Mobile High Power Test Setup Diagram ............... 17 Figure 6-1. AutoTune prompt when test/alignment requires switching bands ..... 18 Figure 6-2. Place keyed microphone next to analyzer speaker. ......................... 30 Figure 6-3. Adjust analyzer volume until about 4 kHz deviation is measured. .... 31 Figure B-1. Sample Test Result Report ............................................................ B-1 iv AutoTune™ User Guide LIST OF TABLES Table 4-1. Analyzer Configuration for Reference Frequency ................................ 3 Table 4-2. Reference Frequency alignment results .............................................. 3 Table 4-3. Reference Frequency test results ........................................................ 4 Table 4-4. Analyzer Configuration for TX Power Out ............................................ 5 Table 4-5. Motorola specified target power ........................................................... 5 Table 4-6. Power Characterization Points alignment results ................................. 5 Table 4-7. TX Power Out alignment results .......................................................... 6 Table 4-8. TX Power Out test results .................................................................... 6 Table 4-9. Analyzer Configuration for Deviation Balance test, alignment ............. 7 Table 4-10. Deviation Balance alignment results .................................................. 7 Table 4-11. Deviation Balance test results ............................................................ 7 Table 4-12. Analyzer Configuration for Distortion Test ......................................... 8 Table 4-13. Distortion test results ......................................................................... 8 Table 4-14. Analyzer Configuration for Sensitivity (SINAD) test ........................... 9 Table 4-15. Sensitivity (SINAD) test results .......................................................... 9 Table 4-16. Analyzer Configuration for Noise Squelch Threshold test ................ 10 Table 4-17. Noise Squelch Threshold test results .............................................. 10 Table 4-20. Analyzer Configuration for P25 Tx Tests ......................................... 11 Table 4-21. P25 Modulation Fidelity test results ................................................. 11 Table 4-22. P25 Symbol Deviation test results ................................................... 11 Table 4-18. Analyzer Configuration for Digital Sensitivity (BER) test .................. 12 Table 4-19. Digital Sensitivity (BER) test results ................................................. 12 Table 4-20. Analyzer Configuration for Internal Voice Modulation test ............... 13 Table 4-21. Internal Voice Modulation test results .............................................. 14 Table 4-22. Analyzer Configuration for External Voice Modulation test .............. 15 Table 4-23. External Voice Modulation test results ............................................. 15 Table 6-1. Analyzer Configuration for Reference Frequency .............................. 19 Table 6-2. Reference Frequency alignment results ............................................ 19 Table 6-3. Reference Frequency test results ...................................................... 20 Table 6-4. Analyzer Configuration for TX Power Out .......................................... 21 Table 6-5. Power Detection Calibration alignment results .................................. 21 Table 6-6. TX Power Out alignment results ........................................................ 22 Table 6-7. TX Power Out test results .................................................................. 22 Table 6-8. Analyzer Configuration for Deviation Balance test, alignment ........... 23 Table 6-9. Deviation Balance alignment results .................................................. 23 Table 6-10. Deviation Balance test results .......................................................... 24 Table 6-11. Analyzer Configuration for Distortion Test ....................................... 25 Table 6-12. Distortion test results ....................................................................... 25 Table 6-13. Analyzer Configuration for Sensitivity (SINAD) test ......................... 26 Table 6-14. Sensitivity (SINAD) test results ........................................................ 26 Table 6-15. Analyzer Configuration for Noise Squelch Threshold test ................ 27 Table 6-16. Noise Squelch Threshold test results .............................................. 27 Table 4-20. Analyzer Configuration for P25 Tx Tests ......................................... 28 Table 4-21. P25 Modulation Fidelity test results ................................................. 28 v AutoTune™ User Guide Table 4-22. P25 Symbol Deviation test results ................................................... 28 Table 6-17. Analyzer Configuration for Digital Sensitivity (BER) test .................. 29 Table 6-18. Digital Sensitivity (BER) test results ................................................. 29 Table 6-19. Analyzer Configuration for Voice Modulation test ............................ 30 Table 6-20. Voice Modulation test results ........................................................... 31 Table 7-1. AutoTune Troubleshooting Chart ....................................................... 32 Table A-1. Default portable test limits. .............................................................. A-2 Table A-2. Default mobile test limits.................................................................. A-3 vi AutoTune™ User Guide 1. Introduction The Freedom Communication Technologies R8000 Series Communications Systems Analyzer AutoTune™ (hereafter “AutoTune”) is designed to provide an automated test and alignment solution for supported two-way radios. 2. Scope This document is intended to provide information regarding the tests and alignments performed by AutoTune for Motorola APX™ portable and mobile two-way radios. This document is restricted to radio-specific information. Please refer to the R8000 Series Communications System Analyzer Owner’s Manual (CG-1365) for an overview and basic operating instructions for AutoTune itself. 1 AutoTune™ User Guide 3. Motorola APX™ Portable Radio Test Setup In order to perform the test and alignment procedures, the APX™ Portable radio must be connected to the R8000 Communications Systems Analyzer as shown in the figure below. Make certain that the radio under test is configured as described in the corresponding diagram before attempting to perform an alignment or test. Failure to do so may result in poor radio performance and/or damage to the analyzer or radio equipment under test. 3.1. APX™ Test Setup Refer to the diagram below for the proper test setup. Note that the correct setting for each RLN4460 test set control is highlighted in yellow. Figure 3-1. APX™ Portable Test Setup Diagram 2 AutoTune™ User Guide 4. Motorola APX™ Portable Alignment and Test Descriptions Note: Throughout this section are references to Test Frequency. Test Frequencies are band- and mode -specific. A table of the frequencies used by each band may be found in the respective radio service manual. See the References section for more details. Note: All analyzer Mode settings are Standard unless otherwise indicated. 4.1. Reference Frequency RF Control Monitor Port RF IN/OUT Frequency Test Frequency Modulation Attenuation FM 30 dB Table 4-1. Analyzer Configuration for Reference Frequency 4.1.1. Alignment The radio is placed into Test Mode at the highest TX Test Frequency and commanded to transmit. Using a best linear fit algorithm, two frequency error measurements are taken at two different radio softpot values. These frequency error measurements are used to calculate the softpot value which minimizes frequency error. After programming this new softpot value into the radio, the radio softpot is fine tuned until minimum frequency error is detected. The frequency error is compared against test limits and the final results written to the log file. Name Result Frequency Freq Error Min Limit Max Limit Old Softpot New Softpot Description Pass or Fail. Frequency Error within Max Limit, Min Limit Test Frequency Measured frequency error after alignment Minimum Limit (inclusive) for frequency error Maximum Limit (inclusive) for frequency error Original radio softpot setting Radio softpot after alignment Table 4-2. Reference Frequency alignment results 4.1.2. Test The radio is placed into Test Mode at the highest TX Test Frequency and commanded to transmit. The frequency error is measured by the analyzer and compared to test limits. The final results are written to the log file. 3 AutoTune™ User Guide Name Result Frequency Freq Error Max Limit Min Limit Softpot Description Pass or Fail. Frequency Error within Max Limit, Min Limit Test Frequency Measured frequency error Maximum Limit (inclusive) for frequency error Minimum Limit (inclusive) for frequency error Radio softpot which yields Freq Error Table 4-3. Reference Frequency test results 4 AutoTune™ User Guide 4.2. TX Power Out RF Control Monitor Port RF IN/OUT Frequency Test Frequency Modulation Attenuation FM 40 dB Table 4-4. Analyzer Configuration for TX Power Out 4.2.1. Alignment The TX Power Out alignment is composed of two parts: Power Characterization Points tuning and TX Characterization tuning. Power Characterization Points tuning is performed first, and only during alignment; it is not performed during a test. Power Characterization Points tuning adjusts the characterization points to account for the variability of the power detection circuitry between radios. The radio is placed into Test Mode and commanded to transmit at the first Test Frequency. The output level is measured and then adjusted until near to a band-specific output level defined by the APX™ Tuner software help file. Band VHF UHF 700MHz 800MHz 900MHz Rated Target Power 6.2 Watt 5.3 Watt 2.65 Watt 3.2 Watt TBD Table 4-5. Motorola specified target power This process is repeated for all test frequencies. The final results are written to the log file. Name Result Frequency Meas Power Target Power Old Softpot New Softpot Description Pass or Fail. Meas Power within manufacturer limits Test Frequency Measured radio output level Ideal Meas Power Original radio softpot setting Radio softpot after alignment Table 4-6. Power Characterization Points alignment results Power Characterization tuning characterizes the power output level of the radio. The radio is placed into Test Mode and commanded to transmit. Beginning at the lowest TX Test Frequency, the output level is measured at two different points for each TX Test Frequency. These measurements are used to calculate and program power coefficients use to normalize the radio power output level across the radio band as specified by the radio’s basic service manual. After the alignment is complete, the power output level is measured again at each TX Test Frequency and compared against test limits. The final results are written to the log file. 5 AutoTune™ User Guide Name Result Frequency Power Out Min Limit Max Limit Description Pass or Fail. Power Out within Max Limit, Min Limit Test Frequency Measured radio output level Minimum Limit (inclusive) for Power Out Maximum Limit (inclusive) for Power Out Table 4-7. TX Power Out alignment results 4.2.2. Test The radio is placed into Test Mode and commanded to transmit. Beginning at the lowest TX Test Frequency, the output level is measured at each TX Test Frequency and compared against test limits. The final results are written to the log file. Name Result Frequency Power Out Min Limit Max Limit Description Pass or Fail. Power Out within Max Limit, Min Limit Test Frequency Measured radio output level Minimum Limit (inclusive) for Power Out Maximum Limit (inclusive) for Power Out Table 4-8. TX Power Out test results 6 AutoTune™ User Guide 4.3. Deviation Balance RF Control Monitor Port RF IN/OUT Frequency Test Frequency Modulation Attenuation FM 20 dB Table 4-9. Analyzer Configuration for Deviation Balance test, alignment 4.3.1. Alignment The radio is placed into Test Mode at the highest TX Test Frequency and commanded to transmit. The radio generates an 80 Hz modulation tone and the deviation of this tone is measured with the analyzer. The radio then generates a 3 kHz modulation tone and the deviation of this tone is measured with the analyzer. The radio softpot is adjusted until the deviation difference between the first and second tones is as small as possible. This adjustment is performed for each TX Test Frequency and the percent difference is compared against test limits. The results for each TX Test Frequency are written to the log file. Name Result Frequency Variance Max Limit Old Softpot New Softpot Description Pass or Fail. Percent difference between low and high tone deviation less than or equal to Variance. Test Frequency Measured difference between low and high tone deviation Maximum passable percent difference (inclusive) between low and high tone deviation Original radio softpot setting Radio softpot setting after alignment Table 4-10. Deviation Balance alignment results 4.3.2. Test The radio is placed into Test Mode at the highest TX Test Frequency and commanded to transmit. The radio generates an 80 Hz modulation tone and the deviation of this tone is measured with the analyzer. The radio then generates a 3 kHz modulation tone and the deviation of this tone is measured with the analyzer. The percent difference is compared against test limits and written to the log file. This test is performed for each remaining TX Test Frequency. Name Result Frequency Variance Max Limit Description Pass or Fail. Percent difference between low and high tone deviation less than or equal to Variance. Test Frequency Measured difference between low and high tone deviation Maximum passable percent difference (inclusive) between low and high tone deviation Table 4-11. Deviation Balance test results 7 AutoTune™ User Guide 4.4. Distortion This is a test only; there is no alignment. RF Control Generate Port RF IN/OUT Frequency Test Freq Modulation FM, 1 kHz @ 3 kHz deviation Level -50 dBm Table 4-12. Analyzer Configuration for Distortion Test 4.4.1. Alignment No alignment is needed. 4.4.2. Test The analyzer is setup as specified in this section’s Analyzer Configuration table. The radio is placed into Test Mode at the lowest RX Test Frequency. The radio audio output level is tested and if insufficient to measure distortion the volume is increased until sufficient to measure distortion. The audio signal’s distortion level is then measured and compared to test limits. The final results are written to the log file. Name Result Frequency Distortion Max Limit Description Pass or Fail. Distortion level within Max Limit, Min Limit Test Frequency Measured audio signal distortion level Maximum Limit (inclusive) for Distortion to Pass Table 4-13. Distortion test results 8 AutoTune™ User Guide 4.5. Sensitivity (SINAD) This is a test only; there is no alignment. RF Control Generate Port RF IN/OUT Frequency Test Freq Modulation FM, 1 kHz @ 3kHz deviation Level -50 dBm Table 4-14. Analyzer Configuration for Sensitivity (SINAD) test 4.5.1. Alignment No alignment is needed. 4.5.2. Test The analyzer is setup as specified in this section’s Analyzer Configuration table. The radio is placed into Test Mode at the lowest RX Test Frequency. The radio audio output level is tested and if insufficient to measure SINAD the volume is increased until sufficient to measure SINAD. The output level of the analyzer is then adjusted until the radio audio signal’s SINAD level measures about 12 dB. The current analyzer output level is then compared against test limits. The final results are written to the log file. Name Result Frequency 12dB SINAD Max Limit Description Pass or Fail. Sensitivity (SINAD) level within Max Limit Test Frequency Analyzer output level at which the radio SINAD level measures 12 dB Maximum Limit (inclusive) for Sensitivity (SINAD) to Pass Table 4-15. Sensitivity (SINAD) test results 9 AutoTune™ User Guide 4.6. Noise Squelch Threshold This is a test only; there is no alignment. RF Control Generate Port RF IN/OUT Frequency Test Freq Modulation FM, 1 kHz @ 3kHz deviation Level -50 dBm Table 4-16. Analyzer Configuration for Noise Squelch Threshold test 4.6.1. Alignment No alignment is needed. 4.6.2. Test The purpose of this procedure is to verify that the squelch circuit operation performs as expected, blocking noise but allowing stronger signals to be heard. The analyzer is setup as specified in this section’s Analyzer Configuration table. The radio is placed into Test Mode at the lowest RX Test Frequency. The radio audio output level is tested and if insufficient to measure the unsquelched condition the volume is increased. Beginning at -125 dBm, the analyzer output level is slowly increased until the radio unsquelches OR is 6 dBm above the Max Limit, whichever comes first. The Unsquelch analyzer output level is compared against test limits and the final results written to the log file. Name Result Frequency Unsquelch Max Limit Description Pass or Fail. Noise Squelch Threshold level within Max Limit Test Frequency Analyzer output level at which the radio unsquelches Maximum Limit (exclusive) for Noise Squelch Threshold to Pass Table 4-17. Noise Squelch Threshold test results 10 AutoTune™ User Guide 4.7. P25 Tx Tests NOTE: This test requires an analyzer with P25 Conventional (R8-P25) test mode capability. The purpose of this procedure is to measure the radio transmitter performance at several given frequencies per the TIA/EIA 102.CAAB standard. These are tests only; there are no alignments. RF Control Monitor Port RF IN/OUT Frequency Test Frequency Modulation Type C4FM Test Pattern Standard Tx (O.153/V.52) Table 4-18. Analyzer Configuration for P25 Tx Tests 4.7.1. Alignment No alignment is needed. 4.7.2. Test The analyzer is setup as specified in this section’s Analyzer Configuration table. The radio is placed into Test Mode at the lowest Tx Test Frequency, ready to transmit a C4FM-modulated signal to the analyzer. The radio is keyed and for each test frequency the following digital measurements are taken: Modulation Fidelity and Symbol Deviation. These measurement results are compared against test limits and the final results written to the log file. Name Result Frequency Mod Fidelity Max Limit Description Pass or Fail. Digital Sensitivity (BER) output level within Max Limit Test Frequency RMS error magnitude difference (%) between actual signal and ideal C4FM signal Maximum Limit (inclusive) for Modulation Fidelity test to Pass Table 4-19. P25 Modulation Fidelity test results Name Result Frequency Symbol Dev Min Limit Max Limit Description Pass or Fail. Digital Sensitivity (BER) output level within Max Limit Test Frequency Deviation (Hz) from transmitting the Standard Tx test pattern Minimum Limit (inclusive) for Symbol Deviation test to Pass Maximum Limit (inclusive) for Symbol Deviation test to Pass Table 4-20. P25 Symbol Deviation test results 11 AutoTune™ User Guide 4.8. Digital Sensitivity (BER) NOTE: This test requires an analyzer with P25 Conventional test mode capability. The purpose of this procedure is to measure the radio receiver’s Bit Error Rate at a given frequency. The TIA/EIA standard BER rate is 5%. This is a test only; there is no alignment. RF Control Generate Port RF IN/OUT Frequency Test Frequency Modulation Framed 1011 Hz Pattern, 2.83 kHz deviation Level -116.0 dBm Table 4-21. Analyzer Configuration for Digital Sensitivity (BER) test 4.8.1. Alignment No alignment is needed. 4.8.2. Test The analyzer is setup as specified in this section’s Analyzer Configuration table. The radio is placed into Test Mode at the lowest RX Test Frequency, ready to receive a C4FM-modulated signal from the analyzer. Once BER synchronization is detected, the analyzer output level is decreased until a BER of 5% is measured. The analyzer output level at 5% BER is compared against test limits and the final results are written to the log file. Name Result Frequency 5% BER Max Limit Description Pass or Fail. Digital Sensitivity (BER) output level within Max Limit Test Frequency Analyzer output level at which the radio BER measures 5% Maximum Limit (inclusive) for Digital Sensitivity (BER) to Pass Table 4-22. Digital Sensitivity (BER) test results 12 AutoTune™ User Guide 4.9. Internal Voice Modulation The purpose of this procedure is to test the ability of the radio’s internal microphone audio circuit to accurately transfer the received signal. RF Control Monitor Port RF IN/OUT Frequency Test Frequency Modulation FM Attenuation 40 dB Table 4-23. Analyzer Configuration for Internal Voice Modulation test 4.9.1. Alignment No alignment is needed. 4.9.2. Test The radio is placed into Test Mode at the lowest TX Test Frequency. The analyzer is setup as specified in this section’s Analyzer Configuration table. The user is instructed to key the connected radio and place it next to the analyzer speaker (see Figure 4-1). The user is also instructed to adjust the analyzer volume until about 4 kHz deviation is seen on the analyzer display (see Figure 4-2). The deviation level is then measured by the analyzer and the user is instructed when to un-key the radio. The measured deviation is compared against test limits and the final results are written to the log file. Figure 4-1. Place keyed radio next to analyzer speaker. 13 AutoTune™ User Guide Figure 4-2. Adjust analyzer volume until about 4 kHz deviation is measured. Name Result Frequency Deviation Min Limit Max Limit Description Pass or Fail. Deviation within Min Limit, Max Limit Test Frequency Measured modulation deviation level Minimum Limit (inclusive) for Deviation to Pass Maximum Limit (inclusive) for Deviation to Pass Table 4-24. Internal Voice Modulation test results 14 AutoTune™ User Guide 4.10. External Voice Modulation The purpose of this procedure is to test the ability of an external microphone attached to the radio to effectively transfer the received signal. RF Control Monitor Port RF IN/OUT Frequency Test Frequency Modulation FM Attenuation 40 dB Table 4-25. Analyzer Configuration for External Voice Modulation test 4.10.1. Alignment No alignment is needed. 4.10.2. Test The radio is placed into Test Mode at the lowest TX Test Frequency. The analyzer is setup as specified in this section’s Analyzer Configuration table. The analyzer generates a 1 kHz signal at 800 mV into the radio’s external microphone accessory port via the radio test set. The radio is commanded to transmit and the resulting deviation level is then measured by the analyzer. The measured deviation is compared against test limits and the final results are written to the log file. Name Result Frequency Deviation Min Limit Max Limit Description Pass or Fail. Deviation within Min Limit, Max Limit Test Frequency Measured modulation deviation level Minimum Limit (inclusive) for Deviation to Pass Maximum Limit (inclusive) for Deviation to Pass Table 4-26. External Voice Modulation test results 15 AutoTune™ User Guide 5. Motorola APX™ Mobile Radio Test Setup In order to perform the test and alignment procedures, the APX™ Mobile radio must be connected to the R8000 Communications Systems Analyzer as shown in the figure below. CAUTION: Make certain that the radio under test is configured as described in the corresponding diagram before attempting to perform the indicated alignment or test. Failure to do so may result in poor radio performance and/or damage to the analyzer or radio equipment under test. 5.1. Motorola APX™ Mobile Test Setup Refer to the diagram below for the proper test setup. Figure 5-1. Motorola APX™ Mobile Test Setup Diagram 5.2. Motorola APX™ Mobile High Power Test Setup Refer to the diagram below for the proper test setup. 16 AutoTune™ User Guide Figure 5-2. Motorola APX™ Mobile High Power Test Setup Diagram 17 AutoTune™ User Guide 6. Motorola APX™ Mobile Alignment and Test Descriptions Note: Throughout this section are references to Test Frequency that are band and mode specific. A table of the frequencies used by each band may be found in the respective radio service manual. See the References section for more details. Note: All analyzer Mode settings are Standard unless otherwise indicated. Dual-Band: Some Motorola APX™ Mobile radios are dual-band capable. Additional notes for radio models configured with two bands are included in the following sections. If the radio under test is configured with a single band, these notes are not applicable. Dual-Band: Dual Band equipped radios have two RF connectors at the rear of the radio. They are labeled on the top and on the rear of the radio to identify which band they should be used with. During most tests and alignments, it will be necessary to change the test setup cabling to test both bands. The test operator will be prompted to connect the RF cable to the appropriate RF Output port on the radio. Figure 6-1. AutoTune prompt when test/alignment requires switching bands 18 AutoTune™ User Guide 6.1. Reference Frequency RF Control Monitor Port RF IN/OUT Frequency Test Frequency Modulation Attenuation FM 20 dB Table 6-1. Analyzer Configuration for Reference Frequency 6.1.1. Alignment The radio is placed into Test Mode at the highest TX Test Frequency and commanded to transmit. Using a best linear fit algorithm, two frequency error measurements are taken at two different radio softpot values. These frequency error measurements are used to calculate the softpot value which minimizes frequency error. After programming this new softpot value into the radio, the radio softpot is fine tuned until minimum frequency error is detected. The frequency error is compared against test limits and the final results written to the log file. Dual-Band: This alignment is only performed at a single test frequency. The test frequency is the highest test frequency for the highest frequency band. Name Result Frequency Freq Error Min Limit Max Limit Old Softpot New Softpot Description Pass or Fail. Frequency Error within Max Limit, Min Limit Test Frequency Measured frequency error after alignment Minimum Limit (inclusive) for frequency error Maximum Limit (inclusive) for frequency error Original radio softpot setting Radio softpot after alignment Table 6-2. Reference Frequency alignment results 6.1.2. Test The radio is placed into Test Mode at the highest TX Test Frequency and commanded to transmit. The frequency error is measured by the analyzer and compared to test limits. The final results are written to the log file. Dual-Band: This test is only performed at a single test frequency. The test frequency is the highest test frequency for the highest frequency band. 19 AutoTune™ User Guide Name Result Frequency Freq Error Min Limit Max Limit Softpot Description Pass or Fail. Frequency Error within Max Limit, Min Limit Test Frequency Measured frequency error Minimum Limit (inclusive) for frequency error Maximum Limit (inclusive) for frequency error Radio softpot which yields Freq Error Table 6-3. Reference Frequency test results 20 AutoTune™ User Guide 6.2. TX Power Out RF Control Monitor Port RF IN/OUT Frequency Test Frequency Modulation Attenuation FM 40 dB Table 6-4. Analyzer Configuration for TX Power Out 6.2.1. Alignment The TX Power Out alignment is composed of two parts: Power Detection Calibration and TX Power Out. Power Detection Calibration is performed first, and only during alignment; it is not performed during a test. Power Detector Calibration tunes the radio power detector to minimize the power output variation across radios. The radio is placed into Test Mode and commanded to transmit at a mid-band Test Frequency. The output level is measured and then adjusted until near to a band-specific target output level supplied by the radio. The final results are written to the log file. Dual-Band: This alignment is performed consecutively for all test frequencies in both bands. Name Result Frequency Meas Power Target Power Old Softpot New Softpot Description Pass or Fail. Meas Power & New Softpot within manufacturer limits Test Frequency Measured radio output level Ideal Meas Power Original radio softpot setting Radio softpot after alignment Table 6-5. Power Detection Calibration alignment results Power Characterization tuning characterizes the power output level of the radio. The radio is placed into Test Mode and commanded to transmit. Beginning at the lowest TX Test Frequency, the output level is measured at two different points for each TX Test Frequency. These measurements are used to calculate and program power coefficients use to normalize the radio power output level across the radio band as specified by the radio’s basic service manual. After the alignment is complete, the power output level is measured again at each TX Test Frequency and compared against test limits. The final results are written to the log file. Dual-Band: This alignment is performed consecutively for all test frequencies in both bands. 21 AutoTune™ User Guide Name Result Frequency Power Out Min Limit Max Limit Description Pass or Fail. Power Out within Max Limit, Min Limit Test Frequency Measured radio output level Minimum Limit (inclusive) for Power Out Maximum Limit (inclusive) for Power Out Table 6-6. TX Power Out alignment results 6.2.2. Test The radio is placed into Test Mode and commanded to transmit. Beginning at the lowest TX Test Frequency, the output level is measured at each TX Test Frequency and compared against test limits. The final results are written to the log file. Dual-Band: This test is performed consecutively for all test frequencies in both bands. Name Result Frequency Power Out Min Limit Max Limit Description Pass or Fail. Power Out within Max Limit, Min Limit Test Frequency Measured radio output level Minimum Limit (inclusive) for Power Out Maximum Limit (inclusive) for Power Out Table 6-7. TX Power Out test results 22 AutoTune™ User Guide 6.3. Deviation Balance RF Control Monitor Port RF IN/OUT Frequency Test Frequency Modulation Attenuation FM 30 dB Table 6-8. Analyzer Configuration for Deviation Balance test, alignment 6.3.1. Alignment The radio is placed into Test Mode at the highest TX Test Frequency and commanded to transmit. The radio generates an 80 Hz modulation tone and the deviation of this tone is measured with the analyzer. The radio then generates a 3 kHz modulation tone and the deviation of this tone is measured with the analyzer. The radio softpot is adjusted until the deviation difference between the first and second tones is within test limits. This adjustment is performed for each TX Test Frequency and the percent difference is compared against test limits. The results for each TX Test Frequency are written to the log file. Dual-Band: This alignment is performed consecutively for all test frequencies in both bands. Name Result Frequency Variance Max Limit Old Softpot New Softpot Description Pass or Fail. Percent difference between low and high tone deviation less than or equal to Variance. Test Frequency Measured difference between low and high tone deviation Maximum passable percent difference (inclusive) between low and high tone deviation Original radio softpot setting Radio softpot setting after alignment Table 6-9. Deviation Balance alignment results 6.3.2. Test The radio is placed into Test Mode at the highest TX Test Frequency and commanded to transmit. The radio generates an 80 Hz modulation tone and the deviation of this tone is measured with the analyzer. The radio then generates a 3 kHz modulation tone and the deviation of this tone is measured with the analyzer. The percent difference is compared against test limits and written to the log file. This test is performed for each remaining TX Test Frequency. Dual-Band: This test is performed consecutively for all test frequencies in both bands. 23 AutoTune™ User Guide Name Result Frequency Variance Max Limit Softpot Description Pass or Fail. Percent difference between low and high tone deviation less than or equal to Variance. Test Frequency Measured difference between low and high tone deviation Maximum passable percent difference (inclusive) between low and high tone deviation Radio softpot setting Table 6-10. Deviation Balance test results 24 AutoTune™ User Guide 6.4. Distortion Note: Motorola APX™ Mobile High Power models are not supported for this test. This is a test only; there is no alignment. RF Control Generate Port RF IN/OUT Frequency Test Freq Modulation FM, 1 kHz @ 3 kHz deviation Level -50 dBm Table 6-11. Analyzer Configuration for Distortion Test 6.4.1. Alignment No alignment is needed. 6.4.2. Test The analyzer is setup as specified in this section’s Analyzer Configuration table. The radio is placed into Test Mode at the lowest RX Test Frequency. The radio audio output level is tested and if insufficient to measure distortion the volume is increased until sufficient to measure distortion. The audio signal’s distortion level is then measured and compared to test limits. The final results are written to the log file. Dual-Band: This test is performed for the lowest RX Test Frequency in each band. Name Result Frequency Distortion Max Limit Description Pass or Fail. Distortion level within Max Limit, Min Limit Test Frequency Measured audio signal distortion level Maximum Limit (inclusive) for Distortion to Pass Table 6-12. Distortion test results 25 AutoTune™ User Guide 6.5. Sensitivity (SINAD) Note: Motorola APX™ Mobile High Power models are not supported for this test. This is a test only; there is no alignment. RF Control Generate Port RF IN/OUT Frequency Test Freq Modulation FM, 1 kHz @ 3kHz deviation Level -50 dBm Table 6-13. Analyzer Configuration for Sensitivity (SINAD) test 6.5.1. Alignment No alignment is needed. 6.5.2. Test The analyzer is setup as specified in this section’s Analyzer Configuration table. The radio is placed into Test Mode at the lowest RX Test Frequency. The radio audio output level is tested and if insufficient to measure SINAD the volume is increased until sufficient to measure SINAD. The output level of the analyzer is then adjusted until the radio audio signal’s SINAD level measures about 12 dB. The current analyzer output level is then compared against test limits. The final results are written to the log file. Dual-Band: This test is performed for the lowest RX Test Frequency in each band. Name Result Frequency 12dB SINAD Max Limit Description Pass or Fail. Sensitivity (SINAD) level within Max Limit Test Frequency Analyzer output level at which the radio SINAD level measures 12 dB Maximum Limit (inclusive) for Sensitivity (SINAD) to Pass Table 6-14. Sensitivity (SINAD) test results 26 AutoTune™ User Guide 6.6. Noise Squelch Threshold Note: Motorola APX™ Mobile High Power models are not supported for this test. This is a test only; there is no alignment. RF Control Generate Port RF IN/OUT Frequency Test Freq Modulation FM, 1 kHz @ 3kHz deviation Level -50 dBm Table 6-15. Analyzer Configuration for Noise Squelch Threshold test 6.6.1. Alignment No alignment is needed. 6.6.2. Test The purpose of this procedure is to verify that the squelch circuit operation performs as expected, blocking noise but allowing stronger signals to be heard. The analyzer is setup as specified in this section’s Analyzer Configuration table. The radio is placed into Test Mode at the lowest RX Test Frequency. The radio audio output level is tested and if insufficient to measure the unsquelched condition the volume is increased. Beginning at -125 dBm, the analyzer output level is slowly increased until the radio unsquelches OR is 6 dBm above the Max Limit, whichever comes first. The analyzer output level is compared against test limits and the final results written to the log file. The radio audio output level is tested and the volume is increased if insufficient to measure unsquelch condition. Beginning at -125 dBm, the analyzer output level is slowly increased until the radio unsquelches OR 6 dBm above the Max Limit, whichever comes first. The unsquelch output level is compared against test limits and the final results written to the log file. Dual-Band: This test is performed for the lowest RX Test Frequency in each band. Name Result Frequency Unsquelch Max Limit Description Pass or Fail. Noise Squelch Threshold level within Max Limit Test Frequency Analyzer output level at which the radio unsquelches Maximum Limit (exclusive) for Noise Squelch Threshold to Pass Table 6-16. Noise Squelch Threshold test results 27 AutoTune™ User Guide 6.7. P25 Tx Tests NOTE: This test requires an analyzer with P25 Conventional (R8-P25) test mode capability. The purpose of this procedure is to measure the radio transmitter performance at several given frequencies per the TIA/EIA 102.CAAB standard. These are tests only; there are no alignments. RF Control Monitor Port RF IN/OUT Frequency Test Frequency Modulation Type C4FM Test Pattern Standard Tx (O.153/V.52) Table 6-17. Analyzer Configuration for P25 Tx Tests 6.7.1. Alignment No alignment is needed. 6.7.2. Test The analyzer is setup as specified in this section’s Analyzer Configuration table. The radio is placed into Test Mode at the lowest Tx Test Frequency, ready to transmit a C4FM-modulated signal to the analyzer. The radio is keyed and for each test frequency the following digital measurements are taken: Modulation Fidelity and Symbol Deviation. These measurement results are compared against test limits and the final results written to the log file. Name Result Frequency Mod Fidelity Max Limit Description Pass or Fail. Digital Sensitivity (BER) output level within Max Limit Test Frequency RMS error magnitude difference (%) between actual signal and ideal C4FM signal Maximum Limit (inclusive) for Modulation Fidelity test to Pass Table 6-18. P25 Modulation Fidelity test results Name Result Frequency Symbol Dev Min Limit Max Limit Description Pass or Fail. Digital Sensitivity (BER) output level within Max Limit Test Frequency Deviation (Hz) from transmitting the Standard Tx test pattern Minimum Limit (inclusive) for Symbol Deviation test to Pass Maximum Limit (inclusive) for Symbol Deviation test to Pass Table 6-19. P25 Symbol Deviation test results 28 AutoTune™ User Guide 6.8. Digital Sensitivity (BER) NOTE: This test requires an analyzer with P25 Conventional test mode capability. The purpose of this procedure is to measure the radio receiver’s Bit Error Rate at a given frequency. The TIA/EIA standard BER rate is 5%. This is a test only; there is no alignment. RF Control Generate Port RF IN/OUT Frequency Test Frequency Modulation Framed 1011 Hz Pattern, 2.83 kHz deviation Level -116.0 dBm Table 6-20. Analyzer Configuration for Digital Sensitivity (BER) test 6.8.1. Alignment No alignment is needed. 6.8.2. Test The analyzer is setup as specified in this section’s Analyzer Configuration table. The radio is placed into Test Mode at the lowest RX Test Frequency, ready to receive a C4FM-modulated signal from the analyzer. Once BER synchronization is detected, the analyzer output level is decreased until a BER of 5% is measured. The analyzer output level at 5% BER is compared against test limits and the final results are written to the log file. Dual-Band: This test is performed for the lowest RX Test Frequency in each band. Name Result Frequency 5% BER Max Limit Description Pass or Fail. Digital Sensitivity (BER) output level within Max Limit Test Frequency Analyzer output level at which the radio BER measures 5% Maximum Limit (inclusive) for Digital Sensitivity (BER) to Pass Table 6-21. Digital Sensitivity (BER) test results 29 AutoTune™ User Guide 6.9. Voice Modulation Note: Motorola APX™ Mobile High Power models are not supported for this test. The purpose of this procedure is to test the ability of the radio’s external microphone audio circuit to accurately transfer the received microphone signal. RF Control Monitor Port RF IN/OUT Frequency Test Frequency Modulation FM Attenuation 40 dB Table 6-22. Analyzer Configuration for Voice Modulation test 6.9.1. Alignment No alignment is needed. 6.9.2. Test The radio is placed into Test Mode at the lowest TX Test Frequency. The analyzer is setup as specified in this section’s Analyzer Configuration table. The user is instructed to key the connected radio microphone and place the microphone next to the analyzer speaker (seeFigure 6-2). The user is also instructed to adjust the analyzer volume until about 4 kHz deviation is seen on the analyzer display (seeFigure 6-3). The deviation level is then measured by the analyzer and the user is instructed when to un-key the microphone. The measured deviation is compared against test limits and the final results are written to the log file. Figure 6-2. Place keyed microphone next to analyzer speaker. 30 AutoTune™ User Guide Figure 6-3. Adjust analyzer volume until about 4 kHz deviation is measured. Dual-Band: This test is only performed for the lowest RX Test Frequency in the lowest frequency band. Name Result Frequency Deviation Min Limit Max Limit Description Pass or Fail. Deviation within Min Limit, Max Limit Test Frequency Measured modulation deviation level Minimum Limit (inclusive) for Deviation to Pass Maximum Limit (inclusive) for Deviation to Pass Table 6-23. Voice Modulation test results 31 AutoTune™ User Guide 7. Basic Troubleshooting Symptom Radio repeatedly fails communication initialization. Radio won’t power up. Radio consistently fails TX Power Out test and/or alignment. Possible Cause(s) Serial link corruption. Analyzer disk corruption. Loose HKN6163_ cable connection. Motorola CPS Ignition Switch setting. APX Family CPS Transmit Power Level settings limiting radio output power. DC Power supply current limiting preventing portable radio from getting adequate current. Possible Solution(s) Retry communicating with the radio after each of the following steps: Power cycle the radio. Restart the analyzer. Contact Freedom Communication Technologies technical support. Verify cable connection is OK. Use Motorola CPS software to set Radio Wide, Advanced, Ignition Switch setting to “Blank”. This setting lets radio power up for testing without an ignition signal present. Be sure to return this setting to its original value when testing completed. Using APX Family CPS, adjust Codeplug Configuration Mode>Radio Wide>Transmit Power Level settings to factory defaults. This change lets radio output expected power levels for correct AutoTune TX Power Out testing and alignment. Adjust DC power supply current limit to about 3 Amps. Table 7-1. AutoTune Troubleshooting Chart 32 AutoTune™ User Guide 8. Support Information 8.1. Technical Support Telephone/Fax: 844.903.7333 Email: [email protected] Web: freedomcte.com/service-support/ 8.2. Sales Support Telephone/Fax: 844.903.7333 Email: [email protected] Web: freedomcte.com/sales/ 33 AutoTune™ User Guide 9. References ASTRO® APX® 5000/ APX® 6000/ APX® 6000Li/ APX® 6000XE Digital Portable Radios Basic Service Manual (68012002028-C) ASTRO® APX™ 7000 VHF/700–800 MHz/UHF1/UHF2 Digital Portable Radios Basic Service Manual (6875962M01-D) APX 6500, APX7500, 03, 05 & 09 Basic Service Manual (6875964M01-C) 34 AutoTune™ User Guide APPENDIX A. Test Limits The factory limits contain the default limits as defined by the radio manufacturer and generally should not be modified. However, if extenuating circumstances cause a need to modify the limits this is accommodated by AutoTune. Refer to the R8000 Series Communications System Analyzer Owner’s Manual (CG-1365) for modification instructions. The following tables list the default test limits for each APX radio model supported by AutoTune. A-1 AutoTune™ User Guide Section 4.1 Test Name Reference Frequency Limit Reference Frequency Align 4.1 Reference Frequency Reference Frequency Test VHF Reference Frequency Test UHF1 Reference Frequency Test UHF2 Reference Frequency Test 700800MHz Reference Frequency Test 900MHz 4.2 TX Power Out TX Power VHF TX Power UHF1 TX Power UHF2 TX Power 700MHz TX Power 800MHz TX Power 900MHz 4.3 4.4 4.5 Deviation Balance Distortion Sensitivity (SINAD) 4.6 4.7 Noise Squelch Threshold P25 Tx Tests 4.8 Digital Sensitivity (BER) 4.9 Internal Voice Modulation Deviation Balance Distortion Sensitivity VHF Sensitivity UHF1 Sensitivity UHF2 Sensitivity 700-800MHz Sensitivity 900MHz Noise Squelch Modulation Fidelity Symbol Deviation BER VHF BER UHF1 BER UHF2 BER 700-800MHz BER 900MHz Internal Voice Modulation Internal Voice Modulation 12.5 kHz 4.10 External Voice Modulation External Voice Modulation External Voice Modulation 12.5 kHz Default Value Min=-100 Hz Max= 100 Hz Min= -2 ppm Max= 2 ppm Min= -2 ppm Max= 2 ppm Min= -2 ppm Max= 2 ppm Min= -1.5 ppm Max= 1.5 ppm Min= -1.5 ppm Max= 1.5 ppm Min= 6.0 W Max= 6.4 W Min= 5.3 W Max= 5.5 W Min= 5.3 W Max= 5.5 W Min= 2.6 W Max= 2.8 W Min= 3.2 W Max= 3.4 W Min= 2.4 W Max= 2.6 W Max= 1.5 % Max= 3 % Max= -116 dBm Max= -116 dBm Max= -116 dBm Max= -116 dBm Max= -116 dBm Max= -116 dBm Max=5% Min=1620 Hz Max=1980 Hz Max= -116 dBm Max= -116 dBm Max= -116 dBm Max= -116 dBm Max= -116 dBm Min= 4.1 kHz Max= 5.0 kHz Min= 2.1 kHz Max= 2.5 kHz Min= 4.1 kHz Max= 5.0 kHz Min= 2.1 kHz Max= 2.5 kHz Table A-1. Default portable test limits. A-2 AutoTune™ User Guide Section 6.1 Test Name Reference Frequency Limit Reference Frequency Align VHF Reference Frequency Align UHF1 Reference Frequency Align UHF2 Reference Frequency Align 700800MHz Reference Frequency Test VHF Reference Frequency Test UHF1 Reference Frequency Test UHF2 6.2 TX Power Out Reference Frequency Test 700800MHz TX Power VHF TX Power VHF High Power TX Power UHF1 TX Power UHF1 High Power TX Power UHF2 Band1 TX Power UHF2 Band2 TX Power UHF2 Band3 TX Power 700 MHz TX Power 800 MHz 6.3 6.4 6.5 Deviation Balance Distortion Sensitivity (SINAD) 6.6 6.7 Noise Squelch Threshold P25 Tx Tests 6.8 Digital Sensitivity (BER) 6.9 Voice Modulation Deviation Balance Distortion Sensitivity VHF Sensitivity UHF1 Sensitivity UHF2 Sensitivity 700-800MHz Noise Squelch Modulation Fidelity Symbol Deviation BER VHF BER UHF1 BER UHF2 BER 700-800MHz Voice Modulation Default Value Min= -150 Hz Max= 150 Hz Min= -150 Hz Max= 150 Hz Min= -150 Hz Max= 150 Hz Min= -100 Hz Max= 100 Hz Min= -2 ppm Max= 2 ppm Min= -2 ppm Max= 2 ppm Min= -2 ppm Max= 2 ppm Min= -1.5 ppm Max= 1.5 ppm Min= 50 W Max= 57 W Min= 100 W Max= 120 W Min= 40 W Max= 48 W Min= 100 W Max= 120 W Min= 45 W Max= 55 W Min= 40 W Max= 48 W Min= 24.5 W Max= 30.5 W Min= 31.5 W Max= 34.7 W Min= 36.6 W Max= 40.5 W Max= 1 % Max= 3 % Max= -117.4 dBm Max= -117.4 dBm Max= -117.4 dBm Max= -119 dBm Max= -116 dBm Max=5% Min=1620 Hz Max=1980 Hz Max= -117.4 dBm Max= -117.4 dBm Max= -117.4 dBm Max= -119 dBm Min= 4.1 kHz Max= 5.0 kHz Table A-2. Default mobile test limits. A-3 AutoTune™ User Guide APPENDIX B. Sample Test Result Report ================================================================================= Test Result Report ================================================================================= Model #: M30TSS9PW1AN Date/Time: 6/18/2012 4:33 PM Serial #: 656CMF3277 Operator ID: A. Technician Comments: Reference Frequency Test ========================= Result Frequency Freq Error ----------------------Pass 469.9875 MHz 3 Hz Min Limit ---------470 Hz Max Limit --------470 Hz TX Power Out Test ================== Result Frequency -------------Pass 136.0125 MHz Pass 140.7625 MHz Pass 145.5125 MHz Pass 150.2625 MHz Pass 154.9875 MHz Pass 155.0125 MHz Pass 159.7625 MHz Pass 164.5125 MHz Pass 169.2625 MHz Pass 173.9875 MHz Pass 380.0125 MHz Pass 389.0125 MHz Pass 405.0125 MHz Pass 415.0125 MHz Pass 424.9875 MHz Pass 425.0125 MHz Pass 440.0125 MHz Pass 455.0125 MHz Pass 465.0125 MHz Pass 469.9875 MHz Power Out --------56.7 W 56.2 W 56.4 W 56.9 W 56.0 W 56.6 W 56.2 W 56.2 W 56.2 W 56.8 W 45.1 W 45.6 W 45.0 W 45.1 W 45.1 W 45.1 W 44.9 W 44.5 W 44.1 W 44.5 W Min Limit --------50.0 W 50.0 W 50.0 W 50.0 W 50.0 W 50.0 W 50.0 W 50.0 W 50.0 W 50.0 W 40.0 W 40.0 W 40.0 W 40.0 W 40.0 W 40.0 W 40.0 W 40.0 W 40.0 W 40.0 W Max Limit --------57.0 W 57.0 W 57.0 W 57.0 W 57.0 W 57.0 W 57.0 W 57.0 W 57.0 W 57.0 W 48.0 W 48.0 W 48.0 W 48.0 W 48.0 W 48.0 W 48.0 W 48.0 W 48.0 W 48.0 W Deviation Balance Test ======================= Result Frequency -------------Pass 469.9875 MHz Pass 465.0125 MHz Pass 455.0125 MHz Pass 440.0125 MHz Pass 425.0125 MHz Pass 424.9875 MHz Pass 415.0125 MHz Pass 405.0125 MHz Pass 389.0125 MHz Pass 380.0125 MHz Pass 173.9875 MHz Pass 169.2625 MHz Pass 164.5125 MHz Pass 159.7625 MHz Pass 155.0125 MHz Pass 154.9875 MHz Pass 150.2625 MHz Pass 145.5125 MHz Pass 140.7625 MHz Pass 136.0125 MHz Low Tone -------2.976 kHz 2.975 kHz 2.975 kHz 2.975 kHz 2.976 kHz 2.977 kHz 2.976 kHz 2.976 kHz 2.975 kHz 2.974 kHz 2.969 kHz 2.970 kHz 2.971 kHz 2.970 kHz 2.969 kHz 2.971 kHz 2.972 kHz 2.969 kHz 2.973 kHz 2.972 kHz High Tone --------2.979 kHz 2.980 kHz 2.981 kHz 2.975 kHz 2.979 kHz 2.979 kHz 2.979 kHz 2.979 kHz 2.977 kHz 2.986 kHz 2.973 kHz 2.980 kHz 2.977 kHz 2.973 kHz 2.966 kHz 2.979 kHz 2.979 kHz 2.973 kHz 2.975 kHz 2.970 kHz Variance -------0.1 % 0.2 % 0.2 % 0.0 % 0.1 % 0.1 % 0.1 % 0.1 % 0.1 % 0.4 % 0.1 % 0.3 % 0.2 % 0.1 % -0.1 % 0.3 % 0.2 % 0.2 % 0.0 % -0.1 % Distortion Test ================ Result Frequency -------------Pass 136.0625 MHz Pass 380.0625 MHz Distortion ---------1.1 % 1.3 % Max Limit --------3.0 % 3.0 % Sensitivity (SINAD) Test ========================= Result Frequency 12dB SINAD ----------------------Pass 136.0625 MHz -120.1 dBm Pass 380.0625 MHz -119.2 dBm Max Limit ---------117.4 dBm -117.4 dBm Noise Squelch Threshold Test ============================= Result Frequency Unsquelch ---------------------Pass 136.0625 MHz -118.8 dBm Pass 380.0625 MHz -117.4 dBm Max Limit ---------116.0 dBm -116.0 dBm Digital Sensitivity (BER) Test =============================== Result Frequency 5% BER ------------------Pass 136.0625 MHz -119.8 dBm Pass 380.0625 MHz -119.3 dBm Max Limit ---------117.4 dBm -117.4 dBm Voice Modulation Test ====================== Result Frequency -------------Pass 136.0125 MHz Min Limit --------4.100 kHz Deviation --------4.233 kHz Softpot ------1186 Max Limit --------+/-1.0 % +/-1.0 % +/-1.0 % +/-1.0 % +/-1.0 % +/-1.0 % +/-1.0 % +/-1.0 % +/-1.0 % +/-1.0 % +/-1.0 % +/-1.0 % +/-1.0 % +/-1.0 % +/-1.0 % +/-1.0 % +/-1.0 % +/-1.0 % +/-1.0 % +/-1.0 % Softpot ------18226 18608 19267 19677 18773 18723 19458 20018 19944 19080 23485 22075 20996 21080 23806 23718 22039 20596 20788 24093 Max Limit --------5.000 kHz Tests performed by AutoTune - © 2012 Freedom Communication Technologies. All Rights Reserved. Figure B-1. Sample Test Result Report B-1 AutoTune™ User Guide APPENDIX C. Revision History 1.18 Updates – Rev B Original Release – Rev A Rev. No/change L. Shirey B. Tanner Revised By 1/26/15 7/30/12 Date M. Mullins M. Mullins Approved By 1/26/15 7/30/12 Date 14473 12691 ECO# C-1