1
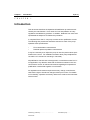
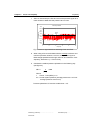
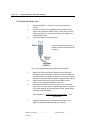
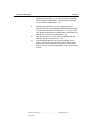
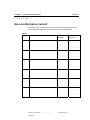
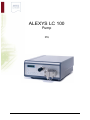
ALEXYS LC 100
Pump
PQ
Edition 1, 2006
182.0027
Table of contents
1 (of 17)
Identification
The undersigned engineer certifies that he/she is trained and qualified to
perform an PQ on the LC 100 pump.
Performer:
Name
Signature
Initials
Company
Title:
(Anted Leyden representative trained and qualified to perform PQ procedures)
The undersigned reviewer/customer accepts that the above-mentioned
engineer is trained and certified to do PQ/OQ on all Antec Equipment.
Reviewer/
Customer:
Name
Signature
Company:
Title:
(Owner-designated authorized person)
Verified by (customer): …………………………..
Comments:
Deviations (Y/N): ……
Initials
2 (of 17)
PQ procedure LC 100 pump, edition 1
Instrument
LC 100
Pump head
Manufacturer
p/n:
s/n:
Analytical / Micro
Antec Leyden
Supplier
Date of delivery
Warranty until
Test equipment
AC 100
Part number
Serial number
Calibration date
or
Line recorder
Model
Serial number
Calibration date
Flow meter
Model
Serial number
Calibration date
ALEXYS data system
Revision
Verified by (customer): …………………………..
Comments:
Deviations (Y/N): ……
Table of contents
3 (of 17)
Table of contents
Identification 1
Instrument 2
Test equipment 2
Table of contents 3
Introduction 5
PQ for LC 100 pump 7
Test configuration 7
Pressure pulsations test 8
Flow rate deviation test 12
PQ certification 15
Comments 16
Non-conformance record 17
Verified by (customer): …………………………..
Comments:
Deviations (Y/N): ……
4 (of 17)
PQ procedure LC 100 pump, edition 1
Verified by (customer): …………………………..
Comments:
Deviations (Y/N): ……
Chapter 1
Introduction
C H A P T E R
5 (of 17)
1
Introduction
This document describes the Operational Qualification procedure as advised by the manufacturer. It is a result from our interpretation of many
regulations and laboratory practises. In addition, feedback from users and
representatives helped us to finalize this procedure.
A complete PQ for the LC 100 pump consists of two qualification checks.
The following test procedures should be executed to check if the pump
operates within specifications:
•
•
Flow rate deviation measurement
Residual pressure pulsation measurement
It may be necessary to re-adjust the pump in case the performance specifications are not met. For detailed information about pump readjustment
consult the LC 100 service manual (p/n 182.0020).
All qualification checks have to be approved, or should be marked "n/a" if
not applicable. Any deviation observed must be documented in the 'nonconformance' record. All relevant documents regarding this operational
qualification must be filed together in one location.
As regulations and customer requirements may change, manufacturer
reserves the right to introduces changes without prior notice. For details
on functionality, operation and theory reference is made to the instrument
users manual.
Verified by (customer): …………………………..
Comments:
Deviations (Y/N): ……
6 (of 17)
PQ procedure LC 100 pump, edition 1
Verified by (customer): …………………………..
Comments:
Deviations (Y/N): ……
Chapter 2
PQ for LC 100 pump
C H A P T E R
7 (of 17)
2
PQ for LC 100 pump
Test configuration
Mobile phase
Piston wash
Capillary
Flow meter
P
P signal
Pmonitor
kappa
Degassed & filtered HPLC-grade water
HPLC-grade water
1/16” PEEK restriction capillary (127 um I.D)
calibrated flowmeter or
graduated analytical pipette & stopwatch
system pressure between 100 - 200 bar
Analog pressure output of the pump monitored
using an AC 100 and ALEXYS data system software, sampling frequency 10 Hz, or line-recorder
LC 100 time constant: high (2 sec)
45 (compressibility)
PC
AC 100
Restriction
Capillary
Pressure signal
Time const 2s,
Fsampling 10 Hz
Flowmeter
waste
Pump
Degasser
0.2 um filter
HPLC-grade water
Fig. 1. Test set-up for measuring flow rate deviation & pressure pulsation.
Before running a PQ test the pump should be running for at least 5
minutes under the specified test conditions.
Verified by (customer): …………………………..
Comments:
Deviations (Y/N): ……
8 (of 17)
PQ procedure LC 100 pump, edition 1
All tests described in the PQ procedure are based on a LC 100 with analytical pump head. In case of a LC 100 with micro pump head all flow rates
mentioned in the tests should be changed accordingly. The flow rate of the
micro head should correspond to the same flow rate in % FS (Full Scale)
as the analytical pump head. The PQ tests are performed at 20 and 40%
FS which corresponds to the following flow rates:
Analytical
Micro
20 % FS
1 mL/min
200 μL/min
40 % FS
2 mL/min
400 μL/min
Pressure pulsations test
Before starting the Pressure pulsation test download the latest version of
the zip file "LC100_P-test_revxx.zip" from the Antec web site at
http://www.antecleyden.com/. The zip file contains ALEXYS system and
method files to perform the test, and an Excel worksheet "LC100_Ptest_revxx.xls" were the residual pressure pulsation is calculated automatically. Store the ALEXYS system and method files in the corresponding
directories in the ALEXYS program files directory.
1.
2.
3.
4.
5.
6.
Open the ALEXYS system file "LC100_P-test_xxxyy.smt".
Connect AC 100 (controlled by ALEXYS software) to the analogue pressure monitor (1mV/MPa) to monitor the pump pressure .
Set the compressibility Kappa to 45.
Set TIME CONST. to HIGH (2s).
Set pump to REMOTE.
Start run in Alexys. Subsequently a run will start of 15 minutes. The first 10 minutes the pressure signal is monitored at a
flow rate 1 mL/min. After 10 minutes the flow is stopped automatically. The program will continue measuring for 5 minutes
in order to determine the pressure at 0 mL/min. A typical pressure profile obtained with such test is shown in figure 2.
Verified by (customer): …………………………..
Comments:
Deviations (Y/N): ……
PQ for LC 100 pump
9 (of 17)
10
c
8
Pressure (MPa)
Chapter 2
6
a-b
4
2
0
0
5
10
15
Time (min)
Fig 2. Calculation of pressure pulsations %P.
7.
8.
Export the Pressure data to ASCII in ALEXYS using the option
"export raw data to txt" in the file menu. Do not include the retention time for export, only the pressure data.
Open the generated txt file and select all Pressure data. Subsequently, copy the data into the second column "pressure
(MPa)" in the Excel worksheet "LC100_P-test_revxx.xls"
Fig 3. Spread sheet to calculate the Residual P pulsations (%P).
Verified by (customer): …………………………..
Comments:
Deviations (Y/N): ……
10 (of 17)
PQ procedure LC 100 pump, edition 1
The Residual P pulsations (%P) will be automatically calculated in
the Excel worksheet:
Fig 4. Example of results Residual P pulsations.
Pressure pulsations %P must be smaller than < 3%.
9.
If the instrument fails test, first check for leakage or air in system, if pump head is assembled correctly and all critical parts
(check valves, pistons etc.) are in tact . If the problem remains
consult the test & readjustment section in the service manual.
When using a line-recorder to record the pressure profile, please follow
the procedure below to determine the residual pressure pulsations:
1. Connect a line-recorder to the analogue pressure monitor
(1mV/MPa) to monitor the pump pressure .
2. Set the compressibility Kappa to 45.
3. Set TIME CONST. to HIGH (2s).
4. Set the flow rate to 1 mL/min.
5. Press <R/S> to start the pump.
6. Record the pressure signal for 10 minutes via the pressure monitor output at 1 mL/min.
Verified by (customer): …………………………..
Comments:
Deviations (Y/N): ……
PQ for LC 100 pump
11 (of 17)
7. After 10 minutes stop the flow and record the pressure signal for 5
more minutes to determine the pressure at 0 mL/min.
Pressure pulsations
14.5
14.45
14.4
Pressure (MPa)
Chapter 2
14.35
Average
Pmax
14.3
14.25
14.2
14.15
Average
Pmin
14.1
14.05
14
5
6
7
8
9
10
time (min)
Fig. 5. Pressure signal with lines indicating Pmax and Pmin.
8. When using a line recorder determine the average maximum and
minimum pressure values at 1 mL/min, as depicted in figure 5 .
Draw straight parallel lines through minimum and maximum. Subsequently, determine c (c = Pmax-Pmin).
9. Calculate the residual pressure pulsations in the following way
(see figure 2):
%P =
c
* 100
(a-b)
Where:
c = Pmax - Pmin (MPa) or 4σ .
a-b = Actual system pressure (average pressure at 1 mL/min average pressure at 0 mL/min)
Pressure pulsations %P must be smaller than < 3%.
Verified by (customer): …………………………..
Comments:
Deviations (Y/N): ……
12 (of 17)
PQ procedure LC 100 pump, edition 1
Flow rate deviation test
1.
2.
3.
Set the flow rate to 1 mL/min and check if purge valve is
closed.
Connect the inlet of the graduated analytical pipette to the
outlet of the restriction capillary using a short piece of silicon
tubing (see figure 6). Or connect the restriction capillary to a
calibrated flow meter.
Press <Run/Stop> to start the pump.
Correct volume reading from the
pipette is at the lowest point of the
meniscus.
Fig. 6. Flow measurement with graduated 5 mL pipette.
4.
5.
6.
Measure the flow rate with the pipette using the following
procedure: start the stopwatch exactly at the moment that the
liquid meniscus in the pipette passes the 4 mL line (for a good
reading it is important that the pipette is kept perfectly vertical).
Stop the flow rate exactly at the moment that the liquid
meniscus in the pipette passes the 0 mL line.
Calculate the actual flow rate. Flow rate = 4 mL/ stopwatch
time (min). In case of using a calibrated flow meter complete 5
flow meter readings and calculate the average. Subsequently
calculate the flow deviation:
Flow deviation % = (actual flowrate - set flow rate) * 100
set flow rate
7.
Repeat the flow deviation measurement three times, the
Relative Standard Deviation (RSD) of a triplicate
Verified by (customer): …………………………..
Comments:
Deviations (Y/N): ……
PQ for LC 100 pump
13 (of 17)
measurement should be < 1 %. If this is not the case please
repeat all three measurements. The average flow deviation
(n=3) should be smaller than +/- 3%.
8.
9.
10.
Repeat this experiment at 2 mL/min. Measure the flow
deviation three times, the Relative Standard Deviation (RSD)
of a triplicate measurement should be < 1 %. If this is not the
case please repeat all three measurements. The average flow
deviation (n=3) should be smaller than +/- 3%.
Also at a flow rate of 2 mL/min perform a triplicate the flow
deviation should be smaller than +/- 3%.
If the instrument fails test, first check for leakage or air in
system, if pump head is assembled correctly and all critical
parts (check valves, pistons etc.) are in tact . If the problem
remains consult the test & readjustment section in the service
manual.
Verified by (customer): …………………………..
Comments:
Deviations (Y/N): ……
14 (of 17)
PQ procedure LC 100 pump, edition 1
Verified by (customer): …………………………..
Comments:
Deviations (Y/N): ……
Chapter 4
PQ certification
C H A P T E R
15 (of 17)
4
PQ certification
The Operational Qualification has been carried out in accordance to the
PQ procedure and has been carried out to the satisfaction of both parties.
All tests as described in this document have been successfully completed,
and all results are within specifications.
Test results
Spec
Measured
Result
Pressure pulsations at 20% FS
<3%
%
passed
failed
Flow deviation at 20% FS
<3%
%
passed
failed
Flow deviation at 40% FS
<3%
%
passed
failed
Executing technician
Technician name &
signature
…………………………...
……………………..….
Company
Date
Customer (authorised to sign)
Name & signature
…………………………...
……………………..….
Company/dept.
Date
Verified by (customer): …………………………..
Comments:
Deviations (Y/N): ……
16 (of 17)
PQ procedure LC 100 pump, edition 1
Comments
Verified by (customer): …………………………..
Comments:
Deviations (Y/N): ……
Chapter 5
Non-conformance record
C H A P T E R
17 (of 17)
5
Non-conformance record
Any case of non-conformance found during the PQ procedure should be
documented and signed for acceptance or corrective action taken.
Table I
Ref.
Non-conformance and action taken
Signature
customer
Sign. executing
technician
1
………………… …………………
2
………………… …………………
3
………………… …………………
4
………………… …………………
5
………………… …………………
6
………………… …………………
Verified by (customer): …………………………..
Comments:
Deviations (Y/N): ……