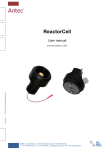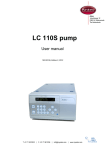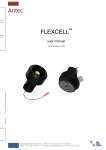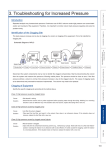
1
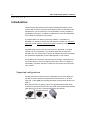
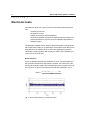
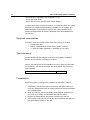
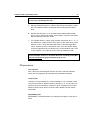
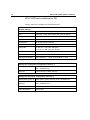
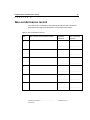
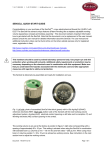
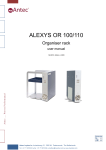
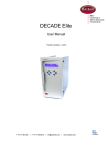
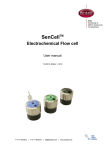
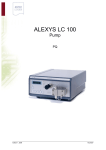
Antec BV Industrieweg 12 2382 NV Zoeterwoude The Netherlands PQ for HPLC-ECD systems (carbohydrates) 180.0029, Edition 4, 2014 T +31 71 5813333 | F +31 71 5813334 | [email protected] | www.myantec.com Copyright ©2015, Antec, The Netherlands. Contents of this publication may not be reproduced in any form or by any means (including electronic storage and retrieval or translation into a foreign language) without prior agreement and written consent from the copyright of the owner. The information contained in this document is subject to change without notice. ROXY, ALEXYS, DECADE, DECADE II, DECADE Elite, INTRO, Flexcell, SenCell, ISAAC, HyREF are trademarks of Antec. Whatman™ (word and device) and Whatrnan™ (word only) are trademarks of Whatman lnternational Ltd. SOLVENT IFD™ and AQUEOUS IFD™ are trademarks of Arbor Technologies, Inc. Clarity®, DataApex® are trademarks of DataApex Ltd. Microsoft® and Windows™ are trademarks of Microsoft Corporation. Excel is a registered trademark of the Microsoft Corporation. The software and the information provided herein is believed to be reliable. Antec shall not be liable for errors contained herein or for incidental or consequential damages in connection with the furnishing, performance, or use of software or this manual. All use of the software shall be entirely at the user’s own risk. Chapter 1 Table of contents 1 Table of contents Table of contents..................................................................................... 1 Chapter 1 .................................................................................................... 2 Introduction ............................................................................................. 2 Supported configurations ........................................................................ 2 Chapter 2 .................................................................................................... 3 Identification ............................................................................................ 3 Engineer .................................................................................................. 3 Reviewer/customer ................................................................................. 3 Instruments ............................................................................................. 4 Test materials.......................................................................................... 5 Test devices ............................................................................................ 5 Chapter 3 .................................................................................................... 6 Electronic tests ........................................................................................ 6 Required tools ......................................................................................... 7 Dummy cell test....................................................................................... 7 Analogue output test ............................................................................... 8 Chapter 4 .................................................................................................... 9 HPLC performance test .......................................................................... 9 Test parameters ...................................................................................... 9 Configuration ........................................................................................... 9 Required consumables ......................................................................... 10 Test substance ...................................................................................... 10 Preparations .......................................................................................... 10 PQ procedure ........................................................................................ 11 HPLC-ECD test conditions for PQ ........................................................ 12 Processing PQ results .......................................................................... 13 Recalculation of signal units from mV to nA ......................................... 13 Chapter 5 .................................................................................................. 14 PQ results summary ............................................................................. 14 Chapter 6 .................................................................................................. 15 PQ certification ...................................................................................... 15 Chapter 7 .................................................................................................. 16 Comments ............................................................................................. 16 Chapter 8 .................................................................................................. 17 Non-conformance record ...................................................................... 17 2 PQ for HPLC-ECD systems, edition 4 C H A P T E R 1 Introduction This document describes the Performance Qualification (PQ) for HPLC systems with an Antec electrochemical detector (ECD) as advised by the manufacturer. It is the result from our interpretation of many regulations and laboratory practices. In addition, feedback from users and representatives helped us to finalize this procedure. A complete PQ for an HPLC system with a ROXY™, DECADE II™, DECADE™ or INTRO™ electrochemical detector consists of an electronic noise test, and a detection performance test by analyzing a standard solution. All qualification checks in this document must be approved, or must be marked "n/a" if not applicable. Any deviation observed must be documented in the 'non-conformance' record. All relevant documents regarding this operational qualification must be filed together in one location. As regulations and customer requirements may change, manufacturer reserves the right to introduce changes without prior notice. For details on functionality, operation and theory references are made to the instrument user manual. Supported configurations The PQ procedure in this document is applicable for an HPLC-ECD system with an Antec electrochemical detector and Flexcell or VT-03 flow cells (Fig. 1) with gold (Au) working electrodes running under alkaline conditions. Note: PQ procedure on glassy carbon and gold electrodes under acidic conditions is described in document 180_0028. Working electrode material other than Au or GC are not supported with PQ procedures. Fig. 1. Flexcell (left) and VT-03 cell (right). Chapter 2 Identification C H A P T E R 3 2 Identification Engineer The undersigned engineer certifies to be trained and qualified to perform PQ on Antec instruments. Company: Performer: Name Initials Title: Signature: Reviewer/customer The undersigned reviewer/customer accepts that the above-mentioned engineer is trained and qualified to perform a PQ on Antec instruments. Company: Reviewer/Customer: Name Title: Signature: (Owner-designated authorized person) Initials 4 PQ for HPLC-ECD systems, edition 4 Instruments Device p/n s/n* Pump Autosampler/injector Electrochemical detector Flow cell (with Au WE) Reference electrode Acquisition software & version *s/n: entering more than one s/n is allowed if more than one unit is used. Others Verified by (customer): ………………………….. Comments: Deviations (Y/N): …… Chapter 2 Identification 5 Test materials Glucose solution Mobile phase Test devices Device p/n s/n Dummy cell Volt meter or AD signal Verified by (customer): ………………………….. Comments: Deviations (Y/N): …… 6 C H A P T E R PQ for HPLC-ECD systems, edition 4 3 Electronic tests The electronic tests use a dummy cell and checks the following parameters: - electronic noise level - background current - stability of the electrochemical detector - temperature stability (resistor and capacitor that both require constant temperature to meet the noise and stability specifications) - analogue output The Dialogue software can be used for automated testing, and will generate a report with results. As an alternative, the acquired noise data can be evaluated in Excel. Details can be found in the appendixes document 180.0028C). Data acquisition with exactly the same noise evaluation procedure can be used as well. Noise definition There are different methods for calculation of noise. The specifications in this document are based on the following method. The noise level is the average of 30 peak to peak noise measurements over a period of 30 s (total of 15 min), as given in the following formula and visualized in Fig. 2: Noise = n1 n2 n3 ................. n30 30 Fig. 2. Noise measurement on a baseline trace. Chapter 3 Electronic tests 7 Required tools Part no Description 171.9005 Dialogue™ PQ software (with noise_template.xlt(m)) and Microsoft Excel 2003 or newer or alternative Data acquisition software 250.0040 Dummy cell (part of detector accessories; one per cell) 250.0128 Output cable (part of detector accessories) AD convertor or calibrated voltmeter Dummy cell test Preparations Before running the test make sure the system has stabilized for more than an hour with a dummy cell installed and ON, at the right temperature, working potential E, and range setting (see Setting below in Table I. Settings Table I. Dummy cell test settings. Parameter Cell potential Oven Zero Filter Range Acquisition Output test Setting 800 mV 35 °C for at least 1 hour ON/SET First available filter setting (0.1 s, or 0.5 Hz) 100 pA Data rate < 10 Hz INTRO/DECADE: REC output DECADE II or ROXY: Output Procedure 1. For detailed instructions on running a Dummy cell test with Dialogue software, or how to use the noise template see the Appendixes document (180.0028C). 2. Make sure the system has stabilized for at least one hour before running the test. 8 PQ for HPLC-ECD systems, edition 4 3. Measure the noise during 15 minutes. Acquisition frequency must be set to less than 10 Hz. 4. Read the cell current from the display (I cell) 5. Enter the results of the Dummy cell test in the PQ results table on page 13. Analogue output test The analogue output of the detector is tested by measuring the difference in output signal from a dummy cell with the working potential switched off (zero level) and on. The measurement is taken from the rear panel Output connector, which is either connected to some software through an AD convertor or alternatively measured with a calibrated voltmeter. 1. Use the settings from Table I, but set the detector range to 5 nA/V and set the auto zero and compensation to off. 2. Measure the analogue output with cell off. 3. Switch on the cell and measure the analogue output. 4. Calculate the difference in output voltage measured with ‘Cell on’ and ‘Cell off’ (Fig. 3). 5. Enter the results of the Analogue output test in the PQ results table on page 13. Fig. 3. Measuring output with dummy cell off and on at 5 nA/V, for other settings see Table I. If passed: continue with the HPLC analysis. If failed: follow maintenance procedures, check knowledge base on our website, or contact your supplier. Chapter 4 HPLC performance test C H A P T E R 9 4 HPLC performance test For a successful performance test it is important that the HPLC-EC system has been optimized and is in top condition. The system must be installed as described in the user manual. Test parameters Parameters to characterize and check the performance of a system are repeatability, linearity and responsiveness. Configuration For testing the performance of an HPLC system with an Antec electrochemical detector in PAD mode on a gold working electrode under alkaline conditions, the column from the HPLC system is replaced by an assembly of restriction and mixer capillary tubing (Fig. 4). A kit containing the test substance as well as the parts between injector and cell can be ordered under pn. 250.3044 (PQ for HPLC/ECD kit, carbohydrates). Configuration with second post-column addition pump Configuration with single pump Fig. 4. For PQ, the analytical column is replaced by an assembly of 3 m PEEK tubing with ID of 125 um and 10 m PEEK tubing with ID of 500 um. 10 PQ for HPLC-ECD systems, edition 4 Two hardware configurations are supported (Fig. 4): - HPLC with single pump - HPLC with secondary pump for post-column addition. In case of performing the PQ procedure on an ALEXYS system with Clarity software, pre-configured method files are available on our website. Detailed description of performing a PQ using the Clarity software can be found in the appendixes document (180.0028C, also downloadable from our website). Required consumables To perform a PQ, the following items have to be present on location: Autosampler vials Sodium hydroxide 50% solution (HPLC-grade or better) 1 L ultra-pure water (resistivity > 18 MOhm.cm, low TOC) Test substance The test is based on the analysis of Glucose under alkaline conditions. Prepare the test solution according to the label. Table 2. Reordering info for test substance for PQ on gold cell under alkaline conditions. This item is part of pn. 250.3044 (PQ for HPLC/ECD kit, carbohydrates). Glucose for PQ 250.1067 Preparations Set up the system according to the conditions as indicated in Table 3. 1. If necessary, first flush all system components with pure water to remove any storage liquid such as organic solvents to avoid precipitation of the mobile phase. 2. Clean the flow cell (see user manual), polish the gold electrode if the gold color is not visible, and assemble with a 50 µm spacer. 3. Prepare the mobile phase, and flush the system up to the cell 4. Connect the cell and ensure it is air-free and completely filled with mobile phase before turning on the cell. Chapter 4 HPLC performance test 11 Do not turn the cell on when mobile phase is not yet flowing through the cell. This can damage the cell! 5. Set the conditions as given in Table 3 and wait for the system to stabilize until a stabile baseline is obtained before starting the PQ HPLC tests. 6. Dissolve the Glucose in 3 mL of mobile phase (abbreviated as MP) prior to use, to make a 20 mmol/L stock solution. Close the vial, shake well, and dilute this solution 1000x. 7. For example dilute in 3 steps: mark 3 empty vials clearly as “1”, “2”, “3” and add 900 µL mobile phase to each of the 3 vials. Add 100 µL stock solution in vial 1, close and shake well. With a new clean pipet take 100 µL solution from vial 1 and add to vial 2, close and shake. With a new clean pipet take 100 µL solution from vial 2 and add to vial 3. Vial 3 now contains 1 mL of the 20 µmol/L Glucose standard for PQ. The PQ standard solution is 20 µmol/L Glucose in mobile phase (MP). Dissolve and dilute the glucose powder prior to use. PQ procedure Test injection Run a single test chromatogram with the 20 µmol/L Glucose standard. Check the chromatogram, and optimize the automated integration. Linearity test Linearity is checked based on a 5-point calibration. The correlation coefficient can be based on different injection volumes (5, 10, 15, 20 and 25 uL injections of the test solution), or based on 20 uL injections from manual dilutions (20:80, 40:60, 60:40, 80:20 and 100:0 dilutions of test solution with water). Repeatability test Repeatability is evaluated based on 8 subsequent analyses of the test solution. 12 PQ for HPLC-ECD systems, edition 4 HPLC-ECD test conditions for PQ Table 3. HPLC-EC conditions for PQ using Glucose. General settings Column Capillary restrictor tubing (see Fig. 4) Cell Flexcell or VT-03, gold vs Hyref with a 50 µm spacer, Sample 20 µmol/L Glucose in mobile phase (MP) Injection volume 20 µL Temperature 35 °C (flow cell and column) Integrator Data acquisition frequency: < 5 Hz PAD mode E1, E2, E3 = 150, 750, -800 (mV) t1, t2, t3, ts = 500, 130, 120, 20 (ms) Range 1 µA Other settings Offset 0 %; Filter Off Indicative parameters Icell is about 0.5 - 1.5 µA; noise is about 3 - 6 nA Settings for single pump configuration (see Fig. 4) Mobile phase 100 mM NaOH (water should be HPLC grade, low TOC, and > 18 MOhm.cm) Flow rate 1.50 mL/min (P = about 100 bar) Settings for two pumps configuration (see Fig. 4) Mobile phase (pump 1) Water (HPLC grade, low TOC, and > 18 MOhm.cm) Post-column solution (pump 2) 300 mM NaOH (water should be HPLC grade, low TOC, and > 18 MOhm.cm) Flow rate pump 1 1.00 mL/min Flow rate pump 2 0.50 mL/min Chapter 4 HPLC performance test 13 Processing PQ results The PQ procedure results in 5 chromatograms for calculation of linearity and 8 chromatograms for calculation of repeatability. 1. Analyze the chromatograms and create reports containing retention time, peak heights and peak areas. 2. Based on the data from the repeated chromatograms (n=8), calculate the average values and the relative standard deviation as percentage of the average (%RSD). 3. Based on the data from the 5 chromatograms for calculation of linearity, calculate the correlation coefficient between peak area and concentration or injection volume. 4. Write down the results in the PQ results table on page 14. If the final result of the HPLC PQ procedure is ‘failed’, beware that it is not necessarily related to the detector. Contact your supplier in case you need support with troubleshooting. To avoid clogging of the restrictor tubing, flush it with water after use. When flushing the system SWITCH OFF THE CELL! Recalculation of signal units from mV to nA If the signal from the detector is acquired with an AD convertor, the associated units are generally mV. Use the range setting and the following formula to convert to current-units: Signal (nA) = range (µA /V) * Signal (mV) For example, at the 2 µA/V range, a signal of 300 mV would be: Signal = 2 µA /V * 300 mV = 600 nA Use the proper unit: multiply V output with range if necessary! Note: in case of using the Clarity software with the Antec device drivers, this will give signal directly in current units (nA or µA). 14 C H A P T E R PQ for HPLC-ECD systems, edition 4 5 PQ results summary Electronic test results and HPLC test results Specified Measured Result** ELECTRONIC TESTS Dummy cell test Current (I-cell) 2.67 ± 0.05 nA ……. nA …………. Noise p-p Analog output test < 2.0*** pA ……. pA …………. 530 ± 10 mV ……. mV …………. Output at 5 nA/V HPLC TESTS Signal Height (VT-03*) > 50 nA ……. nA …………. Height (Flexcell*) > 100 nA ……. nA …………. < 3.0 % ……. % …………. Repeatability %RSD area Linearity Correlation coefficient r > 0.997 ……. …………. * In case of using a VT-03 cell check the Flexcell as n/a and vice versa. ** fill in ‘passed’ or ‘failed’ *** ROXY noise p-p spec: < 3 pA Final result (passed / failed) _________________________ Verified by (customer): ………………………….. Comments Deviations (Y/N): …… Chapter 6 PQ certification C H A P T E R 15 6 PQ certification The Performance Qualification (PQ) tests were carried out in accordance with the PQ procedure and have been carried out to the satisfaction of both parties. All tests as described in this document have been successfully completed, and all results are within specifications. Antec Leyden representative Company ……………………………………………………… Performer ……………………………………………………… ……………… ……………..…………… Date Signature Customer (authorized to sign) Company & Dept. ……………………………………………………… Reviewer/Customer ……………………………………………………… ……………… ……………..…………… Date Signature 16 C H A P T E R Comments PQ for HPLC-ECD systems, edition 4 7 Chapter 8 Non-conformance record C H A P T E R 17 8 Non-conformance record Any case of non-conformance found during the PQ procedure should be documented and signed for acceptance or corrective action taken. Table 4. Non conformance record. Ref. Non-conformance and action taken Signature customer Sign. executing engineer 1 ………………… ………………… 2 ………………… ………………… 3 ………………… ………………… 4 ………………… ………………… 5 ………………… ………………… 6 ………………… ………………… Verified by (customer): ………………………….. Comments: Deviations (Y/N): …… 18 PQ for HPLC-ECD systems, edition 4