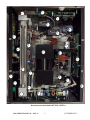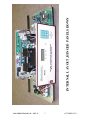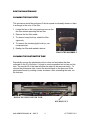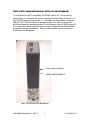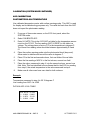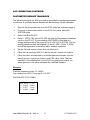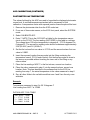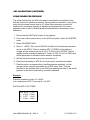
1
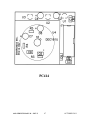
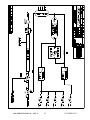
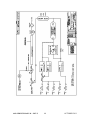
Model 6103 OZONE TRANSFER STANDARD MULTI-GAS CALIBRATOR Service Manual Rev 5 14OCTOBER2011 Software rev. 1.37-XX Environics, Inc. 69 Industrial Park Road East Tolland, CT 06084-2805 USA Phone (860) 872-1111 Fax (860) 870-9333 www.environics.com OCTOBER 2011 6103 Service manual changes Manual Software Revision Revision # # Manual Release Date 1 2 3 1.31-03 1.33-01 1.35-02 11/5/2002 4/15/2003 9/12/2003 4 5 1.37-01 1/9/09 10/14/11 Enhancements Initial release Added this page to log changes, changed software Revision on cover page. Modified ozone calibration procedure to account for automatic pump control. Also, ozone calibration procedure is now done in the calibrate ozone mode Versus the flow mode. Changed range for samp/ref intensities to 500K - 850K Updated MFC3 (optional) calibration information Updated Ozone calibration procedure 6103 SERVICE MANUAL – REV 5 i OCTOBER 2011 SERVICE MANUAL TABLE OF CONTENTS FEATURE PAGE INTERNAL LAYOUT 1-3 PERIODIC MAINTENANCE Cleaning the fan filter Cleaning the photometer tube Leak test Adjusting photometer REF/SAMP intensities 4-6 4 4 5 6 SYSTEM MODE (SYSTEM CALIBRATION) MFC flow calibration procedure Flow verify MFC individually Photometer calibration Ozone generator calibration ADC calibrations ADC 04, photometer block temperature ADC 06, photometer gas pressure ADC 07, photometer gas temperature ADC 11, ozone generator pressure ADC 13, ozone block temperature Password protection 7-19 7, 8 9 10, 11 12, 13 14-18 14 15 16 17 18 19 PCB FUNCTION AND TEST POINTS 20-28 TROUBLESHOOTING 29-38 TEST POINT WAVEFORMS 39, 40 PCB ASSEMBLY DRAWINGS 42-48 PCB SCHEMATICS 49-57 P&ID (PIPING AND INSTRUMENTATION DIAGRAM) 58 P&ID (WITH OPTIONAL MFC3) 59 6103 SERVICE MANUAL – REV 5 ii OCTOBER 2011 LIST OF ILLUSTRATIONS ILLUSTRATION TITLE PAGE # Internal layout (Standard 6103 With 2 MFCs) Internal layout, hinged panels down Fan filter assembly Removing photometer tube MFC illustration drawing Power cable Piping and instrument diagram Piping and instrument diagram (w/optional MFC3) 6103 SERVICE MANUAL – REV 5 iii 1 3 4 4 9 41 58 59 OCTOBER 2011 13 16 22 15 17 7 9 6 23 19 12 4 21 10 3 11 5 14 8 24 2 20 18 1 Internal layout (Standard 6103 With 2 MFCs) 6103 SERVICE MANUAL – REV 5 1 OCTOBER 2011 INTERNAL LAYOUT (STANDARD 6103 WITH 2 MFCS) 1. Rear Panel 2. Fan assembly 3. Status I/O/solenoid valve driver PCB (PC416) 4. Solenoid valve manifold assembly 5. Photometer Photo detector PCB (PC414) 6. Photometer bench assembly 7. Photometer lamp and heated lamp block assembly 8. Photometer bench output fitting with gas temperature sensor 9. Photometer flow meter 10. Photometer PCB (PC415) 11. 115 watt switching power supply 12. Reaction chamber, output manifold and mixing chamber assembly 13. A/D and D/A analog interface PCB (PC412) 14. N/A 15. Component gas flow controller (MFC2) 16. Dilution/balance gas flow controller (MFC1) 17. Microcomputer board (PC401) 18. Isolation valve V1. This valve selects either an external source of ozone or the internal source produced by the internal ozone generator. 19. Ozone generator including ozone analog PCB (PC410) 20. Photometer cycling valve V2. This valve cycles back and forth between a reference gas and ozone-containing sample. 21. Keypad ribbon cable 22. Photometer pump assembly, longevity up to 10,000 hours. 23. Display and keypad interface PCB (PC406) 24. Front panel 6103 SERVICE MANUAL – REV 5 2 OCTOBER 2011 INTERNAL LAYOUT, HINGED PANELS DOWN 6103 SERVICE MANUAL – REV 5 3 OCTOBER 2011 ROUTINE MAINTENANCE CLEANING THE FAN FILTER This procedure should be performed if the fan speed is noticeably slower or there is a change in the color of the filter. 1. Locate the fan on the rear panel and remove the fan filter retainer exposing the fan filter. 2. Remove the fan filter media. 3. To remove heavy build up, shake the filter vigorously. 4. To remove the remaining light build up, use compressed air. 5. Realign fan filter and reattach retainer. FAN FILTER ASSEMBLY CLEANING THE PHOTOMETER TUBE Periodically remove the photometer tube to clean out any debris that has collected on the ID of the tube. It is best to used compressed air to clean out the tube. The smooth ID of the tube will allow the debris to be removed easily. To remove the photometer tube, loosen the knurled knob on the lamp end of the photometer bench by rotating counter clockwise. After reinstalling the tube, run the leak test. REMOVING PHOTOMETER TUBE KNURLED NUT 6103 SERVICE MANUAL – REV 5 4 OCTOBER 2011 ROUTINE MAINTENANCE (CONTINUED) LEAK TEST The 6103 has an automated Leak Test function, to determine if the system has any internal leaks. To run the Leak Test: 1. Be sure there is a source of gas connected to Port 1 at 25 PSIG. 2. Select the LEAK function from the Main Menu, and then press START. The software will acquire Atmospheric Pressure, and then prompt for the outputs to be capped. 3. Cap the Output Manifold, Vent and Exhaust ports. Use the caps supplied with the system. 4. Press OK. The Leak Test will fill the volume of the system plumbing with gas from Port 1 to 5 PSIA above atmospheric pressure, and use pressure decay to calculate the leak rate. Any leak in excess of the maximum leak specification for the system (3 SCCM) will be displayed. ADJUSTING THE PHOTOMETER SAMP/REF INTENSITIES For the best photometer resolution, the sample and reference intensities should be set for 500,000 to 850,000. The intensities can be seen in the PHOTO MODE in the DETAIL screen selection. In the PHOTO mode, with the photometer pump off, these intensities should be approximately the same. Each number updates every 4 seconds. However, the update of each number is staggered by 4 seconds. As the photometer lamp ages, it will be necessary to increase these intensity values. To increase or decrease these values within the range outlined above, perform the following: 1. From one of three main menus, enter the SYSTEM mode and scroll down to CALIBRATE PHOTO. Use the ENTER key to select the mode. 2. Scroll down to the INTEG TIME field. 3. To increase the intensities, increase the INTEG TIME value in increments of 1ms to 5 ms. Each time you change the INTEG TIME and press the ACCEPT key, the system will run a short internal calibration sequence and exit back to the READY screen. Be careful not to change the OFFSET and GAIN values in this mode, as this will affect the photometer accuracy. The OFFSET and GAIN values are adjusted in the photometer calibration procedure in the next section of this manual. Reenter the PHOTO mode to see the effect of the changes. 6103 SERVICE MANUAL – REV 5 5 OCTOBER 2011 ADJUSTING THE PHOTOMETER SAMP/REF INTENSITIES (CONTINUED) 4. To decrease the lamp intensity readings, decrease the INTEG using the same process as outlined in step 3 above. 5. Perform steps 3 and/or 4 until the intensity values are within the range of 500K to 850K. 6. If the locations for the sample and reference frequencies are filled with asterisks, then the INTEG time is set too high. Lower the INTEG TIME value to recover. 6103 SERVICE MANUAL – REV 5 6 OCTOBER 2011 CALIBRATION (SYSTEM MODE) MFC FLOW CALIBRATION PROCEDURE 1. The unit must be powered on for at least 1 hour prior to starting this procedure. 2. Select the SYSTEM mode from one of three main menus. From the SYSTEM mode, scroll down to and select LEAK TEST. Perform the leak test as outlined in the LEAK TEST section of this manual. Note, there are two leak test modes.1) The SYSTEM MODE LEAK TEST displays any leak using absolute zero leak as a reference. 2) The leak test mode, from the main menu, uses the maximum factory acceptable leak of three SCCM as a reference. The SYSTEM MODE LEAK TEST should be used prior to flow calibration. The leak test in the main menu will show any new leaks that may have developed since calibration. 3. After the leak test, only remove one of the caps on the output manifold ports, making sure that the two remaining outputs and the vent port remain capped. 4. With no gases connected to the system, start both MFC1 and MFC2 in the FLOW mode; reference the user’s manual for instruction on using the FLOW mode. Command the maximum flow allowed to the MFCs. This will clear out any trapped gases that would interfere with the readings in the following step. Let the system run for approximately 30 seconds and press STOP. If your system has an optional third MFC, this must be cleared out as well by pressing EDIT. You will then change the flow for GAS2 to the Max Flow for the third MFC (i.e. 10 CC) and press update. You will then continue as above. 5. Check the zero (MFC response voltage with zero flow) of each MFC by hooking up a DVM to the respective MFC test points on PC412; reference assembly drawing section and internal layout illustration for PCB and test point location. Connect the ground meter lead to the test point labeled AGND (analog ground). Connect the positive meter lead to the response test point of each MFC. MFC1 is TP2, MFC2 isTP4 and MFC3 (if applicable) is TP6. The zero specification is from +.005VDC to +.015VDC. If the zero is out of specification it must be adjusted using the MFC zero potentiometer. This potentiometer can be accessed through the bottom of two holes in the back of the MFC case. Reference the MFC illustration drawing on 9. 6. Connect air or nitrogen to Port 1 for MFC1 and Port 2 for MFC2 and MFC3 (if applicable). Adjust the input pressure to approximately 25 PSIG. Connect the OUTPUT PORT of the 6103 to a suitable flow standard. Environics’ calibration is NIST traceable, using a primary flow standard accurate to .2% of reading. 6103 SERVICE MANUAL – REV 5 7 OCTOBER 2011 7. Select the SYSTEM mode from one of three main menus. From the SYSTEM mode, select CALIBRATE MFC and enter the MFC number to be calibrated. The port number should be set to 1 for MFC1 and 2 for MFC2 and MFC3 (if applicable). Use the ENTER key to accept the port number. MFC FLOW CALIBRATION PROCEDURE (CONTINUED) 8. Using the down arrow key, scroll down to the 100% point (point # 11) of the MFC and press START on the keypad. 9. Always let the unit flow for approximately 2 minutes at each point prior to taking readings. To make sure that the MFC is stable and is not drifting, take enough readings at 100% to establish stability. If the MFC is not generating 100%, as read by the flow standard being used, a span adjustment can be made. Note however, that span adjustments to the MFC will void the factory calibration and void the warranty repair of any inaccuracies that result in the blend. The span (full scale) of the MFC has been factory adjusted to generate 100% to 103% of set-point. The reference temperature used on the Environics’ flow standard is 77oF (25oC). The MFC span potentiometer is accessed through the top of two holes on the back of the MFC case; reference the MFC illustration drawing on page 9. 10. Readings are taken at 10% intervals of full-scale; 100% of flow down to 10% and a 5% reading is also taken. Once a valid reading has been taken, simply enter that respective measured flow value into the TRUE column opposite the SET flow reading in the calibration table. Once the true flow is entered, use the arrow key to move up to the next flow value and press update. Perform this process for all 11 flow points waiting approximately 2 minutes between each reading to allow the MFC to stabilize at the desired flow. 11. After all 11 data points have been entered into the calibration table, press the EXIT key and then the SAVE key. 12. Verify the individual MFCs, in the FLOW mode, as outlined below. The accuracy should be better than 1% of set flow value. 6103 SERVICE MANUAL – REV 5 8 OCTOBER 2011 VERIFY MFC FLOWS INDIVIDUALLY (WITH A FLOW STANDARD) To verify flows from MFCs individually, the PUMP must be off. This is done by pressing the MENU key while the system is flowing in the flow mode. Press the PUMP key until OFF appears. Pressing the MENU key again will automatically change the setting to OFF. This will isolate any leaking that may occur back out through the photometer bench by deactivating valve V2 and the pump; refer to P&ID on page 58. Two output ports and the vent port must be capped. Supply the flow standard from the remaining output manifold port. When you are finished, be sure to press the PUMP key until ON appears. SPAN ADJUSTEMENT ZERO ADJUSTEMENT MFC ILLUSTRATION DRAWING 6103 SERVICE MANUAL – REV 5 9 OCTOBER 2011 CALIBRATION (SYSTEM MODE CONTINUED) PHOTOMETER CERTIFICATION/CALIBRATION PROCEDURE 1. Connect, with as short a piece of tube as possible, one of the three OUTPUT MANIFOLD PORTS to a Primary Reference Photometer (PRP) or equivalent. Leave the remaining two output ports and the VENT port to vent. 2. Connect zero air to PORT 1 and the REFERENCE PORT at 25 PSIG. 3. From one of three main menus, select the FLOW mode. Enter 5 LPM for MFC1, zero for MFC2, zero for ozone and press START, being sure that at least one liter of gas vents. This assumes that the external photometer will draw 2 LPM or less. The 6103 photometer will draw 2 LPM as well. If the external photometer draws more than 2LPM, increase MFC1 flow accordingly. 4. Press the MENU key once and the O3CTRL key until 03 CTRL is OFF. This disables the photometer control loop and will decrease the response time of this procedure. Press the MENU key. 5. Once the 6103 reading and external photometer reading have stabilized, record the difference between the 6103 and external photometer and enter this number (in PPB) into the offset field of the CALIBRATE PHOTO mode under the SYSTEM mode. It will be necessary to stop the FLOW mode and exit to the SYSTEM mode. If an offset already exists, the new offset will need to be added or subtracted from the existing offset. I.E. if the 6103 reading is lower than the external photometer, then the offset will need to be added to the existing offset in the CALIBRATE PHOTO screen. The zero offset should never be more than +/- 10.0 PPB. If the offset is larger, it may indicate a setup or functional problem with the system. 6. Repeat step 3 to verify that the 6103 and external photometer both agree with just zero air. 7. While flowing, enter an ozone level that is at least 80% of the URL (Upper Range Limit) of the photometer range to be calibrated; typically .5 PPM or 1 PPM ranges. 8. Allow the ozone readings of the 6103 and external photometer to stabilize. Increase the commanded ozone value as necessary to get the actual ozone above at least 80% URL. 6103 SERVICE MANUAL – REV 5 10 OCTOBER 2011 PHOTOMETER CERTIFICATION/CALIBRATION PROCEDURE (CONTINUED) 9. Calculate the 6103 photometer gain using the following formula: New Gain = PRP reading/6103 reading X Current gain* * Current GAIN is found in the CALIBRATE PHOTO mode in the SYSTEM mode. 10. Enter the new GAIN into the CALIBRATE PHOTO screen of the 6103 and save. 11. Exit back to the FLOW mode and verify the existing ozone point and two other points equally spread out in the range of calibration. The 6103 and External photometer readings should agree to within 3 PPB or 2%, whichever is greater. 6103 SERVICE MANUAL – REV 5 11 OCTOBER 2011 CALIBRATION (SYSTEM MODE CONTINUED) OZONE CALIBRATION This procedure will allow the system to respond faster to set-point when producing ozone with 03CTRL ON. Also, the ozone generator will be more accurate with 03CTRL OFF. Factory defaults to 3 calibration points. The ozone generator can be calibrated for up to 11 points. 1. Connect zero air, at 25 PSIG, to Port 1 and the Reference Port of the instrument. The 6103 will use the internal photometer, which must be within its certification period, to calibrate the ozone generator. 2. Vent all remaining output ports and the vent port. 3. Connect a chart recorder, or some other form of data acquisition, to the pins labeled 1(+) and 1(-) on the rear panel analog output connector; this is for charting stability. 4. From one of three main menus, select SYSTEM and CALIBRATE OZONE. 5. If calibrating the ozone generator for the flow and ozone concentration levels identified when the system was purchased, press the down arrow key four times. If calibrating for some other flow or concentration level, contact Environics’ technical services for information on the TOTAL FLOW, OZONE FLOW and MAX 03 PPM parameters. To identify the original calibration information, refer to the calibration printouts supplied with the system or contact Environics’ technical services. Be sure to have the system serial number when calling. The serial number is identified on the rear panel of the system. 6. Key down to the highest ozone point in the table and press start. The photometer pump will turn on automatically. If for some reason and external photometer is being used for this calibration, the internal photometer pump can be turned off using the menu key. The top line of the calibration screen will indicate PHOTO=OFF. 7. Allow the photometer reading to stabilize. Time will be dependent on how frequently the system runs with ozone and the last time the system ran with ozone; conditioning and burn-in are key. 8. For this one point, the actual ozone concentration level (read by photometer) should be approximately 10 % higher than the command or 1.1 times the command. (Example: .50 command x 1.1 = O3 level .55 ppm, 1.0 command x 1.1 = O3 level 1.1 ppm). This can be accomplished by removing the ozone generator cover and adjusting R35 gain potentiometer on PC410. 6103 SERVICE MANUAL – REV 5 12 OCTOBER 2011 OZONE CALIBRATION (CONTINUED) 9. After making the gain adjustment, be sure that the ozone generator zero offset has not changed significantly. Stop the ozone generator and measure the voltage at TP2 on the PC410. This voltage should be between .08 and .1 VDC. If it is not, adjust potentiometer R46 until it is within this range. Reinstall the ozone generator cover. 10. Command a series of points (up to 11) starting with the concentration from step 8 and working down to the minimum concentration. The factory calibration points are listed below. During the calibration process, record the average 03 pressure value. This pressure value can be found by pressing the view key. Value listed as P is the ozone generator pressure. Pressing the VIEW key once more will bring back the main ozone calibration screen. Examples: For .5ppm Maximum 03 1 2 3 SET .030 .300 .500 For 1.0ppm Maximum TRUE .022 .339 .545 03 SET 1 .050 2 .500 3 1.000 TRUE .037 .522 1.095 11. Once all ozone points have been run and the values recorded, stop and exit the calibrate ozone mode with NO SAVE. 12. Re-enter the calibrate ozone mode and enter the pressure recorded in step 9 into the cal press field (forth row) and press the ENTER key. 13. Enter all ozone points recorded in step 9; they must be entered in ascending order starting with point 1 in the table. Enter the corresponding photometer reading in the second (true) column. Fill in all unused fields, set and true with zero. 14. Press EXIT and SAVE. 15. Exit out of the system mode and select the FLOW mode and verify 3 points 10%, 50% and 100%, using the same total flow rate used during the collection of calibration data points. Allow the ozone concentration level to stabilize before accepting the reading from the photometer. Repeat for all verification points. IMPORTANT: Using the MENU key, make sure 03_CTRL is OFF. 6103 SERVICE MANUAL – REV 5 13 OCTOBER 2011 CALIBRATION (SYSTEM MODE CONTINUED) ADC CALIBRATIONS PHOTOMETER BLOCK TEMPERATURE Use calibrated temperature meter with surface sensing probe. This ADC is used for display and troubleshooting purposes only. The value fed back from this ADC does not impact the photometer reading. 1. From one of three main menus, on the 6103 front panel, select the SYSTEM mode. 2. Select CALIBRATE ADC 3. Enter 04. NOTE: This is the 6103 ADC cal table for the temperature sensor circuit on the PC415. The live reading (ADC 04 RESP) in this table is a voltage. The voltage times a factor of 10 is the temperature in degrees C. The normal live reading value should be between approximately 4.8 and 5.1 4. Place the surface sensing probe onto the photometer block (lamp end). Allow meter to stabilize and record the value in degrees C. 5. Place 0.0 in the first and second column, first row fields of the cal table. 6. Place the live reading of ADC 4 in the first column, second row field. 7. Place the value, measured in step 4, into the second column, second row field. Note: This has identified to the software that for the 6103 live reading from step 6, the actual temperature is the value measured in step 4. 8. Make sure all other rows have zero data for both columns. Example: Temperature measured in step 4 is 50.15 degrees C Live reading from ADC 4 is 4.982 DATA IN ADC 4 CAL TABLE ADC RESP = 4.9820 1 = 0.0000 0.0000 2 = 4.9820 50.150 3 = 0.0000 0.000 6103 SERVICE MANUAL – REV 5 14 OCTOBER 2011 ADC CALIBRATIONS (CONTINUED) PHOTOMETER PRESSURE TRANSDUCER The values fed back by this ADC are used to formulate the displayed photometer ozone level. A certified pressure standard will be necessary for this calibration. 1. Remove the photometer tube from the 6103 under test, reference page 4. 2. From one of three main menus, on the 6103 front panel, select the SYSTEM mode. 3. Select CALIBRATE ADC. 4. Enter 6. NOTE: This is the 6103 ADC cal table for the pressure transducer circuit on the PC415. The live reading (ADC RESP) in this table is a voltage and the scale of the circuit is 0 to 5 VDC for 0 to 30 PSIA. The live reading should normally be between 2.3 and 2.5 VDC (13.8 to 15 PSIA) and will be dependent on elevation and/or weather conditions. 5. Set the first and second column first row values to 0. 6. Place the live reading of ADC 6 in the first column, second row location. 7. Place the value, as measured by a certified pressure standard, into the second column, second row location as a PSIA value. Note: This has identified to the software that for the 6103 live reading from step 6, the actual pressure is the value measured by a certified standard. Example: Pressure measured in step 7 is 14.429 Live reading from ADC 6, from step 6, is 2.4257 DATA IN ADC 6 CAL TABLE ADC RESP = 2.4257 1 = 0.0000 0.0000 2 = 2.4257 14.429 3 = 0.0000 0.0000 6103 SERVICE MANUAL – REV 5 15 OCTOBER 2011 ADC CALIBRATIONS (CONTINUED) PHOTOMETER GAS TEMPERATURE The values fed back by this ADC are used to formulate the displayed photometer ozone level. A certified temperature standard will be necessary for this calibration. A temperature meter with exposed junction thermocouple will be best. 1. Remove the photometer tube from the 6103 under test. 2. From one of three main menus, on the 6103 front panel, select the SYSTEM mode. 3. Select CALIBRATE ADC 4. Enter 7. NOTE: This is the 6103 ADC cal table for the temperature sensor circuit on the PC415. The live reading (ADC RESP) in this table is a voltage. The voltage times 100 is the temperature in degrees K. 273.15 degrees K is 0 degrees C. The normal live reading value should be between approximately 2.96 (22.85oC) and 3.0 (26.85oC). 5. Set the first column first row value to 2.7315 and the second column first row value to 0.0000. 6. Insert the exposed junction thermocouple into the fitting containing the temperature sensor, PC414 end of bench. Get the thermocouple as close to the sensor as possible without touching the inner wall of the fitting or any other surface. 7. Place the live reading of ADC 7 in the first column, second row location. 8. Place the value, measured in step 6, into the second column, second row location. Note: This has identified to the software that for the 6103 live reading from step 7, the actual temperature is the value measured in step 6. 9. Zero all other fields in the cal table such that rows 1and 2 are the only rows with data. Example: Temperature measured in step 6 is 26.12 degrees C Live reading from ADC 7 is 3.0000 DATA IN ADC 7 CAL TABLE ADC RESP = 3.0000 1 = 2.7315 0.0000 2 = 3.0000 26.120 3 = 0.0000 0.0000 6103 SERVICE MANUAL – REV 5 16 OCTOBER 2011 ADC CALIBRATIONS (CONTINUED) OZONE GENERATOR PRESSURE The values fed back by this ADC are used to formulate the information for the leak test and ozone pressure correction. Ozone pressure correction is only active when the photometer control loop is off. When Ozone pressure correction is enabled, the ozone lamp intensity is adjusted as the pressure in the ozone generator rises or falls. A certified pressure standard will be necessary for this calibration. 1. Ensure that the VENT port is open to atmosphere. 2. From one of three main menus, on the 6103 front panel, select the SYSTEM mode. 3. Select CALIBRATE ADC. 4. Enter 11. NOTE: This is the 6103 ADC cal table for the pressure transducer circuit on the PC410. The live reading (ADC 11 RESP) in this table is a voltage and the scale of the circuit is 0 to 5 VDC for 0 to 30 PSIA. The live reading should normally be between 2.3 and 2.5 VDC (13.8 to 15 PSIA) and will be dependent on elevation and/or weather conditions. 5. Set the first and second column first row values to 0. 6. Place the live reading of ADC 6 in the first column, second row location. 7. Place the value, as measured by a certified pressure standard, into the second column, second row location as a PSIA value. Note: This has identified to the software that for the 6103 live reading from step 6, the actual pressure is the value measured by a certified standard. Example: Pressure measured in step 7 is 14.429 Live reading from ADC 6, from step 6, is 2.4257 DATA IN ADC 6 CAL TABLE ADC RESP = 2.4257 1 = 0.0000 0.0000 2 = 2.4257 14.429 3 = 0.0000 0.0000 6103 SERVICE MANUAL – REV 5 17 OCTOBER 2011 ADC CALIBRATIONS (CONTINUED) OZONE BLOCK TEMPERATURE Use calibrated temperature meter with surface sensing thermocouple. This ADC is used for display and troubleshooting purposes only. The value fed back from this ADC does not impact the photometer reading. 1. From one of three main menus, on the 6103 front panel, select the SYSTEM mode. 2. Select CALIBRATE ADC 3. Enter 13. NOTE: This is the 6103 ADC cal table for the temperature sensor circuit on the PC410. The live reading (ADC RESP) in this table is a voltage. The voltage times 10 is the temperature in degrees C. The normal live reading value should be between approximately 4.8 and 5.1, once the system has warmed up. 4. Place the surface sensing thermocouple on the top of the ozone block. Allow meter to stabilize and record the value in degrees C. 5. Place 0.0 in the first and second column, first row locations of the cal table. 6. Place the live reading of ADC 13 in the first column, second row location. 7. Place the value, measured in step 4, into the second column, second row location. Note: This has identified to the software that for the 6103 live reading from step 6, the actual temperature is the value measured in step 4. 8. Make sure that all other rows have zero data for both columns Example: Temperature measured in step 4 is 50.15 degrees C Live reading from ADC 13 is 4.982 TYPICAL DATA IN ADC 13 CAL TABLE ADC RESP = 4.9820 1 = 0.0000 2 = 4.9820 3 = 0.0000 0.0000 50.150 0.0000 6103 SERVICE MANUAL – REV 5 18 OCTOBER 2011 CALIBRATION (SYSTEM MODE CONTINUED) PASSWORD PROTECTION The system mode can be password protected, as this mode contains all the data that impacts the accuracy of the system. The system is shipped with the password set to NONE. A four character numeric password is set within the SYSTEM mode. Upon any attempts to reenter the system mode, after setting a password, the user will be prompted to enter the password to gain entry. Be sure to record this password and keep it in a safe and secure location. 1. From one of three main menus, select the SYSTEM mode. 2. Toggle (ARROW) down to CHANGE PASSWORD and press ENTER. 3. Enter the 4 digit numeric password and press DONE. 4. EXIT back out of the SYSTEM mode and press the SYSTEM key. A prompt should appear for a password entry. 5. Enter the previously selected 4 digit numeric password to verify the process. 6. Once the password is entered, entry into the SYSTEM mode should be automatic. 6103 SERVICE MANUAL – REV 5 19 OCTOBER 2011 PCB FUNCTION AND TEST POINTS PC401 FUNCTION (MICROCOMPUTER BOARD) The PC401 is an off-the-shelf microcomputer board. It contains the system EPROM and battery backed up RAM for the storage of all system configuration, calibration and user data. Also, this PCB controls the switching of solenoid valves V1 and V2, reference P&ID on the last page of this manual. PC401 TEST POINTS As this PCB was not designed or is not manufactured by Environics, and contains digital circuitry, there are no test points available. PC406 FUNCTION (KEYPAD INTERFACE AND DISPLAY PCB) The PC406 decodes the information entered on the keypad and displays information, sent by the processor board, on the front panel 4 lines by 20 character LCD display. Also, this PCB contains the beeper circuit for an audible confirmation of keypad data entry. PC406 TEST POINTS TP# VALUE TP1 5 VDC Steady state TP2 GND TP3 .25 to 1.8 VDC as display contrast is adjusted in PREFS mode TP4 See diagram PC406 TP4 on page 39. Meter or oscilloscope reference PC410 FUNCTION (OZONE GENERATOR PCB) The PC410 is completely analog. The PC410 interfaces with the PC412 analog board. Analog information is fed back from the ozone generator, via a ribbon cable, to the PC412. The PC412, using 12 bit ADC, converts the information to a digital bit pattern for processing by the PC401 microcomputer board. The information includes ozone generator flow, pressure, temperature, lamp voltage and ozone generator response voltage. Also, ozone commands are sent from the PC412. The command voltages typically range from 0-5VDC with 12-bit resolution from the PC412 DAC. 6103 SERVICE MANUAL – REV 5 20 OCTOBER 2011 PC410 (CONTINUED) PC410 TEST POINTS TP# VALUE TP1 Approximately 3.8 to 4.1 VDC when ozone generator is controlling properly. 5 VDC when lamp is on full and 1 VDC when lamp is not commanded or ozone command is 0 PPM. TP2 Ozone response voltage should always equal the command voltage (TP4) except for an ozone command of zero. This voltage will normally measure between .1 and 5 VDC. The voltage of this test point is totally dependent on the command of ozone and flow rate. At zero command or when the ozone generator has no command, this voltage should be 80-100mv. TP3 Should measure between 1 VDC and 5 VDC for ozone generator flow rates from 0 LPM (1 VDC) to 1 LPM (5 VDC) These voltages are approximations (uncalibrated) as they are fed through a calibration table for more accurate displayed values. The flow through the ozone generator is controlled by a bypass; reference P&ID on the last page of this manual. TP4 This is the command voltage for the ozone generator and should measure between 0 and 5 VDC. This voltage is totally dependent on the ozone concentration and flow rate. Other factors controlling this value are the ozone generator calibration table and ozone generator pressure correction. TP5 This test point represents the lamp waveform generated by an oscillator circuit on the PC410 prior to entering the step-up transformer T1. The waveform should look like the one represented in the diagram PC410 TP5&TP7 on page 39. TP6 This test point represents the lamp waveform exiting step-up transformer T1. The waveform should look like the diagram labeled PC410 TP6&TP8 on page 39. TP7 Reference TP5. TP8 Reference TP6. 6103 SERVICE MANUAL – REV 5 21 OCTOBER 2011 PC410 TEST POINTS (CONTINUED) TP# VALUE TP9 (VREF) 5.00 VDC steady state. TP10 (+15V) +15 VDC steady state. TP11 (-15V) -15VDC steady state. TP12 NA TP13 (+24V) +24 VDC steady state. TP14 (AGND) Analog ground test point for negative (black) meter lead. TP15 This test point represents the controlled ozone block temperature. After an approximate 30 minute warm up period, this test point will normally measure between 4.8 and 5.1 VDC for 48 and 51 degrees C respectively. TP16(PGND) This is the power (+24VDC) ground test point for the negative (black) meter lead when measuring the +24 VDC test point TP13. TP17 This test point represents the ozone generator pressure. This value will read approximately 2.45 VDC for 14.7 PSIA. The ozone generator pressure transducer circuit generates 0-5 VDC for 0- 30 PSIA. Note, this value is an uncalibrated value. It is fed through a calibration table (ADC 11) for a more accurate display purposes and pressure correction. TP18(+10V) +10 VDC steady state. () Values in parenthesis are as seen on the PCB silkscreen. 6103 SERVICE MANUAL – REV 5 22 OCTOBER 2011 PCB FUNCTION AND TEST POINTS (CONTINUED) PC412 FUNCTION (ANALOG BOARD) This PCB is an interface between all system analog control/readback components and the microcomputer board (PC401). The analog components include all ozone generator and photometer analog values (I.E pressure, temperature, etc.) and mass flow controllers (MFCs). This PCB uses 12-bit A/D and D/A converters for high resolution control and readback of the analog devices. PC412 TEST POINTS TP# VALUE TP1 Command voltage for MFC1; this test point should measure approximately .5 VDC to 5.0 VDC for MFC1 commands between 10 and 100% full-scale flow. This range is approximated due to the MFC calibration table having an affect on the command voltage. TP2 Response voltage for MFC1; this test point should measure approximately +.005 to +.015 VDC with a no flow command or a flow command of zero. When commanding flow, the measurement of this test point should equal TP1 as long as the MFC is flowing and controlling properly. TP3 Command voltage for MFC2; this test point should measure approximately .5 VDC to 5.0 VDC for MFC1 commands between 10 and 100% full-scale flow. This range is approximated due to the MFC calibration table having an affect on the command voltage. TP4 Response voltage for MFC2; this test point should measure approximately +.005 to +.015 VDC with a no flow command or a flow command of zero. When commanding flow, the measurement of this test point should equal TP2 as long as the MFC is flowing and controlling properly. TP5, TP6 For MFC3; A third MFC is currently not available in the 6103 TP7(VREF) +5.00 VDC steady state. 6103 SERVICE MANUAL – REV 5 23 OCTOBER 2011 PC412 TEST POINTS (CONTINUED) TP# VALUE TP8(AGND) Analog ground test point for negative (black) meter lead. TP9(+5A) +5 VDC steady state. TP10(-5) -5 VDC steady state. TP11(-12) -12 VDC steady state. TP12(+12) +12 VDC steady state. TP13(AGND) Analog ground test point for negative (black) meter lead. TP14(-15) -15 VDC steady state. TP15(+15) +15 VDC steady state. TP16(+5) +5 VDC steady state. TP17(GND) Ground test point for negative (black) meter lead when measuring TP16. TP18(PGND) Ground test point for negative (black) meter lead when measuring TP19. TP19(+24) +24 VDC steady state. () Values in parenthesis are as seen on the PCB silkscreen. 6103 SERVICE MANUAL – REV 5 24 OCTOBER 2011 PCB FUNCTION AND TEST POINTS (CONTINUED) PC414 FUNCTION (PHOTOMETER DETECTOR PCB) This PCB is mounted at the end of the photometer bench. The information gathered by the photo detector is sent from this board, via a ribbon cable in a digital serial bit pattern, to the PC415 for processing. PC414 TEST POINTS This PCB has no test points. PC415 FUNCTION (PHOTOMETER PCB) This PCB interfaces between the photometer analog devices and the PC412 analog board. Analog information is fed back from the photometer, via a ribbon cable, to the PC412. The PC412, using 12 bit ADC, converts the information to a digital bit pattern for processing by the PC401 microcomputer board. The information includes photometer flow, gas pressure, gas temperature and lamp block temperature. This PCB also processes information sent back from the PC414 photo detector PCB. The analog output channels are also controlled by this PCB. PC415 TEST POINTS TP# VALUE TP1(+5V) +5 VDC steady state. TP2(GND) Ground test point for negative (black) meter lead when measuring TP1. TP3 Should measure 1 VDC when the photometer pump is off and approximately 1.7 VDC when the pump is on. The flow through the photometer flow meter is controlled by a bypass, reference P&ID on the last page of this manual. Not all photometer flow passes through the flow meter; however, the total photometer flow (2 LPM) is calculated based on the ratio setup by the bypass. 6103 SERVICE MANUAL – REV 5 25 OCTOBER 2011 PC415 TEST POINTS (CONTINUED) TP# VALUE TP4(+10V) +10 VDC steady state. TP5 This test point represents the photometer gas pressure. This value will read approximately 2.45 VDC for 14.7 PSIA. The photometer pressure transducer circuit generates 0-5 VDC for 0- 30 PSIA. Note: This value is an uncalibrated value. It is fed through a calibration table (ADC 06) for a more accurate display purposes and pressure compensation. TP6 This test point represents the photometer gas temperature. This value will read approximately 2.45 VDC for 14.7 PSIA. The photometer pressure transducer circuit generates 0-5 VDC for 0- 30 PSIA. Note: This value is an uncalibrated value. It is fed through a calibration table (ADC 11) for a more accurate display purposes and pressure compensation. TP7(+5A) +5 VDC steady state. TP8 The voltage represented by this test point is used in the closed loop control of the photometer block heater. The voltage at this test point should measure between 4 VDC and 5 VDC for block temperatures between 25 and 50 degrees C respectively. TP9(+15) +15 VDC steady state TP10(AGND) Analog ground test point for negative (black) meter lead. TP11(-15) -15 VDC steady state TP12 This test point represents the controlled photometer block temperature. After an approximate 30 minute warm up period, this test point will normally measure between 4.9 and 5.1 VDC for 49 and 51 degrees C respectively. TP13(VREF) +5.00 VDC steady state. TP14(PGND) This is the power (+24VDC) ground test point for the negative (black) meter lead when measuring the +24 VDC test point TP15. () Values in parenthesis are as seen on the PCB silkscreen. 6103 SERVICE MANUAL – REV 5 26 OCTOBER 2011 PC415 TEST POINTS (CONTINUED) TP# VALUE TP15(+24V) +24 VDC steady state. TP16 This test point represents the photometer lamp waveform generated by an oscillator circuit on the PC415 prior to entering the step-up transformer T1. The waveform should look like the one represented in the diagram PC415 TP16&TP17 on page 40. TP17 Reference TP16. TP18 NA TP19 This test point represents the lamp waveform exiting step-up transformer T1. The waveform should look like the diagram labeled PC415 TP19 on page 40. () Values in parenthesis are as seen on the PCB silkscreen. PC416 FUNCTION (SOLENOID VALVE DRIVER AND STATUS I/O BOARD) This PCB is used to activate the solenoid valves used to isolate the gases on the input gas ports. These valves are turned on with 24 VDC and then run at 30% duty cycle or 1/3 power. This allows more efficient use of the internal 24 VDC power supply. This board also controls the input and output status lines. To use the Status Input feature, the 2 control pins for the desired status input must be connected together. The status input signal must be present for at least 500 milliseconds to ensure that the connection is properly detected by the software. Caution: The status inputs respond only to a connection between adjacent pins of the desired input. Do not apply any voltage to the status input pins, as this will result in damage to the instrument To use a Status Output to provide a “contact” output, connect the inputs for the device you being controlled to the desired STATUS OUTPUT pin, and to GROUND To use a Status Output to provide a “powered” 24 volt output (to drive a relay for example), connect the inputs for the device you are controlling to the desired STATUS OUTPUT pin, and to +24 VOLTS. 6103 SERVICE MANUAL – REV 5 27 OCTOBER 2011 PC416 FUNCTION (CONTINUED) Reference user’s manual for more detailed instructions on the setup and operation of the status I/O lines. Caution: Each status output can sink a maximum of 100 mA. Do not connect anything to the outputs (such as a solenoid valve) that will draw more than 100 mA, as this will result in damage to the instrument PC416 TEST POINTS TP# VALUE TP1(+5) 5 VDC Steady state TP2(GND) GND meter reference for TP1. TP3(100KHZ) See PC416 TP3 diagram on page 40 for waveform. TP4(PGND) This is the power (+24VDC) ground test point for the negative (black) meter lead when measuring the +24 VDC test point TP5. TP5(+24) +24 VDC steady state. () Values in parenthesis are as seen on the PCB silkscreen. 6103 SERVICE MANUAL – REV 5 28 OCTOBER 2011 TROUBLESHOOTING POWER PROBLEMS SOLUTION System display does not come up and front panel power switch is not illuminated. System display does not come up and power switch is iluminated. Check power cord connection and power source voltage. Environics recommends the use of a power conditioner. Check fuses in power entry module on rear panel and replace if necessary. Check all steady state test points on the PC412 If absence of TP14, TP15, TP16 or TP19, check power supply voltages with power cable disconnected from PC412. See power cable wiring diagram on page 41 of this manual. If any of the power supply voltages are absent, replace power supply. If all power supply voltages are present, identify the PCB or component drawing down the power supply and replace. If absence of any other steady state test points, replace PC412. FLOW PROBLEMS SOLUTION Zero or low flow from one or more mfcs. Check and adjust input pressures if necessary. Nominal pressure is 25 PSIG. Tube size for MFC1 should be ¼” O.D. minimum, 1/8” minimum for MFC2. Remove all output connections to the system and try again. This will insure that the problem is not back pressure related. INDICATIONS: Incorrect blend including ozone levels, no output gas measured, only zero gas when commanding a mixture, high gas concentrations 6103 SERVICE MANUAL – REV 5 29 OCTOBER 2011 FLOW PROBLEMS (CONT.) SOLUTION Zero or low flow from one or more mfcs. NOTE: For all flow related problems, always check the steady state test point values on the PC412 first. If there is a problem with TP14, 15, 16 or 19, follow the instructions in the POWER PROBLEM section above. 6103 SERVICE MANUAL – REV 5 30 While commanding the MFC in the flow mode (see verifying individual flow controllers in the calibration section of this manual), measure the command voltage to the MFC on the PC412. If the voltage is present and approximately correct for the flow rate being commanded, measure corresponding MFC response test point on the PC412. If the response voltage is low or 0, there may either be a problem with the MFC cable, +/- 15 VDC steady state power supply, or the MFC. Try swapping the MFC cable and check the PC412 test points for +/- 15 VDC. If these things fail to fix the problem, contact Environics technical services. If the command voltage is not present, check the calibration data for the MFC in the system mode to ensure that the values have not changed from the last calibration. Environics sends a hardcopy of all data for reference. These values may be slightly different if a follow-up calibration has been done by the customer. Check TP7 on PC412. This is the reference voltage (+5 VDC) used by the MFC ADC and DAC. Try running the MFC in the calibration mode to see if the problem exists there as well. This will insure that the problem is not related to software processing if it does not run in this mode either. OCTOBER 2011 FLOW PROBLEMS (CONT.) SOLUTION Blend or flow is unstable. Flow rate is saturated, regardless of command. INDICATIONS: concentration is too high (MFC2 saturated) or concentration is to low (MFC1 saturated). 6103 SERVICE MANUAL – REV 5 31 Measure the MFC response voltage on the PC412. If the response voltage is changing at the same rate as the instability of the blend, Verify input pressure stability. Often, the input gas source, especially for MFC1 will be shared with another process or operation outside of the blender. Although the MFC can adjust for slow changing pressure, it cannot respond the pressure fluctuations that occur less than an approximate 10 second cycle. Remove all output plumbing connections to verify that something downstream of the system is not causing the instability. Replace the MFC. This normally indicates a failure within the MFC. However, first check all PC412 steady state voltages. Follow previously recommended procedure (in POWER PROBLEM section) if voltages are not correct. Replace MFC. OCTOBER 2011 OZONE PROBLEMS SOLUTION No ozone when commanded Note: For all ozone related problems, always check the steady state test point values on the PC410 first. If there is a problem with TP10, 11 or 13, measure the respective test points on the PC412. These voltages are routed from the power supply, to the PC412 to the PC410. Follow the recommended procedure under POWER PROBLEM section. Check TP4 on PC410. This is the command test point for the ozone generator. The value of this test point will be dependent on several factors. However, the voltage should normally measure above .1 VDC. Note: If determining an ozone problem using the internal photometer, also refer to the photometer problem section. Try verifying the ozone problem with an external source to isolate the problem either to the ozone generator or photometer. 6103 SERVICE MANUAL – REV 5 32 If the command voltage is present and all steady state voltages are good, the problem may either be with the ozone lamp or the PC410 circuitry for driving the lamp. Replace the lamp or PC410. If the command voltage is not present, try a higher ozone command to be sure that the command is not to low. This voltage is generated by the PC412 using the same DAC as the MFCs. Generally, if the MFCs are functioning, it will not be related to the DAC on the PC412. However, measure the common reference voltage at TP7 on PC412. This voltage should be 5 VDC. Also, make sure that all ozone calibration data (SYSTEM MODE) is valid and consistent with either the data generated by the last calibration or the hardcopies supplied by Environics for the factory calibration. OCTOBER 2011 6103 SERVICE MANUAL – REV 5 33 OCTOBER 2011 OZONE PROBLEMS (CONT.) SOLUTION Ozone is drifting System has not warmed up long enough with ozone. Especially when a system is new, the generator may drift up to 30 minutes before stabilizing. Especially if the photometer is not being used to control the ozone generator. If the system is not used on a daily basis, drift will be more common. Environics recommends that during the power up period, the system be run with ozone to help condition the plumbing and burn in the lamp. A 1 hour period is recommended. Make sure that the ozone block temperature is stable. A drifting block temperature will cause the ozone to drift. The ozone block temperature should be stable between 48 and 51 degrees C and can be monitored on TP15 on PC410. The voltage should be between 4.8 and 5.1 VDC. Make sure that the ozone command is not drifting, TP4 on PC410. This command voltage is also impacted by pressure correction when the photometer control loop is off. If TP4 is drifting, check TP17 for stability as well. If TP17 is drifting, disable pressure correction in PREFS and run again. If the ozone becomes stable, then there is a false indication of pressure drift. Replace PC410. If drift is consistent despite burn in, replace the ozone lamp. Optics have become contaminated by external contaminate (EX. Oil from compressor system). Replace ozone generator. 6103 SERVICE MANUAL – REV 5 34 OCTOBER 2011 OZONE PROBLEMS (CONT.) SOLUTION Ozone is present without command. Make sure that the zero potentiometer (R46) is adjusted so that the voltage at TP2 on PC410 is between 80 and 100 mv with a zero ozone command. Note: Any adjustments to this potentiometer will affect calibration. If this adjustment is set incorrectly (to low), it can cause the ozone lamp to light with no command. Ensure that the command voltage at TP4 on PC410 is zero. Lamp drive circuit or photo detector circuit on the PC410 may be bad; replace PC410. Note, whenever replacing the PC410, the ozone generator will need to be recalibrated. Photometer control loop is on and pump is not activated or engaged. Verify the pump is on or turn the control loop off as outlined in the user’s manual. Verify ozone calibration data. PC410 photo detector circuit has failed. Replace PC410. If using the photometer control loop to control the ozone generator, turn the control loop off to verify if instability is related to the photometer control. If so, proceed to troubleshooting section for photometer problems. Check ozone block temperature and pressure test points as outlined in the ozone drift section. Ozone level is high when commanding ozone and cannot be controlled. Ozone level is not stable. 6103 SERVICE MANUAL – REV 5 35 OCTOBER 2011 OZONE PROBLEMS (CONT.) SOLUTION Ozone level is not stable. Noisy lamp, replace lamp. PC410 is generating noisy lamp signal. Replace PC410. Note: Whenever replacing the PC410, the ozone generator will need to be recalibrated. PHOTOMETER PROBLEMS SOLUTION Not reading ozone. If in the photometer mode and trying to read external source of ozone, make sure that the vented source of ozone is connected to the SAMPLE IN port and zero air is connected to REFERENCE port at 25 PSIG, pump is running, all photometer diagnostic information is correct according to PHOTO section of user’s manual, photometer valve V2 is switching at a rate of once every 4 seconds, all test points on PC415 are consistent with values indicated in PCB FUNCTION AND TEST POINT section of this manual. Photometer intensities are at or close to zero. Lamp is defective; PC414 or PC415 lamp drive circuit is bad. Replace lamp, PC414 or PC415. Pump is not running. Replace pump assembly. Photometer valve V2 is not switching. With the system power off, disconnect solenoid valve connector between PC401 and V2. Measure the DC resistance of V2. The resistance should be approximately 80 ohms. If resistance is good, PC401 high current driver circuit may be bad or solenoid valve plunger is stuck. Replace PC401 or valve. 6103 SERVICE MANUAL – REV 5 36 OCTOBER 2011 PHOTOMETER PROBLEMS (CONT.) SOLUTION Not reading ozone. In photometer mode continued V1 is not activating. With the system power off, disconnect solenoid valve connector between PC401 and V1. Measure the DC resistance of V1. The resistance should be approximately 80 ohms. If resistance is good, PC401 high current driver circuit may be bad or solenoid valve plunger is stuck. Replace PC401 or valve. If in the flow or concentration mode and ozone is being generated by the 6103, most of the items in the section above apply, except for V1 and the SAMPLE IN port. Ozone generator is not functioning. Reference the section for ozone problems. PHOSRC is EXT instead of INT. Press the MENU key and change PHOSRC to INT. PHOTOMETER PROBLEMS SOLUTION During GPT, N02 values keep rising or over titration occurs. 6103 SERVICE MANUAL – REV 5 37 O3CTRL is set to ON during GPT. Set 03 control to OFF or LOCK during GPT. See user’s manual for more information. OCTOBER 2011 PHOTOMETER PROBLEMS SOLUTION Noisy photmeter readings Pump intake or outlet valves are not sealing properly. This will also cause photometer readings to be low, as the reference gas will mix with sample gas. Place a small amount of restriction on the EXHAUST port (use a 6” piece of 1/8” tubing). With the photometer loop off (if in the FLOW or CONC mode) the ozone level should drop off significantly and become very noisy. This is an indication that the pump intake or outlet valves have become partially blocked. Photometer tube is dirty. Clean photometer tube as outlined in the Routine Maintenance section of this manual. External electrical noise is a factor. Make sure that the system cover is on and a screws are secure. This will create a better chassis ground and the system will not be as susceptible to electrical noise. REFERENCE port pressure is too high or to low. Ensure that the gas pressure on the REFERENCE port is between 20 and 30 PSIG. Insufficient gas for 6103 photometer. Make sure that 2 LPM is considered for the photometer when delivering gas to external analyzers. MISCELLANEOUS PROBLEMS SOLUTION Memory loss 6103 SERVICE MANUAL – REV 5 38 Battery on PC401 is low. Battery should be 3 VDC and no less than 2 VDC. OCTOBER 2011 MISCELLANEOUS PROBLEMS (CONT.) SOLUTION Status input and output problems Ensure that all test points are correct according to the PCB function and test point section of this manual for the PC416. Ensure that all inputs and outputs are setup as outlined in the user’s manual and PCB function and test point section of this manual for the PC416. Replace PC416 Memory loss Battery on PC401 is low. Battery should be 3 VDC and no less than 2 VDC. Analog output is not correct Check all PC415 test points Replace PC415 Troubleshooting notes: 1. Be sure to use a grounding strap when handling electronics. 2. When troubleshooting, never unplug either valve V1 or V2 with the power on. 3. These are general guidelines for Troubleshooting. Contact Environics technical services for additional help on system problems. 4. Newer systems, as of 11/02, use a chassis with hinged side panels. This allows the side panels to be dropped for troubleshooting purposes. The cable lengths will allow the system to be powered on while the panels are dropped. However, always power down before dropping the panels. 6103 SERVICE MANUAL – REV 5 39 OCTOBER 2011 TEST POINT WAVEFORMS PC406 TP3 2 V/div PC410 TP5 &TP7 10 V/div PC410 TP5 &TP7 50 V/div 6103 SERVICE MANUAL – REV 5 40 OCTOBER 2011 TEST POINT WAVEFORMS (CONT.) PC415 TP16 &TP17 10 V/div PC415 TP19 PC416 TP3 500 mv/div 2 V/div 6103 SERVICE MANUAL – REV 5 41 OCTOBER 2011 NOTE: The information (Vp-p, Freq and Duty cy) listed on the above graphs was generated by an oscilloscope. The values will vary slightly from system to system and scope to scope. The object is to verify that the signal generated by these test points is similar to that seen in the graph. 5 7 6 8 4 1 2 3 PIN NUMBER VOLTAGE 1 +15 VDC 2 -15 VDC 3 GND 4 GND 5 GND 6 +5 VDC 7 +24 VDC 8 NC POWER CABLE DIAGRAM 6103 SERVICE MANUAL – REV 5 42 OCTOBER 2011 PC406 6103 SERVICE MANUAL – REV 5 43 OCTOBER 2011 PC410 SOLDER SIDE 6103 SERVICE MANUAL – REV 5 44 OCTOBER 2011 PC410 COMPONENT SIDE 6103 SERVICE MANUAL – REV 5 45 OCTOBER 2011 PC412 6103 SERVICE MANUAL – REV 5 46 OCTOBER 2011 PC414 6103 SERVICE MANUAL – REV 5 47 OCTOBER 2011 PC415 6103 SERVICE MANUAL – REV 5 48 OCTOBER 2011 PC416 6103 SERVICE MANUAL – REV 5 49 OCTOBER 2011 6103 SERVICE MANUAL – REV 5 50 OCTOBER 2011 6103 SERVICE MANUAL – REV 5 51 OCTOBER 2011 6103 SERVICE MANUAL – REV 5 52 OCTOBER 2011 6103 SERVICE MANUAL – REV 5 53 OCTOBER 2011 6103 SERVICE MANUAL – REV 5 54 OCTOBER 2011 6103 SERVICE MANUAL – REV 5 55 OCTOBER 2011 +15V 6103 SERVICE MANUAL – REV 5 56 OCTOBER 2011 6103 SERVICE MANUAL – REV 5 57 OCTOBER 2011 6103 SERVICE MANUAL – REV 5 58 OCTOBER 2011 6103 SERVICE MANUAL – REV 5 59 OCTOBER 2011 6103 SERVICE MANUAL – REV 5 60 OCTOBER 2011 6103 SERVICE MANUAL – REV 5 61 OCTOBER 2011