1
1303.6580.32 – 01
Test and Measurement Division
Operating Manual
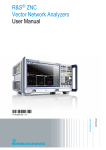
R&S® ZVL
Vector Network Analyzer
®
This Quick Start Guide describes the following R&S ZVL models:
®
R&S ZVL3 (frequency range up to 3 GHz), stock no. 1303.6509.03
®
R&S ZVL6 (frequency range up to 6 GHz), stock no. 1303.6509.06
© Rohde & Schwarz, GmbH & Co KG
81671 Munich, Germany, 2006
Printed in Germany - Subject to change
R&S® is a registered trademark of Rohde & Schwarz GmbH & Co. KG.
Trade names are trademarks of the owners.
The following abbreviations are used throughout this manual:
R&S® ZVL is abbreviated with R&S ZVL, R&S® FSL-xxx with R&S FSL-xxx
®
R&S ZVL
ZVL Documentation Map
ZVL Documentation Map
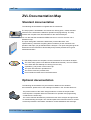
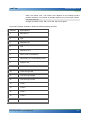
Standard documentation
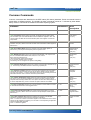
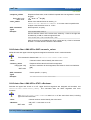
The following documentation is supplied with the instrument.
The help system is embedded in the instrument, offering quick, context-sensitive
reference to the information needed for operation and programming. The help
contains the complete user documentation for the network analyzer.
You can also transfer the help file RSZVLhelp.chm to your PC and use it as a
standalone help.
The quick start guide contains the data sheet (“Product Brochure” and
“Specifications”), describes everything that is needed to put the instrument into
operation and helps you get familiar with the analyzer. The quick start guide gives an
introduction to the instrument’s functionality and provides procedures for typical
measurement tasks.
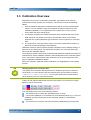
The CD-ROM provides the complete user documentation for the network analyzer:
The online help system in two different HTML-based formats (*.chm for transfer
to the hard disk and WebHelp for viewing from the CD).
A printable (*.pdf) version of the online help.
The quick start manual in printable form.
The service manual in printable form.
Links to different useful sites in the R&S internet.
Optional documentation
The following documentation may be ordered in addition to the standard
documentation; please refer to the ordering information in the “Product Brochure”.
The printed version of the online help provides the contents of the quick start
manual plus the complete reference information for operation and programming
contained in the online help.
The service manual describes the performance test of the analyzer and gives hints
for troubleshooting and repair. The manual explains the instrument down to module
level and provides the information needed for module installation and exchange.
Quick Start Guide 1303.6538.62-01
3
®
R&S ZVL
Glossary of Terms
Glossary of Terms
A
Active channel: Channel belonging to the active trace. The active channel is
highlighted in the channel list below the diagram. The active channel is not relevant in
remote control where each channel can contain an active trace.
Active marker: Marker that can be changed using the settings of the Marker menu
(Delta Mode, Ref. Mkr -> Mkr, Mkr Format). The active marker is also used for the
Marker Functions. It appears in the diagram with an enlarged marker symbol and font
size and with a dot placed in front of the marker line in the info field.
Active menu: The menu containing the last executed command. If the softkey bar is
displayed (Display - Config./View - Softkey Labels on), then the active menu is
indicated on top of the softkey bar.
Active trace (manual control): Trace that is selected to apply the settings in the
Trace menu. The active trace is highlighted in the trace list of the active diagram area.
It can be different from the active trace in remote control.
Active trace (remote control): One trace of each channel that has been selected as
the active trace (CALCulate[Ch]:PARameter:SELect <Trace Name>). Many
commands (e.g. TRACE...) act on the active trace. It can be different from the active
trace in manual control.
C
Cal pool: The cal pool is a collection of correction data sets (cal groups) that the
analyzer stores in a common directory. Cal groups in the pool can beapplied to
different channels and setups.
Calibration: The process of removing systematic errors from the measurement
(system error correction). See also TOSM, TOM, TRM, TRL, TNA.
Calibration kit: Set of physical calibration standards for a particular connector family.
Calibration standard: Physical device that has a known or predictable magnitude and
phase response within a given frequency range. Calibration standards are grouped
into several types (open, through, match,...) corresponding to the different input
quantities for the analyzer's error models.
Calibration unit: Integrated solution for automatic calibration of 1 to 4 ports
(accessory ZV-Z41). The unit contains calibration standards that are electronically
switched when a calibration is performed.
Channel: A channel contains hardware-related settings to specify how the network
analyzer collects data. Each channel is stored in an independent data set. The channel
settings complement the definitions of the Trace menu; they apply to all traces
assigned to the channel.
Confirmation dialog box: Standard dialog box that pops up to display an error
message or a warning. The current action can be either continued (OK) or cancelled
(Cancel) on closing the dialog box.
Crosstalk: The occurrence of a signal at the receive port of the analyzer which did not
travel through the test setup and the DUT but leaks through other internal paths.
Crosstalk causes an isolation error in the measurement which can be corrected by
Quick Start Guide 1303.6538.62-01
4
®
R&S ZVL
Glossary of Terms
means of a calibration.
D
Data trace: Trace filled with measurement data and updated after each sweep
(dynamic trace).
Diagram area: Rectangular portion of the screen used to display traces. Diagram
areas are arranged in windows; they are independent of trace and channel settings.
Directivity error: Measurement error caused by a coupler or bridge in the analyzer's
source port causing part of the generated signal to leak through the forward path into
the receive path instead of being transmitted towards the DUT. The directivity error
can be corrected by means of a full one port calibration or one of the two-port
calibration methods (except normalization).
Discrete marker: The stimulus value of a discrete marker always coincides with a
sweep point so that the marker does not show interpolated measurement values.
E
Excursion: Difference between the response values at a local maximum (minimum) of
the trace and at the two closest local minima (maxima) to the left and to the right.
F
Forward: A measurement on a two-port DUT is said to be in forward direction if the
source signal (stimulus) is applied to port 1 of the DUT.
I
Isolation error: Measurement error caused by a crosstalk between the source and
receive port of the analyzer.
L
Limit check: Comparison of the measurement results with the limit lines and display of
a pass/fail indication. An acoustic warning can be generated in addition if a limit is
exceeded.
Limit line: A limit line is a set of data to specify the allowed range for some or all
points of a trace. Typically, limit lines are used to check whether a DUT conforms to
the rated specifications (conformance testing).
Load match error: Measurement error caused by a mismatch of the analyzer's
receive (load) port causing part of the signal transmitted through the DUT to be
reflected off the receive port so that it is not measured there. The load match error can
be corrected by means of a two-port calibration (except normalization).
M
Marker: Tool for selecting points on the trace and for numerical readout of measured
data. A marker is displayed with a symbol (a triangle, a crossbar or a line) on the trace;
its coordinates are shown in the marker info field.
Quick Start Guide 1303.6538.62-01
5
®
R&S ZVL
Glossary of Terms
Mathematical trace: Trace that is calculated according to a mathematical expression,
e.g. the one defined in the Define Math dialog. The expression is a mathematical
relation between constants and the data or memory traces of the active setup.
Measurement point: Result of the measurement at a specified stimulus value
(frequency/power/time).
Measurement result: Set of all measurement points acquired in a measurement (e.g.
a sweep). The measurement result is displayed in a diagram area and forms a trace.
Memory trace: Trace that is associated to a data trace and stored in the memory.
Data traces and the associated memory traces share the same channel and scale
settings. Alternatively, memory traces can be imported from a file.
P
Partial measurement: Measurement at a specified stimulus value maintaining definite
hardware settings. Depending on the measurement type, several partial
measurements may be needed to obtain a measurement point. A full n-port Sparameter measurement requires n partial measurements with n different drive ports.
Peak: Local maximum or local minimum (dip) on the trace. In the Trace - Search
menu, it is possible to define a minimum excursion that both types of peaks must have
to be considered valid.
R
Reflection tracking error: Frequency-dependent variation of the ratio of the reflected
wave to the reference wave at a test port when an ideal reflection coefficient (= 1) is
measured. The reflection tracking error can be corrected by means of a reflection
normalization or one of the more sophisticated calibration methods.
Reverse: A measurement on a two-port DUT is said to be in reverse direction if the
source signal (stimulus) is applied to port 2 of the DUT.
S
Setup: A setup comprises a set of diagram areas with all displayed information that
can be stored to a NWA setup file (*.zvx). Each setup is displayed in an independent
window.
Source match error: Measurement error caused by a mismatch of the analyzer's
source port causing part of the signal reflected off the DUT to be reflected again off the
source port so that it is not measured there. The source match error can be corrected
by means of a full one-port calibration or a two-port calibration (except normalization).
Stimulus value: Value of the sweep variable (frequency/power/time/point number)
where a measurement is taken. Also termed sweep point.
Sweep: Series of consecutive measurements taken at a specified sequence of
stimulus values = series of consecutive measurement points.
Sweep point: Value of the sweep variable (stimulus value: frequency/power/time)
where a measurement is taken.
Sweep range: Continuous range of the sweep variable (frequency/power/time)
containing the sweep points where the analyzer takes measurements. In a Segmented
Frequency sweep the sweep range can be composed of several parameter ranges or
single points.
Quick Start Guide 1303.6538.62-01
6
®
R&S ZVL
Glossary of Terms
Sweep segment: Continuous frequency range or single frequency point where the
analyzer measures at specified instrument settings (generator power, IF bandwidth
etc.). In the Segmented Frequency sweep type the entire sweep range can be
composed of several sweep segments.
T
TOSM: A calibration type using four known standards (through, open, short, match),
also called SOLT or 12-term error correction model. TOSM calibration is available for
2, 3 and 4-port measurements.
Trace: A trace is a set of data points that can be displayed together on the screen. The
trace settings specify the mathematical operations used to obtain traces from the
collected data. They complement the definitions of the Channel menu. Each trace is
assigned to a channel. The channel settings apply to all traces assigned to the
channel.
Trace point: Point on the screen which is an element of the displayed trace. The trace
points for ratios and wave quantities can be derived from the entire set of
measurement points using different detector settings.
Transmission tracking error: Frequency-dependent variation of the ratio of the
transmitted wave to the reference wave at a test port when an ideal transmission
coefficient (= 1) is measured. The transmission tracking error can be corrected by
means of a transmission normalization or one of the more sophisticated calibration
methods.
W
Window: Rectangular portion of the screen showing all diagram areas of a particular
setup. Windows are limited by a blue frame with several icons. The analyzer uses
standard windows provided by the operating system.
Quick Start Guide 1303.6538.62-01
7
®
R&S ZVL
Preparing for Use
Front Panel Tour
1
Preparing for Use............................................................................... 11
1.1
Front Panel Tour .........................................................................................................11
1.1.1
Display ..........................................................................................................................12
1.1.2
Setup Keys....................................................................................................................12
1.1.3
Function Keys ...............................................................................................................13
1.1.4
Navigation Keys ............................................................................................................14
1.1.5
Data Entry Keys ............................................................................................................15
1.1.6
Rotary Knob ..................................................................................................................16
1.1.7
Standby Key..................................................................................................................16
1.1.8
Test Ports......................................................................................................................17
1.1.9
USB Connectors ...........................................................................................................17
1.1.10
PROBE POWER...........................................................................................................18
1.2
Rear Panel Tour ..........................................................................................................19
1.3
Putting the Instrument into Operation......................................................................21
1.3.1
Unpacking the Instrument and Checking the Shipment ...............................................21
1.3.2
Instrument Setup ..........................................................................................................22
1.3.3
Bench Top Operation....................................................................................................22
1.3.4
Mounting in a 19" Rack.................................................................................................23
1.3.5
EMI Protective Measures..............................................................................................23
1.3.6
Power Supply Options ..................................................................................................23
1.3.7
Connecting the Instrument to the AC Supply ...............................................................24
1.3.8
Power on and off...........................................................................................................24
1.3.9
Standby and Ready State with AC Power Supply ........................................................25
1.3.10
Replacing Fuses ...........................................................................................................25
1.3.11
DC Power Supply and Battery ......................................................................................26
1.3.12
Charging the Battery.....................................................................................................26
1.4
Maintenance ................................................................................................................28
1.4.1
Storing and Packing......................................................................................................28
1.5
Starting the Analyzer and Shutting Down................................................................29
1.6
Connecting External Accessories.............................................................................30
Quick Start Guide 1303.6538.62-01
9
®
R&S ZVL
Preparing for Use
Front Panel Tour
1.6.1
Connecting a Mouse .....................................................................................................30
1.6.2
Connecting a Keyboard ................................................................................................30
1.6.3
Connecting a Printer .....................................................................................................31
1.6.4
Connecting a LAN Cable ..............................................................................................32
1.7
Remote Control in a LAN ...........................................................................................33
1.7.1
Assigning an IP Address...............................................................................................33
1.7.2
Remote Desktop Connection........................................................................................35
1.8
Windows XP ................................................................................................................36
1.8.1
Accessing Windows XP's Start Menu...........................................................................36
1.9
Firmware Update.........................................................................................................37
Quick Start Guide 1303.6538.62-01
10
®
R&S ZVL
Preparing for Use
Front Panel Tour
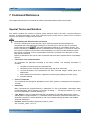
1 Preparing for Use
This chapter gives an overview of the front panel controls and connectors of the
network analyzer and gives all information that is necessary to put the instrument into
operation and connect external devices. Notes on reinstallation of the analyzer
software appear at the end of the chapter.
CAUTION
General Safety Instuctions
Please make sure to observe the instructions of the following sections so that you
cannot endanger people or cause damage to the instrument. This is of particular
importance when you use the instrument for the first time. Also observe the general
safety instructions at the beginning of this manual.
Chapter 2 of this manual provides an introduction to the operation of the analyzer by
means of typical configuration and measurement examples; for a description of the
operating concept and an overview of the instrument’s capabilities refer to Chapter 3.
For all reference information concerning manual and remote control of the instrument
refer to the online help system or its printed/printable version. A more detailed
description of the hardware connectors and interfaces is also part of the help system.
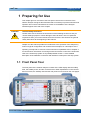
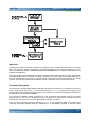
1.1 Front Panel Tour
The front panel of the network analyzer consists of the VGA display with the softkey
area, the hardkey areas, and the connectors area. Brief explanations on the controls
and connectors, the hardkey area and the rear panel can be found on the next pages.
Quick Start Guide 1303.6538.62-01
11
®
R&S ZVL
Preparing for Use
Front Panel Tour
1.1.1 Display
The analyzer is equipped with a color display providing all control elements for the
measurements and the diagram areas for the results.
Refer to section Navigation Tools of the Screen in Chapter 3 to learn how to use
menus, keys and softkeys.
Refer to section Display Elements in Chapter 3 to obtain information about the
results in the diagram area.
Refer to section Display Menu in the online help system and learn how to
customize the screen.
Refer to the data sheet for the technical specifications of the display.
TIP
Screen saver
The screen saver function of the operating system switches off the display if the
analyzer receives no command for more than a specified period of time. It is switched
on again if any front panel key is pressed. To change the screen saver properties,
connect an external keyboard, press CTRL + ESC to open Windows XP's start menu,
and click Control Panel – Display – Screen Saver.
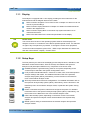
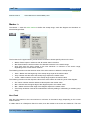
1.1.2 Setup Keys
The front panel keys to the left of the display provide utility functions, assistance, and
alternative measurement modes. Some of the keys are related to the spectrum
analyzer mode (with option R&S ZVL-K1), irrespective of the active mode.
PRESET performs a general factory preset or user preset, depending on the
"Preset Scope" selected in the System Configuration menu.
FILE provides standard Windows™ functions to create, save, and recall spectrum
analyzer settings and results. For detailed information refer to the spectrum
analyzer help system (HELP). Alternatively, use the functions in the Nwa-File
menu of the network analyzer mode.
SETUP provides basic instrument configurations. For detailed information refer to
the spectrum analyzer help system (HELP). Alternatively, use the functions in the
Nwa-Setup menu of the network analyzer mode, in particular the System Config.
settings.
PRINT customizes the printout, selects and configures the printer. For detailed
information refer to the spectrum analyzer help system (HELP). Alternatively, use
the functions in the Nwa-File menu of the network analyzer mode
HELP calls the help system, depending on the active context. The network
analyzer and spectrum analyzer modes are described in two separate help
systems.
MODE opens a dialog to switch between the network analyzer and spectrum
analyzer modes.
Quick Start Guide 1303.6538.62-01
12
®
R&S ZVL
Preparing for Use
Front Panel Tour
MENU activates the highest softkey menu level of the current spectrum analyzer
context. For detailed information refer to the spectrum analyzer help system
(HELP). In network analyzer mode, use the Function Keys or the menus across the
top of the main application window.
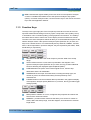
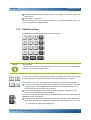
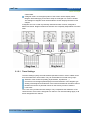
1.1.3 Function Keys
The keys in the upper right part of the front panel provide direct access to the most
important measurement settings. Each key opens a drop-down menu (softkey menu)
or activates a menu command (softkey) of the graphical user interface. The softkeys
are hidden after a while to make room for the display and the measurement results.
The links in the short descriptions below will take you to the detailed description for the
network analyzer mode. If the spectrum analyzer option (R&S ZVL-K1) is active, the
keys have a similar function. The network analyzer keys SCALE, FORMAT, and CAL
have no direct equivalent in spectrum analysis; they are replaced by the AMPT, TRIG,
and RUN keys, respectively.
CENTER or SPAN define the center frequency and the width of the sweep
range.
SCALE defines how the current trace is presented in the diagram. If the
spectrum analyzer option (R&S ZVL-K1) is active, the key provides additional
functions affecting the displayed signal amplitude (AMPT).
PWR BW defines the power of the internal signal source, sets the step
attenuators and the IF bandwidths.
SWEEP defines the scope of measurement, including the sweep type, the
number of points, the measurement delay and the periodicity of the
measurement.
FORMAT defines how the measured data is presented in the graphical display.
If the spectrum analyzer option (R&S ZVL-K1) is active, the key provides trigger
settings (TRIG).
MKR positions markers on a trace, configures their properties and selects the
format of the numerical readout.
MARKER-> provides marker functions that allow you to search for values on
traces, define the sweep range, scale the diagram, and introduce an electrical
length offset.
Quick Start Guide 1303.6538.62-01
13
®
R&S ZVL
Preparing for Use
Front Panel Tour
CAL provides all functions that are necessary to perform a system error
correction (calibration). If the spectrum analyzer option (R&S ZVL-K1) is active,
the key starts a new measurement (RUN).
MEAS selects the quantity to be measured and displayed.
LINES defines limits for measured values and activates the limit check.
TRACE provides functions to handle traces in diagram areas, evaluate trace
statistics, and store trace data.
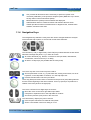
1.1.4 Navigation Keys
The navigation keys below the rotary knob are used to navigate within the analyzer
screen and the Help system, to access and control active elements.
The Left Field (= Tab) or Right Field (= Shift Tab) keys switch between several active
elements in dialogs and panes, e.g. in order to access:
All control elements (e.g. buttons, numerical or text input fields, radio buttons,
checkmarks, combo boxes etc.) in a dialog
All links in a Help topic (not possible with the rotary knob)
The Cursor Up and Cursor Down keys are used to:
Scroll up and down in lists, e.g. in pull-down lists, among menu items, in a list of
keywords, in the Help table of contents, or in the Help topic text
Increase and decrease numeric input values
Cursor Up (Down) become inactive or switches to the previous (next) dialog element
as soon as the beginning of the list is reached. Cursor Up (Down) is equivalent to a
rotation of the rotary knob to the right (left).
The Cursor Left and Cursor Right keys are used to:
Move the cursor to the left or right within input fields
Compress or expand menus or the Help table of contents
Access the previous (next) menu in the menu bar
The Checkmark (= Space) key can be used to
Insert a space character into character entry fields
Switch a checkmark control in a dialog on or off
Quick Start Guide 1303.6538.62-01
14
®
R&S ZVL
Preparing for Use
Front Panel Tour
Activate the selected active control element, e.g. a button in a dialog or a link in the
Help system
Scroll down in Help topic
The Next Tab key opens the next tab of a dialog, e.g. in the Help navigation pane or in
some of the spectrum analyzer dialogs.
1.1.5 Data Entry Keys
The data entry keys are used to enter numbers and units.
NOTE
Key activation
The data entry keys are only enabled while the cursor is placed on a data input field in
a dialog or in the Help navigation pane.
The keys 0 to 9 enter the corresponding numbers. In addition, these keys can be used
to insert characters in character input fields; see section Data Entry in chapter 2.
...
The function of the . and – keys depends on the data type of the active input field:
In numeric input fields, the keys enter the decimal point and change the sign of the
entered numeric value. Multiple decimal points are not allowed; pressing – for a
second time cancels the effect of the first entry.
In character input fields, the keys enter a dot and a hyphen, respectively. Both
entries can be repeated as often as desired.
...
The function of the four unit keys depends on the data type of the active input field; see
Data Entry section in Chapter 3.
In numeric input fields (e.g. in the numeric entry bar), the GHz / -dBm, MHz / dBm,
(-)9
(-)6
(kHz / dB or Hz / dB.. keys multiply the entered value with factors of 10 , 10 , 10
)3
or 1 and add the appropriate physical unit.
Quick Start Guide 1303.6538.62-01
15
®
R&S ZVL
Preparing for Use
Front Panel Tour
In character input fields, the keys are inactive.
ENTER is used to:
Activate the selected active control element, e.g. a button in a dialog or a link in the
Help
Confirm selections and entries made and close dialogs
ENTER is equivalent to pressing the rotary knob.
The ESC CANCEL key is used to:
Close dialogs without activating the entries made (equivalent to the Close button)
Close the Help
BACK deletes the last character before the cursor position or the selected character
sequence. If an entire numeric value is selected, BACK deletes the whole entry.
1.1.6 Rotary Knob
The rotary knob can be turned in both directions or pressed.
Turning the rotary knob is equivalent to the action of the cursor up and down keys.
Turn the knob in order to
Increase or decrease numerical values
Scroll within lists
Switch to the previous or next dialog element
Pressing the rotary knob is equivalent to the action of the ENTER key. Press the knob
in order to:
Activate the selected active control element, e.g. a button in a dialog or a link in the
Help
Confirm selections and entries made and close dialogs
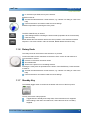
1.1.7 Standby Key
The standby toggle switch is located in the bottom left corner of the front panel.
The key serves two main purposes:
Toggle between standby and ready state, if the instrument is AC-supplied.
Save settings, shut down and switch off, if the instrument is DC or batterysupplied.
Quick Start Guide 1303.6538.62-01
16
®
R&S ZVL
Preparing for Use
Front Panel Tour
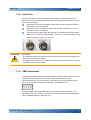
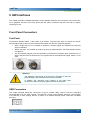
1.1.8 Test Ports
N-connectors labelled PORT 1 and PORT 2/ RF INPUT. The test ports serve as
outputs for the RF stimulus signal and as inputs for the measured RF signals from the
DUT (response signals).
With a single test port, it is possible to generate a stimulus signal and measure
the response signal in reflection.
With 2 test ports, it is possible to perform full two-port measurements; see SParameters section in Chapter 3.
The two network analyzer ports are equivalent. If the Spectrum Analysis option
(R&S ZVL-K1) is active, test port PORT 2 serves as an AC-coupled input for the
analyzed RF signal; PORT 1 is not used.
ATTENTION
Input levels
The maximum input levels at all test ports according to the front panel labeling or the
data sheet must not be exceeded.
In addition, the maximum input voltages of the other input connectors at the front and
rear panel must not be exceeded.
1.1.9 USB Connectors
Two single Universal Serial Bus connectors of type A (master USB), used to connect a
keyboard (recommended: PSL–Z2, order number 1157.6870.03), mouse
(recommended: PSL–Z10, order number 1157.7060.03) or other pointing devices, a
printer or an external storage device (USB stick, CD-ROM drive etc.).
Using an adapter cable (R&S NRP–Z4), a power sensor can be connected, as an
alternative to the power sensor connector on the rear panel that is only available with
option Additional Interfaces, R&S FSL–B5.
Quick Start Guide 1303.6538.62-01
17
®
R&S ZVL
Preparing for Use
Front Panel Tour
NOTE
EMI conformity, cable length
For maintaining the EMI conformity of the R&S ZVL only appropriate USB accessories
may be used.
Passive connecting USB cables should not exceed 4 m in length. Use the original
USB connecting cable or another high–quality cable. The maximum current per USB
port is 500 mA.
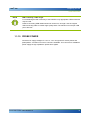
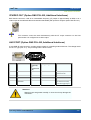
1.1.10 PROBE POWER
Connector for supply voltages of +15 V to –12 V and ground for active probes and
preamplifiers. A maximum current of 140 mA is available. This connector is suitable as
power supply for high-impedance probes from Agilent.
Quick Start Guide 1303.6538.62-01
18
®
R&S ZVL
Preparing for Use
Rear Panel Tour
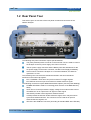
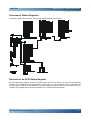
1.2 Rear Panel Tour
This section gives an overview of the rear panel controls and connectors of the
network analyzer.
The following rear panel connectors require special attention:
The (fuse-protected) mains connector in the lower left corner is used to connect
the analyzer to the AC power supply; see Power on and off.
The DC power supply connector and the Battery Pack are alternatives for the
AC power supply via the mains connector; see DC Power Supply and Battery.
LAN is used to connect the analyzer to a Local Area Network; see Remote
Operation in a LAN.
The remaining rear connectors are described in detail in the annex Hardware
Interfaces in the online help system.
EXT. TRIGGER / GATE IN is an input for external TTL trigger signals.
EXT REF serves as an input for an external 10 MHz reference signal.
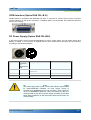
The following connectors require additional hardware options (see rear panel labeling):
POWER SENSOR is used for connecting power sensors of the R&S NRP-Zxy
family.
Noise Source Control provides the supply voltage for an external noise source.
IF/VIDEO OUT is an output for the IF signal or video signal.
AUX PORT provides control signals for external devices.
OCXO provides the internal 10 MHz reference signal, which may be used to
synchronize external devices. The connector can be used as an input for
external reference signals, too.
IEC Bus is the GPIB bus connector (according to standard IEEE 488 / IEC 625).
Quick Start Guide 1303.6538.62-01
19
®
R&S ZVL
Preparing for Use
Rear Panel Tour
ATTENTION
Input levels, AUX PORT
The maximum input levels and voltages of the input connectors at the front and rear
panel must not be exceeded.
When using the AUX PORT, watch the pin assignment carefully. A short-circuit may
damage the instrument.
Quick Start Guide 1303.6538.62-01
20
®
R&S ZVL
Preparing for Use
Putting the Instrument into Operation
1.3 Putting the Instrument into Operation
This section describes the basic steps to be taken when setting up the analyzer for the
first time.
ATTENTION
General safety instructions
Before turning on the instrument, please make sure that the following conditions are
fulfilled:
Instrument covers are in place and all fasteners are tightened.
Fan openings are free from obstructions.
Signal levels at the input connectors are all within the specified maxima.
Signal outputs are correctly connected and not overloaded.
The instrument is dry and shows no condensation.
Non-observance may cause damage to the instrument!
1.3.1 Unpacking the Instrument and Checking the Shipment
The instrument is shipped together with its mandatory accessories in a cardboard box.
In order to unpack its contents proceed as follows:
1. Open the cardboard box.
2. Remove the accessories packed into the box and take the instrument out of the
packaging.
3. Check the shipment against the list of accessories to ensure that all items are
included.
4. Remove the two protective caps from the front and rear and carefully inspect the
analyzer to make sure that it was not damaged during shipment.
Should the instrument be damaged, immediately notify the forwarder who shipped the
instrument to you and keep the container and packing material.
Equipment returned or sent in for repair must be packed in the original container or
packing with electrostatic protection. It is recommended to keep at least the two
protective caps for front and rear side in order to prevent damage to the controls and
connectors.
Quick Start Guide 1303.6538.62-01
21
®
R&S ZVL
Preparing for Use
Putting the Instrument into Operation
1.3.2 Instrument Setup
The network analyzer is designed for use under laboratory conditions, either on a
bench top or in a rack. The general ambient conditions required at the operating site
are as follows:
The ambient temperature must be in the ranges specified for operation and for
compliance with specifications (see data sheet).
All fan openings including the rear panel perforations must be unobstructed. The
distance to the wall should be at least 10 cm.
ATTENTION
Electrostatic discharge
To avoid damage of electronic components of the DUT and the analyzer, the
operating site must be protected against electrostatic discharge (ESD). ESD is most
likely to occur when you connect or disconnect a DUT or test fixture to the analyzer's
test ports.
To prevent ESD damage use a wrist strap and grounding cord and connect yourself to
ground.
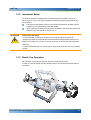
1.3.3 Bench Top Operation
If the analyzer is operated on a bench top, the surface should be flat.
In order to move the handle into the desired position, pull at both side knobs and turn
the handle.
Quick Start Guide 1303.6538.62-01
22
®
R&S ZVL
Preparing for Use
Putting the Instrument into Operation
WARNING
Danger of injury
To avoid injuries, place the instrument on a stable surface and do not stack other
instruments or material on top of it.
1.3.4 Mounting in a 19" Rack
Using the adapter R&S ZZA-S334 (order no. 1109.4487.00) the instrument can be
mounted in 19" racks according to the mounting instructions supplied with the rack
adapter.
Allow for sufficient air supply in the rack.
Make sure that there is sufficient space between the ventilation holes and the
rack casing.
ATTENTION
1.3.5 EMI Protective Measures
In order to avoid electromagnetic interference, the instrument may only be operated
when it is closed and with all shielding covers fitted. Only appropriate shielded signal
and control cables may be used.
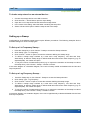
1.3.6 Power Supply Options
The R&S ZVL is equipped with an AC power supply connector. In order to use the
analyzer independently from an AC power supply, it can be fitted with a DC power
supply connector (option DC Power Supply, R&S FSL–B30) and/or a battery pack
(option NIMH Battery Pack, R&S FSL–B31). Refer toDC Power Supply and Battery for
further information.
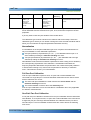
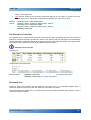
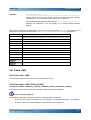
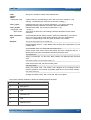
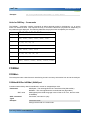
From the available power supplies, the R&S ZVL selects the one to use according to
the following priority scheme:
Priority
Power Supply
1
AC power supply
2
DC power supply
3
Battery
Quick Start Guide 1303.6538.62-01
23
®
R&S ZVL
Preparing for Use
Putting the Instrument into Operation
For example, if the R&S ZVL is connected to both an AC and a DC power supply, it
uses the AC power supply. If it is suddenly disconnected from the AC power supply, it
switches to the DC power supply.
1.3.7 Connecting the Instrument to the AC Supply
The network analyzer is automatically adapted to the AC supply voltage supplied. The
supply voltage must be in the range 100 V to 240 V; 50 Hz to 60 Hz (see also the
General Data section in the "Specifications"). The mains connector is located at the
bottom left corner of the rear panel.
Connect the network analyzer to the AC power source using the AC power cable
delivered with the instrument.
Since the instrument is assembled in line with the specifications for safety class
EN61010, it may only be connected to an outlet that has a ground contact.
The power consumption of the analyzer depends on the installed options (see
"Specifications").
1.3.8 Power on and off
The mains connector is located at the bottom left corner of the rear panel.
To turn the power on or off, press the AC power switch to position I (On) or 0
(Off).
After power-on, the analyzer is booted and reaches its ready state.
NOTE
The AC power switch can be permanently on. Switching off is required only if the
instrument must be completely removed from the AC power supply
Quick Start Guide 1303.6538.62-01
24
®
R&S ZVL
Preparing for Use
Putting the Instrument into Operation
1.3.9 Standby and Ready State with AC Power Supply
The standby toggle switch is located in the bottom left corner of the front panel.
In standby state, the right, amber LED is on. The standby power only supplies
the power switch circuits, the optional oven quartz (OCXO, 10 MHz reference
oscillator, option ZVAB-B4, order no. 1164.1757.02), and the battery (option
NIMH Battery Pack, R&S FSL–B31), and the fan. In this state it is safe to switch
off the AC power and disconnect the instrument from the power supply.
In ready state, all modules are power-supplied and the left, green LED is on.
After performing its startup procedure, the analyzer is ready for operation.
After using the instrument in its ready state, press the standby key to save the
current settings and reduce the power consumption. Press the standby key
again to resume your measurements quickly, avoiding the complete startup
procedure.
The standby key shows a different behavior if the R&S ZVL does not use the AC power
supply; seeDC Power Supply and Battery.
CAUTION
Power supply in standby mode
The instrument is still power-supplied while it is in standby mode.
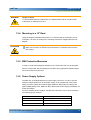
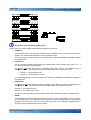
1.3.10 Replacing Fuses
The instrument is protected by two fuses (IEC 127 – T 3.15 H / 250 V) located on the
rear panel at the right side of the AC power switch.
DANGER
Shock hazard
For fuse replacement, ensure that the instrument is switched off and disconnected
from the power supply by removing the plug from the AC and DC power connector.
To replace the fuses,
1. Open the lid of the AC power connector.
2. Lift the fuse holder out of its slot.
Quick Start Guide 1303.6538.62-01
25
®
R&S ZVL
Preparing for Use
Putting the Instrument into Operation
3. Exchange the two fuses.
4. Put the fuse holder back in its slot and close the lid.
1.3.11 DC Power Supply and Battery
While the R&S ZVL is disconnected from the AC power supply, it can be supplied
either by a DC power (option DC Power Supply, R&S FSL–B30) or a battery (option
NIMH Battery Pack, R&S FSL–B31); seePower Supply Options. With DC power or
battery supply, the AC power switch on the rear panel is disabled. The standby toggle
switch on the front panel is used to switch the analyzer on or off.
While the R&S ZVL is switched off, press the standby key to initiate the startup
procedure until the R&S ZVL enters its ready state. The left, green LED is on.
While the R&S ZVL is switched on (ready), press the standby key to switch the
analyzer off. Both LEDs are off.
When using the DC power supply or battery, note the safety instructions below. Please
also refer to the detailed information about DC Power Supply and the Battery Pack.
CAUTION
DC power supply
The power supply (SELV) that is used must fulfill the requirements for
reinforced/double insulation for main supply circuits in accordance to DIN/EN/IEC
61010 (UL 61010B–1, CSA C22.2 No. 1010.1) or DIN/EN/IEC 60950 (UL 1950, CSA
C22.2 No. 950). It is recommended to fuse the DC power supply appropriately. Before
switching on the instrument check the connection for correct polarity.
CAUTION
Battery pack
The power supply that is used must fulfill the requirements for reinforced/double
insulation for main supply circuits in accordance to DIN/EN/IEC 61010 (UL 61010B–1,
CSA C22.2 No. 1010.1) or DIN/EN/IEC 60950 (UL 1950, CSA C22.2 No. 950).
Note: If the battery is not to be used for a longer time, it is recommended to remove it
and store it separately.
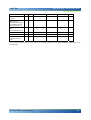
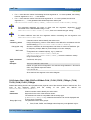
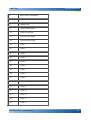
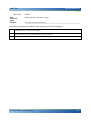
1.3.12 Charging the Battery
The battery can be charged via the AC or the DC power supply without being removed:
Quick Start Guide 1303.6538.62-01
26
®
R&S ZVL
Preparing for Use
Putting the Instrument into Operation
To charge the battery using the AC power supply, connect the instrument to the
mains supply and switch on the AC power on the rear panel. The standby key on
the front panel can be set either way.
To charge the battery using the DC power supply, connect the instrument to the
DC power supply.
If you have more than one battery packs in use, you can also charge them outside the
instrument using the power supply unit of option R&S FSL–Z4 (DC Supply for FSL–
B31, stock no. 4052.3041.00). An LED with the inscription "Charge" is switched on
during charging.
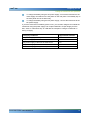
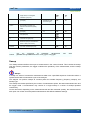
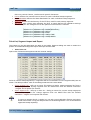
Charging conditions
Approximate duration
AC power supply, standby mode
5h
AC power supply, instrument is switched on
9h
DC power supply, instrument is switched off
5h
DC power supply, instrument is switched on
9h
External charging (battery removed)
5h
Quick Start Guide 1303.6538.62-01
27
®
R&S ZVL
Preparing for Use
Maintenance
1.4 Maintenance
The network analyzer does not require any special maintenance. Make sure that the
air vents are not obstructed. The outside of the instrument is suitably cleaned using a
soft, line-free dust cloth.
ATTENTION
Cleaning agents
Instrument damage caused by cleaning agentsCleaning agents contain substances
that may damage the instrument, e.g. solvent-containing cleaning agents may
damage the front panel labeling or plastic parts.
Never use cleaning agents such as solvents (thinners, acetone, etc), acids, bases, or
other substances.
The address of our support center and a list of useful contact addresses can be found
on the Contact page.
1.4.1 Storing and Packing
The network analyzer can be stored at the temperature range quoted in the data sheet.
When it is stored for a longer period of time the instrument should be protected against
dust.
The original packing should be used, particularly the protective caps at the front and
rear, when the instrument is to be transported or dispatched. If the original packing is
no longer available, use a sturdy cardboard box of suitable size and carefully wrap the
instrument to protect it against mechanical damage.
Quick Start Guide 1303.6538.62-01
28
®
R&S ZVL
Preparing for Use
Starting the Analyzer and Shutting Down
1.5 Starting the Analyzer and Shutting Down
To start the analyzer, proceed as follows:
If you use the AC power supply, make sure that the instrument is connected to
the mains supply and switch the power switch on the rear panel to position I
(On).
If you use the DC power supply, make sure that the instrument is connected and
press the standby key on the front panel.
The analyzer automatically performs a system check, boots the Windows XP operating
system and then starts the analyzer (NWA) application. If the last analyzer session was
terminated regularly, the NWA application uses the last setup with all instrument
settings.
To shut down the analyzer, proceed as follows:
With AC power supply, press the standby key to save the current setup, close
the NWA application, shut down Windows XP and set the instrument to standby
state. If desired, set the AC power switch to position 0 (Off).
With DC power supply or battery, press the standby key to switch the analyzer
off.
NOTE
ATTENTION
Standby key, OCXO
Do not press the standby key longer than 3 seconds.
The AC power switch also interrupts the power supply of the OCXO (option OCXO
Reference Frequency, R&S FSL–B4). When you switch the instrument back on, be
sure to comply with the extended warm–up phase specified in the data sheet.
Saving instrument settings
When using the AC power supply, it is strongly recommended to switch the analyzer
to standby state before disconnecting the power. If you set the power switch to 0 while
the NWA application is still running, you will lose the current settings. Moreover, loss
of program data can not be excluded if the application is terminated improperly.
With DC power supply or battery, it is safe to switch off the instrument using the
standby key.
Quick Start Guide 1303.6538.62-01
29
®
R&S ZVL
Preparing for Use
Connecting External Accessories
1.6 Connecting External Accessories
The equivalent USB ports on the front panel of the analyzer can be used to connect a
variety of accessories:
A mouse simplifies operation of the instrument using the controls and dialogs of
the Graphical User Interface (GUI).
A keyboard simplifies the entry of data.
A printer generates hard copies of the screen contents.
In addition the analyzer provides an interface for network integration:
A LAN connection can be established in order to access the hard disk or control
the analyzer from an external PC.
1.6.1 Connecting a Mouse
A USB mouse can be connected to one of the Universal Serial Bus connectors on the
front panel.
The mouse is detected automatically when it is connected. It is safe to connect or
disconnect the mouse during the measurement.
TIP
Mouse configuration
Use the Start – Control Panel – Mouse menu of Windows XP to configure the mouse
properties. To access Windows XP, you need an external keyboard; see Accessing
Window XP's Start Menu.
Operating the analyzer does not require a mouse. You can access all essential
functions using the keys on the front panel.
1.6.2 Connecting a Keyboard
A keyboard can be connected to one of the Universal Serial Bus connectors on the
front panel.
The keyboard is detected automatically when it is connected. The default input
language is English – US. It is safe to connect or disconnect the external keyboard
during the measurement.
Quick Start Guide 1303.6538.62-01
30
®
R&S ZVL
Preparing for Use
Connecting External Accessories
TIP
Keyboard configuration
Use the Start – Control Panel – Keyboard or Regional and Language Options menu of
Windows XP to configure the keyboard properties. To access Windows XP, you need
an external keyboard; see Accessing Window XP's Start Menu.
Operating the analyzer does not require a keyboard. You can access all essential
functions using the keys on the front panel. In combination with a mouse, the front
panel keys provide access to all instrument functions.
1.6.3 Connecting a Printer
A printer can be connected to one of the Universal Serial Bus connectors on the front
panel.
It is safe to connect or disconnect the printer during the measurement. When printing a
copy (PRINT), the analyzer checks whether a printer is connected and turned on and
whether the appropriate printer driver is installed. If required, printer driver installation
is initiated using Windows XP's Add Printer Wizard. The wizard is self-explanatory. A
printer driver needs to be installed only once, even though the printer may be
temporarily removed from the analyzer.
Printer driver installation
A great variety of printer drivers is available on the analyzer. To obtain the complete
list, access Windows XP (press the Windows key) and open the Add Printer Wizard in
the Start – Control Panel – Printer and Faxes menu.
You can load updated and improved driver versions or new drivers from an installation
disk, USB memory stick or another external storage medium. Alternatively, if the
analyzer is integrated in a network, you can install driver data stored in a network
directory. In either case, use the Add Printer Wizard to complete the installation.
TIP
Printer configuration
Use the Page Setup dialog or the Start – Control Panel – Printers and Faxes menu of
Windows XP to configure the printer properties. To access Windows XP, you need an
external keyboard; see Accessing Window XP's Start Menu.
Quick Start Guide 1303.6538.62-01
31
®
R&S ZVL
Preparing for Use
Connecting External Accessories
1.6.4 Connecting a LAN Cable
A LAN cable can be connected to the LAN connector on the rear panel of the analyzer.
To establish a LAN connection proceed as follows:
1. Refer to section Assigning an IP Address and learn how to avoid connection errors.
2. Connect an appropriate LAN cable to the LAN port. Use a commercial RJ-45 cable
to establish a non-dedicated network connection, or a cross-over RJ-45 cable to
establish a dedicated connection between the analyzer and a single PC.
Dedicated vs. non-dedicated network connections
There are two methods to establish a LAN connection of the analyzer:
A non-dedicated network (Ethernet) connection from the analyzer to an existing
network made with an ordinary RJ-45 network cable. The analyzer is assigned
an IP address and can coexist with a computer and with other hosts on the
same network.
A dedicated network connection between the analyzer and a single computer
made with a cross-over RJ-45 network cable. The computer must be equipped
with a network adapter and is directly connected to the analyzer. The use of
hubs, switches, or gateways is not needed, however, data transfer is still made
using the TCP/IP protocol.
The IP address information is displayed in the Info – Setup Info dialog.
Quick Start Guide 1303.6538.62-01
32
®
R&S ZVL
Preparing for Use
Remote Control in a LAN
1.7 Remote Control in a LAN
A LAN connection is used to integrate the analyzer into a home/company network. This
offers several applications:
Transfer data between a controller and the analyzer, e.g. in order run a remote
control program.
Control the measurement from a remote computer using the Remote Desktop
application.
Use external network devices (e.g. printers).
ATTENTION
Virus protection
An efficient virus protection is a prerequisite for secure operation in the network.
Never connect your analyzer to an unprotected network because this may cause
damage to the instrument software.
To establish the connection proceed as follows:
1. Access Windows XP using an external keyboard; see Accessing Window XP's
Start Menu.
2. Open Windows XP's control panel.
3. Select System and open the Remote tab in the System Properties dialog. Enable
Allow users to connect remotely to this computer.
4. Assign an IP address to the analyzer following the directions below and connect
the analyzer to the network as described in Connecting a LAN Cable.
5. Create a Remote Desktop Connection using the analyzer's IP address.
NOTE
Password protection
The analyzer uses a user name and password as credentials for remote access. In
the factory configuration, instrument is preset for both the user name and the
password. To protect the analyzer from unauthorized access, it is recommended to
change the factory setting.
1.7.1 Assigning an IP Address
Depending on the network capacities, the TCP/IP address information for the analyzer
can be obtained in different ways.
If the network supports dynamic TCP/IP configuration using the Dynamic Host
Configuration Protocol (DHCP), all address information can be assigned
automatically.
If the network does not support DHCP, or if the analyzer is set to use alternate
TCP/IP configuration, the addresses must be set manually.
Quick Start Guide 1303.6538.62-01
33
®
R&S ZVL
Preparing for Use
Remote Control in a LAN
By default, the analyzer is configured to use dynamic TCP/IP configuration and obtain
all address information automatically. This means that it is safe to establish a physical
connection to the LAN without any previous analyzer configuration.
ATTENTION
Address selection
If your network does not support DHCP, or if you choose to disable dynamic TCP/IP
configuration, you must assign valid address information before connecting the
analyzer to the LAN. Contact your network administrator to obtain a valid IP address,
because connection errors can affect the entire network.
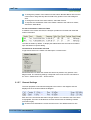
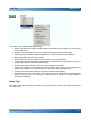
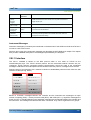
Manual TCP/IP configuration
To disable dynamic TCP/IP configuration and enter the TCP/IP address information
manually proceed as follows:
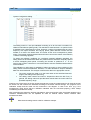
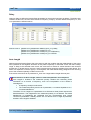
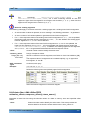
1. Obtain the IP address and subnet mask for the analyzer and the IP address for the
local default gateway from your network administrator. If needed, also obtain the
name of your DNS domain and the IP addresses of the DNS and WINS servers on
your network.
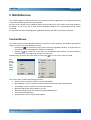
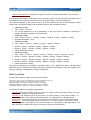
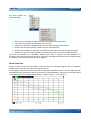
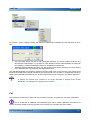
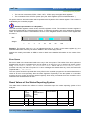
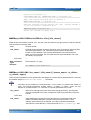
2. Press the SETUP front panel key to the left of the analyzer's display.
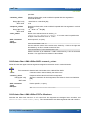
3. In the softkey menu opened, press General Setup – Network Address– DHCP: Off.
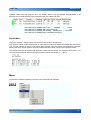
4. Enter your IP-Address and Subnet Mask.
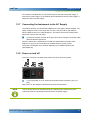
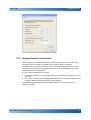
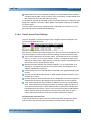
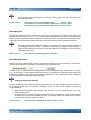
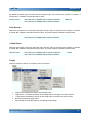
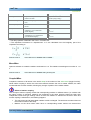
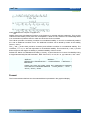
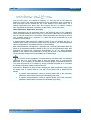
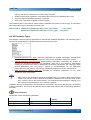
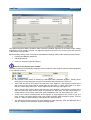
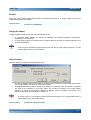
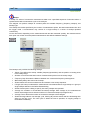
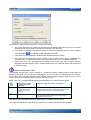
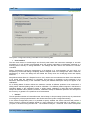
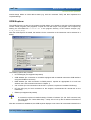
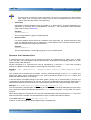
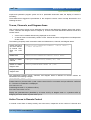
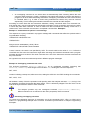
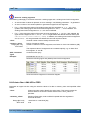
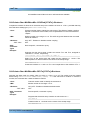
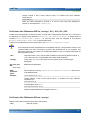
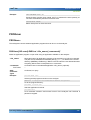
To enter additional IP address information, you have to access the operating system of
the R&S ZVL.
6. Access Windows XP using an external keyboard; see Accessing Window XP's Start Menu.
7. Open the Control Panel – Network Connections – Local Area Connection Status – Local Area
Connection Properties – Internet Protocol (TCP/IP) Properties dialog and enter the complete address
information, e.g.:
Quick Start Guide 1303.6538.62-01
34
®
R&S ZVL
Preparing for Use
Remote Control in a LAN
For more information refer to the Windows XP Help.
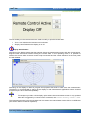
1.7.2 Remote Desktop Connection
Remote Desktop is a Windows application which can be used to access and control
the analyzer from a remote computer through a LAN connection. While the
measurement is running, the analyzer screen contents are displayed on the remote
computer, and Remote Desktop provides access to all of the applications, files, and
network resources of the analyzer.
To set up a Remote Desktop connection
1. Connect the analyzer to a LAN and determine its IP address; see Remote Control
in a LAN.
2. Set up your remote computer (integrated in the LAN) to use Remote Desktop and
create the Remote Desktop connection to the analyzer.
For detailed information about Remote Desktop and the connection refer to the
Windows XP Help.
Quick Start Guide 1303.6538.62-01
35
®
R&S ZVL
Preparing for Use
Windows XP
1.8 Windows XP
The analyzer is equipped with a Windows XP operating system which has been
configured according to the instrument's features and needs. Changes in the system
configuration can be necessary in order to
Establish a LAN connection
Customize the properties of the external accessories connected to the analyzer
Call up additional software tools
ATTENTION
Operating system settings
The operating system is adapted to the network analyzer. To avoid impairment of
instrument functions, only change the settings described in this manual. Existing
software must be modified only with update software released by Rohde & Schwarz.
Likewise, only programs authorized by Rohde & Schwarz for use on the instrument
must be executed.
The Start menu of the operating system is accessed as described below. All necessary
settings can be accessed from the Start menu, in particular from the Control Panel.
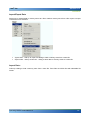
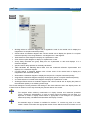
1.8.1 Accessing Windows XP's Start Menu
The Windows XP Start menu provides access to the Windows XP functionality and
installed programs. From the start menu, you can navigate to the submenus by using
the mouse or the cursor keys of the keyboard.
The following operations require an external keyboard.
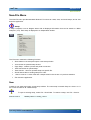
To open the Windows XP Start menu,
On your keyboard, press the Windows key or the CTRL+ESC key combination.
To return to the measurement screen use one of the following methods:
Press the ALT+TAB key combination to switch to the analyzer application.
In the Windows task bar (opened via ALT + Tab), click the "R&S Analyzer
Interface" icon.
Quick Start Guide 1303.6538.62-01
36
®
R&S ZVL
Preparing for Use
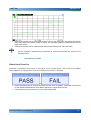
Firmware Update
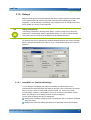
1.9 Firmware Update
Upgrade versions of the analyzer firmware are supplied as setup files (*msi). To
perform a firmware update, you can either use the softkeys associated with the SETUP
front panel key or the Instrument_Update_Tool. The latter procedure is recommended
if installation via SETUP is not practicable.
NOTE
Setup files
To prepare the installation , copy the setup file to any storage medium accessible from
the analyzer. This may be the internal hard disk, an external storage medium (USB
memory stick, CD-ROM with external drive) or a network connection (LAN, GPIB bus).
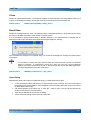
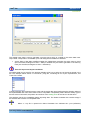
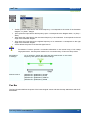
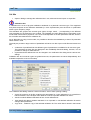
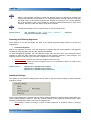
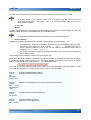
To install new fimware using the SETUP menu,
1. Press SETUP > More > Firmware Update and open the Firmware Update dialog
box.
2. Enter the update path of your firmware, depending on the installation medium that
you use. You can also Browse… the update path in the dialog.
3. Click Execute to start the installation.
The installation program will guide you through the installation. If installation fails, use
the Instrument_Update_Tool as described below.
Setup files can be stored and installed again. The default drive name of the USB
interfaces is C:. External storage devices are automatically mapped to the next free
drive, i.e. D:, E: etc.
Remote control: SYST:FIRM:UPD 'D:\FW_UPDATE'
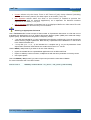
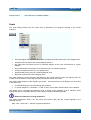
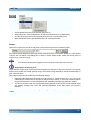
To install new fimware using the update tool,
1. Close all applications.
2. Access Window XP’s startup menu as described in section Accessing Windows
XP's Start Menu on p. 36.
3. Select Programs > Accessories > Instrument_Update_Tool.
4. In the dialog box opened, select the ZVL.package file and click Open.
5. In the Install Manager dialog box opened, click Install.
Quick Start Guide 1303.6538.62-01
37
®
R&S ZVL
Getting Started
Reflection Measurements
2
Getting Started................................................................................... 40
2.1
Reflection Measurements ..........................................................................................40
2.1.1
Instrument Setup for Reflection Measurements ...........................................................40
2.1.2
Parameter and Sweep Range Selection ......................................................................41
2.1.3
Instrument Calibration...................................................................................................42
2.1.4
Evaluation of Data ........................................................................................................44
2.1.5
Saving and Printing Data ..............................................................................................45
2.2
Basic Tasks .................................................................................................................47
2.2.1
Control via Front Panel Keys ........................................................................................47
2.2.2
Data Entry .....................................................................................................................49
2.2.3
Scaling Diagrams..........................................................................................................51
Quick Start Guide 1303.6538.62-01
39
®
R&S ZVL
Getting Started
Reflection Measurements
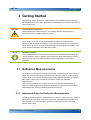
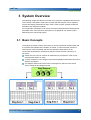
2 Getting Started
The following chapter presents a sample session with a R&S ZVL network analyzer
and explains how to solve basic tasks that you will frequently encounter when working
with the instrument.
CAUTION
General safety instructions
Before starting any measurement on your network analyzer, please note the
instructions given in Chapter Preparing for Use.
In the System Overview you will find detailed information on customizing the
instrument and the display according to your personal preferences. For a systematic
explanation of all menus, functions and parameters and background information refer
to the reference chapters in the online help system.
NOTE
Windows operation
In the following we assume that you are familiar with standard Windows dialogs and
mouse operation. Refer to sections Using Front Panel Keys and Data Entry to learn
how to access instrument functions and control dialogs without a mouse and
keyboard.
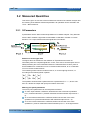
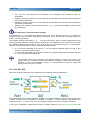
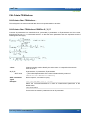
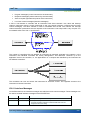
2.1 Reflection Measurements
In a reflection measurement, the analyzer transmits a stimulus signal to the input port
of the device under test (DUT) and measures the reflected wave. A number of trace
formats allow you to express and display the results. depending on what you want to
learn from the data. Only one analyzer test port is required for reflection
measurements.
In the following example, the analyzer is set up for a reflection measurement, a
frequency sweep range and measurement parameter is selected, the instrument is
calibrated and the result is evaluated using various formats.
2.1.1 Instrument Setup for Reflection Measurements
In order to prepare a reflection measurement, you have to connect your DUT (which is
assumed to have a male N 50 Ω connector) to one of the (equivalent) analyzer test
ports. Besides, it is recommended to preset the instrument in order to set it to a
definite, known state.
Quick Start Guide 1303.6538.62-01
40
®
R&S ZVL
Getting Started
Reflection Measurements
1. Proceed as described in section Starting the
Analyzer and Shutting Down in Chapter 1 to
switch on the instrument and start the NWA
application.
2. Connect the input port of your DUT to test port
1 of the network analyzer.
3. Press the PRESET key in the upper left corner
of the front panel to perform a factory preset of
the analyzer.
The analyzer is now set to its default state. The default
measured quantity is the transmission S-parameter
S21. This quantity is zero in the current test setup, so
the trace shows the noise level.
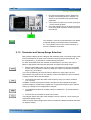
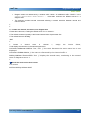
2.1.2 Parameter and Sweep Range Selection
After preset the display shows a diagram with a dB Mag scale. The sweep range (scale
of the horizontal axis) is equal to the maximum frequency range of the analyzer, and
the S-parameter S12 is selected as a measurement parameter.
To obtain information about the reflection characteristics of your DUT you have to
select an appropriate measurement parameter and specify the sweep range.
1. Press the CENTER function key to the right of the display to open the associated
numeric entry bar (Center Frequency). Enter the center of your desired frequency
range in (e.g. 5.25 GHz).
If you use the data keys at the front panel for data entry, simply type 5.25 and
terminate the entry with the G/n key. Refer to section Data Entry to learn more about
entering numeric values and characters.
2. Press SPAN and enter the width of the frequency range you want to measure
(e.g. 0.5 GHz).
In addition to the linear frequency sweep considered in this example the analyzer
provides frequency sweeps with a logarithmic or segmented frequency axis. Refer to
Setting up a Sweep for more application examples.
3. Press MEAS and select the forward reflection coefficient S11 as a measurement
parameter.
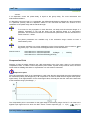
4. Press SCALE and activate the Autoscale function.
The analyzer adjusts the scale of the diagram to fit in the entire S11 trace, leaving an
appropriate display margin.
Refer to section Scaling Diagrams to learn more about the different methods and tools
for diagram scaling.
Quick Start Guide 1303.6538.62-01
41
®
R&S ZVL
Getting Started
Reflection Measurements
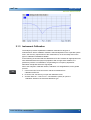
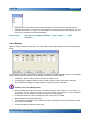
2.1.3 Instrument Calibration
The analyzer provides sophisticated calibration methods for all types of
measurements. Which calibration method is selected depends on the expected system
errors, the accuracy requirements of the measurement, on the test setup and on the
types of calibration standards available.
In the following we assume that the calibration kit ZV-Z21 contains an appropriate male
short standard with known physical properties. With a single short standard, it is
possible to perform a normalization, compensating for a frequency-dependent
attenuation and phase shift in the signal path.
Due to the analyzer's calibration wizard, calibration is a straightforward, menu-guided
process.
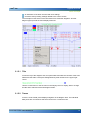
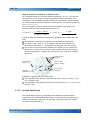
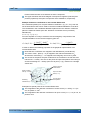
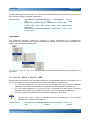
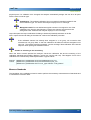
1. Unscrew the DUT and connect the male short standard from
calibration kit ZV-Z21.
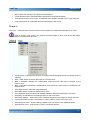
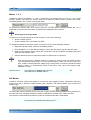
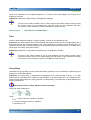
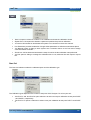
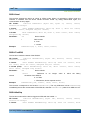
2. Press the CAL function key to open the calibration menu.
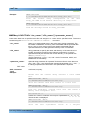
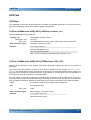
3. Activate Start Cal – One Port P1 – Normalization (Short) to open the
calibration wizard for the selected calibration type.
Quick Start Guide 1303.6538.62-01
42
®
R&S ZVL
Getting Started
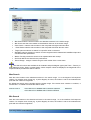
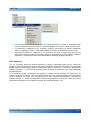
Reflection Measurements
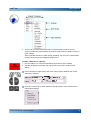
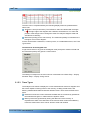
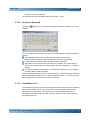
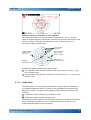
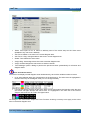
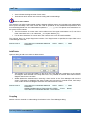
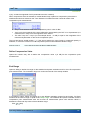
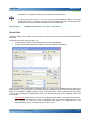
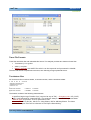
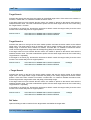
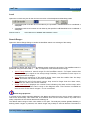
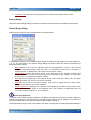
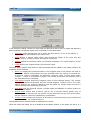
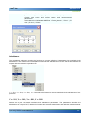
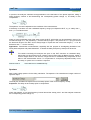
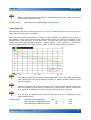
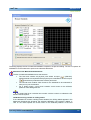
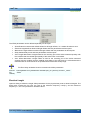
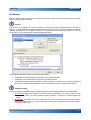
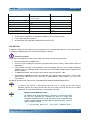
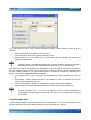
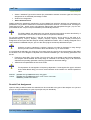
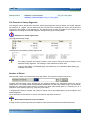
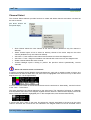
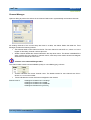
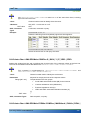
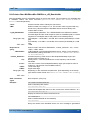
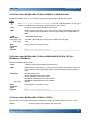
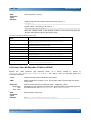
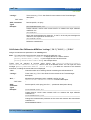
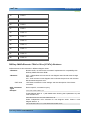
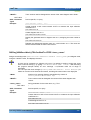
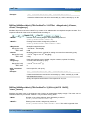
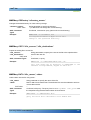
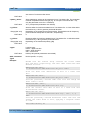
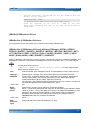
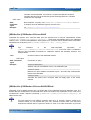
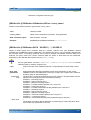
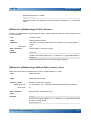
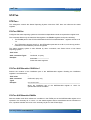
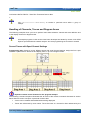
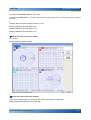
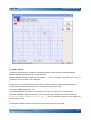
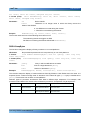
4. In the first dialog of the wizard, select the calibration kit (here: ZV-Z21) and the
test port connector (here: N 50 Ω (f), corresponding to a male calibration
standard), and click Next.
If you have not yet imported the exact cal kit data of your calibration kit, you can use
the typical data as shown above. Typical data provide an approximate description of
a calibration kit mode. To import the actual (accurate) data of your kit, press Import
Kit... and select the appropriate cal kit file.
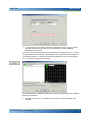
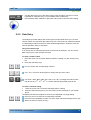
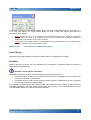
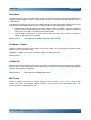
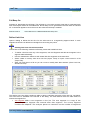
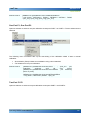
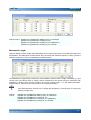
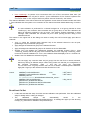
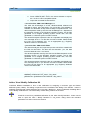
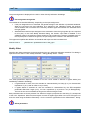
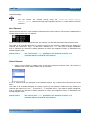
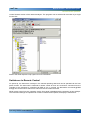
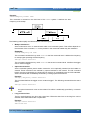
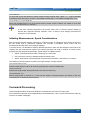
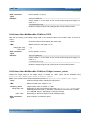
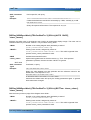
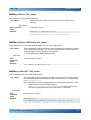
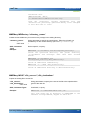
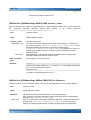
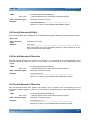
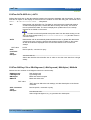
The next dialog of the calibration wizard shows that only a single calibration standard
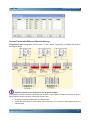
needs to be measured.
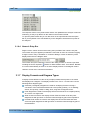
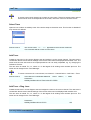
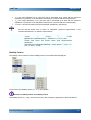
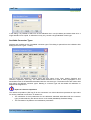
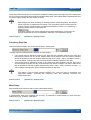
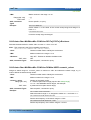
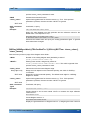
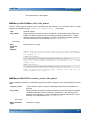
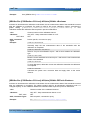
5. Click the box Short (m)... to initiate the measurement of the connected short
standard.
Quick Start Guide 1303.6538.62-01
43
®
R&S ZVL
Getting Started
Reflection Measurements
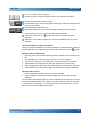
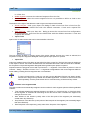
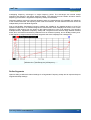
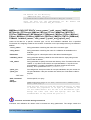
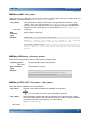
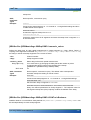
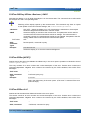
The analyzer performs a calibration sweep and displays a message box with a
progress bar. After completing the sweep the analyzer generates a short sound and a
green checkmark appears in the checkbox.
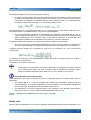
6. Click Apply to close the wizard, calculate and store the system error correction
data and apply them to the current measurement.
7. Remove the short standard and connect the DUT again.
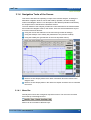
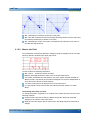
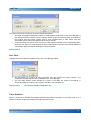
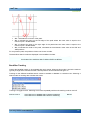
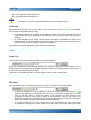
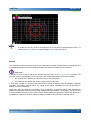
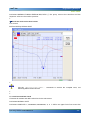
2.1.4 Evaluation of Data
The analyzer provides various tools to optimize the display and analyze the
measurement data. For instance, you can use markers determine the maximum of the
reflection coefficient, and change the display format to obtain information about the
phase shift of the reflected wave and the impedance of your DUT.
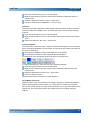
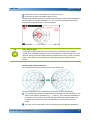
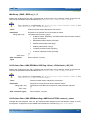
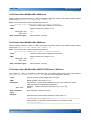
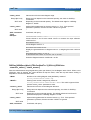
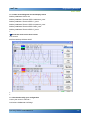
1. Press the MKR function key. This places Marker 1 to its default position (center of
the sweep range).
A marker symbol (triangle) appears on the trace. The stimulus value (frequency) and
response value (magnitude of the reflection coefficient converted to a dB value) at
the marker position is displayed in the marker info field in the upper right corner of
the diagram.
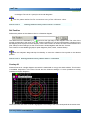
2. Press the MKR --> function key, open the Marker Search submenu and activate
Min Search.
The marker jumps to the absolute minimum of the curve in the entire sweep range.
The marker info field shows the coordinates of the new marker position.
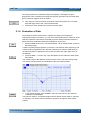
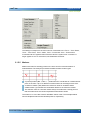
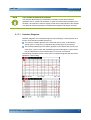
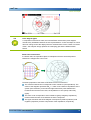
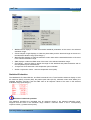
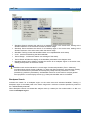
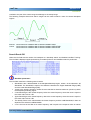
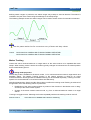
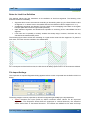
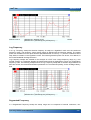
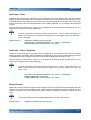
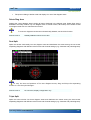
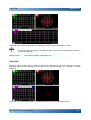
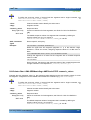
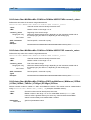
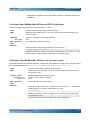
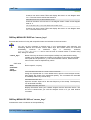
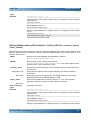
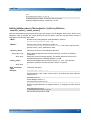
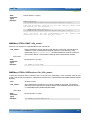
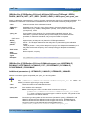
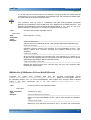
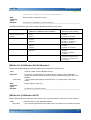
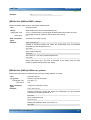
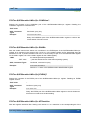
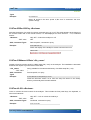
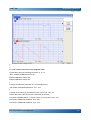
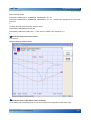
3. In the TRACE keypad, press FORMAT and select the Phase of the reflection
coefficient to be displayed.
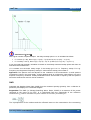
The phase is shown in a Cartesian diagram with a default vertical scale of –225 deg
to +225 deg. The marker info field shows the frequency and phase at the marker
position.
Quick Start Guide 1303.6538.62-01
44
®
R&S ZVL
Getting Started
Reflection Measurements
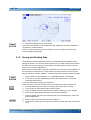
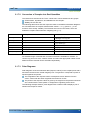
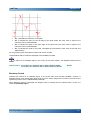
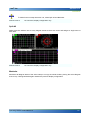
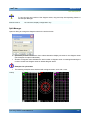
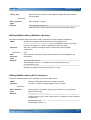
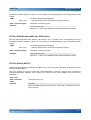
4. Still in the FORMAT menu, select Smith.
The Smith chart shows lines of constant real and imaginary part of the impedance in
the reflection coefficient plane.
Refer to section Display Formats and Diagram Types in Chapter 3 to learn more
about the diagram properties.
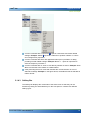
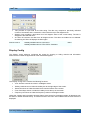
2.1.5 Saving and Printing Data
The analyzer provides standard functions for saving measurement settings and for
printing the results. You can use these functions as if you were working on a standard
PC. Moreover you can export your trace data to an ASCII file and reuse it in a later
session or in an external application.
Data transfer is made easier if external accessories are connected to the analyzer or if
the instrument is integrated into a LAN. Refer to sections External Accessories and
Remote Control in a LAN in Chapter 1 to obtain information about the necessary steps.
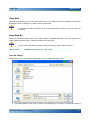
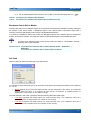
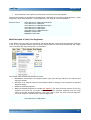
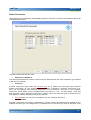
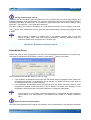
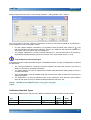
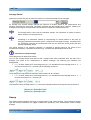
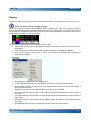
1. Press TRACE and activate More 1/3 – Import/Export Data – Export Data.
2. In the Export Complex Data dialog opened, select a file location, format and
name and activate Save.
The active trace data is written to an ASCII file.
Refer to section Trace File Formats to learn more about trace files and their use.
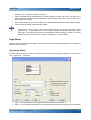
3. Press the PRINT key to the left of the display; then press Device Setup.
4. In the Hardcopy Setup dialog opened, select Printer.
5. Close the dialog and press Print Screen to create a hardcopy of your diagram.
6. Press Device Setup again and select a file format or Clipboard.
7. Close the dialog and press Print Screen again to copy the diagram to a file or an
external application.
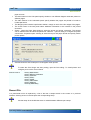
8. Open the Nwa-File menu and select Save NWA As...
9. In the Save As dialog opened, select a file location, format and name and activate
Save.
Quick Start Guide 1303.6538.62-01
45
®
R&S ZVL
Getting Started
Reflection Measurements
The active setup is stored to a file and can be reused in a later session.
Proceed as described in section Starting the Analyzer, Shutdown to shut down your
analyzer.
Quick Start Guide 1303.6538.62-01
46
®
R&S ZVL
Getting Started
Basic Tasks
2.2 Basic Tasks
The following sections describe how to solve basic tasks that you will frequently
encounter when working with the instrument. In particular you can learn how to access
instrument functions and control dialogs without a mouse and keyboard.
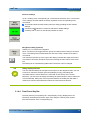
2.2.1 Control via Front Panel Keys
Although a mouse and external keyboard simplify the operation of the instrument, you
can access all essential functions using the keys on the front panel. The following
examples are intended to make you familiar with front panel key operation.
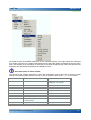
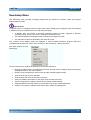
To Access a Particular Menu Command ...
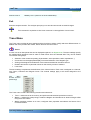
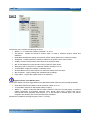
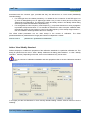
1. Press the MENU key to the left of the display to access the menu bar and open
the Nwa-File menu.
2. Use the keys in the NAVIGATION keypad or the rotary knob to navigate between
and within the menus.
Use the Cursor Left and Cursor Right keys to change between the different menus
in the menu bar. When the first option in a pull-down menu is a submenu, the
submenu will be opened first before proceeding to the next option in the menu bar.
Use the Cursor Up and Cursor Down keys to scroll up and down in a menu.
ENTER, the Cursor Right key or the rotary knob (if pressed) expand a submenu,
open a dialog or initiate an action, depending on the selected command type.
ESC CANCEL or the Cursor Left key compress the current submenu and move the
cursor one menu level up or close the active dialog, depending on the selected
softkey type.
Quick Start Guide 1303.6538.62-01
47
®
R&S ZVL
Getting Started
Basic Tasks
3. As soon as you reach the desired menu command (which must not be one
opening a submenu) press ENTER or press the rotary knob to initiate an action or
open a dialog.
After command execution or after closing the dialog, the menu bar is deactivated
and the cursor returns to the diagram/softkey area.
To Make a Selection in a Dialog...
1. Press a softkey or a menu item followed by three dots to open a dialog.
2. Use the navigation keys and/or the rotary knob to access the controls in the
dialog.
Press Left Field or Right Field or the cursor keys to switch between the control
elements in a dialog.
Press the cursor keys to switch between several entries in a list of alternative or
independent settings.
Quick Start Guide 1303.6538.62-01
48
®
R&S ZVL
Getting Started
Basic Tasks
3. Use the data entry keys or the rotary knob to enter numbers. Use the on-screen
keyboard for character entry. For more details refer to Data Entry.
4. Press ENTER, ESC CANCEL or press the rotary knob to close the active dialog.
2.2.2 Data Entry
The analyzer provides dialogs with various types of input fields where you can enter
numeric values and character data. Data entry with a mouse and an external keyboard
is a standard procedure known from other Windows applications. However, there are
various alternative ways to enter data.
Using Front Panel Keys
If no mouse and no external keyboard is connected to the analyzer, you can use the
data entry keys to enter numbers and units.
To enter a numeric value
1. Place the cursor into a numeric data input field in a dialog or in the numeric entry
bar.
2. Press the data entry keys.
Use 0 to 9 enter the corresponding numbers.
...
Use . and - to enter a decimal point or change the sign of the value.
...
Use GHz / -dBm, MHz / dBm, kHz / dB, or Hz / dB.. to multiply the entered value
(-)9
(-)6
(-)3
with factors of 10 , 10 , 10 or 1 and/or add the appropriate physical unit.
To enter a character string
1. Place the cursor into a character data input field in a dialog.
...
2. Press the data entry keys as if you were writing a short message on your mobile
phone.
The different characters assigned to each key are displayed in a popup dialog.
Press 0 to 9 once to enter the corresponding numbers.
Press the keys repeatedly to select one of the other characters assigned to the key.
Wait 2 seconds to confirm an entry.
Quick Start Guide 1303.6538.62-01
49
®
R&S ZVL
Getting Started
Basic Tasks
Use . or – to enter a dot or a hyphen.
Use the sign key to change from upper case to lower case and vice versa.
Use the checkmark key to enter a space.
Use the BACK key to correct wrong entries, deleting the character to the left of the
current cursor position.
Press ENTER to complete an entry.
Press ESC CANCEL to close the popup dialog, discarding the entries made.
3. To enter letters you can also use one of the following methods:
If the active input field has a
symbol, then use the analyzer's on-screen
keyboard.
Otherwise, use an external keyboard or a mouse and Windows XP's on-screen
keyboard.
Using the Analyzer's On-Screen Keyboard
The on-screen keyboard allows you to enter characters, in particular letters, without an
symbol.
external keyboard. It is available for all character input fields which have a
Operation with front panel keys
1. Place the cursor into a character data input field in a dialog or in the numeric entry
bar.
2. Press ENTER or the Checkmark key to open the on-screen keyboard.
3. Use the cursor keys or turn the rotary knob to move the cursor to a character.
4. Press ENTER or the rotary knob to select the character for the input string.
5. After completing the input string use the Right Field key to move to the OK button.
6. Press ENTER or the rotary knob to apply your selection and close the keyboard.
Operation with a mouse
1. Click the keyboard symbol to open the on-screen keyboard.
2. Click a sequence of characters and OK to apply your selection and close the
keyboard.
You can also access Windows XP's on-screen keyboard from the start menu. Connect
an external keyboard, press CTRL + ESC to open the start menu, and click Programs
– Accessories – Accessibility – On-Screen Keyboard. From the start menu, you can
also access other useful software accessories.
Quick Start Guide 1303.6538.62-01
50
®
R&S ZVL
Getting Started
Basic Tasks
2.2.3 Scaling Diagrams
The analyzer provides several alternative tools for setting the sweep range and
customizing the diagrams. Pick the method that is most convenient for you.
Setting the Sweep Range
The sweep range for all channels is displayed in the channel list across the bottom of
the diagram area:
To change the sweep range, use one of the following methods:
Press the CENTER or SPAN function keys on the front panel.
Right-click the start or stop value in the channel list and select Start, Stop, Center,
Span from the context menu.
Select Start, Stop, Center, Span from the Channel – Center or Channel– Span
menus.
Use the marker functions (MARKER ––> function key).
Reference Value and Position
The analyzer provides three parameters for changing the scale of the vertical
(response) axis:
Changing the Ref Value or Ref Position shifts the trace in vertical direction and
adjusts the labels of the vertical axis. Ref Value also works for radial diagrams.
Changing the Scale/Div modifies the value of the vertical or radial diagram
divisions and thus the entire range of response values displayed.
The Scale/Div and the Ref Value is indicated in the scale section of the trace list.
To change one of the parameters use one of the following methods:
Quick Start Guide 1303.6538.62-01
51
®
R&S ZVL
Getting Started
Basic Tasks
Press the SCALE function key on the front panel.
Right-click the scale section in the trace list and select the parameters from the
context menu.
Select the parameters from the Trace – Scale menu.
Use the marker functions (MARKER ––> function key).
Autoscale
The Autoscale function adjusts the scale divisions and the reference value so that the
entire trace fits into the diagram area. To access Autoscale, use one of the following
methods:
Press the SCALE function key on the front panel.
Right-click the scale section in the trace list and select Autoscale from the context
menu.
Select Autoscale from the Trace – Scale menu.
Circular Diagrams
The radial scale of a circular (Polar, Smith or Inverted Smith) diagram can be changed
with a single linear parameter, the Ref Value. The reference value defines the radius of
the outer circumference.
Increasing the Reference Value scales down the polar diagram.
Decreasing the Reference Value magnifies the polar diagram.
The Reference Value is indicated in the scale section of the trace list.
To change the Reference Value use one of the following methods:
Press the SCALE function key on the front panel.
Right-click the scale section in the trace list and select the parameter from the
context menu.
Select the parameter from the Trace – Scale menu.
Use the marker functions.
The Autoscale function also works for polar diagrams.
Using Marker Functions
Marker functions are a convenient tool for scaling (in particular: magnifying) diagrams
without entering explicit numeric values. You simply place a marker to a trace point
and use the marker values to change the sweep range or move the trace relative to the
vertical axis. A mouse makes it easier to activate (click) or move (drag and drop)
markers.
Quick Start Guide 1303.6538.62-01
52
®
R&S ZVL
Getting Started
Basic Tasks
To set the sweep range use one of the following methods:
Define Start and Stop values
1. Create two normal markers, e.g. the markers Mkr 1 and Mkr 2, and place them to
the desired start and stop values of the sweep range.
2. Activate Mkr 1 and click Trace – Marker --> – Start = Marker.
3. Activate Mkr 2 and click Trace – Marker --> – Stop = Marker.
Use a definite Span
1.
Create a marker and set it to delta mode.
2. The analyzer automatically creates a reference marker in addition to the delta
marker.
3. Place the reference marker to the desired start value of the sweep range.
4. Set the value of the delta marker equal to the desired (positive or negative) span.
5. Activate the delta marker and click Trace – Marker --> – Span = Marker.
To move the trace relative to the vertical axis proceed as follows:
1. Create a normal marker, e.g. the marker Mkr 1, and place it to a particular trace
point. E.g. you can use the marker Search functions to locate a maximum or
minimum on the trace.
2. Click Trace – Marker --> – Max = Marker to move the trace towards the upper
diagram edge, leaving the values of the vertical divisions (Scale Div.) and the
overall vertical scale unchanged. Analogously, click Min = Marker to move the
trace towards the lower diagram edge, or click Ref Value = Marker to move the
trace towards the Reference Value.
Enlarging the Diagram Area
The analyzer provides different tools for customizing the contents and size of the
diagram areas:
Maximize allows you to enlarge the active diagram area to occupy the whole
window. A double-click on any point in the diagram area is equivalent to the
Maximize function.
The Title, the Softkey Labels, the Status Bar and the Front Panel Keys are optional
Quick Start Guide 1303.6538.62-01
53
®
R&S ZVL
Getting Started
Basic Tasks
display elements which you can hide in order to gain space for the diagram.
Use the context menu of the diagram area or the Nwa-Setup – Display menu to
access the scaling functions above.
Quick Start Guide 1303.6538.62-01
54
®
R&S ZVL
System Overview
Basic Concepts
3
System Overview ............................................................................... 57
3.1
Basic Concepts ...........................................................................................................57
3.1.1
Global Resources .........................................................................................................58
3.1.1.1
Setups...........................................................................................................................58
3.1.2
Traces, Channels, and Diagram Areas ........................................................................58
3.1.2.1
Trace Settings...............................................................................................................59
3.1.2.2
Channel Settings ..........................................................................................................60
3.1.3
Data Flow......................................................................................................................60
3.1.4
Navigation Tools of the Screen.....................................................................................62
3.1.4.1
Menu Bar ......................................................................................................................62
3.1.4.2
Menu Structure .............................................................................................................63
3.1.4.3
Softkey Bar ...................................................................................................................64
3.1.4.4
Front Panel Key Bar .....................................................................................................65
3.1.4.5
Status Bar .....................................................................................................................66
3.1.5
Display Elements in the Diagram Area.........................................................................66
3.1.5.1
Title ...............................................................................................................................67
3.1.5.2
Traces ...........................................................................................................................67
3.1.5.3
Trace Types ..................................................................................................................68
3.1.5.4
Trace List and Trace Settings.......................................................................................69
3.1.5.5
Markers .........................................................................................................................70
3.1.5.6
Marker Info Field ...........................................................................................................71
3.1.5.7
Channel Settings ..........................................................................................................72
3.1.5.8
Context Menus..............................................................................................................73
3.1.6
Dialogs ..........................................................................................................................74
3.1.6.1
Immediate vs. Confirmed Settings................................................................................74
3.1.6.2
On-Screen Keyboard ....................................................................................................75
3.1.6.3
Paste Marker List ..........................................................................................................75
3.1.6.4
Numeric Entry Bar ........................................................................................................76
3.1.7
Display Formats and Diagram Types ...........................................................................76
3.1.7.1
Cartesian Diagrams ......................................................................................................77
Quick Start Guide 1303.6538.62-01
55
®
R&S ZVL
System Overview
Basic Concepts
3.1.7.2
Conversion of Complex into Real Quantities................................................................78
3.1.7.3
Polar Diagrams .............................................................................................................78
3.1.7.4
Smith Chart ...................................................................................................................79
3.1.7.5
Inverted Smith Chart .....................................................................................................81
3.1.7.6
Measured Quantities and Display Formats ..................................................................84
3.2
Measured Quantities ..................................................................................................85
3.2.1
S-Parameters................................................................................................................85
3.2.2
Impedance Parameters ................................................................................................86
3.2.2.1
Converted Impedances.................................................................................................86
3.2.3
Admittance Parameters ................................................................................................87
3.2.3.1
Converted Admittances ................................................................................................87
3.3
Calibration Overview ..................................................................................................89
3.3.1
Calibration Standards and Calibration Kits...................................................................90
3.3.1.1
Calibration Types ..........................................................................................................90
Quick Start Guide 1303.6538.62-01
56
®
R&S ZVL
System Overview
Basic Concepts
3 System Overview
The following chapter provides an overview of the analyzer's capabilities and their use.
This includes a description of the basic concepts that the analyzer uses to organize,
process and display measurement data, of the screen contents, possible measured
quantities, and calibration methods.
For a systematic explanation of all menus, functions and parameters and background
information refer to the reference description on the graphical user interface (GUI
Reference)in the online help system.
3.1 Basic Concepts
The analyzer provides a variety of functions to perform a particular measurement and
to customize and optimize the evaluation of results. To ensure that the instrument
resources are easily accessible and that user-defined configurations can be
conveniently implemented, stored and reused the instrument uses a hierarchy of
structures:
Global resources can be used for all measurements, irrespective of the current
measurement session or setup.
A setup comprises a set of diagram areas with all displayed information that can be
stored to a setup file.
The diagram areas show traces which are assigned to channels. See section
Traces, Channels and Diagram Areas.
Quick Start Guide 1303.6538.62-01
57
®
R&S ZVL
System Overview
Basic Concepts
3.1.1 Global Resources
The analyzer provides global settings that are mostly hardware-related and can be
used for all measurements, irrespective of the current measurement session or setup.
The settings are stored in independent files and do not enter into any of the setup files.
The following settings correspond to global resources:
Calibration kits
Connector types
Cal pool data including system error correction and power correction data
Color schemes
The data related to global resources are not affected by a Preset of the analyzer.
However, it is possible to delete or reset global resource data using the Resets tab in
the System Config dialog.
3.1.1.1 Setups
A setup comprises a set of diagram areas with all displayed information that can be
stored to a NWA setup file (*.nwa) and reused. Each setup is displayed in an
independent window. The setup file contains the following information:
General settings related to the setup
The trace settings for all traces in the diagram areas
The channel settings for all channels associated to the traces
The display settings for each diagram area
The Nwa-File menu is used to organize setups.
TIP
Demo setups
In the System – External Tools submenu, you can find demo setups *.vbs for various
measurement scenarios. You can modify the demo setups and store them to a *.nwa
file for later use. Moreover the Measurement Wizard provides predefined, optimized
setup s for many measurements.
3.1.2 Traces, Channels, and Diagram Areas
The analyzer arranges, displays or stores the measured data in traces which are
assigned to channels and displayed in diagram areas. To understand the menu
structure of the instrument and quickly find the appropriate settings, it is important to
understand the exact meaning of the three terms.
A trace is a set of data points that can be displayed together in a diagram area.
The trace settings specify the mathematical operations used in order to obtain
traces from the measured or stored data and to display them.
A channel contains hardware-related settings to specify how the network analyzer
Quick Start Guide 1303.6538.62-01
58
®
R&S ZVL
System Overview
Basic Concepts
collects data.
A diagram area is a rectangular portion of the screen used to display traces.
Diagram areas belonging to the same setup are arranged in a common window.
The settings for diagram areas are described in section Display Elements in this
chapter.
A diagram area can contain a practically unlimited number of traces, assigned to
different channels. Diagram areas and channels are completely independent from each
other.
3.1.2.1 Trace Settings
The trace settings specify the mathematical operations used in order to obtain traces
from the measured or stored data. They can be divided into several main groups:
Selection of the measured quantity (S-parameters, impedances,...)
Conversion into the appropriate display format and selection of the diagram type
Scaling of the diagram and selection of the traces associated to the same channel
Readout and search of particular values on the trace by means of markers
Limit check
The Trace menu provides all trace settings. They complement the definitions of the
Channel menu. Each trace is assigned to a channel. The channel settings apply to all
traces assigned to the channel.
Quick Start Guide 1303.6538.62-01
59
®
R&S ZVL
System Overview
Basic Concepts
TIP
Active Traces
If a trace is selected in order to apply the trace settings, it becomes the active trace. In
manual control there is always exactly one active trace, irrespective of the number of
channels and traces defined. The active channel contains the active trace. In remote
control, each channel contains an active trace; see section Active Traces in Remote
Control in the help system.
3.1.2.2 Channel Settings
A channel contains hardware-related settings to specify how the network analyzer
collects data. The channel settings can be divided into three main groups:
Control of the measurement process (Sweep)
Description of the test setup (Power of the internal source, IF filter Bandwidth and
Step Attenuators, Port Configuration)
Correction data (Calibration, Port Extensions)
The Channel menu provides all channel settings.
NOTE
Sweep initialization
After changing the channel settings or selecting another measured quantity, the
analyzer needs some time to initialize the new sweep. This preparation period
increases with the number of points and the number of partial measurements
involved. It is visualized by a Preparing Sweep symbol in the status bar:
All analyzer settings can still be changed during sweep initialization. If necessary, the
analyzer terminates the current initialization and starts a new preparation period.
During the first sweep after a change of the channel settings, an additional red
asterisk symbol appears in the status bar:
3.1.3 Data Flow
The analyzer processes the raw measurement data in a sequence of stages in order to
obtain the displayed trace. The following diagram gives an overview.
The diagram consists of an upper and a lower part, corresponding to the data
processing stages for the entire channel and for the individual traces. All stages in the
diagram are configurable.
All stages are described in detail in Chapter 4 of the help system, GUI Reference.
Quick Start Guide 1303.6538.62-01
60
®
R&S ZVL
System Overview
Basic Concepts
SYSTEM
ERROR
CORR.
3
SYSTEM
ERROR CORR. DATA
Channel data flow
(for all traces of the channel)
OFFSET
*
*
S - Parameters
COMPLEX
CONVERS.
Data Access Points:
1, 2 Import/Export Data
3 Apply cal pool data / copy to cal pool
MEM
( TRACE 1)
1
MEM
( TRACE 2)
MATH
Trace data flow
(for individual traces)
2
Quick Start Guide 1303.6538.62-01
61
®
R&S ZVL
System Overview
Basic Concepts
3.1.4 Navigation Tools of the Screen
This section describes the operating concept of the network analyzer, including the
alternative navigation tools for mouse and hardkey operation, the trace settings,
markers and diagram areas. For a description of the different quantities measured by
the analyzer refer to the Measured Quantities section.
The main window of the analyzer provides all control elements for the measurements
and contains the diagram areas for the results. There are several alternative ways to
access an instrument function:
Using the menus and submenus of the menu bar (provides all settings)
Using the softkeys of the softkey bar (alternative to the previous method)
Using the hardkey bar (preselection of the most important menus)
Refer to section Display Elements to obtain information about the results in the
diagram area.
Refer to section Display Menu in the reference chapter and learn how to customize
the screen.
3.1.4.1 Menu Bar
All analyzer functions are arranged in drop-down menus. The menu bar is located
across the top of the diagram area:
Menus can be controlled in different ways:
Quick Start Guide 1303.6538.62-01
62
®
R&S ZVL
System Overview
Basic Concepts
With a mouse, like the menus in any Windows application. A left mouse click
expands a menu or submenu. If a menu command has no submenu assigned, a
left mouse click opens a dialog or directly activates the menu command.
Using the front panel keys.
With a combination of the previous methods, using the hardkey bar (front panel key
bar, activated via Setup/Display Config./Front Panel Keys).
The active menu is the menu containing the last executed command.
When you select a command in a new menu the softkey bar is updated to reflect the
new active menu with all commands. You can continue operation using the softkeys.
Overview of menu functions
The Control
menus provide standard Windows functions to control windows.
The File menu provides standard Windows functions to create, save or recall
setups and to shut down the application.
The Trace menu provides all trace settings and the functions to create, select,
modify and store different traces. In addition the menu provides the marker, search
and limit check functions.
The Channel menu provides all channel settings and the functions to create, select,
modify and store different channels. This incudes the functions for calibration.
The Display menu provides all display settings and the functions to create, select,
modify and arrange different diagram areas.
The NWA-Setup menu provides standard Windows™ functions to arrange different
windows on the screen, display options, reverse operations, return to a defined
instrument state, and retrieve information on the instrument. Besides, it provides
configurations for the user interface and for remote control operation.
The Help menu provides assistance with the network analyzer and its operation.
3.1.4.2 Menu Structure
All menus show an analogous structure.
Quick Start Guide 1303.6538.62-01
63
®
R&S ZVL
System Overview
Basic Concepts
A menu command with a right arrow expands a submenu with further related
settings. Example: Marker expands a submenu to position markers on a trace
and configure their properties.
A menu command with three dots appended calls up an input field or a dialog
providing several related settings. Example: Marker 1... opens an input field to
enter the frequency of marker 1.
A menu command with no arrow or dots directly initiates an action. Example: Delta
Mode converts the active marker to a delta marker.
A dot preceding the menu command indicates the current selection in a list of
alternative settings. Example: In the figure above, the default format is selected as
marker format.
3.1.4.3 Softkey Bar
The softkey bar displays the commands of the active menu so that they can be
activated by hitting the associated keys on the front panel. It contains two different
softkey types:
Quick Start Guide 1303.6538.62-01
64
®
R&S ZVL
System Overview
Basic Concepts
Function softkeys
Up to 7 softkeys, each corresponding to a command of the active menu. The function
of the softkeys and their labels are strictly equivalent to the corresponding menu
commands.
Three dots indicate that the softkey calls up a dialog providing several related
settings.
A down arrow indicates a submenu with further related settings.
A softkey with no arrow or dots directly initiates an action.
...
...
Navigation softkey (optional)
Softkey no. 7 is reserved for navigation:
More 1/2, More 2/2 etc.toggle between groups of softkeys which belong to the same
menu. The softkeys are provided whenever the active menu contains more than 6
commands.
The lowest front panel key to the right of the display activates the higher-level menu.
This works in all menus except the top-level one listing the main menus in the menu
bar.
The softkey bar is automatically updated when the active menu is changed.
TIP
Hiding display elements
You can hide the softkey bar and gain screen space for the diagram areas if you use
a mouse to control the analyzer (see Setup/Display Config.). All settings are
accessible from the menus listed in the menu bar across the top of the screen.
Moreover, you don't have to display the softkey bar permanently in order to make use
of its functionality. Hitting any of the keys associated to the softkey bar will make it
visible for a period of time sufficient to select the next instrument function.
3.1.4.4 Front Panel Key Bar
The front panel key bar (hardkey bar, Setup/Display Config.) displays the most
commonly used setup and function keys of the analyzer. Clicking a key symbol
executes the action of the corresponding key.
Quick Start Guide 1303.6538.62-01
65
®
R&S ZVL
System Overview
Basic Concepts
The front panel key bar provides access to the basic groups of settings with a single
mouse click. It is particularly useful if the analyzer is controlled with a mouse or via
Remote Desktop. Alternatively the settings are accessible from the menus of the menu
bar or from the softkey bar.
The front panel key bar is hidden by default to gain screen space for the diagram
areas.
3.1.4.5 Status Bar
The status bar (Setup/Display Config.) describes the current channel (if the setup
contains only one channel), the progress of the sweep, and the control mode of the
analyzer (LOCAL or REMOTE).
During sweep initialization, the progress bar for the sweep is replaced by a
symbol. During the first sweep after a change of the channel settings,
an additional red asterisk symbol appears:
You can hide the status bar and gain screen space for the diagram areas.
3.1.5 Display Elements in the Diagram Area
The central part of the screen is occupied by one or several diagram areas.
Diagram Areas
A diagram area is a rectangular portion of the screen used to display traces. Diagram
areas are arranged in windows; they are independent of trace and channel settings. A
diagram area can contain a practically unlimited number of traces, assigned to different
channels (overlay mode).
Diagram areas are controlled and configured by means of the functions in the Display
menu and the following additional settings:
The settings in the Nwa-Setup – Display submenu arrange several windows
containing one or more diagram areas within the entire screen. Each window
corresponds to a setup. Only one setup can be active at a time, and only the traces
of the active setup are updated by the current measurements.
Various settings to assign traces to diagram areas are provided in the Trace –
Trace-> – Traces submenu.
Diagram areas may contain:
Measurement results, in particular the traces and marker values
Quick Start Guide 1303.6538.62-01
66
®
R&S ZVL
System Overview
Basic Concepts
An indication of the basic channel and trace settings
Context menus providing settings related to the current screen
The examples in this section have been taken from Cartesian diagrams. All other
diagram types provide the same display elements.
3.1.5.1 Title
Across the top of the diagram area, an optional title describes the contents of the area.
Different areas within a setup are distinguished by area numbers in the upper right
corner.
Use the context menu or the functions in the Display menu to display, hide or change
the title and to add and customize diagram areas.
3.1.5.2 Traces
A trace is a set of data points displayed together in the diagram area. The individual
data points are connected so that each trace forms a continuous line.
Quick Start Guide 1303.6538.62-01
67
®
R&S ZVL
System Overview
Basic Concepts
The trace can be complemented by the following display elements, plotted with the
same color:
Reference value (for all traces): The Reference Value is indicated with a triangle
at the right edge of the diagram and a dashed, horizontal line. The value and
position of the triangle can be changed in order to modify the diagram scale and
shift the trace vertically.
Measured quantity (for the active trace): The measured quantity is indicated in the
left upper corner of the diagram.
A trace can be either a data trace, a memory trace, or a mathematical trace; see Trace
Types below.
Context menu of the diagram area
A right mouse click on any point of the diagram area (except the marker info field and
the measured quantity info) opens a context menu:
The settings correspond to the most common commands in the Nwa-Setup – Display
and Nwa-Setup – Display Config menus.
3.1.5.3 Trace Types
The analyzer uses traces to display the current measurement result in a diagram area
but is also capable of storing traces to the memory, recalling stored traces, and
defining mathematical relations between different traces. There are three basic trace
types:
Data traces show the current measurement data and are continuously updated as
the measurement goes on. Data traces are dynamic traces.
Memory traces are generated by storing the data trace to the memory. It
represents the state of the data trace at the moment when it was stored.Memory
traces are static traces which can be stored to a file and recalled.
Quick Start Guide 1303.6538.62-01
68
®
R&S ZVL
System Overview
Basic Concepts
Mathematical traces are calculated according to a mathematical relation between
constants and the data or memory traces of the active setup. A mathematical trace
that is based on the active data trace is dynamic.
It is possible to generate an unlimited number of memory traces from a data trace and
display them together, see Data -> Mem. Markers and marker functions are available
for all trace types.
The trace type of each trace in a diagram area is indicated in the trace list. You can
also make each trace Invisible without deleting it.
3.1.5.4 Trace List and Trace Settings
The main properties of all traces assigned to the diagram area are displayed in the
trace list in the upper left corner.
Each line in the trace list describes a single trace. The active trace is highlighted. The
lines are divided into several sections with the following contents (from left to right):
Trace name indicates the current trace name. The default names for new traces
are Trc<n> where <n> is a current number. A Mem... preceding the trace name
indicates a memory trace. Right-click the section and call the Trace Manager from
the context menu to change the trace name.
Measured quantity indicates the measured quantity, e.g. an S-parameter or an
impedance. The measured quantity of the active trace is also displayed in the
diagram area below the trace list.
Format shows how the measured data is presented in the graphical display (trace
format).
Scale shows the value of the vertical or radial diagram divisions (Scale Div.) and
the Reference Value.
Channel shows the channel that each trace is assigned to. The channel section is
omitted if the all traces in the diagram area are assigned to the same channel.
Type shows Invisible if a trace is hidden and Math if the trace is a mathematical
trace. GAT indicates that a time gate is active for the trace. Right-click the trace
name and click Show Data or Show Mem from the context menu to display and
hide data and memory traces. Use the Trace Funct(ions) to define mathematical
traces. Right-click any of the sections in the trace list (except Type) to open a
context menu and access the most common tasks related to the section.
Context menus of the trace list
A right mouse click on the trace name, the measured quantity, and the format and
scale section of the trace list opens the following context menus, respectively:
Quick Start Guide 1303.6538.62-01
69
®
R&S ZVL
System Overview
Basic Concepts
The settings correspond to the most common commands in the Trace – Trace Select,
Trace – Trace Funct, Trace – Meas, Trace – Format and Trace – Scale menus.
A red label Cal Off ! appears behind the trace list if the system error correction no
longer applies to one or more traces; see Calibration Overview.
3.1.5.5 Markers
Markers are tools for selecting points on the trace and for numerical readout of
measured data. The analyzer provides three different basic marker types.
A (normal) marker (Mkr 1, Mkr 2, ...) determines the coordinates of a measurement
point on the trace. Up to 10 different normal markers can be assigned to a trace.
A reference marker (Ref) defines the reference value for all delta markers.
A delta marker (∆) indicates the coordinates relative to the reference marker.
The stimulus value of a discrete marker always coincides with a sweep point so
that the marker does not show interpolated measurement values.
The markers 1 to 4 are also used for bandfilter search mode. The examples below
show a bandpass search and a bandstop search, respectively.
Quick Start Guide 1303.6538.62-01
70
®
R&S ZVL
System Overview
Basic Concepts
Mkr 1 indicates the maximum (minimum) of the peak.
Mkr 2 and Mkr 3 indicate the lower and upper band edge where the trace value has
decreased (increased) by a definite Level value.
Mkr 4 indicates the center of the peak, calculated as the arithmetic mean value of
the LBE and UBE positions.
3.1.5.6 Marker Info Field
The coordinates of all markers defined in a diagram area are displayed in the info field,
which by default is located in the upper right corner.
The list contains the following information:
Mkr 1, Mkr2, ... denote the marker numbers.
Markers are displayed with the same color as the associated trace.
The marker coordinates are expressed in one of the marker formats selected via
Marker Format. The formats of the markers assigned to a trace are independent of
each other and of the trace format settings.
The active marker has a dot placed in front of the marker line.
A ∆ sign placed in front of the marker line indicates that the marker is in Delta
Mode.
Customizing the marker info field
To change the position, appearance or contents of the marker info field use one of the
following methods:
Double-click the info field to open the Marker Properties dialog with extended
settings for all markers of the active trace.
Right-click the info field to open a context menu providing frequently used marker
settings.
Quick Start Guide 1303.6538.62-01
71
®
R&S ZVL
System Overview
Basic Concepts
To change the position of the marker info field, select Movable Marker Info from the
context menu. Drag-and-drop the info field to any position in the active diagram
area.
To change the format of the active marker, select Mkr Format.
To express the coordinates of the active marker relative to the reference marker,
activate the Delta Mode.
For more information: Show Info Table
In addition to the marker info field, the analyzer provides an info table with extended
marker information.
The table is hidden by default. To display the table double-click the marker info field to
open the Marker Properties dialog.
Context menu of the marker info field
A right mouse click on the marker info field opens a context menu:
Movable Marker Info allows the marker info field to be placed to any position in the
diagram area. The remaining settings correspond to the most common commands in
the Trace – Marker and Trace – Search menus.
3.1.5.7 Channel Settings
The main properties of all channels assigned to the traces in the diagram area are
displayed in the channel list below the diagram.
Each line in the channel list describes a single channel. The channel of the active trace
is highlighted. The lines are divided into several sections with the following contents
(from left to right):
Channel name indicates the current channel name. The default names for new
Quick Start Guide 1303.6538.62-01
72
®
R&S ZVL
System Overview
Basic Concepts
channels are Ch<n> where <n> is a current number. Right-click the section and
call the Channel Manager from the context menu to change the channel name.
Start value of the sweep indicates the lowest value of the sweep variable (e.g. the
lowest frequency measured), corresponding to the left edge of the Cartesian
diagram.
Color legend shows the display color of all traces assigned to the channel. The
colors are different, so the number of colors is equal to the numbers of traces
assigned to the channel.
Additional stimulus parameter shows either the power of the internal signal source
(for frequency sweeps and time sweeps) or the CW frequency (for power sweeps).
Stop value of the sweep indicates the highest value of the sweep variable (e.g. the
highest frequency measured), corresponding to the right edge of the Cartesian
diagram. Right-click any of the sections in the trace list (except Color legend) to
open a context menu and access the most common tasks related to the section.
Context menus of the channel list
A right mouse click on the channel name, the sweep range, and the additional
parameter section of the channel list opens the following context menus, respectively:
The settings correspond to the most common commands in the Channel – Channel
Select, Channel – Center, Span and Channel – Pwr Bw menus.
3.1.5.8 Context Menus
To provide access to the most common tasks and speed up the operation, the analyzer
offers context menus (right-click menus) for the following display elements:
Diagram area
Marker info field
Trace list (separate context menus for trace name section, measured quantity
section, format section, scale section, and channel section)
Channel list (separate context menus for channel name section, sweep range
section, additional parameter section)
Working with context menus requires a mouse. Click inside the display element that
you want to work with using the right mouse button.
Except from some particular screen configurations, anything you can do from a context
menu you can also do from the menu bar using front panel keys and softkeys. Use
whatever method is most convenient for you.
Quick Start Guide 1303.6538.62-01
73
®
R&S ZVL
System Overview
Basic Concepts
3.1.6 Dialogs
Dialogs provide groups of related settings and allow to make selections and enter data
in an organized way. All softkeys with three dots behind their labeling (as in Mkr
Properties...) call up a dialog. The dialogs of the analyzer have an analogous structure
and a number of common control elements.
TIP
Dialog Transparency
The Dialog Transparency function (Nwa-Setup – System Config menu) varies the
transparency of all dialogs. With an appropriate setting, you can control the dialogs
and at the same time view the underlying traces and display elements.
We assume that you are familiar with standard Windows dialogs and mouse operation.
Refer to Using Front Panel Keys to learn how to control dialogs without a mouse and
keyboard.
3.1.6.1 Immediate vs. Confirmed Settings
In some dialogs, the settings take effect immediately so that the effect on the
measurement is observable while the dialog is still open. This is especially convenient
when a numeric value is incremented or decremented, e.g. via the rotary knob.
In most dialogs, however, it is possible to cancel an erroneous input before it takes
effect. The settings in such dialogs must be confirmed explicitly.
The two types of dialogs are easy to distinguish:
Dialogs with immediate settings provide a Close button but no OK button. Example:
Step Size dialog.
Dialogs with confirmed settings provide both an OK button and a Cancel button.
Quick Start Guide 1303.6538.62-01
74
®
R&S ZVL
System Overview
Basic Concepts
Example: On-screen keyboard.
You can also cancel an immediate setting using Setup – Undo.
3.1.6.2 On-Screen Keyboard
A keyboard
keyboard.
symbol next to a character input field opens the analyzer's on-screen
The on-screen keyboard contains two sets of characters plus the following additional
controls:
Shift changes between the two character sets containing lower case
letters/numbers and upper case letters/special characters, respectively.
<= BS deletes the current string in the alphanumeric input field.
OK applies the current selection and closes the keyboard. The current string is
written into the input field of the calling dialog. See also Immediate vs. Confirmed
Settings.
Cancel discards the current selection and closes the keyboard. The input field of
the calling dialog is left unchanged.
The on-screen keyboard allows you to enter characters, in particular letters, without an
external keyboard; see Data Entry. To enter numbers and units, you can also use the
DATA ENTRY keys on the front panel of the instrument.
3.1.6.3 Paste Marker List
A pull-down list symbol next to a numeric input field opens a list of all current stimulus
and response marker values of the active trace. Any of the marker values can be
selected as a numeric entry. If the physical unit of the selected marker value is
inconsistent (mismatch of stimulus and response values) then the numeric value is
used without the unit.
Quick Start Guide 1303.6538.62-01
75
®
R&S ZVL
System Overview
Basic Concepts
The response values in the paste marker list are not updated as the analyzer continues
measuring, so they may differ from the values in the marker info field.
To open the paste marker list you can also click on the input field and use the space
bar of your keyboard or the checkmark key in the navigation area at the front panel of
the analyzer.
3.1.6.4 Numeric Entry Bar
Single numeric values can be entered using the input field of the numeric entry bar.
The numeric entry bar appears just below the menu bar as soon as a function implying
a single numeric entry is activated. In contrast to dialogs, it does not hide any of the
display elements in the diagram area.
The numeric entry bar contains the name of the calling function, a numeric input field
including the Cursor Up/Down buttons for data variation and a Close button. Besides
it is closed automatically as soon as an active display element in the diagram area is
clicked or a new menu command is activated.
3.1.7 Display Formats and Diagram Types
A display format defines how the set of (complex) measurement points is converted
and displayed in a diagram. The display formats in the Trace – Format menu use the
following basic diagram types:
Cartesian (rectangular) diagrams are used for all display formats involving a
conversion of the measurement data into a real (scalar) quantity, i.e. for dB Mag,
Phase, Group Delay, SWR, Lin Mag, Real, Imag and Unwrapped Phase.
Polar diagrams are used for the display format Polar and show a complex quantity
as a vector in a single trace.
Smith charts are used for the display format Smith and show vector like polar
diagrams but with grid lines of constant real and imaginary part of the impedance.
Inverted Smith charts are used for the display format Inverted Smith and show
vector like polar diagrams but with grid lines of constant real and imaginary part of
the admittance.
Quick Start Guide 1303.6538.62-01
76
®
R&S ZVL
System Overview
Basic Concepts
NOTE
Trace formats and measured quantities
The analyzer allows arbitrary combinations of display formats and measured
quantities (Trace – Meas). Nevertheless, in order to extract useful information from
the data, it is important to select a display format which is appropriate to the analysis
of a particular measured quantity; see Measured Quantities and Display Formats.
3.1.7.1 Cartesian Diagrams
Cartesian diagrams are rectangular diagrams used to display a scalar quantity as a
function of the stimulus variable (frequency).
The stimulus variable appears on the horizontal axis (x-axis), scaled linearly
(sweep type Lin Frequency) or logarithmically (sweep type Log Frequency).
The measured data (response values) appears on the vertical axis (y-axis). The
scale of the y-axis is linear with equidistant grid lines although the y-axis values
may be obtained from the measured data by non-linear conversions.
The following examples show the same trace in Cartesian diagrams with linear and
logarithmic x-axis scaling.
Quick Start Guide 1303.6538.62-01
77
®
R&S ZVL
System Overview
Basic Concepts
3.1.7.2 Conversion of Complex into Real Quantities
The results to be selected in the Trace – Meas menu can be divided into two groups:
S-Parameters, Impedances, and Admittances are complex.
Stability Factors are real.
The following table shows how the response values in the different Cartesian diagrams
are calculated from the complex measurement values z = x + jy (where x, y, z are
functions of the sweep variable). The formulas also hold for real results, which are
treated as complex values with zero imaginary part (y = 0).
Trace Format
Description
Formula
dB Mag
Magnitude of z in dB
|z| = sqrt ( x2 + y2 )
dB Mag(z) = 20 * log|z| dB
Lin Mag
Magnitude of z, unconverted
|z| = sqrt ( x2 + y2 )
Phase
Phase of z
φ (z) = arctan (y/x)
Real
Real part of z
Re(z) = x
Imag
Imaginary part of z
Im(z) = y
SWR
(Voltage) Standing Wave Ratio
SWR = (1 + |z|) / (1 – |z|)
Group Delay
Group delay, neg. derivative of the phase response
– d φ (z) / dω (ω = 2π * f)
An extended range of formats and conversion formulas is available for markers. To
convert any point on a trace, create a marker and select the appropriate marker format.
Marker and trace formats can be selected independently.
3.1.7.3 Polar Diagrams
Polar diagrams show the measured data (response values) in the complex plane with a
horizontal real axis and a vertical imaginary axis. The grid lines correspond to points of
equal magnitude and phase.
The magnitude of the response values corresponds to their distance from the
center. Values with the same magnitude are located on circles.
The phase of the response values is given by the angle from the positive horizontal
axis. Values with the same phase on straight lines originating at the center.
The following example shows a polar diagram with a marker used to display a pair of
stimulus and response values.
Quick Start Guide 1303.6538.62-01
78
®
R&S ZVL
System Overview
Basic Concepts
Example: Reflection coefficients in polar diagrams
If the measured quantity is a complex reflection coefficient (S11, S22 etc.), then the
center of the polar diagram corresponds to a perfect load Z0 at the input test port of the
DUT (no reflection, matched input), whereas the outer circumference (|Sii| = 1)
represents a totally reflected signal.
90 0
Circles of equal
magnitude
Voltage reflection:
Short-circuited
load (Z = 0)
Voltage reflection:
Open-circuited
load (Z = infinity)
180 0
00
Radial lines of
equal phase angle
Matching
impedance (Z = Z0)
-90 0
Examples for definite magnitudes and phase angles:
The magnitude of the reflection coefficient of an open circuit (Z = infinity, I = 0) is
one, its phase is zero.
The magnitude of the reflection coefficient of a short circuit (Z = 0, U = 0) is one, its
0
phase is –180 .
3.1.7.4 Smith Chart
The Smith chart is a circular diagram that maps the complex reflection coefficients Sii
to normalized impedance values. In contrast to the polar diagram, the scaling of the
diagram is not linear. The grid lines correspond to points of constant resistance and
reactance.
Points with the same resistance are located on circles.
Points with the same reactance produce arcs.
The following example shows a Smith chart with a marker used to display the stimulus
value, the complex impedance Z = R + j X and the equivalent inductance L (see
marker format description in the help system).
Quick Start Guide 1303.6538.62-01
79
®
R&S ZVL
System Overview
Basic Concepts
TIP
Polar diagram types
A comparison of the Smith chart, the inverted Smith chart and the polar diagram
reveals many similarities between the two representations. In fact the shape of a trace
does not change at all if the display format is switched from Polar to Smith or Inverted
Smith – the analyzer simply replaces the underlying grid and the default marker
format.
Smith chart construction
In a Smith chart, the impedance plane is reshaped so that the area with positive
resistance is mapped into a unit circle.
The basic properties of the Smith chart follow from this construction:
The central horizontal axis corresponds to zero reactance (real impedance). The
center of the diagram represents Z/Z0 = 1 which is the reference impedance of the
system (zero reflection). At the left and right intersection points between the
horizontal axis and the outer circle, the impedance is zero (short) and infinity
(open).
The outer circle corresponds to zero resistance (purely imaginary impedance).
Points outside the outer circle indicate an active component.
The upper and lower half of the diagram correspond to positive (inductive) and
negative (capacitive) reactive components of the impedance, respectively.
Quick Start Guide 1303.6538.62-01
80
®
R&S ZVL
System Overview
Basic Concepts
Example: Reflection coefficients in the Smith chart
If the measured quantity is a complex reflection coefficient Γ (e.g. S11, S22), then the
unit Smith chart can be used to read the normalized impedance of the DUT. The
coordinates in the normalized impedance plane and in the reflection coefficient plane
are related as follows (see also: definition of matched-circuit (converted) impedances):
Z / Z0 = (1 + Γ) / (1 – Γ)
From this equation it is easy to relate the real and imaginary components of the
complex resistance to the real and imaginary parts of Γ:
R = Re(Z / Z 0 ) =
1 − Re(Γ) 2 − Im(Γ) 2
2 ⋅ Im(Γ)
, X = Im(Z / Z 0 ) =
,
2
2
[1 − Re(Γ)] + Im(Γ)
[1 − Re(Γ)]2 + Im(Γ) 2
in order to deduce the following properties of the graphical representation in a Smith
chart:
Real reflection coefficients are mapped to real impedances (resistances).
The center of the Γ plane (Γ = 0) is mapped to the reference impedance Z0,
whereas the circle with |Γ| = 1 is mapped to the imaginary axis of the Z plane.
The circles for the points of equal resistance are centered on the real axis and
intersect at Z = infinity. The arcs for the points of equal reactance also belong to
circles intersecting at Z = infinity (open circuit point (1,0)), centered on a straight
vertical line.
Circles of equal
resistance
Short-circuited
load (Z = 0)
Matching
impedance (Z = Z0)
Open-circuited
load (Z = infinity)
Arcs of equal
reactance
Examples for special points in the Smith chart:
The magnitude of the reflection coefficient of an open circuit (Z = infinity, I = 0) is
one, its phase is zero.
The magnitude of the reflection coefficient of a short circuit (Z = 0, U = 0) is one, its
0
phase is –180 .
3.1.7.5 Inverted Smith Chart
The inverted Smith chart is a circular diagram that maps the complex reflection
coefficients Sii to normalized admittance values. In contrast to the polar diagram, the
scaling of the diagram is not linear. The grid lines correspond to points of constant
conductance and susceptance.
Quick Start Guide 1303.6538.62-01
81
®
R&S ZVL
System Overview
Basic Concepts
Points with the same conductance are located on circles.
Points with the same susceptance produce arcs.
The following example shows an inverted Smith chart with a marker used to display the
stimulus value, the complex admittance Y = G + j B and the equivalent inductance L
(see marker format description in the help system).
TIP
Polar diagram types
A comparison of the Smith chart, the inverted Smith chart and the polar diagram
reveals many similarities between the two representations. In fact the shape of a trace
does not change at all if the display format is switched from Polar to Smith or Inverted
Smith – the analyzer simply replaces the underlying grid and the default marker
format.
Inverted Smith chart construction
The inverted Smith chart is point-symmetric to the Smith chart:
The basic properties of the inverted Smith chart follow from this construction:
The central horizontal axis corresponds to zero susceptance (real admittance). The
center of the diagram represents Y/Y0 = 1, where Y0 is the reference admittance of
the system (zero reflection). At the left and right intersection points between the
horizontal axis and the outer circle, the admittance is infinity (short) and zero
(open).
The outer circle corresponds to zero conductance (purely imaginary admittance).
Quick Start Guide 1303.6538.62-01
82
®
R&S ZVL
System Overview
Basic Concepts
Points outside the outer circle indicate an active component.
The upper and lower half of the diagram correspond to negative (inductive) and
positive (capacitive) susceptive components of the admittance, respectively.
Example: Reflection coefficients in the inverted Smith chart
If the measured quantity is a complex reflection coefficient Γ (e.g. S11, S22), then the
unit inverted Smith chart can be used to read the normalized admittance of the DUT.
The coordinates in the normalized admittance plane and in the reflection coefficient
plane are related as follows (see also: definition of matched-circuit (converted)
admittances):
Y / Y0 = (1 - Γ) / (1 +Γ)
From this equation it is easy to relate the real and imaginary components of the
complex admittance to the real and imaginary parts of Γ
G = Re(Y / Y0 ) =
− 2 ⋅ Im(Γ)
1 − Re(Γ) 2 − Im(Γ) 2
, B = Im(Y / Y0 ) =
,
2
2
[1 + Re(Γ)] + Im(Γ)
[1 + Re(Γ)]2 + Im(Γ) 2
in order to deduce the following properties of the graphical representation in an
inverted Smith chart:
Real reflection coefficients are mapped to real admittances (conductances).
The center of the Γ plane (Γ = 0) is mapped to the reference admittance Y0,
whereas the circle with |Γ| = 1 is mapped to the imaginary axis of the Y plane.
The circles for the points of equal conductance are centered on the real axis and
intersect at Y = infinity. The arcs for the points of equal susceptance also belong to
circles intersecting at Y = infinity (short circuit point (–1,0)), centered on a straight
vertical line.
Circles of equal
conductance
Short-circuited
load (Y = infinity)
Matching
admittance (Y = Y0)
Open-circuited
load (Y = 0)
Arcs of equal
susceptance
Examples for special points in the inverted Smith chart:
The magnitude of the reflection coefficient of a short circuit (Y = infinity, U = 0) is
0
one, its phase is –180 .
The magnitude of the reflection coefficient of an open circuit (Y = 0, I = 0) is one, its
phase is zero.
Quick Start Guide 1303.6538.62-01
83
®
R&S ZVL
System Overview
Basic Concepts
3.1.7.6 Measured Quantities and Display Formats
The analyzer allows any combination of a display format and a measured quantity. The
following rules can help to avoid inappropriate formats and find the format that is
ideally suited to the measurement task.
All formats are suitable for the analysis of reflection coefficients Sii. The formats
SWR, Smith and Inverted Smith lose their original meaning (standing wave ratio,
normalized impedance or admittance) if they are used for transmission Sparameters.
The complex Impedances, and Admittances are generally displayed in one of the
Cartesian diagrams with linear vertical axis scale or in a polar diagram.
The real Stability Factors are generally displayed in a linear Cartesian diagram (Lin
Mag or Real). In complex formats, real numbers represent complex numbers with
zero imaginary part.
The following table gives an overview of recommended display formats.
Complex dimensionless quantities:
S-parameters
Lin Mag
dB Mag
Complex quantities with
dimensions:
impedances, admittances
Real quantities:
Stability Factors
(default)
(default for impedances,
admittances)
–
(default)
–
Phase
Real
Imag
–
Unwrapped Phase
–
Smith
(reflection coefficients Sii)
Polar
–
–
–
–
Inverted Smith
(reflection coefficients Sii)
–
–
SWR
(reflection coefficients Sii)
–
–
Group Delay
(transmission coefficients Sij)
–
–
The default formats are activated automatically when the measured quantity is
changed.
Quick Start Guide 1303.6538.62-01
84
®
R&S ZVL
System Overview
Measured Quantities
3.2 Measured Quantities
This section gives an overview of the measurement results of the network analyzer and
the meaning of the different measured quantities. All quantities can be selected in the
Trace – Meas submenu.
3.2.1 S-Parameters
S-parameters are the basic measured quantities of a network analyzer. They describe
how the DUT modifies a signal that is transmitted or reflected in forward or reverse
direction. For a 2-port measurement the signal flow is as follows.
Extensions to the signal flow
The figure above is sufficient for the definition of S-parameters but does not
necessarily show the complete signal flow. In fact, if the source and load ports are not
ideally matched, part of the transmitted waves are reflected off the receiver ports so
that an additional a2 contribution occurs in forward measurements, an a1 contribution
occurs in reverse measurements.
The scattering matrix links the incident waves a1, a2 to the outgoing waves b1, b2
according to the following linear equation:
b1 S11 S12 a1
b = S
∗
2 21 S 22 a 2
The equation shows that the S-parameters are expressed as S<out>< in>, where <out>
and <in> denote the output and input port numbers of the DUT.
Meaning of 2-port S-parameters
The four 2-port S-parameters can be interpreted as follows:
S11 isthe input reflection coefficient, defined as the ratio of the wave quantities
b1/a1, measured at PORT 1 (forward measurement with matched output and a2 =
0).
S21 is the forward transmission coefficient, defined as the ratio of the wave
quantities b2/a1 (forward measurement with matched output and a2 = 0).
S12 is the reverse transmission coefficient, defined as the ratio of the wave
quantities b1 (reverse measurement with matched input, b1,rev in the figure above
Quick Start Guide 1303.6538.62-01
85
®
R&S ZVL
System Overview
Measured Quantities
and a1 = 0) to a2.
S22 is the output reflection coefficient, defined as the ratio of the wave quantities b2
(reverse measurement with matched input, b2,rev in the figure above and a1 = 0) to
a2, measured at PORT 2.
Meaning of squared amplitudes
The squared amplitudes of the incident and outgoing waves and of the matrix elements
have a simple meaning:
|a1|2
Available incident power at the input of a two-port (= the power provided by a
generator with a source impedance equal to the reference impedance Z0)
|a2|2
Available incident power at the output
|b1|2
Reflected power at the input of a two-port
2
|b2|
Reflected power at the output
2
10*log|S11| (=
20*log|S11|)
Reflection loss at the input
10*log|S22|2
Reflection loss at the output
2
Insertion loss at the input
2
Insertion loss at the output
10*log|S21|
10*log|S12|
3.2.2 Impedance Parameters
An impedance is the complex ratio between a voltage and a current. The analyzer
provides matched-circuit impedances, converted from reflection S-parameters.
3.2.2.1 Converted Impedances
The converted, matched-circuit impedances describe the impedances of a DUT that is
terminated at its outputs with the reference impedance Z0i. i numbers the analyzer/DUT
port.
The analyzer converts the measured S-parameters to determine the matched-circuit
impedances.
Relation with S-parameters
It is possible to express the matched-circuit impedances Zii in terms of the reflection Sparameters Sii and vice versa. The reflection parameters are calculated according to:
Quick Start Guide 1303.6538.62-01
86
®
R&S ZVL
System Overview
Measured Quantities
Z ii = Z 0i
1 + S ii
,
1 − S ii
where i numbers the analyzer/DUT port. The transmission parameters are calculated
according to:
Z ij = 2 ⋅
Z 0i ⋅ Z 0 j
S ij
− (Z 0i + Z 0 j ), i ≠ j ,
The two sets of reflection S-parameters and input/output impedances provide
equivalent descriptions of the reflection in a linear n-port network. Another set of
equivalent parameters is given by the matched-circuit admittances, defined as the
inverse of the impedances.
Example:
Z11 is the input impedance of a 2-port DUT that is terminated at its output with the
reference impedance Z0 (matched -circuit impedance measured in a forward reflection
measurement).
You can also read the converted impedances in a reflection coefficient measurement
from the Smith chart.
3.2.3 Admittance Parameters
An admittance is the complex ratio between a current and a voltage. The analyzer
provides matched-circuit admittances, converted from S-parameters.
3.2.3.1 Converted Admittances
The converted (matched-circuit) admittances describe the admittances of a DUT that is
terminated at its outputs with the reference impedance values Z0i. i numbers the
analyzer/DUT port. The analyzer converts the measured S-parameters to determine
the matched-circuit admittances. The converted admittances are the inverse of the
converted impedances.
The reflection parameters are calculated according to:
Yii =
1 1 − S ii
= 1 / Z ii ,
Z 0i 1 + S ii
where i numbers the analyzer/DUT port. The transmission parameters are calculated
according to:
Yij =
Sij
2 ⋅ Z 0i ⋅ Z 0 j − Sij ⋅ (Z 0i + Z 0 j )
Quick Start Guide 1303.6538.62-01
= 1 / Z ij , i ≠ j ,
i, j = 1, ..., 99
87
®
R&S ZVL
System Overview
Measured Quantities
Example:
Y11 is the input admittance of a 2-port DUT that is terminated at its output with the
reference impedance Z0 (matched -circuit admittance measured in a forward reflection
measurement).
You can also read the converted admittances in a reflection coefficient measurement
from the inverted Smith chart.
Quick Start Guide 1303.6538.62-01
88
®
R&S ZVL
System Overview
Calibration Overview
3.3 Calibration Overview
Calibration is the process of eliminating systematic, reproducible errors from the
measurement results (system error correction). The process involves the following
stages:
1. A set of calibration standards is selected and measured over the required sweep
range. For many calibration types the magnitude and phase response of each
calibration standard (i.e. its S-parameters if no system errors occur) must be
known within the entire sweep range.
2. The analyzer compares the measurement data of the standards with their known,
ideal response. The difference is used to calculate the system errors using a
particular error model (calibration type) and derive a set of system error correction
data.
3. The system error correction data is used to correct the measurement results of a
DUT that is measured instead of the standards.
Calibration is always channel-specific because it depends on the hardware settings, in
particular on the sweep range. The means that a system error correction data set is
stored with the calibrated channel.
The analyzer provides a wide range of sophisticated calibration methods for all types of
measurements. Which calibration method is selected depends on the expected system
errors, the accuracy requirements of the measurement, on the test setup and on the
types of calibration standards available.
Due to the analyzer's calibration wizard, calibration is a straightforward, menu-guided
process.
TIP
Storing system error correction data
The system error correction data determined in a calibration procedure is stored on
the analyzer. You can read this correction data using the remote control command
[SENSe<Ch>:]CORRection:CDATa. You can also replace the correction data of
the analyzer by your own correction data sets.
A label Cal Off ! appears behind the trace list if the system error correction no longer
applies to one or more traces:
This may happen for the one of the following reasons:
– The sweep range is outside the calibrated frequency range.
– The channel calibration is not sufficient for the measured quantity (e.g. a one-port
calibration has been performed, but the measured quantity is a transmission
parameter).
– The system error correction has been switched off deliberately (Correction Off).
Quick Start Guide 1303.6538.62-01
89
®
R&S ZVL
System Overview
Calibration Overview
3.3.1 Calibration Standards and Calibration Kits
A calibration kit is a set of physical calibration standards for a particular connector type.
The magnitude and phase response of the calibration standards (i.e. their Sparameters) must be known or predictable within a given frequency range.
The standards are grouped into several types (open, through, match,...) corresponding
to the different input quantities for the analyzer's error models. The standard type also
determines the equivalent circuit model used to describe its properties. The circuit
model depends on several parameters that are stored in the cal kit file associated with
the calibration kit.
As an alternative to using circuit models, it is possible to describe the standards by
means of S-parameter tables stored in a file.
The analyzer provides a large number of predefined cal kits but can also import cal kit
files and create new kits:
A selection of predefined kits is available for all connector types. The parameters of
these kits are displayed in the Add/Modify Standards dialog, however, it is not
possible to change or delete the kits.
Imported and user-defined kits can be changed in the Calibration Kits dialog and its
various sub-dialogs.
Calibration kits and connector types are global resources; the parameters are stored
independently and are available irrespective of the current setup.
3.3.1.1 Calibration Types
The analyzer provides a wide range of calibration types for one, two or more ports. The
calibration types differ in the number and types of standards used, the error terms, i.e.
the type of systematic errors corrected and the general accuracy. The following table
gives an overview.
Calibration Type
Standards
Parameters
Error Terms
General
Accuracy
Application
Reflection
Normalization
Open or Short
S11
(or S22, ...)
Reflection
tracking
Low to
medium
Reflection measurements on
any port.
Transmission
Normalization
Through
S12, S21
Transmission
tracking
Medium
Transmission measurements in
any direction and between any
combination of ports.
Full One-Port
Open, Short,
Match1)
S11
(or S22, ...)
Reflection
tracking,
Source match
Directivity,
High
Reflection measurements on
any port.
One-Path Two-Port
Open, Short,
Match1) (at
source port),
Through2)
S11, S21
(or S22,...)
Reflection
tracking,
Source match,
Directivity,
Transmission
tracking
Medium to
high
Unidirectional transmission
measurements in any direction
and between any combination
of ports.
Quick Start Guide 1303.6538.62-01
90
®
R&S ZVL
System Overview
Calibration Overview
Calibration Type
Standards
Parameters
Error Terms
General
Accuracy
Application
TOSM
Open, Short,
Match1) (at
each port),
Through2)
(between the 2
ports)
All
Reflection
tracking,
Source match,
Directivity,
Load match,
Transmission
tracking
High
Reflection and transmission
measurements on DUTs with 2
ports.
1) Or any other 3 known one-port standards. To be used in a guided calibration, the
known standards must be declared to be open, short, and match irrespective of their
properties.
2) Or any other known two-port standard. See remark above.
The calibration type must be selected in accordance with the test setup. Select the
calibration type for which you can obtain or design the most accurate standards and for
which you can measure the required parameters with best accuracy.
Normalization
A normalization is the simplest calibration type since it requires the measurement of
only one standard for each calibrated S-parameter:
One-port (reflection) S-parameters (S11, S22, ...) are calibrated with an open or a
short standard providing the reflection tracking error term.
Two-port (transmission) S-parameters (S12, S21, ...) are calibrated with a through
standard providing the transmission tracking error term.
Normalization means that the measured S-parameter at each sweep point is divided by
the corresponding S-parameter of the standard. A normalization eliminates the
frequency-dependent attenuation and phase shift in the measurement path (reflection
or transmission tracking error). It does not compensate for directivity or mismatch
errors. This limits the accuracy of a normalization.
Full One-Port Calibration
A full one-port calibration requires a short, an open and a match standard to be
connected to a single test port. The three standard measurements are used to derive
all three reflection error terms:
The short and open standards are used to derive the source match and the
reflection tracking error terms.
The match standard is used to derive the directivity error.
A full one-port calibration is more accurate than a normalization but is only applicable
for reflection measurements.
One-Path Two-Port Calibration
A one-path two-port calibration combines a full one-port calibration with a transmission
normalization, so it requires a short, an open and a match standard to be connected to
a single test port plus a through standard between this calibrated source port and a
second load port. The four standard measurements are used to derive the following
error terms:
Quick Start Guide 1303.6538.62-01
91
®
R&S ZVL
System Overview
Calibration Overview
The short and open standards are used to derive the source match and the
reflection tracking error terms at the source port.
The match standard is used to derive the directivity error at the source port.
The through standard provides the transmission tracking error term.
A one-path two-port calibration requires only four standards to be connected (instead
of 7 for a full two-port TOSM calibration) and is suitable when only the forward (e.g. S11
and S21) or reverse S-parameters (e.g. S22 and S12) are to be measured and the DUT
is well matched, especially at the load port.
TOSM Calibration
A TOSM (Through – Open – Short – Match) calibration requires the same standards as
the one-path two-port calibration, however, all measurements are performed in the
forward and reverse direction. TOSM is also referred to as SOLT (Short – Open – Load
= Match – Through) calibration. The four standards are used to derive 6 error terms for
each signal direction:
In addition to the source match and reflection tracking error terms provided by
the one-path two-port calibration, TOSM also provides the load match.
The directivity error is determined at both source ports.
The transmission tracking is determined for each direction.
The number of required standard measurements and of error terms for 2-port
measurements is shown in the following table.
Number of ports
Number of standards to be
connected
Number of standard
measurements
Number of error terms
2
2*3
+1 = 7
2*3
+2 * 1 = 8
2*3
+ 2 * 2 = 10
An open, through and match measurement is required at each port; in addition, a
through must be measured between the two ports and in both directions.
The analyzer automatically performs each through measurement in both directions, so
the number of connected standards is smaller than the number of measurements.
Quick Start Guide 1303.6538.62-01
92
R&S® ZVL
Measurement Examples
Simple Measurement Tasks
4
Measurement Examples....................................................................................... 94
Simple Measurement Tasks..............................................................................................................94
Display Configuration ........................................................................................................................94
To select or define a color scheme for the diagrams and their display elements ... ......................94
To change the marker colors..........................................................................................................94
Screen Control ..................................................................................................................................95
To move an active setup window within the available space ... .....................................................95
To size the active setup window ....................................................................................................95
Data Transfer ....................................................................................................................................95
To copy the active setup ................................................................................................................95
To load a setup stored on an external device... .............................................................................96
Setting up a Sweep ...........................................................................................................................96
To Set up a Lin Frequency Sweep... ..............................................................................................96
To Set up a Log Frequency Sweep................................................................................................96
To Set up a Segmented Frequency Sweep... ................................................................................97
Optimization .......................................................................................................................................97
Optimizing the Measurement Speed.................................................................................................97
To find the best set of sweep points...............................................................................................97
To find the appropriate noise reduction settings... .........................................................................98
Calibration .........................................................................................................................................98
Calibrating a Measurement Channel ................................................................................................98
Select and perform a manual calibration........................................................................................98
Operating Manual 1303.6580.32-01
93
R&S® ZVL
Measurement Examples
Simple Measurement Tasks
4 Measurement Examples
This chapter provides examples for typical measurement tasks to be performed on the network analyzer.
To make yourself familiar with the instrument, use the simple measurement examples outlined in the
Getting Started chapter. For a systematic explanation of all menus, functions and parameters and
background information refer to the Manual Control reference.
Simple Measurement Tasks
Display Configuration
The analyzer provides various tools that you can use to customize the diagram areas and control
elements. The following examples show how to change the display colors.
To select or define a color scheme for the diagrams and their display elements ...
1.
2.
3.
4.
5.
Click Nwa-Setup — Display Config — Color Scheme... to open the Color Scheme dialog.
Select the Predefined Scheme that is most appropriate for your needs.
Click Define User Scheme... to open the Define User Color Scheme dialog.
Select a display element from the Element drop-down list.
Click the Color field to open a standard Color dialog and assign the color.
You can repeat the last 2 steps for as many elements as you like. For traces, you can also select a Trace
Style and Trace Width. Your settings apply to all setups, they are permanent even after you close the
network analyzer application.
6. If you wish to use several color schemes in parallel, click Save to save your current color scheme
to a file.
7. If you wish to restore the original Predefined Scheme, click Setup — System Config... — Resets
— Reset Colors.
To change the marker colors...
When you create markers, their color is the same as the color of the associated trace. You can change the
marker colors using the Color Scheme dialog.
1.
2.
3.
4.
5.
Click Nwa-Setup — Display Config — Color Scheme...
Click Define User Scheme... to open the Define User Color Scheme dialog.
Select Same Color for all Markers from the Element drop-down list.
Click the Color field to open a standard Color dialog and assign the color.
Click Use same Color for all Markers.
All markers are displayed with the same color, irrespective of the trace colors.
Operating Manual 1303.6580.32-01
94
R&S® ZVL
Measurement Examples
Simple Measurement Tasks
Screen Control
Control of the analyzer's display elements is based on the standard Windows™ functionality. The following
examples show you how to make efficient use of the functions.
To move an active setup window within the available space ...
1. Make sure that the window is not maximized.
2. Click the
icon in the title bar to open the setup control menu.
3. Click Move.
After the pointer changes to the four-headed arrow:
4. Press one of the direction keys (left, right, up, or down arrow key) to move the entire window
without changing its size.
5. Press ENTER or left-click the window when it is at the position you want.
To size the active setup window ...
1. Make sure that the window is not maximized.
2. Click the
icon in the title bar to open the setup control menu.
3. Click Size.
After the pointer changes to the four-headed arrow:
4. Press one of the direction keys (left, right, up, or down arrow key) to move the pointer to the
border you want to move.
5. Press a direction key to move the border.
Press ENTER or left-click the window when it is the size you want.
Data Transfer
The following examples show you how to perform basic tasks related to data transfer from and to the
analyzer.
To copy the active setup ...
1.
2.
3.
4.
Connect a storage device like an USB stick or a CD-ROM drive to an USB connector.
Click Nwa-File — Save Nwa As to open the Save As dialog.
Open the Save in drop-down list and select the storage device and a folder.
Select a File name and click Save to store the data on the storage device and to close the Save
As dialog.
The default extension for setup files (*.nwa) is appended automatically.
Operating Manual 1303.6580.32-01
95
R&S® ZVL
Measurement Examples
Simple Measurement Tasks
To load a setup stored on an external device...
1.
2.
3.
4.
5.
Connect the storage device to an USB connector.
Click Nwa-File — Recall Nwa to open the Open dialog.
Open the Look in drop-down list and select the storage device.
In the center of the dialog, select the folder containing the setup files.
Select a file and click Open to load the setup as the active setup.
Setting up a Sweep
Configurations of the different sweep types require different procedures. The following examples list the
essential settings for various sweep types.
To Set up a Lin Frequency Sweep...
1.
2.
3.
4.
Press the Sweep key or click Channel - Sweep to access the Sweep submenu.
Click Sweep Type – Lin Frequency.
Click Channel – Center or Span to access the submenu defining the sweep range.
To define a sweep range confined by a start and a stop frequency, use Start and Stop.
Alternatively, to define a sweep range of definite width around a known center frequency (e.g. an
expected peak), use Center and Span.
5. To vary the number of measurement points (e.g. to improve the resolution of the sweep or reduce
the sweep time), click Channel – Sweep – Number of Points.
If the active diagram is a Cartesian diagram, the x-axis is linearly scaled and labeled with the Start and
Stop frequencies.
To Set up a Log Frequency Sweep...
1. Press the Sweep key or click Channel - Sweep to access the Sweep submenu.
2. Click Sweep Type - Log Frequency.
3. Click Channel - Center or Span to access the submenu defining the sweep range.
4. To define a sweep range confined by a start and a stop frequency, use Start and Stop.
Alternatively, to define a sweep range of definite width around a known center frequency (e.g. an
expected peak), use Center and Span.
5. To vary the number of measurement points (e.g. to improve the resolution of the sweep or reduce
the sweep time), click Channel - Sweep - Number of Points.
If the active diagram is a Cartesian diagram, the x-axis is logarithmically scaled and labeled with the Start
and Stop frequencies.
Operating Manual 1303.6580.32-01
96
R&S® ZVL
Measurement Examples
Optimization
To Set up a Segmented Frequency Sweep...
1. Press the Sweep key or click Channel - Sweep to access the Sweep submenu.
2. Click Sweep Type - Define Segments to call up the dialog defining the individual sweep segments.
Proceed as described in Define Segments to customize your sweep range. Make sure to define at
least 2 distinct sweep frequencies.
3. Use the controls in the Individual Settings panel to define the internal generator power,
measurement (IF) bandwidth and other measurement settings for each sweep segment.
4. Close the Define Segments dialog.
5. Click Sweep Type - Segmented Frequency.
If the active diagram is a Cartesian diagram, the x-axis is linearly scaled and ranges from the lowest to the
highest frequency in all segments.
Optimization
Optimizing the Measurement Speed
Minimizing the measurement time per sweep contributes to a high measurement throughput. The following
parameters have an influence on the sweep time:
To find the best set of sweep points...
Limit the measurement to the stimulus range that you need for your device:
1. Click Channel - Center or Span to access the submenu defining the sweep range.
2. To define a sweep range confined by a start and a stop frequency, use Start and Stop.
Alternatively, to define a sweep range of definite width around a known center frequency (e.g. an
expected peak), use Center and Span.
3. Alternatively, use the marker functions to define the sweep range.
Use the minimum number of points that will produce an acceptable resolution:
1. Click Channel – Sweep – Number of Points and reduce the number of sweep points.
Use the segmented sweep to focus on different subranges of the sweep, using optimized channel settings
for each subrange:
1. Set up a segmented frequency sweep as described in Segmented Frequency.
2. Optimize the number of points and the noise reduction settings for each individual sweep
segment.
The sweep time increases with the Frequency Step Size.
Operating Manual 1303.6580.32-01
97
R&S® ZVL
Measurement Examples
Optimization
To find the appropriate noise reduction settings...
Use the fastest IF filter that will produce acceptable dynamic range:
1. Press the PWR BW key or click Channel – Pwr Bw to access the corresponding submenu.
2. Select the widest bandwidth compatible with your measurement task.
3. If possible, click Fine Adjust to further increase the bandwidth. Avoid selecting High Selectivity
unless it is required for your measurement.
Calibration
Calibrating a Measurement Channel
Calibration is the process of eliminating systematic, reproducible errors from the measurement results
(system error correction).
Select and perform a manual calibration
In the following example a 2-port TOSM calibration is performed using the Calibration Wizard. Other
calibrations can be performed in an analogous way.
1. Perform all channel settings for your measurement.
2. Click Channel – Cal – Start Cal – Two-Port P1 P2 – TOSM to open the calibration wizard for the
desired calibration type.
3. In the first dialog of the calibration wizard, select the connector type that you use at port 1 and 2
(both connector types must be equal) and the calibration kit. Click Next > to access the next dialog
of the wizard.
4. Connect an open standard to port 1 and click the corresponding box in the Measured Standards
list to initiate the calibration sweep and acquire the calibration data for this standard.
5. Repeat the last step for a short and a match connected to port 1, an open, short and match
connected to port 2, and for a through between both ports.
6. Click Apply to start the calculation of the system error correction data, apply them to the current
channel and close the calibration wizard.
7. Replace the last measured standard with your DUT and perform calibrated measurements without
changing the channel settings used for calibration.
Operating Manual 1303.6580.32-01
98
R&S® ZVL
GUI Reference
Control Menus
5
GUI Reference ..................................................................................................... 105
Control Menus..................................................................................................................................105
Restore............................................................................................................................................106
Move................................................................................................................................................106
Size .................................................................................................................................................106
Minimize ..........................................................................................................................................106
Maximize .........................................................................................................................................106
Close ...............................................................................................................................................106
Next .................................................................................................................................................106
Nwa-File Menu..................................................................................................................................107
New .................................................................................................................................................107
Close ...............................................................................................................................................108
Recall Nwa ......................................................................................................................................108
Open Dialog..................................................................................................................................108
Save Nwa ........................................................................................................................................109
Save Nwa As...................................................................................................................................109
Save As Dialog .............................................................................................................................109
Page Setup......................................................................................................................................110
Page Setup Dialog........................................................................................................................110
Recent File ......................................................................................................................................111
Exit ..................................................................................................................................................112
Trace Menu .......................................................................................................................................112
Trace -> ...........................................................................................................................................113
Data -> Mem.................................................................................................................................114
Math = Data/Mem .........................................................................................................................114
Math = Data-Mem.........................................................................................................................115
Show Data ....................................................................................................................................115
Show Mem....................................................................................................................................115
Traces .............................................................................................................................................115
Select Trace..................................................................................................................................117
Operating Manual 1303.6580.32-01
99
R&S® ZVL
GUI Reference
Control Menus
Add Trace .....................................................................................................................................117
Add Trace + Diag. Area ................................................................................................................117
Delete Trace .................................................................................................................................118
Assign Diag Area..........................................................................................................................118
Assign Channel.............................................................................................................................118
Trace Manager .............................................................................................................................119
Trace Statistics .............................................................................................................................121
Smoothing On...............................................................................................................................126
Smoothing Aperture......................................................................................................................126
Import/Export Data .......................................................................................................................127
Shift Response Value... ................................................................................................................133
Shift Stimulus Value... ..................................................................................................................134
Max Hold On.................................................................................................................................134
Restart Hold..................................................................................................................................134
Marker ->.........................................................................................................................................135
Next Peak .....................................................................................................................................135
Start = Marker...............................................................................................................................136
Stop = Marker ...............................................................................................................................136
Center = Marker............................................................................................................................136
Ref Value = Marker.......................................................................................................................136
Max = Marker................................................................................................................................136
Min = Marker.................................................................................................................................137
Zero Delay at Marker....................................................................................................................137
Marker Search ..............................................................................................................................137
Marker Search.................................................................................................................................137
Max Search...................................................................................................................................138
Min Search....................................................................................................................................138
Peak Search > ..............................................................................................................................139
< Peak Search ..............................................................................................................................139
Target ...........................................................................................................................................139
Operating Manual 1303.6580.32-01
100
R&S® ZVL
GUI Reference
Control Menus
Bandfilter.......................................................................................................................................141
Def Peak .......................................................................................................................................147
Search Range...............................................................................................................................148
Marker Tracking............................................................................................................................149
Marker .............................................................................................................................................150
Marker 1, 2, 3................................................................................................................................152
Ref Marker ....................................................................................................................................152
Delta Mode ...................................................................................................................................153
Ref.Marker -> Marker ...................................................................................................................153
All Mkrs Off ...................................................................................................................................153
Mkr Format ...................................................................................................................................153
More Mkrs.....................................................................................................................................155
Coupled Mkrs................................................................................................................................155
Discrete Mkrs................................................................................................................................156
Mkr Properties... ...........................................................................................................................156
Export Mkrs...................................................................................................................................158
Meas................................................................................................................................................158
S11, S12, S21, S22 ......................................................................................................................159
Impedance ....................................................................................................................................160
Admittance....................................................................................................................................161
Stability Factors ............................................................................................................................162
Format .............................................................................................................................................163
dB Mag .........................................................................................................................................165
Phase............................................................................................................................................165
Smith.............................................................................................................................................165
Polar .............................................................................................................................................166
Group Delay..................................................................................................................................166
Aperture ........................................................................................................................................167
SWR .............................................................................................................................................168
Lin Mag .........................................................................................................................................169
Operating Manual 1303.6580.32-01
101
R&S® ZVL
GUI Reference
Control Menus
Real ..............................................................................................................................................169
Imag..............................................................................................................................................170
Inv Smith.......................................................................................................................................170
Unwrapped Phase ........................................................................................................................170
Scale ...............................................................................................................................................171
Autoscale ......................................................................................................................................172
Scale / Div.....................................................................................................................................172
Ref Value ......................................................................................................................................172
Ref Position ..................................................................................................................................173
Overlay All ....................................................................................................................................173
Split All..........................................................................................................................................174
Maximize.......................................................................................................................................174
Lines................................................................................................................................................175
Show Limit Line ............................................................................................................................176
Limit Check On .............................................................................................................................177
Fail Beep On.................................................................................................................................178
Define Limit Line ...........................................................................................................................178
Horizontal Line..............................................................................................................................182
Global Limit Check On..................................................................................................................183
Channel Menu ..................................................................................................................................184
Center, Span ...................................................................................................................................184
Pwr Bw ............................................................................................................................................185
Power............................................................................................................................................186
Step Atten b1, b2 ..........................................................................................................................187
RF Off ...........................................................................................................................................187
Meas Bandwidth ...........................................................................................................................187
Cal ...................................................................................................................................................188
Start Cal........................................................................................................................................189
Guided Calibration........................................................................................................................191
Repeat Prev Cal ...........................................................................................................................196
Operating Manual 1303.6580.32-01
102
R&S® ZVL
GUI Reference
Control Menus
Correction Off ...............................................................................................................................197
Port Extensions ...............................................................................................................................197
Electrical Length ...........................................................................................................................199
Mechanical Length .......................................................................................................................200
Delay.............................................................................................................................................201
Auto Length ..................................................................................................................................201
Auto Offset....................................................................................................................................202
Cal Manager .................................................................................................................................203
Recall Last Cal Set .......................................................................................................................204
Cal Kits .........................................................................................................................................205
Sweep .............................................................................................................................................217
Sweep Type..................................................................................................................................218
Number of Points..........................................................................................................................225
Frequency Step Size ....................................................................................................................226
Meas Delay...................................................................................................................................226
Restart ..........................................................................................................................................227
Single (All Chans).........................................................................................................................227
Define Restart...............................................................................................................................227
Average Factor .............................................................................................................................228
Sweep .............................................................................................................................................228
Channel Select ................................................................................................................................230
Next Channel ................................................................................................................................231
Select Channel .............................................................................................................................231
Add Chan + Trace ........................................................................................................................232
Add Chan + Trace + Diag Area ....................................................................................................232
Delete Channel .............................................................................................................................232
Channel Manager .........................................................................................................................233
Nwa-Setup Menu ..............................................................................................................................234
Display.............................................................................................................................................235
Delete Diag Area ..........................................................................................................................236
Operating Manual 1303.6580.32-01
103
R&S® ZVL
GUI Reference
Control Menus
Dual Split ......................................................................................................................................236
Triple Split.....................................................................................................................................236
Quad Split .....................................................................................................................................237
Split Manager................................................................................................................................238
Title ...............................................................................................................................................240
Display Config .................................................................................................................................241
Color Scheme ...............................................................................................................................242
Define User Color Scheme...........................................................................................................242
Softkey Labels ..............................................................................................................................244
Status Bar .....................................................................................................................................244
Front Panel Keys ..........................................................................................................................244
Frequency Info..............................................................................................................................245
Undo................................................................................................................................................245
Redo................................................................................................................................................245
Setup Info ........................................................................................................................................245
System Config .................................................................................................................................245
Integrated Window ..........................................................................................................................248
External Tools .................................................................................................................................248
Help Menu.........................................................................................................................................248
Help Topics .....................................................................................................................................248
About NWA......................................................................................................................................249
Operating Manual 1303.6580.32-01
104
R&S® ZVL
GUI Reference
Control Menus
5 GUI Reference
This chapter explains in detail all functions of the analyzer and their application. It is organized according
to the menus/softkey groups of the user interface:
All topics in this chapter can be called up directly using the HELP key in the menus or the Help buttons in
the dialogs. A link at the end of each function description leads to the corresponding remote control
command.
For a general overview of the analyzer's capabilities and their use refer to the System Overview.
Control Menus
The Control menus provide standard Windows™ functions to control windows. The analyzer provides two
types of Control menus with analogous function:
•
Clicking the
icon opens the Control menu for the main application window. To access this icon
the Title Bar of the main application window must be open.
•
Clicking a
icon opens the Control menu for an individual setup window. If a setup window is
maximized, the icon is placed to the left of the File menu.
Double-clicking a control icon is the same as clicking the
icon or the Close menu command.
(No
direct
access
via
front
panel
keys)
The Control menu contains the following functions:
•
Restore returns the active window to its size and position.
•
Move displays a cursor symbol to moves the active window within the available space.
•
Size displays a cursor symbol to size the active window.
•
Minimize reduces the active window to an icon.
•
Maximize enlarges the active window to fill the available space.
•
Close closes the application.
•
Next switches to the next open setup window.
Operating Manual 1303.6580.32-01
105
R&S® ZVL
GUI Reference
Control Menus
Restore
Returns the maximized or minimized active window to its size and position. Restore is available after a
Maximize or Minimize command only.
Move
Displays a four-headed arrow to move the active window with the arrow keys.
This command is unavailable for maximized windows.
Size
Returns the maximized or minimized active window to its size and position. Restore is available after a
Maximize or Minimize command only.
This command is unavailable for maximized windows.
Minimize
Reduces the active window to an icon.
Maximize
Enlarges the active window to fill the available space.
Close
Closes the active setup window (setup control menu) or ends the analyzer session (application control
menu).
•
In a setup window the analyzer suggests to save changes to the setup before closing it. If a setup
is closed without saving, all changes made since the last time it was saved are lost.
•
In the application window the analyzer prompts you to save documents with unsaved changes.
The Close application command is equivalent to the Exit command in the File menu.
Moreover Close is the same as double-clicking a Control menu icon or clicking the
icon in
the title bar of the active window.
Next
Selects the next diagram area as the active diagram area. This command is available in setup control
menus only and is disabled if only one setup is defined.
Operating Manual 1303.6580.32-01
106
R&S® ZVL
GUI Reference
Nwa-File Menu
Nwa-File Menu
The Nwa-File menu provides standard Windows™ functions to create, save, and recall setups, and to shut
down the application.
Setups
A setup comprises a set of diagram areas with all displayed information that can be stored to a NWA
setup file (*.zvx). Each setup is displayed in an independent window.
The File menu contains the following functions:
•
New creates a new setup and opens a new setup window.
•
Close closes an opened setup window.
•
Page Setup... selects a printer and printer connection.
•
Save Nwa saves an opened setup.
•
Save Nwa As... saves an opened setup to a specific file.
•
Recall Nwa recalls an existing setup from a file.
•
1 Set<n>.nwa etc. is a list of the last 4 setups stored in the current or in previous sessions.
•
Exit closes the application.
New
Creates a new setup and opens a new setup window. The new setup is named Setup<n> where <n> is
the current number for all created setups.
To open an existing setup, select File – Recall Nwa. To rename a setup, use File – Save As.
Remote control:
MEMory:DEFine "<setup_name>"
Operating Manual 1303.6580.32-01
107
R&S® ZVL
GUI Reference
Nwa-File Menu
Close
Closes an opened setup window. The analyzer suggests to save changes to the setup before closing it. If
a setup is closed without saving, all changes made since the last time it was saved are lost.
Remote control:
MEMory:DELete[:NAME] "<setup_name>"
Recall Nwa
Recalls an existing setup from a file. The analyzer opens a standard Windows™ Open dialog box to select
the file from all NWA setup files (*.nwa) stored on the file system.
It is not possible to open the same setup in different windows. If an opened setup is changed and an
attempt is made to open the same setup again the analyzer displays a warning:
Yes overwrites the changes in the opened setup, No closes the message box, leaving the opened setup
unchanged.
It is possible to create and open several setup files with the same contents but different
names or locations. To open/recall a setup file (*.nwa) you can also use the Windows
Explorer and simply double-click the file or drag and drop the file into the NWA application.
The imported setup becomes the active setup.
Remote control:
MMEMory:LOAD:STATe 1,"<file_name>"
Open Dialog
Specifies the name and location of a particular file (e.g. a NWA setup file) to open:
•
Look in specifies the drive and directory in which the file to open is stored. The icons to the right of
the pull-down list are provided for easy navigation in the file system (place the cursor on the icons
to obtain What's this? help).
•
File Name specifies a file name (e.g. a setup file, *.nwa) to open. The file can be selected by
clicking on the directory overview above.
•
Open opens selected file and closes the dialog.
•
Cancel closes the dialog without opening a setup file.
Operating Manual 1303.6580.32-01
108
R&S® ZVL
GUI Reference
Nwa-File Menu
Save Nwa
Saves an opened setup to its current name and directory. On saving a setup for the first time, the analyzer
displays the Save As dialog box in order to name the setup file.
To change the name and directory of an existing setup before saving it, choose the Save As
command.
Save Nwa As
Saves and names the active setup. The analyzer opens a standard Windows™ Save As dialog box to
select a NWA setup file name (*.nwa) and location for the setup file.
To save a document with its existing name and directory, use the Save command.
Remote control:
MMEMory:STORe:STATe 1,"<file_name>"
Save As Dialog
Specifies the name and location of a particular file (e.g. a NWA setup file) to save:
•
File Name specifies a file name to save the current data (e.g. the setup). The analyzer adds the
Operating Manual 1303.6580.32-01
109
R&S® ZVL
GUI Reference
Nwa-File Menu
extension (e.g. *.nwa) in the Save As Type box.
•
Save in specifies the drive and directory in which the data is stored. The icons to the right of the
pull-down list are provided for easy navigation in the file system (place the cursor on the icons to
obtain What's this? help).
•
Save saves the data (e.g. the active setup) in the selected file and directory and closes the dialog.
•
Cancel closes the dialog without saving the data.
The Save As dialog is used to store various data types (e.g. cal kit data, limit lines, sweep
segment lists, ...). Depending on its use the dialog is opened with different file locations and
data types. File locations (directories) are remembered when the dialog is closed. To restore
default directories use the System – System Configuration – Resets dialog.
Page Setup
Selects a printer and a printer connection. This command presents a Page Setup dialog box to specify the
printer and its connection.
Page Setup Dialog
Provides options to specify how the document should be printed. Page Setup is opened by means of the
File – Page Setup... command.
•
Paper – Size specifies the size of paper that the document is to be printed on.
•
Paper – Source specifies the paper source, because some printers offer multiple trays for different
Operating Manual 1303.6580.32-01
110
R&S® ZVL
GUI Reference
Nwa-File Menu
paper sources.
•
The radio buttons in the Print panel specify whether or not different diagram areas are printed on
different pages.
•
The radio buttons in the Orientation panel specify whether the pages are printed in Portrait or
Landscape format.
•
The Margins panel contains input fields to define a margin on each of the four edges of the pages.
•
The check boxes in the Add panel select additional information to be included in the printed
document.
•
Printer... opens the Page Setup dialog to select the printer and printer connection. The printers
can be selected from the Name drop-down list. Network... opens a dialog to configure the printer
connections. Properties opens a dialog to select the layout and paper format and specify further
printer options.
•
Preview shows the active setup as it would appear when printed.
To select the Print Range and start printing, open the Print dialog. To install printers and
configure ports use the Control Panel.
Remote control:
HCOPy:DESTination
HCOPy:DEVice:LANGuage
HCOPy:ITEM:ALL
HCOPy:ITEM...
HCOPy:PAGE...
HCOPy:ORIentation
HCOPy:WINDow
HCOPY[:IMMediate].
Recent File
Is a placeholder which is replaced by a list of the last 4 setups stored in the current or in previous
sessions. Clicking an item in the list opens the corresponding setup.
Use the setup list in the Window menu to switch between different open setups.
Operating Manual 1303.6580.32-01
111
R&S® ZVL
GUI Reference
Trace Menu
Remote control:
MEMory:CAT? (returns a list of the loaded files).
Exit
Ends the analyzer session. The analyzer prompts you to save documents with unsaved changes.
This command is equivalent to the Close command on the application Control menu.
Trace Menu
The Trace menu provides all trace settings and the functions to select, modify and store different traces. In
addition the menu provides the marker, search and limit check functions.
Traces
A trace is a set of data points that can be displayed together in a diagram area. The trace settings specify
the mathematical operations used in order to obtain traces from the collected data. They can be divided
into several main groups:
•
Selection of the measured quantity (S-parameters, wave quantities, ratios, impedances,...)
•
Conversion into the appropriate display format and selection of the diagram type
•
Scaling of the diagram and selection of the traces associated to the same channel
•
Readout and search of particular values on the trace by means of markers
•
Limit check
The trace settings complement the definitions of the Channel menu. Each trace is assigned to a channel;
see Traces, Channels and Diagram Areas. The channel settings apply to all traces assigned to the
channel.
(No
direct
access via front
panel keys)
The Trace menu contains the following functions and submenus:
•
Trace -> stores traces to the memory and performs mathematical operations on traces.
•
Marker -> defines the sweep range, scales the diagram and introduces an electrical length offset
using the active marker.
•
Marker positions markers on a trace, configures their properties and selects the format of the
numerical readout.
Operating Manual 1303.6580.32-01
112
R&S® ZVL
GUI Reference
Trace Menu
•
Meas selects the quantity to be measured and displayed.
•
Format defines how the measured data is presented in the graphical display.
•
Scale defines how the current trace is presented in the diagram selected in the Format submenu.
•
Lines defines limits for measured values and activates the limit check.
Trace ->
The Trace -> submenu stores traces to the memory and performs mathematical operations on traces.
Refer to section Trace Types in the System Overview chapter to learn more about data traces,
memory traces, and mathematical traces.
•
Traces opens a submenu with functions to handle traces and diagram areas, and assign traces to
channels.
•
Data -> Mem stores the active data trace as a memory trace.
•
Math = Data/Mem activates the mathematical mode where the data trace is divided by the
memory trace.
•
Math = Data-Mem activates the mathematical mode where the memory trace is subtracted from
the data trace.
•
Show Data shows or hides the active data trace.
•
Show Mem shows or hides the active memory trace.
•
Trace Statistics opens a submenu to evaluate statistical and phase information of the trace.
•
Smoothing On activates the smoothing function for the active trace.
•
Smoothing Aperture... defines how many measurement points are averaged to smooth the trace.
•
Import/Export Data stores the active trace to a file or loads a memory trace from a file.
•
Shift Response Value... opens a dialog to define a user-correction to the measured values.
•
Shift Stimulus Value... shifts a memory trace in horizontal direction.
Operating Manual 1303.6580.32-01
113
R&S® ZVL
GUI Reference
Trace Menu
•
Max Hold On enables or disables the max hold (peak hold) function for the active trace.
•
Restart Hold restarts the max hold (peak hold) function for the active trace, discarding the old
maximum measurement results.
Many of the functions of the Trace Funct menu act on the active trace. Data traces and the associated
memory traces share many of their properties; see coupling of memory traces.
Data -> Mem
Stores the current state of the active trace as a memory trace. The memory trace is displayed in the active
diagram area with another color, and its properties are indicated in the trace list:
Memory traces are named Mem<n>[<Data_Trace>] where <n> counts all data and memory traces in the
active setup in chronological order, and <Data_Trace> is the name of the associated data trace. Trace
names can be changed in the Trace Manager dialog.
The exact function of Data -> Mem depends on the number of memory traces associated to the active
data trace:
•
If no memory trace is associated with the active trace, a new memory trace is generated.
•
If several memory traces are associated with the active trace, the current measurement data
overwrites the last generated or changed memory trace.
Coupling of data and memory traces
When a memory trace is generated from a data trace, it is displayed in the same diagram area and
inherits all channel and trace settings from the data trace.
The following display settings of a data trace and the associated memory traces are fully coupled.
Changing a property of one trace affects the properties of all other traces.
•
All settings in the Trace – Format menu
•
All settings in the Trace – Scale menu
Selection of the measured quantity (Trace – Meas) is possible for the data trace but disabled for the
memory traces.
Channel settings made for a memory trace act on the associated data trace. Some of the channel settings
for a data trace (e.g. the Stimulus range) also affect the display of the memory traces.
If the sweep type of a data trace is changed so that the stimulus ranges of the data traces
and the memory traces become incompatible, all coupled memory traces are removed from
the diagram area and deleted.
Remote control:
CALCulate<Chn>:MATH:MEMorize
Math = Data/Mem
Activates the mathematical mode where the active data trace is divided by the last generated memory
trace. The division is calculated on a point-to-point basis: Each measurement point of the active trace is
Operating Manual 1303.6580.32-01
114
R&S® ZVL
GUI Reference
Trace Menu
divided by the corresponding measurement point of the memory trace. The result of the division is a
mathematical trace and replaces the active data trace in the diagram area. The mathematical trace is
updated as the measurement goes on and the analyzer provides new active trace data.
This function is disabled unless a memory trace is coupled to the active data trace. Trace coupling
ensures that the two traces have the same number of points and that the mathematical trace Data/Mem is
well-defined.
Remote control:
CALCulate<Chn>:MATH[:EXPRession]:SDEFine
CALCulate<Chn>:MATH:STATe ON
<string>
Math = Data-Mem
Activates the mathematical mode where the last generated memory trace is subtracted from the active
data trace. The subtraction is calculated on a point-to-point basis: Each measurement point of the memory
trace is subtracted from the corresponding measurement point of the active trace. The result of the
subtraction is a mathematical trace and replaces the active data trace in the diagram area. The
mathematical trace is updated as the measurement goes on and the analyzer provides new active trace
data.
This function is disabled unless a memory trace is coupled to the active data trace. Trace coupling
ensures that the two traces have the same number of points and that the mathematical trace Data-Mem is
well-defined.
Remote control:
CALCulate<Chn>:MATH[:EXPRession]:SDEFine
CALCulate<Chn>:MATH:STATe ON
<string>
Show Data
Displays or hides the active data trace in the diagram area. If the mathematical option Math = Data/Mem
or Math = Data-Mem is active, then the active mathematical trace is displayed or hidden.
Remote control:
No command, display configuration only.
Show Mem
Displays or hides the active memory trace in the diagram area or the memory trace associated with the
active data trace.
If no memory trace is associated with the active data trace, Show Mem is disabled.
Remote control:
No command, display configuration only.
Traces
The Traces submenu provides functions to handle traces and diagram areas, and assign traces to
channels.
Operating Manual 1303.6580.32-01
115
R&S® ZVL
GUI Reference
Trace Menu
•
Select Trace opens a box to select an arbitrary trace of the active setup as the active trace
(disabled if only one trace is defined).
•
Add Trace creates a new trace in the current diagram area.
•
Add Trace + Diag. Area generates a new trace in a new diagram area.
•
Delete Trace deletes the active trace.
•
Assign Diag. Area assigns the active trace to another diagram area.
•
Assign Channel assigns the active trace to another channel.
•
Trace Manager opens a dialog to perform the previous actions systematically for all traces and
diagram areas.
Active and inactive traces
The screen can display several diagram areas simultaneously, each with a variable number of traces.
•
In an active diagram area one of these traces is the active trace. The active trace is highlighted in
the trace list on top of the diagram area (Trc 3 in the figure below):
•
If an inactive area is selected as the active area, the trace that was active last time when the area
was active will again become the active trace. It is highlighted in the trace list of the inactive
diagram area as shown for Trc6 in the figure below:
All settings in the Trace menu except the Trace Functions involving a memory trace apply to the active
trace in the active diagram area.
Operating Manual 1303.6580.32-01
116
R&S® ZVL
GUI Reference
Trace Menu
In remote control each channel can contain an active trace. The active remote traces and the
active manual trace are independent of each other; see Active Traces in Remote Control.
Select Trace
Opens a box to select an arbitrary trace of the active setup as the active trace. This function is disabled if
only one trace is defined.
Remote control:
The numeric suffix <Ch / Tr> appended to the first-level mnemonic
of a command selects a trace as active trace.
Add Trace
Creates a new trace in the current diagram area and assigns it to the current channel. The new trace is
created with the trace and channel settings of the former active trace but displayed with another color. The
former and the new active trace are superimposed but can be easily separated, e.g. by changing the
Reference Position.
The new trace is named Trc <n>, where <n> is the largest of all existing trace numbers plus one. The
name can be changed in the Trace Manager.
To create a new trace in a new channel, use Channel – Channel Select – Add Chan + Trace.
Remote control:
CALCulate<Ch>:PARameter:SDEFine <Trace Name>,
Parameter>
DISPlay:WINDow<Wnd>:TRACe<WndTr>:FEED
<
Meas
Add Trace + Diag. Area
Creates a new trace in a new diagram area and assigns the trace to the current channel. The new trace is
created with the trace and channel settings of the former active trace but displayed with another color.
The new trace is named Trc <n>, where <n> is the largest of all existing trace numbers plus one. The
name can be changed in the Trace Manager.
Remote control:
CALCulate<Ch>:PARameter:SDEFine
Parameter>
DISPlay:WINDow<Wnd>:STATe
Operating Manual 1303.6580.32-01
<Trace
Name>,
<
Meas
ON
117
R&S® ZVL
GUI Reference
Trace Menu
DISPlay:WINDow<Wnd>:TRACe<WndTr>:FEED
Delete Trace
Deletes the current trace and removes it from the diagram area. Delete Trace is disabled if the setup
contains only one trace: In manual control, each setup must contain at least one diagram area with one
channel and one trace.
To restore a trace that was unintentionally deleted, use Undo.
Remote control:
CALCulate<Ch>:PARameter:DELete <Trace Name>
Assign Diag Area
Assigns the active trace to another diagram area. A popup window offers a list of all areas available:
•
Selecting one of the existing area numbers assigns the active trace to the existing diagram area:
The active trace is removed from the previous area and displayed in the new diagram area.
•
Selecting New creates a new diagram area and assigns the active trace to the new area. The new
area is numbered <n>, where <n> is the largest of all existing area numbers plus one.
Assign Diag. Area is disabled if the current setup contains only one area. To create an
additional area, click Display – Area Select – New Diag. Area.
To go to another diagram area and activate the last active trace in this area, simply click a
point inside the new area.
Remote control:
DISPlay:WINDow<Wnd>:TRACe<WndTr>:FEED <Trace Name>
Assign Channel
Assigns the active trace to another channel. A popup window offers a list of all channels available:
Operating Manual 1303.6580.32-01
118
R&S® ZVL
GUI Reference
Trace Menu
•
Selecting one of the existing channel names assigns the current trace to the existing channel.
•
Selecting New creates a new channel and assigns the current trace to the new channel. The new
channel is named Ch <n>, where <n> is the largest of all existing channel numbers plus one. The
name can be changed in the Channel Manager.
Remote control:
CALCulate<Ch>:PARameter:SDEFine
Parameter>
<Trace
Name>,
<
Meas
Trace Manager
Opens a dialog to perform the actions in the Trace Select menu systematically for all traces and diagram
areas.
All existing traces of the current setup are listed in a table with several editable (white) or non-editable
(gray) columns. Below the table the Trace Manager provides the following buttons:
•
Add/Delete... opens a dialog to add a new trace or delete a trace.
•
Coupling opens a dialog to define coupling criteria (channel, scale) for all traces in the table.
•
Sort Table opens a dialog to change the order of the traces (rows) in the table.
Columns in the Trace Manager table
•
Name indicates the current trace name. The default names for new traces are Trc<n> where <n>
is a current number. Current numbers in the trace names are necessary to make automatic
assignments, e.g. decouple the channel settings in the Coupling dialog.
•
On indicates whether the trace is displayed on the screen (On) or invisible.
•
Meas indicates the measured parameter.
•
Type indicates whether the trace is a data trace (DAT), displaying the current measurement data,
or a memory trace (MEM).
•
Channel indicates the channel of each trace.
Operating Manual 1303.6580.32-01
119
R&S® ZVL
GUI Reference
Trace Menu
•
Area indicates the diagram area of each trace.
•
Scale shows which traces use common scaling and format settings.
Rules for trace names
The analyzer can define mathematical relations between different traces and calculate new mathematical
traces (User Def Math). The trace names are used as operands in the mathematical expressions and
must be distinguished from the mathematical operators +, -, *, /, (, ) etc. This places some restrictions on
the syntax of trace names:
•
The first character of a trace name can be either one of the upper case letters A to Z, one of the
lower case letters a to z, an underscore _ or a square bracket [ or ].
•
For all other characters of a trace name, the numbers 0 to 9 can be used in addition.
The analyzer does not accept illegal trace names. If an illegal name is specified, the input field in the
Trace Manager turns red.
Remote control:
CALCulate<Ch>:PARameter:SDEFine
Parameter>
<Trace
Name>,
<
Meas
Add/Delete
Opens a dialog to add a new trace or delete a trace.
•
Add creates a new trace and adds it to the list in the Trace Manager, assigning it to the channel
and diagram area selected in the drop-down lists. It is possible to create a New channel and/or
diagram area for the new trace.
•
Delete deletes the selected trace, removing it from the list in the Trace Manager and from the
screen. This button is disabled if the setup contains only one trace: In manual control, each setup
must contain at least one diagram area with one channel and one trace.
Remote control:
CALCulate<Ch>:PARameter:SDEFine <Trace Name>, < Meas
Parameter>
DISPlay:WINDow<Wnd>:TRACe<WndTr>:FEED
<Trace
Name>
CALCulate<Ch>:PARameter:DELete <Trace Name>
Coupling
Selects common channel or scale settings for all traces in the Trace Manager dialog.
Operating Manual 1303.6580.32-01
120
R&S® ZVL
GUI Reference
Trace Menu
The channel and scale coupling is set in two independent panels.
•
Decouple All assigns independent channel or scale settings to all traces in the Trace Manager. If
the channel and trace names include numbers, the trace with the lowest number is assigned to
the channel with the lowest number and so forth. Measurement or data traces and their
associated memory traces are assigned to the same channel.
•
Couple All assigns all traces to the channel or scale settings selected in the corresponding dropdown lists. All channel or scale settings except the selected ones are lost. The analyzer displays a
confirmation dialog box before deleting the unused channels.
Remote control:
–
Sort Table
Changes the order of the traces (table rows) in the Trace Manager dialog.
•
The drop-down list contains all trace properties that can provide the sorting criterion. The
properties correspond to the column headers in the Trace Manager.
•
The two radio buttons qualify whether the traces in the table are sorted in ascending or
descending order, according to the property selected in the pull-down list.
Remote control:
No command, display configuration only.
Trace Statistics
Opens a submenu to evaluate and display statistical and phase information of the entire trace or of a
specific evaluation range and calculate the x-dB compression point.
Operating Manual 1303.6580.32-01
121
R&S® ZVL
GUI Reference
Trace Menu
•
Min/Max/Pk-Pk displays or hides the essential statistical parameters of the trace in the selected
evaluation range.
•
Phase Delay/El Length displays or hides the phase delay and the electrical length of the trace in
the selected evaluation range (Eval Range...).
•
Mean/Std Dev displays or hides the arithmetic mean value and the standard deviation of the trace
in the selected evaluation range.
•
RMS displays or hides the RMS value of the trace in the selected evaluation range.
•
Eval Range... opens a dialog to define the range for the statistical and phase evaluation and for
the compression point measurement.
•
Compression Point starts the x-dB compression point evaluation
•
Define Compression Value... sets the compression level (x dB).
Statistical Evaluation
The Min/Max/Pk-Pk, Mean/Std Dev, and RMS commands in the Trace Statistics submenu display or hide
the maximum (Max), minimum (Min), the peak-to-peak value (Pk-Pk), arithmetic mean value (Mean), the
standard deviation (Std Dev), and the RMS value of all response values of the trace in the selected
evaluation range (Eval Range...).
Definition of statistical quantities
The statistical quantities are calculated from all response values in the selected evaluation range.
Suppose that the trace in the evaluation range contains n stimulus values xi and n corresponding
response values yi (measurement points).
Operating Manual 1303.6580.32-01
122
R&S® ZVL
GUI Reference
Trace Menu
•
Mean is the arithmetic mean value of all response values:
•
Std. Deviation is the standard deviation of all response values:
•
Max. and Min. are the largest and the smallest of all response values yi.
•
RMS is the root mean square (effective value) of all response values:
•
P-P is the peak-to-peak value and is equal to the difference Max. – Min.
The definitions given above apply to all linear, scalar trace formats. For a dB Mag trace, the Mean,
Std. Dev. and RMS are calculated before logarithmation.
Remote control:
CALCulate<Chn>:STATistics[:STATe]
CALCulate<Chn>:STATistics:RESult? MIN | MAX | PEAK2P | MEAN |
STDDev
|
RMS
CALCulate<Chn>:STATistics:MMPTpeak[:STATe]
CALCulate<Chn>:STATistics:MSTDev[:STATe]
CALCulate<Chn>:STATistics:RMS[:STATe]
Phase Delay/El. Length
Displays or hides the phase delay (Phs Dly) and the electrical length (El Len) of the trace in the selected
evaluation range (Eval Range...). The parameters are only available for trace formats that contain phase
information, i.e. for the formats Phase, Unwrapped Phase, and the polar diagram formats Polar, Smith,
Inverted Smith. Moreover, the sweep type must be a frequency sweep.
Definition of phase parameters
The phase parameters are obtained from an approximation to the derivative of the phase with respect to
frequency in the selected evaluation range.
•
Delay is the phase delay, which is an approximation to the group delay and calculated as follows:
,
where ∆f is the width of the evaluation range and ∆Φ is the corresponding phase change. See
also note on transmission and reflection parameters below.
•
EL is the electrical length, which is product of the phase delay times the speed of light in the
Operating Manual 1303.6580.32-01
123
R&S® ZVL
GUI Reference
Trace Menu
vacuum.
If no dispersion occurs the phase delay is equal to the group delay. For more information see
mathematical relations.
If a dispersive connector type (i.e. a waveguide; see Offset Model dialog) is assigned to a test port related
to a particular quantity, then the dispersion effects of the connector are taken into account for the
calculation of the phase delay and the electrical length.
To account for the propagation in both directions, the delay and the electrical length of a
reflection parameter is only half the delay and the electrical length of a transmission
parameter. The formula for PD above is for transmission parameters. See also introduction to
section Channel – Offset.
The phase parameters are available only if the evaluation range contains at least 3
measurement points.
The phase evaluation can cause misleading results if the evaluation range contains a
deg phase jump. The trace format Unwrapped Phase avoids this behavior.
Remote control:
CALCulate<Chn>:STATistics[:STATe]
CALCulate<Chn>:STATistics:RESult?
ELENgth
CALCulate<Chn>:STATistics:EPDelay[:STATe]
|
360
PDELay
Compression Point
Displays or hides all results related to the x-dB compression point of the trace, where x is the selected
compression value. To obtain a valid compression point results, a power sweep must be active, the trace
format must be dB Mag and either an S-parameter or a ratio must be measured.
Compression point
The x-dB compression point of an S-parameter or ratio is the stimulus signal level where the magnitude of
the measured quantity has dropped by x dB compared to its value at small stimulus signal levels (smallsignal value). As an approximation for the small-signal value, the analyzer uses the value at the start level
of the evaluation range (Eval Range...).
The compression point is a measure for the upper edge of the linearity range of a DUT. It is close to the
|bn| —>
highest input signal level for which the DUT shows a linear response (|an| —> x*|an|
Operating Manual 1303.6580.32-01
124
R&S® ZVL
GUI Reference
Trace Menu
x*|bn|, so that the magnitude of all S-parameters remains constant).
When Compression Point is activated, a marker labeled Cmp is placed to compression point with the
smallest stimulus level. Moreover the Trace Statistics info field shows the numerical results of the
compression point measurement:
•
Cmp In is the stimulus level at the compression point in units of dBm.
•
Cmp Out is the magnitude of the wave reflected or transmitted by the DUT. If an S-parameter Sij is
measured, then Cmp Out is the magnitude of the wave bi.
•
The ratio Cmp Out / Cmp In (in the example above: –14 dB) is equal to the magnitude of the
measured S-parameter or ratio at the compression point.
The info field shows invalid results ('---') if the wrong sweep type, trace format or measured quantity is
selected, or if the trace contains no x-dB compression points in the selected evaluation range.
Remote control:
CALCulate:STATistics:NLINear:COMP:RESult?
Define Compression Value
Opens the numeric entry bar to define the compression value x (in dB) for the compression point
measurement.
Remote control:
CALCulate:STATistics:NLINear:COMP:LEVel
Eval Range
Opens a dialog to define the range for the statistical and phase evaluation and for the x-dB compression
point measurement. The evaluation range is a continuous interval of the sweep variable.
It is possible to select, define and display up to ten different evaluation ranges for each setup. Full Span
means that the search range is equal to the sweep range. The statistical and phase evaluation and the
compression point measurement take into account all measurement points with stimulus values xi
between the Start and Stop value of the evaluation range:
Start
xi
Stop
Operating Manual 1303.6580.32-01
125
R&S® ZVL
GUI Reference
Trace Menu
The evaluation ranges are identical to the marker search ranges. For more information see
Search Range Dialog.
Remote control:
CALCulate<Chn>:STATistics:DOMain:USER
<numeric_value>
CALCulate<Chn>:STATistics:DOMain:USER:STARt <numeric_value>
CALCulate<Chn>:STATistics:DOMain:USER:STOP <numeric_value>
Smoothing On
Activates the smoothing function for the active trace, which may be a data or a memory trace. With active
smoothing function, each measurement point is replaced by the arithmetic mean value of all measurement
points located in a symmetric interval centered on the stimulus value. The width of the smoothing interval
is referred to as the Smoothing Aperture and can be adjusted according to the properties of the trace.
The sweep average is an alternative method of compensating for random effects on the trace
by averaging consecutive traces. Compared to smoothing, the sweep average requires a
longer measurement time but does not have the drawback of averaging out quick variations
of the measured values.
Remote control:
CALCulate<Chn>:SMOothing[:STATe] <Boolean>
Smoothing Aperture
Defines how many measurement points are averaged to smooth the trace if smoothing is switched on.
The Smoothing Aperture is entered as a percentage of the total sweep span.
An aperture of n % means that the smoothing interval for each sweep point i with stimulus value xi is equal
to [xi – span*n/200, xi + span*n/200], and that the result of i is replaced by the arithmetic mean value of all
measurement points in this interval. The average is calculated for every measurement point. Smoothing
does not significantly increase the measurement time.
Finding the appropriate aperture
A large smoothing aperture enhances the smoothing effect but may also average out quick variations of
the measured values and thus produce misleading results. To avoid errors, observe the following
recommendations.
•
Start with a small aperture and increase it only as long as you are certain that the trace is still
correctly reproduced.
•
As a general rule, the smoothing aperture should be small compared to the width of the observed
structures (e.g. the resonance peaks of a filter). If necessary, restrict the sweep range or switch
smoothing off to analyze narrow structures.
Remote control:
CALCulate<Chn>:SMOothing:APERture <numeric_value>
Operating Manual 1303.6580.32-01
126
R&S® ZVL
GUI Reference
Trace Menu
Import/Export Data
Stores one or several data or memory traces to a file or loads a memory trace from a file. Import or export
is selected from a submenu:
•
Import Data... calls up an Open File dialog to load a memory trace from a trace file.
•
Export Data... calls up a Save As... dialog to store data or memory traces to a trace file.
Import Data...
Calls up a dialog to load a memory trace from a trace file. Trace files are ASCII files with selectable file
format.
Operating Manual 1303.6580.32-01
127
R&S® ZVL
GUI Reference
Trace Menu
The loaded trace data is used to generate a memory trace which is coupled to the active data trace.
Import Data corresponds to a standard Open File dialog with an additional checkbox:
•
Import Data to New Mem qualifies whether the loaded data overwrite the active memory trace
(box unchecked, analogous to Data -> Mem) or whether they are used to generate a new memory
trace (box checked, analogous to Data -> New Mem).
Trace file import and import conditions
On loading data from a trace file, the analyzer displays a list box to select one of the traces stored in the
file. The example below shows a Touchstone (*.s2p) file, containing all four 2-port S-parameters; see
Trace File Formats.
Coupling between the imported memory trace and the active data trace implies that the stimulus values of
the imported data and of the active trace must be compatible. Compatibility means that the Sweep Type of
the two traces must match; the position and number of the sweep points do not have to be the same.
The analyzer checks for compatibility before importing data. The Select Parameter box remains empty if
the selected files contains no compatible data.
When a *.s1p file is opened the Select Parameter box indicates the 1-port (reflection)
Operating Manual 1303.6580.32-01
128
R&S® ZVL
GUI Reference
Trace Menu
parameter S11, irrespective of the actual S-parameter stored in the file.
To import a trace file (*.snp or *.csv) you can also use the Windows Explorer and simply
double-click the file or drag and drop the file into the NWA application. The imported data
generates a memory trace which is coupled to the active data trace.
Remote control:
MMEMory:LOAD:TRACe "<trc_name>","<file_name>"
Export Data...
Calls up a dialog to store data or memory traces to a trace file. Trace files are ASCII files with selectable
file format.
Data export can serve many purposes, e.g.:
•
To process and evaluate measurement data in an external application.
•
To store measurement data and re-import it in a future measurement session.
Export Complex Data corresponds to a standard Save As... dialog with an additional panel to specify the
export options. The export options are remembered when the dialog is closed. The Dec. Separator export
option is not available for Matlab (*.dat) file export. Touchstone files *.s<n>p contain either a single trace
(*.s1p) or the complete set of S-parameters of an n-port and use the point as Dec. Separator; see Trace
File Formats.
•
Output Format selects the format for the exported trace data. In the Real-Imag format,
each complex measurement value is represented by its real and imaginary part. It is
also possible to store the linear magnitude and phase (Lin Mag-Phase) or dB
magnitude and phase (dB Mag-Phase) of each value.
Operating Manual 1303.6580.32-01
129
R&S® ZVL
GUI Reference
Trace Menu
•
Content selects only the Active Trace or All Traces of (the) Active Channel (including
all data and memory traces) for data export to an ASCII (*csv) file.
•
Dec. Separator selects either the Point or the Comma (if needed to process the
exported data with an external application) as a separator for decimal numbers
exported to an ASCII (*.csv) file.
•
Ask to Overwrite activates a message box to be displayed before an older trace file with
the same file name and directory is overwritten.
Selecting an appropriate file format
Use a Touchstone file format to export a fixed number of S-parameter data traces to a file that can be
evaluated with applications such as Agilent's Microwave Design System (MDS) and Advanced Design
System (ADS). The data must be acquired in a frequency sweep.
•
*.s1p files are intended for a 1-port S-parameter (the reflection coefficient S11) but can be used as
well to store any single S-parameter. Note that any S-parameter will be labeled S11 in the file and
in the Select Parameter box.
•
*.s<n>p files (<n> = 2, 3,, 4) are intended for a complete set of <n>-port S-parameters. Data
export fails if the active channel does not contain the full set of <n>2 traces.
Use the ASCII (*.csv) format if you want to do one of the following:
•
Import the created file into a spreadsheet application such as Microsoft Excel.
•
Export an arbitrary number of traces, multiple traces with the same parameter or memory traces.
•
Use export options.
Use a the Matlab (*.dat) format if you want to import and process the trace data in Matlab.
For more information see Trace File Formats.
Remote control:
MMEMory:STORe:TRACe "<trc_name>","<file_name>"[,UNFormatted]
Operating Manual 1303.6580.32-01
130
R&S® ZVL
GUI Reference
Trace Menu
Trace File Formats
Trace files are ASCII files with selectable file format. The analyzer provides two classes of trace files:
•
Touchstone (*.s<n>p) files
•
ASCII (*.csv) files
•
Matlab (*.dat) files are ASCII files which can be imported and processed in Matlab.
The trace file formats complement each other; see Selecting an appropriate file format.
Touchstone files
All Touchstone files contain a header, a comment section, and the actual trace data:
# HZ S RI R
50.0000
! Rohde & Schwarz ZVL
! Measurement: S11
! 2003-07-07
!
60297750.000000
0.498113
80297000.000000
0.504888
...
-0.054290
-0.081229
The header consists of the following data elements:
# specifies beginning of header line (required at top of file). <Frequency unit> HZ / KHZ /
MHZ / GHZ allowed for imported files. The analyzer always uses HZ for exported data.
<Data file type> at present: S for S-parameter files.
<Data format> RI for Re/Im, MA for lin. Mag-Phase, DB for dB Mag-Phase. The data
format for export files can be selected in the Export Data dialog.
Operating Manual 1303.6580.32-01
131
R&S® ZVL
GUI Reference
Trace Menu
<Normalizing impedance> Impedance system in which the data was defined. The analyzer
uses 50.0000 Ω.
Comment lines start with the exclamation mark (!) and may contain any text used for documentation of the
trace data file. Any number of comment lines may be inserted before or after the header line.
The trace data depend on the number of ports <n> and the data format. For real and imaginary values
(data format = RI) the trace data for each stimulus frequency are arranged as follows:
•
1-port files (*.s1p)
•
Freq
•
S11 can be replaced by an any S-parameter, so the *s1p format is suitable for exporting an
arbitrary data trace representing an S-parameter.
•
2-port files (*.s2p)
•
Freq
•
(all values arranged in 1 line)
•
3-port files (*.s3p)
•
Freq
•
Re(S21) Im(S21)
Re(S22) Im(S22)
Re(S23) Im(S23)
•
Re(S31) Im(S31)
Re(S32) Im(S32)
Re(S33) Im(S33)
•
(values arranged in 3 lines)
•
4-port files (*.s4p)
•
Freq
•
Re(S21) Im(S21)
Re(S22) Im(S22)
Re(S23) Im(S23)
Re(S24) Im(S24)
•
Re(S31) Im(S31)
Re(S32) Im(S32)
Re(S33) Im(S33)
Re(S34) Im(S34)
•
Re(S41) Im(S41)
Re(S42) Im(S42)
Re(S43) Im(S43)
Re(S44) Im(S44)
•
(values arranged in 4 lines)
Re(S11) Im(S11)
Re(S11) Im(S11)
Re(S11) Im(S11)
Re(S11) Im(S11)
Re(S21) Im(S21)
Re(S12) Im(S12)
Re(S12) Im(S12)
Re(S12) Im(S12)
Re(S22) Im(S22)
Re(S13) Im(S13)
Re(S13) Im(S13)
Re(S14) Im(S14)
The stimulus frequencies are arranged in ascending order. If a lin. Mag-Phase (MA) or dB Mag-Phase
(DB) data format is selected the real and imaginary S-parameter values Re(Sij), Im(Sij) are replaced by lin
Mag(Sij), phase(Sij) or dB Mag(Sij), phase(Sij), respectively.
ASCII (*.csv) files
An ASCII file contains a header and the actual trace data:
freq;reTrc1_S21;imTrc1_S21;reMem2[Trc1]_S21;imMem2[Trc1]_S21;
300000.000000;0.000000;0.000000;0.000000;0.000000;
40499497.487437;0.000000;0.000000;0.000000;0.000000;
80698994.974874;0.494927;-0.065174;0.500833;-0.074866;
120898492.462312;0.497959;-0.111724;0.488029;-0.107375;
...
The header consists of the following data elements:
<Stimulus> stimulus variable: freq for Frequency sweep, power for Power sweep, time for
Time sweep, trigger for CW Mode sweep.
<reTrace1> first response value of first trace: re<Trace_Name>, mag<Trace_Name> or
db<Trace_Name> for output format Real-Imag, Lin. Mag-Phase or dB Mag-Phase,
respectively. The data format for export files can be selected in the Export Data dialog.
<imTrace1> second response value of first trace: im<Trace_Name> for output format
Real-Imag, ang<Trace_Name> for output formats Lin. Mag-Phase or dB Mag-Phase. The
data format for export files can be selected in the Export Data dialog.
Operating Manual 1303.6580.32-01
132
R&S® ZVL
GUI Reference
Trace Menu
<reTrace2> first response value of second trace: re<Trace_Name>, mag<Trace_Name>
or db<Trace_Name> for output format Real-Imag, Lin. Mag-Phase or dB Mag-Phase,
respectively. The data format for export files can be selected in the Export Data dialog.
<imTrace2>... second response value of first trace: im<Trace_Name> for output format
Real-Imag, ang<Trace_Name> for output formats Lin. Mag-Phase or dB Mag-Phase. The
data format for export files can be selected in the Export Data dialog. first response value
of second trace. HZ / KHZ / MHZ / GHZ allowed for imported files. The analyzer alway
uses HZ for exported data. second response value of first trace: im<Trace_Name> for
output format Re/Im, ang<Trace_Name> for output formats lin. Mag-Phase or dB MagPhase. The data format for export files can be selected in the Export Data dialog.
The trace data is arranged as described in the header. Different values are separated by semicolons. A
semicolon is also inserted before the end of each line.
The stimulus values are arranged in ascending order.
Shift Response Value...
Modifies all points of the active trace by means of an added and/or a multiplied complex constant. The
constant complex values are entered in the four input fields of the Shift Response Value dialog.
The units of the constants are adjusted to the format of the active trace. Setting all values to zero (Clear
All Values) restores the original trace.
Effect of the constants
The trace points are modified according to the formula displayed in the lower part of the dialog:
The formula and the different constants are adjusted to the different display formats of a trace:
•
The Magnitude factor shifts a dB Mag trace in vertical direction, leaving the phase of a complex
parameter unchanged.
•
The Phase factor rotates a trace that is displayed in a polar diagram around the origin, leaving the
magnitude unchanged.
•
The Real added constant shifts a real trace in vertical direction, leaving the imaginary part
unchanged.
•
The Imaginary added constant shifts a imaginary trace in vertical direction, leaving the real part
unchanged.
Operating Manual 1303.6580.32-01
133
R&S® ZVL
GUI Reference
Trace Menu
Shifting the trace by means of constant values is a simple case of trace mathematics. Use the
Define Math dialog to define more complicated mathematical operations.
Remote control:
DISPlay:WINDow<Wnd>:TRACe<WndTr>:Y:OFFset
<Phase>, <Real>, <Imag>]
Remote control:
CALCulate<Chn>:MATH:WUNit:STATe ON | OFF
<Magnitude>[,
Shift Stimulus Value...
Shifts the active trace in horizontal direction, leaving the positions of all markers unchanged.
The positive or negative offset value for the stimulus variable is entered into an input field.
The unit depends on the sweep type.
Shift Stimulus Value can be used in Cartesian as well as in polar diagrams. The visible effect
depends on the diagram type:
•
In Cartesian diagrams, the trace is shifted relative to the markers and the x-axis.
•
In polar diagrams, the trace is not affected, however, markers change their position.
Use a negative offset value to reset a shifted trace to its original position.
Remote control:
DISPlay:WINDow<Wnd>:TRACe<WndTr>:X:OFFset <numeric_value>
Max Hold On
Enables (if selected) or disables the max hold (peak hold) function for the active trace. With enabled max
hold function, the displayed trace shows the maximum values that the analyzer acquired since the start of
the measurement.
The max hold process can be restarted any time using Restart Hold. It is also restarted automatically
when the channel or trace settings are changed so that the previous measurement results are no longer
valid.
Remote control:
CALCulate<Chn>:PHOLd MAX | OFF
Restart Hold
Restarts the max hold (peak hold) function for the active trace, discarding the old maximum measurement
results. This softkey has no effect unless Max Hold On is active.
Operating Manual 1303.6580.32-01
134
R&S® ZVL
GUI Reference
Trace Menu
Remote control:
CALCulate<Chn>:PHOLd MAX | OFF
Marker ->
The Marker -> uses the active marker to define the sweep range, scale the diagram and introduce an
electrical length offset.
The functions in the upper section provide search functions to locate specific points on the trace.
•
Marker Search opens a submenu with all marker search functions.
•
Max Search sets the active marker to the absolute maximum in the search range.
•
Next Peak sets the active marker to the next maximum or minimum in the search range,
depending on the current search criterion.
The following functions use the stimulus value of the active marker to define the sweep range:
•
Start = Marker sets the beginning of the sweep range equal to the marker value.
•
Stop = Marker sets the end of the sweep range equal to the marker value.
•
Center = Marker sets the center of the sweep range equal to the marker value.
The following functions use the response value of the active marker to scale the y-axis of the diagram:
•
Ref. Value = Marker sets the reference value equal to the marker value.
•
Max = Marker sets the upper edge of the diagram equal to the marker value.
•
Min = Marker sets the lower edge of the diagram equal to the marker value.
•
Zero Delay at Marker corrects the measurement result by adding or subtracting a constant group
delay.
Next Peak
Sets the active marker to the next maximum or minimum in the search range, depending on the current
search criterion.
If a Max Search or a Bandpass Search is active, then the marker is set to the next maximum. The next
Operating Manual 1303.6580.32-01
135
R&S® ZVL
GUI Reference
Trace Menu
maximum is the maximum with the largest response value that is below the current marker response
value.
•
If a Min Search or a Bandstop Search is active, then the marker is set to the next minimum. The
next minimum is the minimum with the smallest response value that is above the current marker
response value.
By default the search range coincides with the sweep range. If the active trace contains no markers, a
marker Mkr 1 is created to indicate the search result. Next Peak is disabled while a Target Search is
active.
Remote control:
CALCulate<Chn>:MARKer<Mk>:FUNCtion:EXECute
CALCulate<Chn>:MARKer<Mk>:FUNCtion:RESult?
NPEak
Start = Marker
Sets the beginning (start) of the sweep range equal to the stimulus value of the active marker, leaving the
end (stop) value unchanged. The active marker appears at the left edge of the diagram.
Remote control:
CALCulate<Chn>:MARKer<Mk>:FUNCtion:STARt
Stop = Marker
Sets the end (stop) of the sweep range equal to the stimulus value of the active marker, leaving the
beginning (start) unchanged. The active marker appears at the right edge of the diagram.
Remote control:
CALCulate<Chn>:MARKer<Mk>:FUNCtion:STOP
Center = Marker
Sets the center of the sweep range equal to the stimulus value of the active marker, leaving the span
unchanged. The active marker appears in the center of the diagram.
Remote control:
CALCulate<Chn>:MARKer<Mk>:FUNCtion:CENTer
Ref Value = Marker
Sets the reference value equal to the response value of the active marker, leaving the values of the
vertical divisions (Scale Div.) unchanged.
Max = Marker
Sets the upper edge of the diagram equal to the response value of the active marker, leaving the values of
the vertical divisions (Scale Div.) unchanged.
Operating Manual 1303.6580.32-01
136
R&S® ZVL
GUI Reference
Trace Menu
Min = Marker
Sets the lower edge of the diagram equal to the response value of the active marker, leaving the values of
the vertical divisions (Scale Div.) unchanged.
Zero Delay at Marker
Corrects the measurement result by adding or subtracting a constant group delay. This function must be
applied to a trace which is displayed in group delay format. The trace is shifted in vertical direction so that
the delay at the marker position vanishes.
The delay represents the propagation time of the wave across the DUT, so this operation corresponds to a
electrical length compensation, i.e. to a shift of the reference plane by adding to or subtracting from the
test port a simulated lossless transmission line of variable length. The correction must be carried out on
the Delay trace but has an impact on all trace formats.
A standard application of Zero Delay at Marker is correction of the constant delay caused by
the interconnecting cables between the analyzer test ports and the DUT (line stretch).
The Zero Delay at Marker function modifies the Offset parameters and therefore influences
the entire channel.
Marker Search
Marker Search
The Marker Search menu uses markers to locate specific points on the trace.
Search functions
The search functions are tools for searching measurement data according to specific criteria. A search
consists of analyzing the measurement points of the current trace (or of a user-defined subrange termed
the Search Range) in order to find one of the following:
•
Absolute or relative (local) maxima and minima (minimum/maximum search).
•
Trace points with a specific response value (target search).
•
Trace segments with a shape that is characteristic for bandpass or bandstop filters (bandfilter
search).
When the search is activated, the active marker is moved to the (next) point that meets the search criteria.
If the trace contains no markers, a Mkr 1 is created and used for the search. The search result is
displayed in the marker info field. If no search result can be found, the marker remains at its original
position.
Some search functions can be activated repeatedly in order to find all possible search results. Moreover
the analyzer provides a Tracking mode where the search is repeated after each sweep.
Operating Manual 1303.6580.32-01
137
R&S® ZVL
GUI Reference
Trace Menu
•
Max Search sets the active marker to the absolute maximum in the search range.
•
Min Search sets the active marker to the absolute minimum in the search range.
•
Peak Search > sets the active marker to the next peak with higher stimulus value.
•
< Peak Search sets the active marker to the next peak with lower stimulus value.
•
Target opens a submenu to search for a specific value on the trace.
•
Bandfilter opens a submenu to search for trace segments with characteristic bandfilter shape and
calculate the filter parameters.
•
Marker Tracking causes the search to be repeated after each sweep.
•
Def Peak defines the criteria for the peak search.
•
Search Range... assigns a search range to each marker of the current trace.
The search functions are available in all Cartesian and polar diagram types (see Trace – Format). In
polar diagrams (Polar, Smith, Inverted Smith), where complex values are displayed, the magnitude of the
response values provides the search criterion.
Max Search
Sets the active marker to the absolute maximum in the search range, i.e. to the largest of all response
values. If a complex trace format (e.g. a polar diagram) is active, the marker is set to the measurement
point with the maximum magnitude.
By default the search range coincides with the sweep range. If the active trace contains no markers, a
marker Mkr 1 is created to indicate the search result.
Remote control:
CALCulate<Chn>:MARKer<Mk>:FUNCtion:EXECute
CALCulate<Chn>:MARKer<Mk>:FUNCtion:RESult?
MAXimum
Min Search
Sets the active marker to the absolute minimum in the search range, i.e. to the smallest of all response
values. If a complex trace format (e.g. a polar diagram) is active, the marker is set to the measurement
point with the minimum magnitude.
Operating Manual 1303.6580.32-01
138
R&S® ZVL
GUI Reference
Trace Menu
By default the search range coincides with the sweep range. If the active trace contains no markers, a
marker Mkr 1 is created to indicate the search result.
Remote control:
CALCulate<Chn>:MARKer<Mk>:FUNCtion:EXECute
CALCulate<Chn>:MARKer<Mk>:FUNCtion:RESult?
MINimum
Peak Search >
Sets the active marker to the next peak with higher stimulus value. If the active trace contains no markers,
a marker Mkr 1 created to indicate the search result. The peak criteria are defined via Define Peak.
Remote control:
CALCulate<Chn>:MARKer<Mk>:FUNCtion:EXECute
CALCulate<Chn>:MARKer<Mk>:FUNCtion:RESult?
RPEak
< Peak Search
Sets the active marker to the next peak with lower stimulus value. If the active trace contains no markers,
a marker Mkr 1 created to indicate the search result. The peak criteria are defined via Define Peak.
Remote control:
CALCulate<Chn>:MARKer<Mk>:FUNCtion:EXECute
CALCulate<Chn>:MARKer<Mk>:FUNCtion:RESult?
LPEak
Target
Opens a submenu to search for a specific value on the trace.
•
Target Search activates the search for the target value.
•
Target Search > activates the search for the target value to the right of the active marker.
•
< Target Search activates the search for the target value to the left of the active marker.
•
Def Value specifies the target value.
•
Search Range confines the search to a subrange of the sweep.
Operating Manual 1303.6580.32-01
139
R&S® ZVL
GUI Reference
Trace Menu
Target Search
Activates the search and sets the active marker to the defined target value. If the active trace contains no
markers, a marker Mkr 1 is created to indicate the search result.
If the target value occurs at several stimulus values, the marker is placed to the search result with the
smallest stimulus value. The other measurement points with the same target value can be located using
the Target Search > function.
If the target is not found (e.g. because the active trace doesn't contain the target value), then the active
marker is not moved away from its original position.
Remote control:
CALCulate<Chn>:MARKer<Mk>:FUNCtion:EXECute
CALCulate<Chn>:MARKer<Mk>:FUNCtion:RESult?
TARGet
Target Search >
Activates the search to the right of the active marker position and sets the active marker to the defined
target value. The target search range is between the active marker position and the end (Stop) of the
sweep range. If the active trace contains no markers, a marker Mkr 1 is created to indicate the search
result, and the target search range starts at the beginning (Start) of the sweep range.
If the target value occurs at several stimulus values, the marker is placed to the search result with the
smallest stimulus value. The other measurement points with the same target value can be located using
Target Search > repeatedly.
If the target is not found (e.g. because the active trace doesn't contain the target value), then the active
marker is not moved away from its original position.
Remote control:
CALCulate<Chn>:MARKer<Mk>:FUNCtion:EXECute
CALCulate<Chn>:MARKer<Mk>:FUNCtion:RESult?
RTARget
< Target Search
Activates the search to the left of the active marker position and sets the active marker to the defined
target value. The target search range is between the (Start) of the sweep range and the active marker
position. If the active trace contains no markers, a marker Mkr 1 is created to indicate the search result,
and the target search range starts at the end (Stop) of the sweep range.
If the target value occurs at several stimulus values, the marker is placed to the search result with the
smallest stimulus value. The other measurement points with the same target value can be located using
Target Search > repeatedly.
If the target is not found (e.g. because the active trace doesn't contain the target value), then the active
marker is not moved away from its original position.
Remote control:
CALCulate<Chn>:MARKer<Mk>:FUNCtion:EXECute
CALCulate<Chn>:MARKer<Mk>:FUNCtion:RESult?
LTARget
Def Value
Opens an dialog to select a marker for the target search and define the target value.
Operating Manual 1303.6580.32-01
140
R&S® ZVL
GUI Reference
Trace Menu
It is possible to define up to ten different target values for each trace and assign them to the markers no. 1
to 10. The input fields in the Target Search dialog are used to select the markers and define the
associated search ranges:
•
Marker selects one of the ten markers that can be assigned to the trace. If a selected
marker does not exist, it is created as soon as On is checked. A created marker is
displayed in the center of the search range.
•
Value selects the target value to be assigned to the selected marker. The target Value
is entered with the unit of the active trace.
Remote control:
CALCulate<Chn>:MARKer<Mk>:TARget
Search Range...
Opens the Search Range Dialog to confine the target search to a subrange of the sweep.
Bandfilter
Opens a submenu to search for trace segments with a bandpass or bandstop shape and determine
characteristic filter parameters.
Bandfilter search and filter parameters
Bandpass and bandstop regions can be described with the same parameter set:
•
A bandpass region contains a local maximum around which the magnitude of the trace falls off by
more than a specified x dB Bandwidth.
•
A bandstop region contains a local minimum around which the magnitude of the trace increases
by more than a specified x dB Bandwidth.
The analyzer locates bandpass and bandstop regions and determines their position (Center frequency)
and shape (Bandwidth, LBE, UBE, Quality factor Q; see Show Results). For a meaningful definition of the
x dB Bandwidth criterion, the trace format must be dB Mag.
Operating Manual 1303.6580.32-01
141
R&S® ZVL
GUI Reference
Trace Menu
•
Bandpass Search activates the search for a bandpass region in the active trace, starting at the
absolute maximum of the active trace within the search range.
•
Bandstop Search activates the search for a bandstop region in the active trace, starting at the
absolute minimum of the active trace within the search range.
•
Bandfilter Tracking causes the bandfilter search to be repeated after each sweep.
•
Level... sets the level defining the filter bandwidth.
•
Search Range... confines the search to a subrange of the sweep.
•
Search Result Off hides the display of the bandfilter parameters in the diagram area.
•
Bandpass Search Ref to Marker activates the search for a bandpass region in the active trace,
starting at the position of the active marker.
Bandfilter mode can be selected for a broad range of measured quantities (Trace – Measure),
provided that the display format is dB Mag. To obtain real filter parameters, the measured quantity
must be a transmission S-parameter and a frequency sweep must be performed. For other
quantities (e.g reflection parameters), the Bandfilter functions are still useful to analyze general
trace properties. In some display formats (e.g. Phase) the bandfilter search is disabled.
Bandpass Search
Activates the search for a bandpass region on the active trace and activates bandfilter Tracking. A
bandpass region is the tallest peak in the search range with a minimum excursion specified by means of
the x dB Bandwidth parameter.
When Bandpass Search is activated the analyzer uses (or creates) the four markers Mkr 1 to Mkr 4 to
locate the bandpass region:
Operating Manual 1303.6580.32-01
142
R&S® ZVL
GUI Reference
Trace Menu
•
Mkr 1 indicates the maximum of the peak.
•
Mkr 2 indicates the point on the left edge of the peak where the trace value is equal to the
maximum minus x dB Bandwidth.
•
Mkr 3 indicates the point on the right edge of the peak where the trace value is equal to the
maximum minus x dB Bandwidth.
•
Mkr 4 indicates the center of the peak, calculated as the arithmetic mean value of the LBE and
UBE positions.
For a symmetric peak, the positions of Max and Center coincide.
The band filter search results are displayed in the bandfilter info field.
To search for a bandpass region in the vicinity of the active marker, use Bandpass Search Ref to
Marker.
Remote control: CALCulate<Chn>:MARKer<Mk>:FUNCtion:BWIDth:MODE
CALCulate<Chn>:MARKer<Mk>:FUNCtion:EXECute BFILter
BPASs
Bandstop Search
Activates the search for a bandstop region on the active trace and activates bandfilter Tracking. A
bandstop region is the lowest peak (local minimum) in the search range with a minimum excursion that is
specified by means of the x dB Bandwidth parameter.
When Bandstop Search is activated the analyzer uses (or creates) the four markers Mkr 1 to Mkr 4 to
locate the bandstop region:
Operating Manual 1303.6580.32-01
143
R&S® ZVL
GUI Reference
Trace Menu
•
Mkr 1 indicates the minimum of the peak.
•
Mkr 2 indicates the point on the left edge of the peak where the trace value is equal to the
minimum plus x dB Bandwidth.
•
Mkr 3 indicates the point on the right edge of the peak where the trace value is equal to the
minimum plus x dB Bandwidth.
•
Mkr 4 indicates the center of the peak, calculated as the arithmetic mean value of the LBE and
UBE positions.
For a symmetric peak, the positions of Max and Center coincide.
The band filter search results are displayed in the bandfilter info field.
Remote control: CALCulate<Chn>:MARKer<Mk>:FUNCtion:BWIDth:MODE
CALCulate<Chn>:MARKer<Mk>:FUNCtion:EXECute BFILter
BSTOP
Bandfilter Tracking
Causes the bandfilter search to be repeated after each sweep: When tracking mode is active the markers
typically change their horizontal and their vertical positions as the measurement goes on.
Tracking for the different bandfilter search modes is enabled or disabled in a selection box. Selecting a
search mode for tracking also activates this mode.
Tracking is a toggle function: Selecting the function repeatedly switches the tracking mode on and off.
Remote control:
CALCulate<Chn>:MARKer<Mk>:FUNCtion:EXECute
CALCulate<Chn>:MARKer<Mk>:SEARch:TRACking
Operating Manual 1303.6580.32-01
BFILter
144
R&S® ZVL
GUI Reference
Trace Menu
Level
Opens the numeric entry bar for the minimum excursion of the bandpass and bandstop peaks.
•
A bandpass peak must fall off on both sides by the specified x dB Bandwidth to be considered a
valid peak.
•
A bandstop peak must increase on both sides by the specified x dB Bandwidth to be considered a
valid peak.
Remote control:
CALCulate<Chn>:MARKer<Mk>:BWIDth <Level>
Search Range...
Opens the Search Range Dialog to confine the bandfilter search to a subrange of the sweep.
It is possible to define and store up to ten different search ranges for each trace. The bandfilter search is
performed using the markers Mkr 1, ..., Mkr 4, irrespective of the selected search range.
•
Search Range Selects a search range for the bandfilter search. Full Span means that
the search range is equal to the sweep range. Besides, it is possible to store up to 10
customized search ranges.
•
Start defines the beginning of the search range. Start must be smaller than the Stop
value, otherwise the search will not be initiated.
•
Stop defines the end of the search range. Stop must be larger than the Start value,
otherwise the search will not be initiated.
•
Range Limit Lines On displays two vertical lines indicating the Start and the Stop value
of the current bandfilter search range in the diagram area. This function is enabled as
soon as one of the search ranges 1 to 10 is selected.
Search range properties
In contrast to the marker properties defined in the Marker and Search menus, the ten search ranges are
valid for the entire setup. This means that, once defined, each of them can be used for any trace in the
setup, irrespective of the channel that the trace belongs to.
The default search range of each new marker is Full Span. The analyzer provides greatest flexibility in
defining search ranges. In particular, two search ranges may overlap or even be identical. The search is
Operating Manual 1303.6580.32-01
145
R&S® ZVL
GUI Reference
Trace Menu
confined to the part of the search range that belongs to the sweep range.
The following example shows how search ranges can be used to search a trace for several bandpass
regions.
Remote
control:
CALCulate<Chn>:MARKer<Mk>:FUNCtion:DOMain:USER
CALCulate<Chn>:MARKer<Mk>:FUNCtion:DOMain:USER:STARt
CALCulate<Chn>:MARKer<Mk>:FUNCtion:DOMain:USER:STOP
Search Result Off
Hides the info field with the results of a bandpass or a bandstop search and disables bandfiter Tracking.
The info field is displayed again (and tracking re-enabled) when a new bandfilter search is performed.
Bandfilter parameters
The info field contains the following search results:
•
Bandwidth is the n-dB bandwidth of the bandpass/bandstop region, where n is the selected x dB
Bandwidth. The bandwidth is equal to the difference between the Upper Bandwidth Edge (UBE)
and the Lower Bandwidth Edge (LBE).
•
Center is the stimulus frequency where the trace reaches its absolute maximum (minimum) within
the bandpass (bandstop) region.
•
Lower Band Edge is the closest frequency below the center frequency where the trace is equal to
the center value minus n dB.
•
Upper Band Edge is the closest frequency above the center frequency where the trace is equal to
the center value minus n dB.
•
The Quality Factor is the ratio between the Center frequency and the 3-dB Bandwidth; it does not
depend on the selected x dB Bandwidth.
•
Loss is the loss of the filter at its center frequency and is equal to the response value of marker
Operating Manual 1303.6580.32-01
146
R&S® ZVL
GUI Reference
Trace Menu
no. 4. For an ideal bandpass filter the loss is zero (0 dB), for an ideal bandstop filter it is –
dB.
Remote CALCulate<Chn>:MARKer<Mk>:BWIDth?
control: CALCulate<Chn>:MARKer<Mk>SEARch:BFILter:RESult[:STATe]
Bandpass Search Ref to Marker
Activates the search for a bandpass region on the active trace and activates bandfilter Tracking, starting at
the position of the active marker. A bandpass region is the closest peak in the search range with a
minimum excursion specified by means of the x dB Bandwidth parameter.
In contrast to a Bandpass Search Ref to Max, the Bandpass Search Ref to Marker does not change the
position of the active markers. The band filter search results are displayed in the bandfilter info field.
To search for a bandstop region in the vicinity of the active marker, use Bandfilter Tracking –
Bandstop Search Ref to Marker.
Remote control: CALCulate<Chn>:MARKer<Mk>:FUNCtion:BWIDth:MODE BPRMarker
BSRMarker
CALCulate<Chn>:MARKer<Mk>:FUNCtion:EXECute BFILter
|
Def Peak
Opens a dialog to define the peak type to be searched for.
It is possible to select the peak type up to ten times for each trace and assign the selection to the markers
no. 1 to 10.
•
Marker Selects one of the ten markers that can be assigned to the trace. If a selected
marker does not exist, it is created as soon as On is checked. A created marker is
displayed in the center of the search range.
The radio buttons in the Peak Type panel offer the following alternative peak types:
•
•
Local Max activates the peak search for local maxima only. The response value at a
local maximum is larger than the values in the vicinity.
Local Min activates the peak search for local minima only. The response value at a
local minimum is smaller than the values in the vicinity.
Operating Manual 1303.6580.32-01
147
R&S® ZVL
GUI Reference
Trace Menu
•
Local Min or Max activates the peak search for both local maxima and minima.
Search Range
Opens the Search Range Dialog to confine the minimum/maximum search to a subrange of the sweep.
Search Range Dialog
Defines search ranges for the maximum/minimum or target search.
It is possible to define up to ten different search ranges for each setup and assign them to the markers no.
1 to 10. The input fields in the Search Range dialog are used to select the markers and define the
associated search ranges:
•
Marker Selects one of the ten markers that can be assigned to a trace in the current
setup. If a selected marker does not exist, it is created as soon as On is checked. A
created marker is displayed in the center of the search range.
•
Search Range Selects the search range to be assigned to the selected marker. Full
Span means that the search range is equal to the sweep range. Besides, it is possible
to store up to 10 customized search ranges.
•
Start defines the beginning of the search range. Start must be smaller than the Stop
value, otherwise the search will not be initiated.
•
Stop defines the end of the search range. Stop must be larger than the Start value,
otherwise the search will not be initiated.
•
Range Limit Lines On displays two vertical lines indicating the Start and the Stop value
of the current search range in the diagram area. This function is enabled as soon as
one of the search ranges 1 to 10 is selected.
Search range properties
In contrast to the marker properties defined in the Marker and Search menus, the ten search ranges are
valid for the entire setup. This means that, once defined, each of them can be assigned to any marker in
the setup, irrespective of the trace and channel that the marker belongs to.
The default search range of each new marker is Full Span. The analyzer provides the greatest flexibility in
Operating Manual 1303.6580.32-01
148
R&S® ZVL
GUI Reference
Trace Menu
defining search ranges. In particular, two search ranges may overlap or even be identical. The search is
confined to the part of the search range that belongs to the sweep range.
The following example shows how search ranges can be used to search a trace for several local maxima.
Use the paste marker list for convenient entry of Start and Stop values.
Remote
control:
CALCulate<Chn>:MARKer<Mk>:FUNCtion:DOMain:USER
CALCulate<Chn>:MARKer<Mk>:FUNCtion:DOMain:USER:STARt
CALCulate<Chn>:MARKer<Mk>:FUNCtion:DOMain:USER:STOP
Marker Tracking
Causes the active minimum/maximum or target search of the active marker to be repeated after each
sweep: When tracking mode is active the marker typically changes its horizontal and its vertical position
as the measurement goes on.
Tracking mode properties
The tracking mode is available for all search modes, i.e. for minimum/maximum search, target search and
bandfilter search. The Marker Tracking function in the Search submenu is valid for an active
minimum/maximum and target search; bandfilter tracking can be activated separately. Tracking is markerspecific but can be switched on for several markers simultaneously.
Switching between Max Search and Min Search does not affect the tracking mode.Tracking is switched off
though when one of the following actions is performed:
•
Redefinition of the active marker position by means of the functions in the Marker menu or dragand-drop of the active marker symbol.
•
Change of the active marker's search mode, e.g. from a minimum/maximum search to a target
search.
Tracking is a toggle function: Selecting the function repeatedly switches the tracking mode on and off.
Remote control:
CALCulate<Chn>:MARKer<Mk>:SEARch:TRACking
Operating Manual 1303.6580.32-01
149
R&S® ZVL
GUI Reference
Trace Menu
Marker
The functions in the Marker menu are used to position markers on a trace, configure their properties and
select the format of the numerical readout.
Markers
Markers are tools for selecting points on the trace and for numerical readout of measured data. A marker
is displayed with a symbol (a triangle, a crossbar or a line) on the trace, which may be a data trace or a
memory trace. At the same time, the coordinates are displayed in a marker info field or in a table. Each
marker can be defined as a normal marker, reference marker, delta marker or discrete marker.
Marker types
•
A (normal) marker(Mkr 1, Mkr 2, ...) determines the coordinates of a measurement point on the
trace. Up to 10 different normal markers can be assigned to a trace.
•
A reference marker(Ref) defines the reference value for all delta markers.
•
A delta marker(∆) indicates the coordinates relative to the reference marker.
•
The stimulus value of a discrete marker always coincides with a sweep point.
A special set of markers Mk1 to Mkr4 is provided for bandfilter search mode.
The most common tasks to be performed with markers can be achieved using the Marker menu functions:
•
Determine the coordinates of a measurement point on the trace. In polar diagrams where no xaxis is displayed, markers can be used to retrieve the stimulus value of specific points.
•
Determine the difference between two trace points or the relative measurement result (Delta
Mode).
•
Convert a complex measurement result into other formats.
Markers also play an important role in performing the following advanced tasks:
•
Change the sweep range and the diagram scale (Marker Funct.).
•
Search for specific points on the trace (Search).
Operating Manual 1303.6580.32-01
150
R&S® ZVL
GUI Reference
Trace Menu
The Marker menu contains the following functions:
•
Marker 1, 2, 3 creates the markers numbered 1, 2, and 3.
•
Ref Marker... creates the reference marker which is used to measure relative values and
distances.
•
Delta Mode activates the display of the active marker values relative to the reference marker.
•
Ref.Marker -> Marker places the reference marker to the position of the active marker.
•
All Mkrs Off removes all markers from all traces of the active setup.
•
Mkr Format defines an output format for the (complex) marker values.
•
More Mkrs opens a submenu to create the markers numbered 4 to 10.
•
Coupled Mkrs couples the markers on different traces.
•
Discrete Mkrs turns the active marker into a discrete marker and vice versa.
•
Mkr Properties... opens a dialog with extended marker settings.
•
Export Mkrs... exports the marker values to an ASCII file.
Toggle functions in the Marker menu
Some of the Marker functions toggle between two alternative states when they are pressed repeatedly:
•
Delta Mode switches the delta mode for the active marker on or off.
•
Coupled Mkrs activates or deactivates marker coupling.
•
Marker 1, ..., Marker 10 and Ref. Marker create a marker or remove it from the display. A removed
marker remembers its properties (stimulus value, format, delta mode, number) and will be
restored with these properties when Marker <n> or Ref. Marker is selected again. The marker
properties are definitely lost if the associated trace is deleted.
Markers are available for all diagram types (Trace – Format).
Operating Manual 1303.6580.32-01
151
R&S® ZVL
GUI Reference
Trace Menu
Marker 1, 2, 3
Creates the markers numbered 1, 2, and 3, respectively, and assigns them to the active trace (toggle
function). Marker 1/2/3 opens the numeric entry bar to define the marker position (Stimulus Mkr 1/2/3).
The default position is the center of the sweep range.
On closing the Stimulus Mkr 1/2/3 numeric entry bar a marker symbol (triangle) labeled Mkr <n> is
positioned on the trace and the marker coordinates are displayed in the Info Field.
Activating and moving markers
To select one of several markers as an active marker, do one of the following:
•
Click the marker symbol.
•
Click the marker line in the marker info field.
To change the position of the active marker on the trace use one of the following methods:
•
Drag-and-drop the marker symbol to the desired position.
•
Click the Marker <n> or Ref. Marker softkey to call up the entry bar for the new stimulus value.
•
Right-click the diagram area or select Mkr. Properties to call up the Marker Properties dialog and
select the new stimulus value.
•
Use the Search functions to place the marker to a specific point on the trace.
If the marker position is defined explicitly by entering a numeric value, the marker position
can be outside the sweep range. If it is just varied using the rollkey, the mouse or the cursor
keys, it always remains within the sweep range. If the position of a marker outside the sweep
range is varied, it is automatically moved to the start or stop value of the sweep range,
whichever is closer.
Remote control:
CALCulate<Chn>:MARKer<Mk>[:STATe]
CALCulate<Chn>:MARKer<Mk>:Y?
ON
Ref Marker
Creates a reference marker and assigns it to the active trace (toggle function). Ref Marker opens the
numeric entry bar to define the marker position (Stim. Ref.Mkr.). The default position is the center of the
sweep range.
On closing the Stimulus Ref Mkr numeric entry bar a marker symbol (triangle) labeled Ref is positioned on
the trace and a line indicating Ref plus the marker coordinates is inserted in the marker info field.
The reference marker defines the reference value for all markers that are in Delta Mode.
Remote control:
CALCulate<Chn>:MARKer<Mk>:REFerence[:STATe]
CALCulate<Chn>:MARKer<Mk>:REFerence:Y?
Operating Manual 1303.6580.32-01
ON
152
R&S® ZVL
GUI Reference
Trace Menu
Delta Mode
Converts the active marker to a delta marker so that its values are measured and indicated relative to the
reference marker (toggle function). A ∆ sign placed in front of the marker line indicates that the marker is
in Delta Mode.
The reference marker itself can not be set to delta mode but must be present when another marker is set
to delta mode. The analyzer takes into account these conditions when Delta Mode is selected:
•
If Delta Mode is selected while the reference marker is active, the marker in the info list after the
reference marker is activated and set to delta mode. If the current trace contains the reference
marker only, a new Mkr 1 is created and set to delta mode.
•
If Delta Mode is selected for a normal marker while the current trace contains no reference
marker, a reference marker is created.
Remote control:
CALCulate<Chn>:MARKer<Mk>:DELTa[:STATe] ON
Ref.Marker -> Marker
Places the reference marker to the position of the active marker. As a consequence, the active marker
takes the role of a reference marker.
Ref.Marker -> Marker is not active if the active marker is a reference marker.
Remote control:
–
All Mkrs Off
Removes all markers from all traces of the active setup. The removed markers remember their properties
(stimulus value, format, delta mode, number) when they are restored. The marker properties are definitely
lost if the associated trace is deleted.
Remote control:
CALCulate<Chn>:MARKer<Mk>:AOFF
Mkr Format
Opens a submenu to select an output format for the (complex) active marker value in the
marker info field. The default marker format is the format of the associated trace. The
current format is indicated with a !.
Operating Manual 1303.6580.32-01
153
R&S® ZVL
GUI Reference
Trace Menu
All marker formats are available irrespective of the measured quantity. The output values are calculated
by a simple conversion of a complex measurement result, where the marker format defines the conversion
rules. This flexibility in the calculation must be kept in mind when interpreting the results and physical units
displayed; see also Measured Quantities and Display Formats.
Short description of marker formats
The formats of the markers assigned to a trace are independent of each other and of the trace format
settings. The following table gives an overview on how a complex marker value z = x + jy is converted.
Marker Format
Description
Formula
dB Mag
Magnitude of z in dB
|z| = sqrt ( x2 + y2 )
dB Mag(z) = 20 * log|z| dB
Lin Mag
Magnitude of z, unconverted
|z| = sqrt ( x2 + y2 )
Phase
Phase of z
φ (z) = arctan (y/x)
Real
Real part of z
Re(z) = x
Imag
Imaginary part of z
Im(z) = y
SWR
(Voltage) Standing Wave Ratio
SWR = (1 + |z|) / (1 – |z|)
Delay
Group delay, neg. derivative of the
phase response*)
– d φ (z) / d ω
dB Mag and Phase
Magnitude of z in dB and phase in two
20 * log|z| dB
Operating Manual 1303.6580.32-01
154
R&S® ZVL
GUI Reference
Trace Menu
lines
arctan ( Im(z) / Re(z) )
Lin Mag and Phase
Magnitude of z (unconverted) and
phase in two lines
|z|
arctan ( Im(z) / Re(z) )
Real and Imag
Real and imaginary part of z in two
lines
x
y
Default (Trace)
Marker format identical with trace
format
–
R+jX
Unnormalized resistance and
reactance; L or C in three lines
(Smith diagram)
R
X
L or C**)
G+jB
Unnormalized conductance and
susceptance; L or C in three lines
(Inverted Smith diagram)
G
B
L or C**)
*) The delay aperture is defined in the Trace – Format menu.
**) The equivalent inductances or capacitances L or C are calculated from the imaginary part of the
impedance according to
Remote control:
CALCulate<Chn>:MARKer<Mk>:FORMat ...
More Mkrs
Opens a submenu to create the markers numbered 4 to 10. The markers are analogous to marker no. 1 to
3.
Remote control:
CALCulate<Chn>:MARKer<Mk>[:STATe] ON
Coupled Mkrs
Couples the markers of all traces in the active setup to the markers of the active trace (toggle function).
While marker coupling is active, the active trace markers assume the role of master markers; the other
markers behave as slave markers, following any change of position of the master marker.
Effects of marker coupling
The concept of marker coupling means that corresponding markers on different traces (i.e. markers with
the same number or reference markers) are positioned to the same stimulus values but keep their
independent format and type settings. When a trace with markers is selected as the active trace and
marker coupling is switched on, the following happens:
•
The active trace and all associated markers are left unchanged. The active trace markers become
the master markers of the setup.
•
Markers on the other traces which have no corresponding master marker are removed but
Operating Manual 1303.6580.32-01
155
R&S® ZVL
GUI Reference
Trace Menu
remember their properties and can be re-activated after the coupling is released.
•
The remaining markers on the other traces become slave markers and are moved to the position
of the corresponding master markers. "Missing" slave markers are created so that each trace has
the same number of markers placed at the same position.
•
If the position of a master marker is outside the sweep range of the slave trace, the slave marker
is displayed at the edge of the diagram. The marker info field indicates an invalid measurement
result:
While marker coupling is active, it is possible to:
•
Move a master marker and thus change the position of all corresponding slave markers.
•
Activate another trace in order to make the associated markers the new master markers.
Marker coupling makes sense only if the master and the slave traces use the same stimulus
variable. Channels with a different stimulus variable (sweep type) are not coupled.
Remote control:
CALCulate<Chn>:MARKer<Mk>:COUPled[:STATe] ON
Discrete Mkrs
Turns the active marker into a discrete marker and vice versa.
The stimulus value of a discrete marker always coincides with a sweep point. Use discrete
markers in order to avoid that the marker indicates an interpolated measurement value.
Remote control:
CALCulate<Chn>:MARKer<Mk>:MODE
Mkr Properties...
Opens a dialog to define the properties of all markers of the active trace.
Operating Manual 1303.6580.32-01
156
R&S® ZVL
GUI Reference
Trace Menu
In the left part the dialog contains four input fields and drop-down lists to select a marker and define the
basic properties of a selected marker which is switched on in the Mode panel.
•
Select Mkr. opens a drop-down list to select the Ref. Marker or one of the Marker 1, ...
10 that may be associated to the active trace.
•
Name defines a marker name which may exceed the length of the input box and
contain letters, numbers, blanks and special characters.
•
Stimulus defines the stimulus value (in Cartesian diagrams: the x-axis position) of the
marker.
•
Format defines the output format of the marker value.
The Mode panel contains check boxes to select properties that are related to the marker positions. All
properties can be combined.
•
Marker On displays the selected marker in the diagram and in the marker info field or
removes it. Marker configurations are only available while the marker is switched On.
A removed marker remembers its properties (stimulus value, format, delta mode,
number ...) when it is switched on again. The marker properties are definitely lost if
the associated trace is deleted.
•
Fixed Marker freezes thecurrent response value of the selected marker. The marker
can still be shifted horizontally but the vertical position remains fixed if the other
marker settings are changed. Markers must be inside the sweep range and have a
valid response value when they are fixed.
•
Delta Mode sets the selected marker to delta mode and displays its values relative to
the reference marker.
•
Discrete Mode means that a marker can be set to discrete sweep points only. If
discrete mode is switched off, the marker can be positioned on any point of the trace,
and its response values are obtained by interpolation.
•
All Mkrs Coupled couples the markers of all traces in the active setup to the markers of
the active trace; see Coupled Markers.
Style qualifies how the selected marker is displayed on the screen.
Show Info selects the marker info to be displayed at the Marker Position, in the marker info field or in a
Operating Manual 1303.6580.32-01
157
R&S® ZVL
GUI Reference
Trace Menu
separate Table below the diagram area. The display options may be selected simultaneously or all
switched off. The table provides more information than the marker info field:
Remote control:
CALCulate<Chn>:MARKer<Mk>[:STATe]
CALCulate<Chn>:MARKer<Mk>:TYPE
NORMal
CALCulate<Chn>:MARKer<Mk>:DELTa[:STATe]
CALCulate<Chn>:MARKer<Mk>:MODE CONTinuous
CALCulate<Chn>:MARKer<Mk>:COUPled[:STATe] ON
|
|
ON
FIXed
ON
DISCrete
Export Mkrs...
Calls up a Save As... dialog to store the current marker values to a marker file.
The analyzer uses a simple ASCII format to export marker values. By default, the marker file extension is
*.txt. The file contains all traces in the active setup together with their names and measured quantities.
Below each trace, the file shows a list of all markers with their names, stimulus and response values.
The following example of a marker file describes a setup with two traces Trc1 and its memory trace. Trc1
has no markers assigned, the memory trace has four markers named Mkr 1, ..., Mkr 4.
Remote control:
MMEMory:STORe:MARKer "file_name"
Meas
The Measure submenu selects the quantity to be measured and displayed.
Operating Manual 1303.6580.32-01
158
R&S® ZVL
GUI Reference
Trace Menu
•
S11, S12, S21, S22 select the four elements of the standard 2-port scattering matrix (Sparameters).
•
Impedance opens a submenu to convert reflection S-parameters into matched-circuit impedances
(converted Z-parameters).
•
Admittance opens a submenu to convert reflection S-parameters into matched-circuit admittances
(converted Y-parameters).
•
Stability Factor selects one of the three factors K, µ1 or µ2 to assess the stability of linear circuits
(e.g. amplifiers).
Port assignments of the DUT and the analyzer
S-parameters S<out>< in> characterize the Device Under Test, so the indices <out> and < in> denote the
output and input ports of the DUT. Analogously the waves a1 and a2 are referred to as incident waves, b1
and b2 to as outgoing waves.
The analyzer measures the waves a1, b1, ... at its own test ports in order to obtain S-parameters, ratios
and other derived quantities. The test ports of the analyzer are numbered, so it is convenient to use them
as a reference, defining port number n of the DUT as the port connected to test port n of the analyzer.
With this convention the waves an and bn have the following meaning:
•
an is the wave transmitted at test port no. n of the analyzer (stimulus signal) and fed to port
number n of the DUT (incident wave).
•
bn is the wave transmitted at port number n of the DUT (response signal) and received at test port
no. n of the analyzer (received wave).
The analyzer offers various diagrams and display formats to visualize the results. The
analyzer places no restriction on the formats that are available for each measured quantity.
However, to keep the interpretation simple, it is recommended to select an appropriate
display format; see Trace - Format.
S11, S12, S21, S22
Select one of the four elements of the standard 2-port scattering matrix (S-parameters).
The S-parameters are the basic measured quantities of a network analyzer. They describe how the DUT
modifies a signal that is transmitted or reflected in forward or reverse direction. S-parameters are
expressed as S<out>< in>, where <out> and <in> denote the output and input port numbers of the DUT.
A full 2-port S-parameter measurement involves 2 stages (referred to as partial measurements) with
Operating Manual 1303.6580.32-01
159
R&S® ZVL
GUI Reference
Trace Menu
interchanged drive and receive ports. The analyzer automatically switches the internal power sources and
the receivers to obtain the desired S-parameters.
Remote control:
CALCulate<Ch>:PARameter:MEASure "<Trace_Name>", "S11" |
"S12"
|
"S21"
|
"S22"
[SENSe<Chn>:]FUNCtion[:ON] "...:POWer:S<11 | 12 | 21 | 22>"
Create new trace and select name and measurement
parameter:
CALCulate<Ch>:PARameter:SDEFine "<Trace_Name>", "S11" | "S12"
| "S21" | "S22"
Impedance
The Impedance submenu contains the functions to convert S-parameters into matched-circuit
impedances. The matched-circuit impedances describe the impedances of a DUT that is terminated at its
outputs with the reference impedance Z0.
Z <– S11, Z <– S12, Z <– S21, Z<– S22 select the forward and reverse matched-circuit impedances of a
2-port DUT.
Z <– S11, Z <– S12, Z <– S21, Z <– S22
Selects the 2-port matched-circuit, converted impedances. The parameters describe the impedances of a
2-port DUT, obtained in forward and reverse transmission and reflection measurements:
•
Z11 is the input impedance of a 2-port DUT that is terminated at its output with the reference
impedance Z0 (matched-circuit impedance measured in a forward reflection measurement).
•
Z22 is the output impedance of a 2-port DUT that is terminated at its input with the reference
impedance Z0 (matched-circuit impedance measured in a reverse reflection measurement).
•
Z12 and Z21 denote the forward and reverse transfer impedances, respectively.
Use the Smith chart to obtain an alternative, graphical representation of the converted
impedances in a reflection measurement.
Remote control:
CALCulate<Ch>:PARameter:MEASure "<Trace_Name>", "Z-S11" | "ZS12"
|
"Z-S21"
|
"Z-S22"
Operating Manual 1303.6580.32-01
160
R&S® ZVL
GUI Reference
Trace Menu
[SENSe<Chn>:]FUNCtion[:ON] "...:POWer:Z<11 | 12 | 21 | 22>"
Create new trace and select name and measurement
parameter:
CALCulate<Ch>:PARameter:SDEFine "<Trace_Name>", "Z-S11" | "ZS12" | "Z-S21" | "Z-S22"
Admittance
The Admittance submenu contains the functions to convert reflection S-parameters into matched-circuit
admittances. The matched-circuit admittances describe the admittances of a DUT that is terminated at its
outputs with the reference impedance Z0.
Y <– S11, Y <– S12, Y <– S21, Y <– S22 select the forward or reverse matched-circuit admittances of a 2port DUT.
Y <– S11, Y <– S12, Y <– S21, Y <– S22
Selects the 2-port converted matched-circuit admittance parameters. The parameters describe the
admittances of a 2-port DUT, obtained in forward and reverse transmission and reflection measurements:
Operating Manual 1303.6580.32-01
161
R&S® ZVL
GUI Reference
Trace Menu
•
Y11 is the input admittance of a 2-port DUT that is terminated at its output with the reference
impedance Z0 (matched -circuit admittance measured in a forward reflection measurement).
•
Y22 is the output admittance of a 2-port DUT that is terminated at its input with the reference
impedance Z0 (matched -circuit admittance measured in a reverse reflection measurement).
•
Y12 and Y21 denote the forward and reverse transfer admittances, respectively.
Use the Inverted Smith chart to obtain an alternative, graphical representation of the
converted admittances in a reflection measurement.
Remote control:
CALCulate<Ch>:PARameter:MEASure "<Trace_Name>", "Y-S11" |
"Y-S12"
|
"Y-S21"
|
"Y-S22"
[SENSe<Chn>:]FUNCtion[:ON] "...:POWer:Y<11 | 12 | 21 | 22>"
Create new trace and select name and measurement
parameter:
CALCulate<Ch>:PARameter:SDEFine "<Trace_Name>", "Y-S11" | "YS12" | "Y-S21" | "Y-S22"
Stability Factors
The Stabilty Factors submenu selects stability factors to be measured and displayed.
The three two port stability factors K, µ1 or µ2 are available.
Definition of stability factors and stability criteria
The stability factors K, µ1 and µ2 are real functions of the (complex) S-parameters, defined as follows:
Operating Manual 1303.6580.32-01
162
R&S® ZVL
GUI Reference
Trace Menu
where
denotes the complex conjugate of S.
Stability factors are calculated as functions of the frequency or another stimulus parameter. They provide
criteria for linear stability of two-ports such as amplifiers. A linear circuit is said to be unconditionally stable
if no combination of passive source or load can cause the circuit to oscillate.
The K-factor provides a necessary condition for unconditional stability: A circuit is unconditionally stable if
K>1 and an additional condition is met. The additional condition can be tested by means of the stability
factors µ1 and µ2.
The µ1 and µ2 factors both provide a necessary and sufficient condition for unconditional stability: The
conditions µ1>1 or µ2>1 are both equivalent to unconditional stability. This means that µ1 and µ2 provide
direct insight into the degree of stability or potential instability of linear circuits.
References: Marion Lee Edwards and Jeffrey H. Sinsky, "A New Criterion for Linear 2-Port Stability Using
a Single Geometrically Derived Parameter", IEEE Trans. MTT, vol. 40, No. 12, pp. 2303-2311, Dec. 1992.
Remote control:
CALCulate<Ch>:PARameter:MEASure "<Trace_Name>", "KFAC21" |
"MUF121"
|
"MUF221"
|
...
[SENSe<Chn>:]FUNCtion[:ON] "...:POWer:KFACtor | MUFactor1 |
MUFactor2"
Create new trace and select name and measurement parameter:
CALCulate<Ch>:PARameter:SDEFine "<Trace_Name>", "SY11" |
"SY12" | "SY21" | "SY22"
Format
The Format submenu defines how the measured data is presented in the graphical display.
Operating Manual 1303.6580.32-01
163
R&S® ZVL
GUI Reference
Trace Menu
•
dB Mag selects a Cartesian diagram with a logarithmic scale of the vertical axis to display the
magnitude of a complex measured quantity.
•
Phase selects a Cartesian diagram with a linear vertical axis to display the phase of a complex
measured quantity in the range between –180 degrees and +180 degrees.
•
Smith selects a Smith diagram to display an S-parameter or ratio.
•
Polar selects a polar diagram to display an S-parameter or ratio.
•
Group Delay calculates the group delay from an S-parameter or ratio and displays it in a
Cartesian diagram.
•
Aperture sets a delay aperture for the delay calculation.
•
SWR calculates the Standing Wave Ratio from the measured reflection S-parameters and
displays it in a Cartesian diagram.
•
Lin Mag selects a Cartesian diagram with a linear scale of the vertical axis to display the
magnitude of the measured quantity.
•
Real selects a Cartesian diagram to display the real part of a complex measured quantity.
•
Imag selects a Cartesian diagram to display the imaginary part of a complex measured quantity.
•
Inv Smith selects an inverted Smith diagram to display an S-parameter or ratio.
•
Unwrapped Phase selects a Cartesian diagram with a linear vertical axis to display the phase of
the measured quantity in an arbitrary phase range.
The Format settings are closely related to the settings in the Scale submenu and in the Display menu. All
of them have an influence on the way the analyzer presents data on the screen.
The analyzer allows arbitrary combinations of display formats and measured quantities
(Trace – Measure). Nevertheless, in order to extract useful information from the data, it is
important to select a display format which is appropriate to the analysis of a particular
measured quantity; see Measured Quantities and Display Formats.
An extended range of formats is available for markers. To convert any point on a trace,
create a marker and select the appropriate marker format. Marker and trace formats can be
Operating Manual 1303.6580.32-01
164
R&S® ZVL
GUI Reference
Trace Menu
applied independently.
dB Mag
Selects a Cartesian diagram with a logarithmic scale of the vertical axis to display the magnitude of the
complex measured quantity.
Properties: The stimulus variable appears on the horizontal axis, scaled linearly. The magnitude of the
complex quantity C, i.e. |C| = sqrt ( Re(C)2 + Im(C)2 ), appears on the vertical axis, scaled in dB. The
decibel conversion is calculated according to dB Mag(C) = 20 * log(|C|) dB.
Application: dB Mag is the default format for the complex, dimensionless S-parameters. The dB-scale is
the natural scale for measurements related to power ratios (insertion loss, gain etc.).
Alternative Formats
The magnitude of each complex quantity can be displayed on a linear scale. It is possible to view the real
and imaginary parts instead of the magnitude and phase. Both the magnitude and phase are displayed in
the polar diagram.
Remote control:
CALCulate<Chn>:FORMat MLOGarithmic
Phase
Selects a Cartesian diagram with a linear vertical axis to display the phase of a complex measured
quantity in the range between –180 degrees and +180 degrees.
Properties: The stimulus variable appears on the horizontal axis, scaled linearly. The phase of the
complex quantity C, i.e. φ (C) = arctan ( Im(C) / Re(C) ), appears on the vertical axis. φ (C) is measured
relative to the phase at the start of the sweep (reference phase = 0°). If φ (C) exceeds +180° the curve
jumps by –360°; if it falls below –180°, the trace jumps by +360°. The result is a trace with a typical
sawtooth shape. The alternative Phase Unwrapped format avoids this behavior.
Application: Phase measurements, e.g. phase distortion, deviation from linearity.
Alternative Formats:
The magnitude of each complex quantity can be displayed on a linear scale or on a logarithmic scale. It is
possible to view the real and imaginary parts instead of the magnitude and phase. Both the magnitude
and phase are displayed in the polar diagram. As an alternative to direct phase measurements, the
analyzer provides the derivative of the phase response for a frequency sweep (Delay).
Remote control:
CALCulate<Chn>:FORMat PHASe
Smith
Selects a Smith chart to display a complex quantity, primarily a reflection S-parameter.
Properties: The Smith chart is a circular diagram obtained by mapping the positive complex semi-plane
into a unit circle. Points with the same resistance are located on circles, points with the same reactance
produce arcs. If the measured quantity is a complex reflection coefficient (S11, S22 etc.), then the unit
Operating Manual 1303.6580.32-01
165
R&S® ZVL
GUI Reference
Trace Menu
Smith chart represents the normalized impedance. In contrast to the polar diagram, the scaling of the
diagram is not linear.
Application: Reflection measurements, see application example.
The axis for the sweep variable is lost in Smith charts but the marker functions easily provide
the stimulus value of any measurement point. dB values for the magnitude and other
conversions can be obtained by means of the Marker Format functions.
Remote control:
CALCulate<Chn>:FORMat SMITh
Polar
Selects a polar diagram to display a complex quantity, primarily an S-parameter or ratio.
Properties: The polar diagram shows the measured data (response values) in the complex plane with a
horizontal real axis and a vertical imaginary axis. The magnitude of a complex value is determined by its
distance from the center, its phase is given by the angle from the positive horizontal axis. In contrast to the
Smith chart, the scaling of the axes is linear.
Application: Reflection or transmission measurements, see application example.
The axis for the sweep variable is lost in polar diagrams but the marker functions easily
provide the stimulus value of any measurement point. dB values for the magnitude and other
conversions can be obtained by means of the Marker Format functions.
Remote control:
CALCulate<Chn>:FORMat POLar
Group Delay
Calculates the (group) delay from the measured quantity (primarily: from a transmission S-parameter) and
displays it in a Cartesian diagram.
Properties: The group delay τg represents the propagation time of wave through a device. τg is a real
quantity and is calculated as the negative of the derivative of its phase response. A non-dispersive DUT
shows a linear phase response, which produces a constant delay (a constant ratio of phase difference to
frequency difference).
Mathematical relations: Delay, Aperture, Electrical Length
The group delay is defined as:
where
φrad/deg = Phase response in radians or degrees
ω = Frequency/angular velocity in radians/s
f = Frequency in Hz
Operating Manual 1303.6580.32-01
166
R&S® ZVL
GUI Reference
Trace Menu
In practice, the analyzer calculates an approximation to the derivative of the phase response, taking a
small frequency interval ∆f and determining the corresponding phase change ∆φ. The delay is thus
computed as:
The aperture ∆f must be adjusted to the conditions of the measurement.
If the delay is constant over the considered frequency range (non-dispersive DUT, e.g. a cable), then τg
and τg,meas are identical and
where ∆t is the propagation time of the wave across the DUT, which often can be expressed in terms of its
mechanical length Lmech, the permittivity ε, and the velocity of light c. The product of Lmech. sqrt(ε) is termed
the electrical length of the DUT and is always larger or equal than the mechanical length (ε > 1 for all
dielectrics and ε = 1 for the vacuum).
Application: Transmission measurements, especially with the purpose of investigating deviations from
linear phase response and phase distortions. To obtain the delay a frequency sweep must be active.
The cables connecting the analyzer test ports to the DUT introduce an unwanted delay,
which often can be assumed to be constant. Use the Zero Delay at Marker function, define a
numeric length Offset or use the Auto Length function to mathematically compensate for this
effect in the measurement results. To compensate for a frequency-dependent delay in the
test setup, a system error correction is required.
Remote control:
CALCulate<Chn>:FORMat DELay
Aperture
Sets a sets a delay aperture for the delay calculation. The aperture ∆f is entered as an integer number of
Aperture Steps:
The analyzer calculates the aperture from the sweep points of the current frequency sweep.
Properties: The delay at each sweep point is computed as:
where the aperture ∆f is a finite frequency interval around the sweep point fo and the analyzer measures
the corresponding phase change ∆φ.
Operating Manual 1303.6580.32-01
167
R&S® ZVL
GUI Reference
Trace Menu
Calculation of ∆f and ∆φ
With a given number of aperture steps n the delay at sweep point no. m is calculated as follows:
•
If n is even (n = 2k), then ∆f (m) = f (n+k) – f (n–k) and ∆φ(m)=∆φ (n+k) – ∆φ (n–k).
•
If n is odd (n = 2k+1), then ∆f (m) = f (n+k) – f (n–k–1) and ∆φ(m)=∆φ (n+k) – ∆φ (n–k–1).
It may be noted that the delay calculation is based on the already measured sweep points and does not
slow down the measurement.
∆f is constant over the entire sweep range, if the sweep type is a Lin. Frequency sweep. For Log.
Frequency and Segmented Frequency sweeps, it varies with the sweep point number m.
Application The aperture must be adjusted to the conditions of the measurement. A small aperture
increases the noise in the group delay; a large aperture tends to minimize the noise effects, but at the
expense of frequency resolution. Phase perturbations which are narrower in frequency than the aperture
tend to be smeared over and can not be measured.
SWR
Calculates the Standing Wave Ratio (SWR) from the measured quantity (primarily: from a reflection Sparameter) and displays it in a Cartesian diagram.
Properties: The SWR (or Voltage Standing Wave Ratio, VSWR) is a measure of the power
reflected at the input of the DUT. It is calculated from the magnitude of the reflection
coefficients Sii (where i denotes the port number of the DUT) according to:
The superposition of the incident and the reflected wave on the transmission line connecting
Operating Manual 1303.6580.32-01
168
R&S® ZVL
GUI Reference
Trace Menu
the analyzer and the DUT causes an interference pattern with variable envelope voltage. The
SWR is the ratio of the maximum voltage to the minimum envelope voltage along the line.
Interpretation of the SWR
The superposition of the incident wave I and the reflected wave R on the transmission line connecting the
analyzer and the DUT causes an interference pattern with variable envelope voltage. The SWR is the ratio
of the maximum voltage to the minimum envelope voltage along the line:
SWR = VMax/VMin = (|VI| + |VR|) / (|VI| – |VR|) = (1 + |Sii|) / (1 – |Sii|)
Application: Reflection measurements with conversion of the complex S-parameter to a
real SWR.
Remote control:
CALCulate<Chn>:FORMat SWR
Lin Mag
Selects a Cartesian diagram with a linear vertical axis scale to display the magnitude of the measured
quantity.
Properties: The stimulus variable appears on the horizontal axis, scaled linearly. The magnitude of the
complex quantity C, i.e. |C| = sqrt ( Re(C)2 + Im(C)2 ), appears on the vertical axis, also scaled linearly.
Application: Real measurement data (i.e. the Stability Factors, DC Input 1/2, and the PAE) are always
displayed in a Lin Mag diagram.
Alternative Formats
The magnitude of each complex quantity can be displayed on a logarithmic scale. It is possible to view the
real and imaginary parts instead of the magnitude and phase.
Remote control:
CALCulate<Chn>:FORMat MLINear
Real
Selects a Cartesian diagram to display the real part of a complex measured quantity.
Properties: The stimulus variable appears on the horizontal axis, scaled linearly. The real part Re(C) of
the complex quantity C = Re(C) + j Im(C), appears on the vertical axis, also scaled linearly.
Application: The real part of an impedance corresponds to its resistive portion.
Alternative Formats
It is possible to view the magnitude and phase of a complex quantity instead of the real and imaginary
part. The magnitude can be displayed on a linear scale or on a logarithmic scale. Both the real and
imaginary parts are displayed in the polar diagram.
Remote control:
CALCulate<Chn>:FORMat REAL
Operating Manual 1303.6580.32-01
169
R&S® ZVL
GUI Reference
Trace Menu
Imag
Selects a Cartesian diagram to display the imaginary part of a complex measured quantity.
Properties: The stimulus variable appears on the horizontal axis, scaled linearly. The imaginary part
Im(C) of the complex quantity C = Re(C) + j Im(C), appears on the vertical axis, also scaled linearly.
Application: The imaginary part of an impedance corresponds to its reactive portion. Positive (negative)
values represent inductive (capacitive) reactance.
Alternative Formats
It is possible to view the magnitude and phase of a complex quantity instead of the real and imaginary
part. The magnitude can be displayed on a linear scale or on a logarithmic scale. Both the real and
imaginary parts are displayed in the polar diagram.
Remote control:
CALCulate<Chn>:FORMat IMAGinary
Inv Smith
Selects an inverted Smith chart to display a complex quantity, primarily a reflection S-parameter.
Properties: The Inverted Smith chart is a circular diagram obtained by mapping the positive complex
semi-plane into a unit circle. If the measured quantity is a complex reflection coefficient (S11, S22 etc.), then
the unit Inverted Smith chart represents the normalized admittance. In contrast to the polar diagram, the
scaling of the diagram is not linear.
Application: Reflection measurements, see application example.
The axis for the sweep variable is lost in Smith charts but the marker functions easily provide
the stimulus value of any measurement point. dB values for the magnitude and other
conversions can be obtained by means of the Marker Format functions.
Remote control:
CALCulate<Chn>:FORMat ISMith
Unwrapped Phase
Selects a Cartesian diagram with an arbitrarily scaled linear vertical axis to display the phase of the
measured quantity.
Properties: The stimulus variable appears on the horizontal axis, scaled linearly. The phase of the
complex quantity C, i.e. φ (C) = arctan ( Im(C) / Re(C) ), appears on the vertical axis. φ (C) is measured
relative to the phase at the start of the sweep (reference phase = 0°). In contrast to the normal Phase
format, the display range is not limited to values between –180° and +180°. This avoids artificial jumps of
the trace but can entail a relatively wide phase range if the sweep span is large.
Application: Phase measurements, e.g. phase distortion, deviation from linearity.
After changing to the Unwrapped Phase format, use Trace – Scale – Autoscale to re-scale
the vertical axis and view the entire trace.
Operating Manual 1303.6580.32-01
170
R&S® ZVL
GUI Reference
Trace Menu
Remote control:
CALCulate<Chn>:FORMat UPHase
Scale
The Scale settings define how the current trace is presented in the diagram selected in the Format
submenu.
•
Autoscale adjusts the diagram scale in order to display the entire active trace in the diagram area.
•
Scale/Div sets the value of the vertical diagram divisions.
•
Ref Value sets the reference line of a Cartesian diagram or the outer circumference of a polar
diagram.
•
Ref Position defines the position of the reference line in a Cartesian diagram.
•
Overlay All displays all traces in one diagram area.
•
Split All displays every trace in a separate diagram area.
•
Maximize maximizes the active diagram area.
The Scale settings are closely related to the settings in the Format submenu and in the Display menu. All
of them have an influence on the way the analyzer presents data on the screen.
The Scale settings depend on the diagram type (Trace – Format) because not all diagrams can be scaled
in the same way:
•
In Cartesian diagrams, all scale settings are available.
•
In circular diagrams, no Scale/Div., no Ref. Position, and no Max and Min values can be defined.
The default scale is activated automatically when a display format (diagram type) is selected. Scale
settings that are not compatible with the current display format are disabled (grayed).
Relations between the scaling parameters
The scaling parameters Scale / Div, Ref Value, Ref Position, Max, Min are coupled together in the
following manner:
Max – Min = Scale / Div * <Number of graticule divisions>
Operating Manual 1303.6580.32-01
171
R&S® ZVL
GUI Reference
Trace Menu
Max = Ref Value when Ref Position is 10
Min = Ref Value when Ref Position is 0
The Marker -> provide a convenient alternative to manual diagram scaling.
Autoscale
Adjusts the Scale Divisions and the Ref. Value in order to display the entire active trace in the diagram
area, leaving an appropriate display margin.
•
In Cartesian diagrams, the analyzer re-calculates the values of the vertical divisions so that the
trace fits onto 80% of the vertical grid. The reference value is chosen to center the trace in the
diagram.
•
In circular diagrams (Polar, Smith, Inverted Smith), the analyzer re-calculates the values of the
radial divisions so that the diagram is confined to approx. 80% of the outer circumference. The
reference value is set to the value of the outer circumference.
Autoscale does not affect the stimulus values and the horizontal axis.
Remote
control:
DISPlay[:WINDow<Wnd>]:TRACe<WndTr>:Y[:SCALe]:AUTO ONCE
Scale / Div
Sets the value of the vertical diagram divisions in Cartesian diagrams.
Scale /Div corresponds to the increment between two consecutive grid lines. The unit depends on the
display format: dB for display format dB Mag, degrees for Phase and Unwrapped Phase, ns for Delay, U
(units) for all other (dimensionless) formats.
Scale /Div is not available (grayed) for circular diagrams (Polar, Smith, Inverted Smith).
Remote control: DISPlay[:WINDow<Wnd>]:TRACe<WndTr>:Y:PDIVision
Ref Value
Sets the reference line of a Cartesian diagram or the outer circumference of a circular diagram.
•
In Cartesian diagrams Ref. Value defines the value of the reference line, indicated by a
symbol at the right edge of the diagram area. The color of the symbol corresponds to the trace
color. As the Ref. Value is varied, the position of the reference line (Ref. Position) is left
unchanged, so that the current trace is shifted in vertical direction. The unit of the Ref. Value
depends on the display format: dB for display format dB Mag, degrees for Phase and Unwrapped
Phase, ns for Delay, U (units) for all other (dimensionless) formats.
•
In circular diagrams (Polar, Smith, Inverted Smith), Ref. Value defines the value of the outer
circumference. Changing Ref. Value enlarges or scales down the diagram, leaving the center
Operating Manual 1303.6580.32-01
172
R&S® ZVL
GUI Reference
Trace Menu
unchanged. The unit is U (units) for all circular diagrams.
Use the paste marker list for convenient entry of the reference value.
Remote control:
DISPlay[:WINDow<Wnd>]:TRACe<WndTr>:Y:RLEVel
Ref Position
Defines the position of the reference line in a Cartesian diagram.
symbol at the right edge of the diagram area. The color of the
The reference line is indicated by a
symbol corresponds to the trace color. Ref. Position is defined on a linear scale between 0 (bottom line of
the diagram) and 10 (top line of the diagram). As the Ref. Position is varied, the value of the reference line
(Ref. Value) is left unchanged, so the current trace is shifted together with the Ref. Position.
Ref. Position is not available (grayed) for polar diagrams (Polar, Smith, Inverted Smith).
Use the analyzer's drag-and-drop functionality to move the reference line symbol to the desired
position.
Remote control: DISPlay[:WINDow<Wnd>]:TRACe<WndTr>:Y:RPOSition
Overlay All
Places all traces in a single diagram area which is maximized to occupy the whole window. This function
is available irrespective of the trace Format and the Channel settings; it is even possible to overlay
Cartesian and polar diagrams.
The active trace and active channel is highlighted. The scaling of the axes corresponds to the active trace.
Operating Manual 1303.6580.32-01
173
R&S® ZVL
GUI Reference
Trace Menu
To hide all traces except the active one, select Split All and Maximize.
Remote control:
No command, display configuration only.
Split All
Splits the active window into as many diagram areas as there are traces and assigns a single trace to
each area.
Remote control:
No command, display configuration only.
Maximize
Maximizes all diagram areas of the active setup to occupy the whole window, placing the active diagram
area on top. Clicking Maximize again restores the previous display configuration.
Operating Manual 1303.6580.32-01
174
R&S® ZVL
GUI Reference
Trace Menu
A double-click into any point in the diagram area is equivalent to the Maximize function. To
view all traces in a common, maximized diagram area, select Overlay all.
Remote control:
DISPlay:WINDow<Wnd>:MAXimize ON | OFF
Lines
The commands in the Lines define limits for the measurement results, visualize them in the diagrams and
activate/deactivate the limit check. Besides the menu provides a horizontal line for each trace.
Limit Lines
A limit line is a set of data to specify the allowed range for some or all points of a trace. Typically, limit
lines are used to check whether a DUT conforms to the rated specifications (conformance testing).
•
The upper limit line defines the maximum value for the trace points.
•
The lower limit line defines the minimum value for the trace points.
A limit check consists of comparing the measurement results to the limit lines and display a pass/fail
indication. An acoustic warning and a TTL signal at the USER CONTROL port can be generated in
addition if a limit is exceeded.
Upper and lower limit lines are both defined as a combination of segments with a linear dependence
between the measured quantity and the sweep variable (stimulus variable). The limit lines can be stored to
a file and recalled. Data or memory traces can be used to define the segments of a limit line. Moreover it
is possible to modify the limit lines globally by adding an offset to the stimulus or response values.
Operating Manual 1303.6580.32-01
175
R&S® ZVL
GUI Reference
Trace Menu
(No direct access via
front panel keys)
•
Show Limit Line displays or hides the limit line associated to the active trace.
•
Limit Check On activates or deactivates the limit check.
•
Fail Beep On activates or deactivates the acoustic signal indicating a limit excess.
•
Define Limit Line opens a dialog to define, save or recall limit lines.
•
Horizontal Line displays or hides the horizontal line of the active trace and changes its position.
•
Global Limit Checkk activates a global (composite) limit check on all traces in the active setup.
Limit lines are available for all Cartesian diagram types (Trace – Format). For polar diagrams, the
functions of the Lines submenu are grayed. The limit lines are hidden and the limit check is disabled when
a Cartesian trace format is replaced by a polar diagram.
Show Limit Line
Shows or hides the limit line associated to the active trace in a Cartesian diagram area. A checkmark
appears next to the menu item when the limit line is shown.
In the diagram, upper and lower limit lines can be displayed with different colors. Limit line segments with
disabled limit check (see Define Limit Line) can also be colored differently. The limit line colors are defined
in the Define User Color Scheme dialog (Display – Display Config. – Color Scheme...).
Operating Manual 1303.6580.32-01
176
R&S® ZVL
GUI Reference
Trace Menu
Display of the limit line and limit check are independent of each other: Hiding the limit line
does not switch off the limit check.
Remote control:
CALCulate<Chn>:LIMit:DISPlay[:STATe] ON | OFF
Limit Check On
Switches the limit check of the active trace on or off. A checkmark appears next to the menu
item when the limit check is enabled.
When the limit check is switched on, a PASS or FAIL message is displayed in the center of
the diagram. If the limit check fails at a measurement point, the two trace segments to the
left and right of the point can change their color. The Limit Fail Trace color is defined in the
Define User Color Scheme dialog (Display – Display Config. – Color Scheme...). An acoustic
signal (Fail Beep) and a TTL signal indicating pass or fail can be generated in addition.
Limit check and display of the limit lines are independent of each other: With disabled limit
check, the limit line can still be displayed, however, no display elements indicating a limit
excess will appear.
Limits are checked at the actual measurement points, whereas a limit failure is indicated for
the trace segments on both sides of a failed point. A small number of points causes wide
trace segments so that the out-of tolerance regions can appear wider as they are.
If no limit lines are defined for the active trace, the limit check can be switched on but will
always PASS the trace.
Remote control:
CALCulate<Chn>:LIMit:STATe
CALCulate<Chn>:LIMit:LOWer:STATe
CALCulate<Chn>:LIMit:UPPer:STATe
Operating Manual 1303.6580.32-01
ON
|
ON
ON
|
|
OFF
OFF
OFF
177
R&S® ZVL
GUI Reference
Trace Menu
CALCulate<Chn>:LIMit:FAIL?
Fail Beep On
Activates or deactivates the fail beep. The fail beep is a low-tone acoustic signal that is generated each
time the analyzer detects an exceeded limit. No fail beep can be generated if the limit check is switched
off. A checkmark appears next to the menu item when the fail beep is enabled.
Remote control:
CALCulate<Chn>:LIMit:SOUNd:STATe ON | OFF
Define Limit Line
Opens a dialog to define the limit line for the active trace on a segment-by-segment basis. In each
segment the limit line is defined as a straight line connecting two points.
Creating limit lines with minimum effort
Choose one of the following methods to efficiently create and handle limit lines:
•
To define a limit line with only a few segments, use Add Segment and edit each segment in the
segment table individually.
•
Use the multiselection feature to edit several limit line segments at the same time.
•
Select a data or memory trace as a limit line (Import Trace) or import a trace stored in a file
(Import File).
•
Save your limit lines to a file so you can re-use or modify them later sessions (Save Limit Line,
Recall Limit Line).
The Define Limit Line dialog contains a table to edit the individual segments of the limit line; see below.
The active trace is indicated in the title bar of the dialog. The three buttons below the table extend or
shorten the segment list.
•
Add Segment adds a new segment to the list. The new segment is a copy of the
previously active segment and inserted after that segment. The current segment
numbers are adapted. The analyzer places no restriction on the number of segments
Operating Manual 1303.6580.32-01
178
R&S® ZVL
GUI Reference
Trace Menu
in a limit line.
•
Delete Segment removes the selected segment from the list.
•
Del All Segments clears the entire segment list so it is possible to define or load a new
limit line.
The buttons to the right of the table are used to import and export limit line data.
•
Recall Limit Line... calls up an Open File dialog to load a limit line from a limit line file.
Limit line files are ASCII files with the default extension *.limit and a special file
format.
•
Save Limit Line... calls up a Save As... dialog to store the current limit line configuration
to a limit line file. Limit line files are ASCII files with the default extension *.limit and
a special file format.
•
Import Trace
opens a box to select a trace that can be used to define a limit line.
The box contains all data or memory traces of the active channel. As soon as a trace is selected, the
Properties of Imported Segments dialogwith further global import options is opened.
•
Import File
Calls up a standard Import File dialog to load a limit line from a trace file. The limit line import is analogous
to the import of traces. Trace files are ASCII files with selectable file format. After the trace file is selected,
the Properties of Imported Segments dialogwith further global import options is opened.
Imported traces are polygonal curves with n points and n – 1 segments. The number of points n is set via
Channel – Sweep – Number of Points. The n – 1 segments are appended to the current segment table for
further editing. Existing limit line segments are not overwritten.
To import a limit line file (*.limit) you can also use the Windows Explorer and simply doubleclick the file or drag and drop the file into the NWA application. You have to switch on the limit
check separately. Use the paste marker list for convenient entry of Start and Stop values.
Columns in the segment table
The table contains an automatically assigned current number for each segment plus the following editable
columns:
•
Type indicates whether the segment belongs to an Upper or a Lower limit line, or if the limit check
at the segment is switched Off. Switching off the limit check does not delete the segment but
changes its screen color.
•
Start Stimulus is the stimulus (x-axis) value of the first point of the segment (not necessarily
smaller than Stop Stimulus).
•
Stop Stimulus is the stimulus (x-axis) value of the last point of the segment (not necessarily larger
than Start Stimulus).
•
Start Response is the response (y-axis) value of the first point of the segment.
Operating Manual 1303.6580.32-01
179
R&S® ZVL
GUI Reference
Trace Menu
•
Stop Response is the response (y-axis) value of the last point of the segment.
The limit line segment is calculated as a straight line connecting the two points (<Start Stimulus>, <Start
Response>) and (<Stop Stimulus>, <Stop Response>); see Rules for Limit Line Definition.
Remote control:
CALCulate<Chn>:LIMit:CONTrol[:DATA]
CALCulate<Chn>:LIMit:DATA
CALCulate<Chn>:LIMit:SEGment<Seg>...
CALCulate<Chn>:LIMit:UPPer...
CALCulate<Chn>:LIMit:LOWer...
CALCulate<Chn>:LIMit:DELete:ALL
MMEMory:STORe:LIMit
MMEMory:LOAD:LIMit
Multi-Selection of Limit Line Segments
In the Define Limit Line dialog it is possible to edit several limit line segments at the same time. Selection
of two or more segments (use the left mouse key and the Shift key of an external keyboard) and a rightclick on the dark grey Seg. area opens a context menu:
The context menu provides the following functions:
•
Modification of all entries in the segment table: Type, start and stop values for the stimulus and
response variable.
•
Definition of an offset for response and stimulus values in analogy to the Properties of Imported
Segments dialog.
•
Delete the selected segments.
•
Merge the selected segments to a single new segment. The start and stop values of the new
segment are given by the start values of the first selected segment and the stop
value of the last selected segment. The type is taken from the first selected segment.
The new segment replaces the selected segments.
Remote control:
CALCulate<Chn>:LIMit:UPPer...
CALCulate<Chn>:LIMit:LOWer...
Operating Manual 1303.6580.32-01
180
R&S® ZVL
GUI Reference
Trace Menu
Rules for Limit Line Definition
The analyzer places very few restrictions on the definition of limit line segments. The following rules
ensure a maximum of flexibility:
•
Segments don't have to be sorted in ascending or descending order (e.g. the Start Stimulus value
of segment no. n doesn't have to be smaller than the Start Stimulus value of segment no. n+1).
•
Overlapping segments are allowed. The limit check in the overlapping area refers to the tighter
limit (the pass test involves a logical AND operation).
•
Gaps between segments are allowed and equivalent to switching off an intermediate limit line
segment.
•
Limit lines can be partially or entirely outside the sweep range, however, the limits are only
checked at the measurement points.
The following figure shows a limit line consisting of 3 upper and 2 lower limit line segments. To pass the
limit check, the trace must be confined to the shaded area.
As a consequence of the limit line rules, the limit check will always pass a DUT if no limit lines are defined.
File Import Settings
The Properties of Imported Segments dialog appears before a trace is imported into the Define Limit Line
dialog.
The dialog assigns common properties to all limit line segments generated by the imported trace.
•
Offsets contains two input fields to define constant offset values for all imported
segments. The Response offset shifts all segments in vertical direction, the Stimulus
offset shifts them in horizontal direction. The offsets are added to the start and stop
Operating Manual 1303.6580.32-01
181
R&S® ZVL
GUI Reference
Trace Menu
values of all segments.
•
Remote
control:
Type defines whether the imported segments belong to the Upper or Lower limit line.
A third option is to import the segments but disable the limit check (Off).
CALCulate<Chn>:LIMit:LOWer:FEED
<stimulus_offset>,<response_offset>[,<trace_name>]
CALCulate<Chn>:LIMit:UPPer:FEED
<stimulus_offset>,<response_offset>[,<trace_name>]
MMEMory:LOAD:LIMit
File Format for Limit Lines
The analyzer uses a simple ASCII format to export limit line data. By default, the limit line file has the
extension *.limit and is stored in the directory shown in the Export Limit Line and Import Limit Line dialogs.
The file starts with a preamble containing the channel and trace name and the header of the segment list.
The following lines contain the entries of all editable columns of the list.
Example of a limit line file
The limit line:
is described by the limit line file:
Remote control:
MMEMory:LOAD:LIMit
"Trc_name","file_name"
MMEMory:STORe:LIMit "Trc_name","file_name"
Horizontal Line
Shows or hides the horizontal line associated to the active trace in a Cartesian diagram area. A
checkmark appears next to the menu item when the horizontal line is shown.
The horizontal line (or display line) is a red line which can be moved to particular trace points in order to
retrieve the response values.
Operating Manual 1303.6580.32-01
182
R&S® ZVL
GUI Reference
Trace Menu
•
Pressing Horizontal Line for a first time shows the line for the active trace and opens the numeric
entry bar to define its position (response value). The (rounded) position is displayed near the left
edge of the screen.
•
Pressing Horizontal Line for a second time hides the horizontal line for the active trace.
Use the analyzer's drag-and-drop functionality to move the horizontal line symbol to the
desired position.
Remote control:
CALCulate<Chn>:DLINe:STATe
CALCulate<Chn>:DLINe
ON
|
OFF
Global Limit Check On
Performs a composite limit check on all traces of the current setup. The result of the global
check appears in a popup box whenever Global Limit Check is pressed.
or
•
PASS represents pass for all traces for which the limit check is enabled. A trace without limit lines
or with disabled individual limit check always passes the composite limit check.
•
FAIL means that the limit checks for one or more traces failed.
Remote control:
CALCulate<Chn>:CLIMits:FAIL?
Operating Manual 1303.6580.32-01
183
R&S® ZVL
GUI Reference
Channel Menu
Channel Menu
The Channel menu provides all channel settings and the functions to activate, modify and store different
channels.
Channels
A channel contains hardware-related settings to specify how the network analyzer collects data. The
channel settings can be divided into three main groups:
•
Control of the measurement process (Sweep, Trigger, Average)
•
Description of the test setup (internal source power, IF filters and step attenuators)
•
Correction data (Calibration, Offset)
The channel settings complement the definitions of the Trace menu. Each trace is assigned to a channel,
see Traces, Channels and Diagram Areas. The channel settings apply to all traces assigned to the
channel.
(No direct access via
front panel keys)
The Channel menu contains the following functions and submenus:
•
Center / Span defines the sweep range, depending on the sweep type.
•
Pwr Bw defines the power of the internal signal source, sets the step attenuators and the IF
bandwidths, and configures the sweep average.
•
Cal provides all functions that are necessary to perform a system error correction (calibration).
•
Sweep defines the scope of measurement, including the sweep type, the trigger conditions and
the periodicity of the measurement.
Center, Span
The Center and Span submenus define the frequency sweep range in the current channel.
•
In Cartesian diagrams, the sweep range corresponds to the diagram width and defines the scaling
of the x-axis.
•
In polar diagrams and Smith charts the stimulus axis is lost but the marker functions easily provide
the stimulus value of any measurement point.
Operating Manual 1303.6580.32-01
184
R&S® ZVL
GUI Reference
Channel Menu
•
Center opens the input field for the center frequency. It corresponds to the center of the Cartesian
diagram, i.e. (Start + Stop)/2.
•
Span opens the input field for the frequency span. It corresponds to the diagram width, i.e. (Stop –
Start).
•
Start opens the input field for the the lowest frequency to be measured. It corresponds to the left
edge of the Cartesian diagram.
•
Stop opens the input field for the highest frequency to be measured. It corresponds to the right
edge of the Cartesian diagram.
•
Power defines the power of the internal signal source.
The Marker Functions provide a convenient alternative to the manual entry of the sweep
range parameters. Use the paste marker list for convenient entry of Start and Stop values.
Equivalence
of settings:
For a frequency sweep the Start and Stop frequencies or the Center
frequency and Span are alternative settings:
Remote control:
[SENSe<Ch>:]FREQuency:STARt
[SENSe<Ch>:]FREQuency:STOP
[SENSe<Ch>:]FREQuency:CENTer
[SENSe<Ch>:]FREQuency:SPAN
Pwr Bw
The Pwr Bw menu defines the power of the internal signal source and sets the step attenuators and the IF
bandwidths.
Operating Manual 1303.6580.32-01
185
R&S® ZVL
GUI Reference
Channel Menu
•
Power defines the power of the internal signal source.
•
Step Atten b1/b2...sets the attenuation for the received wave b1 or b2 respectively.
•
RF Off switches the internal and external power sources on (if checked) or off.
•
Meas. Bandwidth selects the bandwidth of the IF measurement filter.
Power
Opens the numeric entry bar to set the power of the internal signal source (channel power).
The channel power determines the output power at the test ports if a Frequency Sweep or a Time Sweep
is active; see info below. The setting has no effect in Power Sweep mode, where the source power is
varied over a continuous range.
The selected channel power applies to all source ports used in the active channel.
Output power at the test ports
Power sets the output power at the test port that supplies the stimulus for the active channel. The channel
power can be varied over a wide dynamic range. This leaves enough flexibility to include an attenuation or
gain in the test setup.
The channel power can be modified by the following settings:
•
Generator step attenuators decrease the output power by a definite factor astep. astep can be set
individually for all test ports but should not change during a sweep. To ensure a sufficient dynamic
range at the test ports, it is recommended to use automatic generator step attenuator setting.
•
The Source section of the Port Configuration dialog provides a port-specific constant power offset
(for arbitrary sweeps) and a port and frequency-dependent power slope factor (for frequency
sweeps).
Remote
control:
SOURce<Ch>:POWer[:LEVel][:IMMediate][:AMPlitude]
Operating Manual 1303.6580.32-01
186
R&S® ZVL
GUI Reference
Channel Menu
Step Atten b1, b2
Opens the numeric entry bar to set the attenuation for the received wave b1 or b2 respectively.
The attenuation is used to adjust the received signal level at the port to the input level range of the
analyzer in order to avoid damage to the instrument, e.g. if the DUT is a power amplifier. The range of
values depends on the analyzer model.
Using a single step attenuation b1 or b2 corresponds to a standard test setup with 0 dB generator
attenuation and attenuation of the (amplified) wave received at test port 1/2.
Remote control:
INPut<Pt>:ATTenuation
RF Off
RF Off switches the internal and external power sources on (if checked) or off. Switching off the RF power
helps to prevent overheating of a connected DUT while not measurement results are taken.
Meas Bandwidth
Sets the measurement bandwidth of the IF filter. Step Atten. b2 opens a submenu (and displays a range
of softkeys) to directly select bandwidths between 10 Hz and 500 kHz:
Operating Manual 1303.6580.32-01
187
R&S® ZVL
GUI Reference
Channel Menu
Fine Adjust... opens a dialog to modify the selected measurement bandwidth and the selectivity of the IF
filter.
•
The input field shows the last IF filter bandwidth selected. The arrow buttons increment and
decrement the bandwidth in 1-2-5 steps for each decade. Entered values between the steps will
be rounded up, values exceeding the maximum bandwidth rounded down.
•
Selectivity selects between two types of IF filters: Filters with Normal selectivity and short settling
time, and filters with High selectivity but larger settling time.
The selected bandwidth and selectivity applies to all filters used in the current channel. This makes sense
because the measurement speed is limited by the slowest filter in the channel. In Segmented Frequency
sweeps, the bandwidth and selectivity can be set independently for each segment; see Define Segments.
In general, the system error correction is no longer valid after a change of the IF filter
bandwidth. The message Cal? appears in the trace list.
Remote control:
[SENSe<Ch>:]BANDwidth|BWIDth[:RESolution]
Cal
The Cal menu provides all functions that are necessary to perform a system error correction (calibration).
For an introduction to calibration and calibration types refer to section Calibration Overview in the
System Overview chapter. See also the Data Flow overview in the System Overview chapter.
Operating Manual 1303.6580.32-01
188
R&S® ZVL
GUI Reference
Channel Menu
•
Start Cal opens a submenu to select a new calibration and start the calibration wizard.
•
Repeat Prev Cal reopens the wizard to repeat and optimize the previous calibration.
•
Correction Off activates or deactivates the system error correction in the active channel.
•
Port Extensions provides a selection of length offset parameters to shift the measurement plane.
•
Cal Manager opens a dialog to store system error correction data to a Cal Pool and to assign
correction data to channels.
•
Recall Last Cal Set loads and activates the setup for which the last calibration was performed.
•
Cal Kits opens a dialog to manage the calibration kits in use, add new kits and import or export
kits.
Start Cal
The Start Cal submenu selects the calibrated ports and the calibration type.
The calibration types depend on the number of test ports of the analyzer. For a four-port unit:
•
One-Port P1 and One-Port P2 open submenus to select a one-port calibration at test ports PORT
1 and PORT 2, respectively.
•
Two-Port P1 P2 opens a submenu to select a two-port calibration at test ports PORT 1 and PORT
2.
Operating Manual 1303.6580.32-01
189
R&S® ZVL
GUI Reference
Channel Menu
Remote control:
[SENSe<Ch>:]CORRection:COLLect:METHod:DEFine
"<cal_name>", REFLshort | FOPort | FRTRans | OPTPort | TOSM,
<port_no>[,<port_no>][,<port_no>][,<port_no>]
One-Port P1, One-Port P2
Opens a submenu to select a one-port calibration at test ports PORT 1 or PORT 2. The two submenus are
identical:
The following menu commands calls up the start dialog of the calibration wizard to start a manual
calibration:
•
Normalization (Short) initiates a normalization using a short standard.
•
Full initiates a full one-port calibration.
Remote control:
[SENSe<Ch>:]CORRection:COLLect:AUTO ' ',
matching
analyzer
and
cal
[SENSe<Ch>:]CORRection:COLLect:AUTO:PORTs
pairs of ports)
<port_no>
(for
unit
ports)
(for arbitrary
[SENSe<Ch>:]CORRection:COLLect:METHod:DEFine
"<cal_name>", REFLshort | FOPort , <port_no>
Two-Port P1 P2
Opens a submenu to select a two-port calibration at test ports PORT 1 and PORT 2:
Operating Manual 1303.6580.32-01
190
R&S® ZVL
GUI Reference
Channel Menu
The following menu commands calls up the start dialog of the calibration wizard to start a manual
calibration:
•
Normalization... initiates a normalization using a through standard.
•
One Path Two-Port initiates a full one-port calibration.
•
TOSM initiates a Through-Open-Short-Match (12-term) calibration
Remote control:
[SENSe<Ch>:]CORRection:COLLect:AUTO ' ',
matching
analyzer
and
cal
[SENSe<Ch>:]CORRection:COLLect:AUTO:PORTs
pairs of ports)
<port_no>
(for
unit
ports)
(for arbitrary
[SENSe<Ch>:]CORRection:COLLect:METHod:DEFine
"<cal_name>", FRTRans | OPTPort | TOSM, <port_no>,<port_no>
Guided Calibration
The analyzer provides a calibration wizard for each calibration type. The guided calibration consists of the
following steps:
1. Select Physical Port Connectors and calibration kits at all calibrated ports.
2. Measure Standards: Acquire measurement data for all standards required for the selected
calibration type.
3. Calculate the system error correction data (error terms) from the measurement data of the
standards and apply the result to the active channel.
A successful calibration will supersede the previous calibration, discarding all previous
system error correction data. To keep older correction data you can transfer them into a Cal
Pool using the Calibration Manager.
The system error correction data determined in a calibration procedure are stored on the analyzer. You
can read these correction data using the remote control command [SENSe<Ch>:]CORRection:CDATa.
You can also replace the correction data of the analyzer by your own correction data sets.
Operating Manual 1303.6580.32-01
191
R&S® ZVL
GUI Reference
Channel Menu
Select Connectors
The first dialog of the calibration wizard displays a table to select the connectors and calibration kits for all
calibrated physical ports.
The table contains the following rows:
•
Physical Port Number #
The ports (and therefore the number of table rows) are determined by the active calibration type selected
in the Start Cal submenu.
•
Connector
provides a drop-down list to select the connector type An (f) behind the connector type denotes
female connectors, an (m) denotes male connectors. Symmetric (sexless) connectors (e.g.
PC7) are not labeled. User-defined connectors can be added or removed in the Available
Connector Types dialog, which is opened from the Channel – Cal – Cal Kits dialog. at the port
and its gender. If Same Connector at All Ports in Table is active, the connector types at all ports (but not
their gender) are always adjusted to the current selection.
•
Ref Imp shows the reference impedance for the selected connector.
•
Calibration Kits
provides a drop-down list to select a calibration kit. The list contains all calibration kits available for the
selected connector type. The assignment of a calibration kit to a connector type must be the same for all
Operating Manual 1303.6580.32-01
192
R&S® ZVL
GUI Reference
Channel Menu
physical ports: If a calibration kit is changed, the analyzer automatically assigns the new kit to all ports
with the same connector type.
Completness: The selected calibration kit must contain all standards needed for the
active calibration type. If it doesn't the analyzer displays an error message.
Waveguide cutoff:If a user-defined waveguide connector is assigned to one of the
calibrated ports, then the start frequency of the active channel must be above the
waveguide cutoff. Otherwise the analyzer displays an error message.
Import Kit opens the Import Calibration Kit dialog to load and (if desired) activate a cal kit file.
Next > opens the second dialog of the wizard to continue the calibration procedure.
If the calibrated channel has already been assigned to a cal group, the correction data
overwrites the cal group data, so the new calibration will affect all channels assigned to the
cal group. The network analyzer generates a notice message "New calibration will overwrite
cal pool!" when opening the calibration wizard.
Checks on switching to the next dialog
When the Next> buttonis pressed the analyzer checks the calibration kits and the matching of the
calibration standards and possibly displays a notice box (confirm with OK). This happens if one of the
calibration kits is described by ideal kit parameters or typical values.
Remote
control:
[SENSe<Ch>:]CORRection:COLLect:CONNection<port_no>
[SENSe<Ch>:]CORRection:COLLect:SCONnection<port_no>
[SENSe<Ch>:]CORRection:CKIT:<conn_type>:SELect "<Ckit_Name>"
Measure Standards
The last dialog of the calibration wizard is used to perform the necessary measurements of standards and
to calculate the correction data.
Operating Manual 1303.6580.32-01
193
R&S® ZVL
GUI Reference
Channel Menu
The dialog displays the list of measured standards compiled in the previous dialog. The list is complete: All
standards must be measured to perform the selected calibrations.
Structure of the Measured Standards list
The list of measured standards has a tree structure.
•
The first level contains all physical ports where one-port
(reflection)
measurements are required and all physical port combinations where two-port
(transmission) measurements must be performed.
•
The second level contains check boxes for the standards to be measured at
each port or port combination.
•
For a sliding match, a third level contains check boxes for the different
positions of the sliding element.
To expand the list of a physical port symbol, click the symbol, to collapse the list,
double-click the symbol.
Calibrations using a match or sliding match
If the calibration kit contains a sliding match standard, the Sliding Match appears in the
Measured Standards list whenever the selected calibration type requires a Match. A
click on the node expands the check boxes for the different positions of the load
Operating Manual 1303.6580.32-01
194
R&S® ZVL
GUI Reference
Channel Menu
element. The number of different positions is defined in the User Interface tab of the
System Configuration dialog.
The sliding match is a one-port standard consisting of an air line with a movable, lowreflection load element (sliding load). This standard is used because a no perfect match
is available over a wide frequency range. However, a series of measurements at a given
frequency with equal mismatch and varying phase yields reflection factors that are
located on a circle in the Smith chart. The center of this circle corresponds to perfect
match. The network analyzer determines and further corrects this match point following
I. Kása's circle-fitting algorithm.
To obtain the reflection coefficient for a perfectly matched calibration standard, the
sliding load must be measured at least at 3 positions which should be unequally spaced
to avoid overlapping data points. Increasing the number of positions to 4 – 6 can
improve the accuracy. Moreover it is recommended to use the predefined load positions
of the standard.
The calibration is valid (Apply is available) if either the match or three positions of the
sliding match have been measured. However, it is often desirable to acquire calibration
data from both standards. The analyzer combines the data in an appropriate manner:
•
The match results are used up to the lower edge of the specified frequency
range of the sliding match (Min Freq).
•
The sliding match results are used for frequencies above the Min Freq. In
general, the sliding match will provide better results than the match within its
specified frequency range.
Checking one of the boxes in the list causes the analyzer to stop the measurement in all channels except
the active one and measure the standard according to the active channel settings. The progress of the
calibration sweep and the result can be monitored in the diagram. In case of an error (e.g. if the
measurement result shows that the calibration standard was not connected properly), Abort Sweep
immediately terminates the sweep.
After completing the sweep the analyzer generates a short sound and a green checkmark appears in the
checkbox. Measurements can be repeated as often as desired. Newer results overwrite older
measurement data.
Most channel settings remain valid for calibration sweeps.
Operating Manual 1303.6580.32-01
195
R&S® ZVL
GUI Reference
Channel Menu
Checks for the calibration sweep
If the sweep range of the active channel exceeds the validity range of the standard model (defined by Min
Freq and Max Freq in the Add/Modify Standard dialog) the analyzer displays a notice box (confirm with
OK).
The dialog provides further controls:
•
Show Measurement Diagram displays or hides the diagram to the right of the list of
Measured Standards. Hiding the diagram leaves more space for displaying the
characteristics of the measured standards.
•
Keep Measurement Data for >Repeat Previous Cal< causes the raw measurement data of
the standards to be stored after the calibration is completed. This enables the Repeat
Prev Cal... command, which can be used to optimize a previous calibration without
repeating the measurement of all standards. If Keep Measurement Data... is not
active, then the raw measurement data of the standards is deleted and the analyzer
only stores the system error correction data. Deleting the raw data saves disk space.
•
Apply is enabled as soon as data has been acquired for all standards. The button
starts the calculation of the system error correction data and closes the calibration
wizard. The current instrument settings are stored with the correction data. To avoid
incompatibilities, older system error correction data is deleted unless it has been
transferred into a Cal Pool using the Calibration Manager.
The Keep Measurement Data for >Repeat Previous Cal< setting is valid for the current
calibration only. To activate this function in general, use the parameter in the User Interface
tab of the Sytem Configuration dialog (menu Nwa-Setup – System Config).
Checks during the calculation of correction data
Incompatibilities between the selected calibration type, the standards and the channel settings may cause
the calibration to be inaccurate. The analyzer auto-detects potential sources of errors and displays
appropriate, self-explanatory notice boxes.
Remote
control:
[SENSe<Ch>:]CORRection:COLLect[:ACQuire]:RSAVe
[SENSe<Ch>:]CORRection:COLLect[:ACQUire]:SELected
[SENSe<Ch>:]CORRection:COLLect:SAVE
[SENSe<Ch>:]CORRection:COLLect:DELete ["<cal_name>"]
Repeat Prev Cal
Reopens the Measure Standards dialog of the calibration wizard to repeat and optimize the previous
calibration without necessarily repeating the measurement of all standards.
Repeat Prev Cal is active only if Keep Measurement Data for >Repeat Cal< in the Measure Standards
dialog was enabled when the last calibration for the active channel was successfully completed.
Additional conditions for repeating a calibration
Changing the channel settings can cause incompatibilities between the current instrument state and the
previous calibration. In particular the following conditions must be met:
Operating Manual 1303.6580.32-01
196
R&S® ZVL
GUI Reference
Channel Menu
•
The configuration of all ports needed must be correct (see Select Connector– Physical Port
Number #).
•
The Sweep Type must be unchanged.
If incompatible settings occur the analyzer displays an error message and does not repeat the calibration.
Correction Off
Activates or deactivates the system error correction in the active channel. Correction Off is active only if a
valid system error correction is assigned to the active channel; see Cal State in the Calibration Manager.
A red label Cal Off ! appears behind the trace list if the system error correction is switched off; see
also Calibration Overview.
Remote control:
[:SENSe<Ch>]:CORRection:STATe OBN | OFF
Port Extensions
The Port Extensions menu defines a length offset and a loss for the test ports. The offset parameters
complement the system error correction, compensating for the known length and loss of a (non-dispersive
and perfectly matched) transmission line between the calibrated reference plane and the DUT.
Length offset parameters: Definition
The Delay is the propagation time of a wave traveling through the transmission line.
The Electrical Length is equal to the Delay times the speed of light in the vacuum and is
a measure for the length of transmission line between the standard and the actual
calibration plane. For a line with permittivity εrand mechanical length Lmech the delay and
the electrical length are calculated as follows:
Electrical Length, Mechanical Length or Delay are coupled parameters. When one of
them is changed, the other two follow.
For a non-dispersive DUT, the delay defined above is constant over the considered
frequency range and equal to the negative derivative of the phase response with
respect to the frequency (see mathematical relations). The length offset parameters
compensate for a constant delay, which is equivalent to a linear phase response.
If a dispersive connector type (i.e. a waveguide; see Offset Model dialog) is assigned to
a test port that is related to a particular quantity, then the phase of the quantity is
calculated taking dispersion effects into account.
Loss parameters: Definition
The loss L is the attenuation of a wave traveling through the offset transmission line. In
logarithmic representation, the loss can be modeled as the sum of a constant and a
frequency-dependent part. The frequency dependence is essentially due to the skin
effect; the total loss can be approximated by an expression of the following form:
Operating Manual 1303.6580.32-01
197
R&S® ZVL
GUI Reference
Channel Menu
The DC loss LossDC, the reference frequency fref, and the loss at the reference
frequency Loss(fref) are empirical parameters for the transmission lines connected to
each port which can be entered into any of the dialogs in the Offset menu. For a
lossless transmission line, both LossDC and Loss(fref) are zero. In practice, Loss(fref)
often represents the dominant contribution so that LossDC can be set to zero.
Offset parameters: Application and effect
Offset parameters can be particularly useful if the reference plane of the calibration
cannot be placed directly at the DUT ports, e.g. because the DUT has non-coaxial ports
and can only be measured in a test fixture. Offset parameters can also help to avoid a
new complete system error correction if a cable with known properties has to be
included in the test setup.
A positive length offset moves the reference plane of the port towards the DUT, a
negative offset moves the reference plane away from the DUT. The offset parameters
cannot compensate for a possible mismatch in the test setup.
Each offset parameter is assigned to a particular port. The delay parameters affect the
phase of all measured quantities related to this port; the loss parameters affect their
magnitude. An offset at port 1 affects the S-parameters S11, S21, S12. Some quantities
depend on the whole of all S-parameters, so they are all more or less affected when
one S-parameter changes due to the addition of an offset length.
To account for the propagation in both directions, the phase shift of a reflection
parameter due to a given length offset is twice the phase shift of a transmission
parameter. If, at a frequency of 300 MHz, the electrical length is increased by 250 mm
(λ/4), then the phase of S21 increases by 90 deg, whereas the phase of S11 increases
by 180 deg. Equivalent relations hold for the loss.
If the trace is displayed in Delay format, changing the offset parameters simply shifts
the whole trace in vertical direction. The sign of the phase shift is determined as
follows:
•
A positive offset parameter causes a positive phase shift of the measured
parameter and therefore reduces the calculated group delay.
•
A negative offset parameter causes a negative phase shift of the measured
parameter and therefore increases the calculated group delay.
Operating Manual 1303.6580.32-01
198
R&S® ZVL
GUI Reference
Channel Menu
The offset parameters can be defined separately for each port.
•
Reset Extension restores the default values for all length offsets, i.e. it resets all values to zero.
•
Electrical Length defines electrical length offsets and loss parameters at all test ports.
•
Mechanical Length defines mechanical length offsets and loss parameters at all test ports.
•
Delay defines delay times and loss parameters at all test ports.
•
Auto Length determines a length offset for the receiving port of the active measured quantity with
the condition that the residual group delay of the active trace is minimized.
•
Auto Offset determines a length offset an loss for the receiving port of the active measured
quantity with the condition that the residual group delay of the active trace is minimized and the
measured loss is minimized as far as possible across the entire sweep range.
The Zero Delay at Marker function overwrites the Offset parameters.
Remote control [SENSe<Ch>:]CORRection:OFFSet<port_no>[:STATe] <numeric _value>
(for
Reset
Offsets):
Electrical Length
Opens a dialog to define the length offset parameters for the physical test ports as electrical lengths. The
dialog also contains the DC loss, the loss at the reference frequency Loss(fref); and the reference
frequency fref; see Loss parameters: Definition above.
Operating Manual 1303.6580.32-01
199
R&S® ZVL
GUI Reference
Channel Menu
Remote control: [SENSe<Ch>:]CORRection:EDELay<port_no>:ELENgth
[SENSe<Ch>:]CORRection:LOSS<port_no>
[SENSe<Ch>:]CORRection:LOSS<port_no>:FREQuency
[SENSe<Ch>:]CORRection:LOSS<port_no>:OFFSet
Mechanical Length
Opens a dialog to define length offset parameters for the physical test ports as mechanical lengths and
permittivities. The dialog also contains the DC loss, the loss at the reference frequency Loss(fref); and the
reference frequency fref; see Loss parameters: Definition above.
The Mechanical Length dialog contains the three editable columns Mech. Length, Permittivity (εr) and
Velocity Fact. The velocity factor is 1/sqrt(εr) and is a measure for the velocity of light in a dielectric with
permittivity εr relative to the velocity of light in the vacuum (velocity factor < 1); see Offset parameters:
Definition above. Permittivity and velocity factor are coupled parameters.
Click Same Dielectric at Each Port to change the permittivity or velocity factor for all ports by
entering a single value.
Remote
control:
[SENSe<Ch>:]CORRection:EDELay<port_no>:DISTance
[SENSe<Ch>:]CORRection:EDELay<port_no>:DIELectric
[SENSe<Ch>:]CORRection:LOSS<port_no>
[SENSe<Ch>:]CORRection:LOSS<port_no>:FREQuency
[SENSe<Ch>:]CORRection:LOSS<port_no>:OFFSet
Operating Manual 1303.6580.32-01
200
R&S® ZVL
GUI Reference
Channel Menu
Delay
Opens a dialog to define the length offset parameters for the physical test ports as delays. The dialog also
contains the DC loss, the loss at the reference frequency Loss(fref); and the reference frequency fref; see
Loss parameters: Definition above.
Remote control: [SENSe<Ch>:]CORRection:EDELay<port_no>[:TIME]
[SENSe<Ch>:]CORRection:LOSS<port_no>
[SENSe<Ch>:]CORRection:LOSS<port_no>:FREQuency
[SENSe<Ch>:]CORRection:LOSS<port_no>:OFFSet
Auto Length
Adds an electrical length offset to the active test port with the condition that the residual delay of the active
trace (defined as the negative derivative of the phase response) is minimized across the entire sweep
range. If Delay is the selected trace format, the entire trace is shifted in vertical direction and centered
around zero. In phase format, the Auto Length corrected trace shows the deviation from linear phase. The
effect of a dispersive connector type (i.e. a waveguide; see Offset Model dialog) assigned to the receiving
port of the measured quantitiy is taken into account.
If the active trace shows an S-parameter Sij, then Auto Length adds a length offset at port i.
Preconditions for Auto Length, effect on measured quantities and exceptions
Auto Length is enabled if the measured quantity contains the necessary phase
information as a function of frequency, and if the interpretation of the results is
unambiguous:
•
A frequency sweep must be active.
•
The measured quantity must be an S-parameter, a converted impedance or a
converted admittance.
The effect of Auto Length on S-parameters is to eliminate a linear phase response as
described above. The magnitude of the measured quantity is not affected. Converted
admittances or impedances are calculated from the corresponding Auto Length
corrected S-parameters. Stability factors are not derived from a single S-parameter,
therefore Auto Length is disabled.
Operating Manual 1303.6580.32-01
201
R&S® ZVL
GUI Reference
Channel Menu
Use Zero Delay at Marker to set the delay at a special trace point to zero.
Remote control:
[SENSe<Ch>:]CORRection:EDELay<port_no>:AUTO ONCE
Auto Offset
Determines all offset parameters such that the residual group delay of the active trace (defined as the
negative derivative of the phase response) is minimized and the measured loss is minimized as far as
possible across the entire sweep range. Auto Offset involves a two-step procedure:
•
An Auto Length correction modifies the phase of the measured quantity, minimizing the residual
group delay. The magnitude of the measured quantity is not affected.
•
The auto loss correction modifies the magnitude of the measured quantity, leaving the (auto
length-corrected) phase unchanged.
Preconditions for Auto Offset, effect on measured quantities and exceptions
Auto Offset is enabled if the measured quantity contains the necessary phase
information as a function of the frequency, and if the interpretation of the results is
unambiguous:
•
A frequency sweep must be active.
•
The measured quantity must be an S-parameter, a converted impedance or a
converted admittance.
The effect of Auto Offset on S-parameters is to eliminate a linear phase response and
account for a loss as described above. Converted admittances or impedances are
calculated from the corresponding Auto Offset corrected S-parameters. Stability factors
are not derived from a single S-parameter, therefore Auto Offset is disabled.
Calculation of loss parameters
The loss is assumed to be given in terms of the DC loss LossDC, the reference
frequency fref, and the loss at the reference frequency Loss(fref). The formula used in the
Auto Loss algorithm is similar to the formula for manual entry of the loss parameters
(see Loss parameters: Definition). The result is calculated according to the following
rules:
•
The reference frequency fref is kept at its previously defined value (default: 1
GHz).
•
The DC loss c is zero except for S-parameters with maximum dB magnitude
larger than –0.01 dB.
•
Auto Offset for S-parameters centers the corrected dB magnitude as close as
possible around 0 dB.
The resulting offset parameters are displayed in the Electrical Length, Mechanical
Length, and Delay dialogs.
Remote control:
[SENSe<Ch>:]CORRection:LOSS<port_no>:AUTO ONCE
Operating Manual 1303.6580.32-01
202
R&S® ZVL
GUI Reference
Channel Menu
Cal Manager
Opens a dialog to store system error correction and power correction data to the cal pool and to assign
stored correction data to channels.
Cal pool
The cal pool is a collection of correction data sets (cal groups) that the analyzer stores in a common
directory C:\Rohde&Schwarz\NWA\Calibration\Data. Cal groups in the pool can be applied to different
channels and setups. Each cal group is stored in a separate file named <CalGroup_name>.cal. The cal
group name can be changed in the Calibration Manager dialog.
The Calibration Manager dialog contains three main panels:
•
Calibration State lists all channels and their current calibration state.
•
Calibration Pool contains a list of all stored correction data sets.
•
Calibration Properties displays the basic channel settings, the System Error Correction Data, and
the Power Correction Data available for the channel selection in the Calibration State panel.
Calibration states
One of the following calibration states is assigned to each of the channels listed in the Cal State table:
•
No Calibration No specific channel correction data is available. The factory system error
correction is used. This is the default situation when a new setup is created (Nwa-File
– New).
•
Channel Cal A system error correction and/or power correction with channel-specific
correction data is active. A new calibration of the channel affects the channel-specific
correction data only.
Operating Manual 1303.6580.32-01
203
R&S® ZVL
GUI Reference
Channel Menu
•
Uses <CalGroup> A system error correction with one of the correction data sets (cal
groups) stored in the cal pool is active. A new calibration of the channel replaces the
correction data in the cal pool and may affect several channels, see below.
The channel calibration of the active channel is also applied to a new channel created via New Add Chan
+ Trace indicates that the system error correction for the channel has been deactivated using Correction
Off.
If a new calibration is performed for a channel assigned to a cal group (marked as Uses
<CalGroup>), the correction data overwrites the cal group data, so the new calibration will
affect all channels assigned to the cal group. The network analyzer generates a notice
message "New calibration will overwrite cal pool!" when opening the first dialog of the
calibration wizard.
The buttons in the upper half of the dialog are used to modify the Cal Pool and apply pool data to
channels:
•
Copy >> copies the correction data (Channel Cal) of the selected channel to the cal pool,
generating a new pool member (cal group).
•
Apply assigns the selected cal group to the selected channel.
•
Apply All assigns the selected cal group to all channels in the Cal State table.
•
Resolve Pool Link deletes the assignment between the selected channel (Ch<n>: Uses
<CalGroup_name>) and the cal group. The correction data from the cal group <CalGroup_name>
is used as a channel calibration for <Ch1>, the Calibration State list displays Ch<n>: Channel Cal.
•
Delete From Pool deletes the selected cal group.
You can apply any correction data set (cal group) from the Cal Pool to several channels,
which may belong to different setups. When doing make sure that the port configuration of
the channels (connectors, state, ...) and the cal group are compatible.
You can also use a cal group stored in the Cal Pool to define a channel-specific calibration.
Apply the cal group to the channel and click Resolve Pool Link.
Remote
control:
MMEMory:STORe:CORRection
<Ch>,
MMEMory:LOAD:CORRection
<Ch>,
MMEMory:LOAD:CORRection:RESolve
<Ch>,
MMEMory:DELete
"C:\Rohde&Schwarz\NWA\Calibration\Data\<file_name>"
MMEMory:DELete:CORRection
[SENSe<Ch>:]CORRection:DATE?
[SENSe<Ch>:]CORRection:DATA:PARameter?
[SENSe<Ch>:]CORRection:SSTate?
"<file_name>"
"<file_name>"
"<file_name>"
"<file_name>"
Recall Last Cal Set
•
Loads and activates the setup for which the last calibration was performed. If the last calibrated
setup is already active, nothing is changed.
•
The
calibrated
setups
are
automatically
stored
in
the
C:\Rohde&Schwarz\Nwa\Calibration\RecallSets directory. A message box pops up if the directory
is empty, e.g. because no calibration was performed yet.
Operating Manual 1303.6580.32-01
204
R&S® ZVL
GUI Reference
Channel Menu
Cal Kits
•
Opens a dialog to manage the calibration kits in use, add new kits and import or export kits.
Calibration kits
A calibration kit is a set of physical calibration standards for a particular connector type. The magnitude
and phase response of the calibration standards (i.e. their S-parameters) must be known or predictable
within a given frequency range.
The standards are grouped into several types (open, through, match,...) corresponding to the different
input quantities for the analyzer's error models. The standard type also determines the equivalent circuit
model used to describe its properties. The circuit model depends on several parameters that are stored in
the cal kit file associated with the calibration kit.
As an alternative to using circuit models, it is possible to describe the standards by means of S-parameter
tables stored in a file.
The analyzer provides a large number of predefined cal kits but can also import cal kit files and create new
kits:
•
A selection of predefined kits with different types of parameters is available for all connector types.
The parameters of these kits are displayed in the Add/Modify Standards dialog, however, it is not
possible to change or delete the kits.
•
Imported and user-defined kits can be changed in the Calibration Kits dialog and its various subdialogs.
Calibration kits and connector types are global resources; the parameters are stored independently and
available irrespective of the current setup.
The Calibration Kits dialog contains a series of buttons, each of them opening a dialog:
•
Import Kit imports a cal kit file containing the parameters for a new calibration kit. It is possible to
load several kits, so the analyzer asks whether to set the imported calibration kit active.
•
Add Kit combines different standards to form a new calibration kit.
•
View/ Modify Kit adds or deletes standards in an imported or user-defined calibration kit and/or
changes their parameters.
•
Copy Kit to... creates a copy of the selected calibration kit. The cal kit data is stored in the internal
Operating Manual 1303.6580.32-01
205
R&S® ZVL
GUI Reference
Channel Menu
memory and can be exported to a cal kit file using Export Kit.
•
Delete Kit removes an imported or user-defined kit from the list of Calibration Kits in Use.
•
Export Kit exports calibration kit data to a cal kit file.
•
Avail Conn Types adds or deletes connector types.
The Calibration Kits in Use: table is used to select a calibration kit for each connector type. The pull-down
lists contain all kits for the individual connector types.
Remote control: [SENSe<Ch>:]CORRection:CKIT:<conn_type>:SELect
'<ckit_name>'
[SENSe<Ch>:]CORRection:CKIT:SELect '<conn_type>', '<ckit_name>'
Cal Kit Parameter Types
The analyzer uses three types of parameters to describe the calibration standards. The parameter type is
the same for all standards in a kit and therefore annexed to the kit name:
•
Universal parameters (no label) describe calibration kit models with highly standardized
components so that the parameters are valid for all calibration kits of the model.
•
Typical parameters (labelled typical) approximately describe a calibration kit model. To
correct for deviations between the standards, each kit of the model is individually
measured and delivered with an additional, kit-specific parameter set. Therefore each
typical parameter set <kit_name> typical is complemented by an additional
parameter set <kit_name> containing optimized parameters for an individual kit.
•
Ideal parameters (labelled Ideal Kit) describe an idealized calibration kit for each
connector type; see below.
Make sure to use universal or individual parameter sets if you need to obtain high-precision
results. The precision of the calibration kit parameters determine the accuracy of the system
error correction and of the measurements. The calibration wizard displays a warning if you
use a typical or ideal parameter set to calibrate a channel.
Calibration kits can be obtained as network analyzer accessories; refer to the data sheet for the relevant
ordering information. The name of all parameter sets is equal to the name of the corresponding calibration
kit model.
Ideal parameters
All ideal kits contain the following standards:
Standard (Gender)
R (Load)
Ω
Open (f, m)
Short (f, m)
0Ω
Operating Manual 1303.6580.32-01
Electrical Length
(Offset)
0 mm (Delay: 0 s)
0 mm
206
R&S® ZVL
GUI Reference
Channel Menu
Offset Short (f, m)
0Ω
10 mm
Match (f, m)
Z0 (reference impedance of the
connector type)
0 mm
Sliding Match (f, m)
–
0 mm
Ω
Reflect (f, m)
0 mm
Through (ff, mm, mf)
–
0 mm
Line (ff, mm, mf)
–
10 mm
Attenuation (ff, mm , mf)
–
0 mm
Symm. Network (ff, mm, mf)
–
0 mm
The following additional parameters are used:
•
Characteristic impedance: Z0 (reference impedance of the connector type)
•
Loss: 0 dB / sqrt(GHz) (0 GΩ / s)
•
All inductance and capacitance parameters are set to zero.
Cal Kit Files
Calibration kit files can be used to store the parameters of a particular calibration kit, to reuse the data and
to exchange calibration kits from one network analyzer to another.
Cal kit file contents
Cal kit files are independent of the current setup and contain the following information:
•
Name and label of the calibration kit
•
Connector type including all connector type parameters (name, polarity, offset model, reference
impedance)
•
Type, gender and label of all standards in the kit together with the circuit model parameters
(offsets, load) or S-parameter tables (.snp file) that are necessary to determine its magnitude and
phase response.
•
To export cal kit data, the analyzer uses a specific binary file format *.calkit.
•
Three different import file formats are supported: ZVL-specific binary cal kit files (*.calkit), ZVRspecific binary cal kit files (*.ck), cal kit files in Agilent-specific ASCII formats (*.csv, *.prn; see
notes below).
By default cal kit files are stored in the C:\Rohde&Schwarz\NWA\Calibration\Kits directory.
To import a ZVL-specific or ZVR-specific cal kit file (*.ck or *.calkit) you can also use the
Windows Explorer and simply double-click the file or drag and drop the file into the NWA
application. The imported cal kit file is automatically set active.
Importing older ZVR cal kit files
On loading some older ZVR-specific *.ck files, e.g. the ZV-Z23 cal kit
file, the ZVL generates the message File does not comply with
instrument calibration kit file format. The files must be converted using
a ZVR network analyzer equipped with a firmware version V3.52 or
higer. Proceed as follows:
1. On the ZVR, press CAL – CAL KITS – MODIFY KITS –
Operating Manual 1303.6580.32-01
207
R&S® ZVL
GUI Reference
Channel Menu
INSTALL NEW KIT to import the *.ck file.
2. Press CREATE INST FILE in the same submenu to export
the *.ck file in a ZVL-compatible format.
3. Import the converted file into the ZVL.
*.csv cal kit files: VNA Cal Kit Manager 2.1
The VNA Cal Kit Manager is a free, Windows-based software tool
intended to import, edit, and export *csv cal kit files. The software is
available for download at http://www.vnahelp.com/products.html. The
decimal separator used by the VNA Cal Kit Manager V2.1 depends on
the language version of the Windows operating system: Cal kit files
generated on an English operating system contain dots, the ones
generated on a German system contain commas.
The network analyzer expects the dot as a separator and displays an
error message when a *.csv file with commas is loaded. Please install
the VNA Cal Kit Manager V2.1 on an appropriate (e.g. Englisch)
Windows version to avoid trouble.
*.prn cal kit files: PNA Cal Kit Editor
The network analyzer can import and process cal kit files created with
the PNA Cal Kit Editor. The files use the extension *.prn; the data
format is identical to the *.csv format.
The decimal separator used by the PNA Cal Kit Editor depends on the
language version of the Windows operating system: Cal kit files
generated on an English operating system contain dots, the ones
generated on a German system contain commas.
The network analyzer expects the dot as a separator and displays an
error message when a *.prn file with commas is loaded. Please install
the PNA Cal Kit Editor on an appropriate (e.g. Englisch) Windows
version to avoid trouble.
Remote control:
MMEMory:LOAD:CKIT "file_name"
MMEMory:STORe:CKIT "kit_name", "file_name"
[SENSe<Ch>:]CORRection:CKIT:INSTall "<file_name>"
Add or View / Modify Calibration Kit
Combines different standards to form a new calibration kit, assigning a connector type and further
attributes (name, labels). This dialog is opened from the Calibration Kits dialog: If the Add Kit... button is
selected, the dialog title is Add Calibration Kit; if the View / Modify Kit... button is selected, the dialog title is
View / Modify Calibration Kit. The functionality of both dialog versions is the same.
If Add Kit is used for a predefined calibration kit, the View / Modify Standard... button can be
used to open the View / Modify Standard in <kit_name> dialog check the standard
parameters. All other controls are inactive.
Operating Manual 1303.6580.32-01
208
R&S® ZVL
GUI Reference
Channel Menu
In its upper part the Add or View / Modify Calibration Kit dialog contains several controls to do the
following:
•
Select a predefined or user-defined Connector Type.
•
Insert the (unique) Name of the new kit and assign a Label.
•
Qualify whether or not the Offset and Load parameters for the standards are defined and
displayed in Agilent Mode.
Assigning a label to user-defined calibration kits is optional. However, the label is displayed in
many dialogs and can provide useful information about the kit, e.g. its serial number.
The table in the center of the dialog lists all standards in the new kit together with either their gender or
their port assignment (see Restrict Port Assignment) and the label (if defined). Clicking a standard opens
the View / Modify Standard in <kit_name> dialog where it is possible to change the parameters. Four
buttons can be used to change the entries in the list.
•
Copy Standards from... opens a dialog to copy standards from another calibration kit to the new
kit.
•
Add Standard... selects, defines and adds a new standard to the kit. A calibration kit may only
contain a single standard of each type.
•
View / Modify Standard... displays or changes the properties of the selected standard.
•
Delete Standard removes the selected standard from the list and from the calibration kit.
Use Copy Standards from... to avoid the (re-)definition of their properties. Standards are
copied together with their parameters and their label, which you can modify once they belong
to the new kit.
Copy Standards from
Copies standards together with their parameters from a calibration kit in use to a new calibration kit. This
dialog is opened from the View Calibration Kit dialog (Copy Standards from... button).
Operating Manual 1303.6580.32-01
209
R&S® ZVL
GUI Reference
Channel Menu
In the dialog, it is possible to select one of the calibration kits in use (Kit Name) and select either all or a
single standard to be copied. A calibration kit may only contain a single standard of each type.
Available Connector Types
Displays and modifies the list of available connector types. This dialog is opened from the Calibration Kits
dialog (Avail Conn Types... button).
The list shows the available connector types with their name (Conn Type), polarity (Sexless) and
reference impedance (Ref Imp). The Offset Model describes the mode of wave propagation in the
transmission lines of the standards associated with the connector type. The buttons below are used to add
and delete user-defined connector types. Deleting a connector type will also delete all calibration or
adapter kits assigned to it.
Impact of reference impedance
The reference impedance (Ref Imp) Z0 for the connectors is a critical value that represents an input value
for various parameter conversions. Z0 enters into:
•
The calculation of the S-parameters for the calibration standards associated with the connector
type, provided that they are derived from a circuit model (Add/Modify Standard dialog).
•
The calculation of impedance and admittance parameters.
Operating Manual 1303.6580.32-01
210
R&S® ZVL
GUI Reference
Channel Menu
Storing connector type settings
Calibration kits and connector types are global resources; the parameters are stored independently and
available irrespective of the current setup. The connector type settings are always stored together with the
associated calibration kit parameters. It is possible to export and import the connector settings using
Export Kit... and Import Kit... in the Calibration Kits dialog.
The name, polarity and reference impedance of a user-defined connector can be changed in the table.
The
button in the Offset Model column opens the Offset Model dialog to define the propagation mode
in detail.
After assigning a calibration or adapter kit to a user-defined connector type, you can still
change its name, offset model and reference impedance. Switching between sexed and
sexless will delete all kits assigned to the connector type.
Remote control:
[SENSe<Ch>:]CORRection:CONNection
[SENSe<Ch>:]CORRection:CONNection:DELete
Offset Model Dialog
Defines the mode of wave propagation in the lines of the standards associated with the connector type.
This dialog is opened from the Available Connector Types dialog (
button in the table).
The Parameters to be selected depend on the Line Type:
•
If the calibration kit standards contain lines with transverse electric propagation mode (TEM), then
the Relative Permittivity εr of the dielectric can be defined. The default permittivity is the value for
air. TEM-type lines have not cutoff frequency.
•
If the calibration kit standards contain waveguides, then the lowest frequency where a wave
propagation is possible (Cutoff Frequency fc) can be defined. The default cutoff frequency if 0 Hz
(propagation at all frequencies). No relative permittivity is needed for waveguides.
The impedance for waveguides is frequency-dependent. If a waveguide line type is selected,
various dialogs (e.g. Add Standard...) will indicate varies instead of a definite impedance
value.
Impact of offset model parameters
The offset model parameters are used for the calculation of the S-parameters for the calibration standards
Operating Manual 1303.6580.32-01
211
R&S® ZVL
GUI Reference
Channel Menu
associated with the connector type, provided that they are derived from a circuit model (Add/Modify
Standard dialog).
•
For TEM-type lines, the relative permittivity εr is needed for the conversion of and ZVR-type Loss
(in units of dB/sqrt(GHz)) into an Agilent-type Offset Loss (in units of GΩ/s) and vice versa (see
Offset andLoad parameters). The Electrical Length and Delay values in the Modify Offset dialog
are directly entered and therefore independent of εr.
•
For waveguides, the low frequency cutoff frequency fc is important because no wave propagation
is possible at frequencies below fc. If a standard is measured in order to acquire calibration data,
the analyzer checks the low frequency cutoff. If the start frequency of the sweep range is below fc ,
then the calibration wizard generates and error message.
The offset model parameters are not used except in the context of calibration. The offset
parameterdefinitions (seeMechanical Length) are based on independent εrvalues.
Remote control:
[SENSe<Ch>:]CORRection:CONNection
Add or View / Modify Standard
Defines, displays or modifies the properties of the calibration standards in a particular calibration kit. This
dialog is opened from the Add or View / Modify Calibration Kit dialog (Add Standard... or View / Modify
Standard... buttons). Depending on the title, some control elements may not be active.
For an overview of calibration standards and their properties refer to section Calibration standard
types below.
In its upper part the Add Standard or View / Modify Standard dialog contains several controls to do the
following:
Operating Manual 1303.6580.32-01
212
R&S® ZVL
GUI Reference
Channel Menu
•
Select a standard Type and its Gender (for polarized/not sexless connector types and if the port
assignment is not restricted) and assign a Label.
•
Restrict Port Assignment
•
Select S-Params From
Qualify whether the standard is described by a Circuit Model from which the analyzer can calculate the Sparameters or by a table of measured or simulated S-parameters stored in a Touchstone file. Pressing the
Read Data from File... button opens a file selection dialog where the appropriate file type (*.s1p for oneport standards and *.s2p for two-port standards) is automatically selected.
The Sliding Match and Attenuation are special standard types which must be described by a
circuit model. The controls in the S-Params From panel are disabled.
For two-port standards described by a *.s2p file, the implicit ports 1 and 2 (given by the order of Sparameters Re(S11) Im(S11) Re(S21) Im(S21) Re(S12) Im(S12) Re(S22) Im(S22) in the file) are
assigned to the test ports that the analyzer actually calibrates as follows: Port 1 is always assigned to the
lower-numbered calibrated test port, port 2 to the other (higher-numbered) calibrated test port.
Assigning a label to standards is optional. However, the label is displayed in many dialogs
and can provide useful information about the standard, e.g. its serial number.
If Circuit Model is selected in the S-params From panel, then the controls in the central panel of the dialog
are enabled. The circuit diagram is adjusted to the selected standard type. The following parameters can
be set:
•
Frequency range (Min. Freq. to Max. Freq) for which the circuit model is valid. During calibration,
the analyzer checks whether the sweep range is contained in the validity range of all measured
standards and possibly generates a warning (see Measure Standards dialog).
•
Offset and Load parameters of the circuit model.
The impedance for waveguides is frequency-dependent. If a waveguide line type is selected
in the Offset Model dialog, the circuit model indicates varies instead of a definite impedance
value.
Remote
control:
[SENSe<Ch>:]CORRection:CKIT:<std_type>
[SENSe<Ch>:]CORRection:CKIT:<conn_type>:<std_type>
MMEMory:LOAD:CKIT:SDATa
Restrict Port Assignment
Opens a dialog to define whether the standard can be connected to any port of the analyzer or to just one
port (for one-port standards) or a pair of ports (for two-port standards).
Operating Manual 1303.6580.32-01
213
R&S® ZVL
GUI Reference
Channel Menu
The port assignment is displayed in the Add or View / Modify Calibration Kit dialogs.
Port assignment and gender
The standards are handled differently, depending on their port assignment:
•
If the port assignment is not restricted, the gender belongs to the definition of polarized standards.
When the connector type and calibration kit is selected in the calibration wizard, the analyzer
checks whether the kit contains the necessary standard types and whether the standards have
the right gender.
•
Standards with restricted port assignment are assumed to have the right gender (the one required
for this port). In the View Modify Standard dialog, the Gender: input field is disabled. In the
calibration wizard, the analyzer checks whether the kit contains the necessary standard types for
the required ports. Instead of the gender, the port assignment is stored in the calibration kit file.
This approach simplifies the definition of standards and helps to avoid inconsistencies.
Remote control:
[SENSe<Ch>:]CORRection:CKIT:<std_type>
Modify Offset
Specifies the offset parameters for the transmission lines of a particular calibration standard. This dialog is
opened from the Add or View / Modify Standard... dialog (Modify Offset... button).
The offset parameters depend on whether or not the circuit model is defined in Agilent Mode (see
Add/Modify Calibration Kit dialog):
•
If Agilent Mode is active, then the standard is characterized by its Delay (in s), its characteristic
impedance Z0 (in Ω) and its Offset Loss (in GΩ/s).
•
If Agilent Mode is switched off, then the standard is characterized by the ZVR-compatible
parameters Electrical Length (in m), its Char. Impedance (in Ω) and its Loss (in dB/sqrt(GHz)).
The loss is zero and not editable as long as the electrical length is zero.
Both parameter sets are closely related. The Electrical Length is proportional to the Delay; Z0 corresponds
to the Char. Impedance. Moreover the analyzer converts an Agilent-type Offset Loss into a ZVR-type Loss
and vice versa using the Relative Permittivity εr for the connector type defined in the Offset Model... dialog.
Offset parameters
Operating Manual 1303.6580.32-01
214
R&S® ZVL
GUI Reference
Channel Menu
The offset parameters have the following physical meaning:
•
The Delay is the propagation time of a wave traveling through the standard. The Electrical Length
is equal to the Delay times the speed of light in the vacuum and is a measure for the length of
transmission line between the standard and the actual calibration plane. For a waveguide with
permittivity εrand mechanical length Lmech the following relations hold:
The default delay is 0 s, the default step width is 1 ns, corresponding to a step width of 299.792 mm for
the electrical length. The relations hold for one-port and 2-port standards.
•
Z0 is the Characteristic Impedance of thestandard. If the standard is terminated with Z0, then its
input impedance is also equal to Z0. Z0is not necessarily equal to the reference impedance of the
system (depending on the Connector Type) or the terminal impedance of the standard. The
characteristic impedance of the standard is only used in the context of calibration.
The default characteristic impedance is equal to the reference impedance of the system.
•
The Loss is the energy loss along the transmission line due to the skin effect. For resistive lines
and at RF frequencies the loss is approximately proportional to the square root of the frequency.
In Agilent mode the Offset Loss is expressed in units of Ω/s at a frequency of 1 GHz. The following
formula holds:
To determine an offset loss value experimentally, measure the delay in seconds and the loss in dB at 1
GHz and use the formula above.
The default Loss or Offset Loss is zero.
The impedance for waveguides is frequency-dependent. If a waveguide line type is selected
in the Offset Model dialog, the Char. Impedance field is disabled and indicates "varies"
instead of a definite impedance value. Moreover no Loss or Offset Loss can be set.
Offset parameters and standard types
Offset parameters are used to describe all types of standards except the Sliding Match and the
Attenuation.
•
The Sliding Match is a one-port standard with variable load parameters (sliding load) and
unspecified length. The reference impedance is fixed and equal to the characteristic impedance of
the connector type. No load and offset parameters need to be set.
•
The Attenuation is a two-port standard which is fully matched in both directions (the reflection
factor at both ports is zero). No load and offset parameters need to be set.
Remote
control:
[SENSe<Ch>:]CORRection:CKIT:<conn_type>:<std_type>
Modify Load
Specifies the load parameters for a particular calibration standard describing its terminal impedance. This
Operating Manual 1303.6580.32-01
215
R&S® ZVL
GUI Reference
Channel Menu
dialog is opened from the Add or View / Modify Standard... dialog (Modify Load... button).
The circuit model for the load consists of capacitance C which is connected in parallel to an inductance L
and a resistance R, both connected in series.
•
R is the constant resistive contribution. It is possible to select a special value (Open for
Ω so
that the inductance coefficients are irrelevant, Short for 0 Ω, Match for the reference impedance of
the current connector type) or set any resistance R.
•
The fringing capacitance C and the residual inductance L are both assumed to be frequencydependent and approximated by the first four terms of the Taylor series around f = 0 Hz.
Load parameters and standard types
Load parameters are used to describe all types of standards except a Through, a Sliding Match, aLineand
an Attenuation.
•
The Through standard is a through-connection between two ports with minimum loss which is
taken into account by the Offset Parameters.
•
The Sliding Match is a one-port standard with variable load parameters (sliding load), so there is
no fixed load model.
•
The Line standard is a line of variable length with minimum loss which is taken into account by the
Offset Parameters.
•
The Attenuation is a two-port standard which is fully matched in both directions (the reflection
factor at both ports is zero). No load and offset parameters need to be set.
Remote
control:
[SENSe<Ch>:]CORRection:CKIT:<conn_type>:<std_type>
Calibration Standard Types
The following table gives an overview of the different standards and their offset and load models:
Standard
Type
Characteristics
Open
Open circuit (one-port)
Short
Short circuit (one-port)
Operating Manual 1303.6580.32-01
Ideal Standard
Offset
Model
Load
Model
Ω
0Ω
216
R&S® ZVL
GUI Reference
Channel Menu
Offset short
Short circuit with added electrical
length offset, for waveguide
calibration (one-port)
0Ω
Match
Matched broadband termination
(one-port)
Z0 (reference
impedance of the
connector type)
Sliding
match
One-port standard consisting of an
air line with a movable, lowreflection load element (sliding
load). .
–
Reflect
Unknown mismatched standard
(one-port)
Through
Through-connection with minimum
loss (two-port)
–
–
Line1, Line
2
Line(s) for TRL calibration with
minimum loss (two-port)
–
–
Attenuation
Fully matched standard in both
directions (two-port; the reflection
factor at both ports is zero).
–
Symm.
network
Unknown mismatched reflectionsymmetric standard (two-port)
–
–
Ω
–
For
an
overview
of
standard
parameters
[SENSe<Ch>:]CORRection:CKIT:<conn_type>:<std_type>
Remote
control:
–
–
see
also
Sweep
The Sweep submenu defines the scope of measurement in the current channel. This includes the sweep
type with various parameters, the trigger conditions the periodicity of the measurement, and the sweep
average.
Sweeps
A sweep is a series of consecutive measurements taken over a specified sequence of stimulus values. It
represents the basic measurement cycle of the analyzer.
The analyzer can perform sweeps at constant power but variable frequency (frequency sweeps); see
Sweep Type.
The sweeps are further specified by the number of measurement points, the total measurement time and
the trigger mode. A measurement may consist of a single sweep or a series of sweeps repeated
continuously.
On the other hand, depending on the measurement task and the measured quantity, the measurement at
each point can consist of several partial measurements with definite hardware settings.
Operating Manual 1303.6580.32-01
217
R&S® ZVL
GUI Reference
Channel Menu
The Sweep menu provides the following settings:
•
Sweep Type defines the sweep variable (frequency/power/time) and the position of sweep points
in the sweep range.
•
Number of Points sets the total number of measurement points over the sweep range.
•
Frequency Step Size sets the distance between two consecutive frequency sweep points.
•
Meas Delay delays the start of each sweep.
•
Restart aborts the current measurement and restarts a new sweep sequence.
•
If Single (All Chans) is selected the measurement is terminated after a single sweep or a group of
single sweeps defined in the Define Restart dialog.
•
Define Restart opens a dialog to specify how many sweeps are repeated.
•
Average On activates or de-activates the sweep average. With average on the measurement
results are averaged over a selected number of consecutive sweeps (Average Factor).
•
Average Factor defines the number of consecutive sweeps to be averaged.
•
Restart Average starts a new average cycle, clearing all previous results and thus eliminating their
effect on the new cycle. The new cycle is started as fast as possible; an ongoing sweep is
terminated immediately.
Sweep Type
The Sweep Type submenu defines the frequency sweep type and the position of the sweep points across
the sweep range.
Operating Manual 1303.6580.32-01
218
R&S® ZVL
GUI Reference
Channel Menu
•
Lin Frequency is the default sweep type. The stimulus frequency is swept in equidistant steps
over the continuous frequency range. In a Cartesian diagram, the x-axis is a linear frequency axis.
•
Log Frequency is analogous to Lin. Frequency, however, the frequency is swept in equidistant
steps on a logarithmic scale. In a Cartesian diagram, the x-axis is a logarithmic frequency axis.
•
Segmented Frequency is analogous to Lin. Frequency but uses a sweep range that can be
composed of several continuous frequency ranges or single frequency points defined via Define
Segments. A valid segment list must be defined before activating Segment Frequency.
Lin Frequency
In a Lin. Frequency sweep the stimulus frequency is swept in equidistant steps over the continuous
frequency range. The frequency range (sweep range) is defined with the Stimulus settings. The step width
between two consecutive sweep points is constant and given by <Span>/(n - 1) where n is the specified
Number of Points (n > 1). The internal generator power can be set, if so desired, in the Power Bandwidth
Average submenu.
A Lin. Frequency sweep corresponds to the analysis of a signal over the frequency, as obtained e.g. by
means of a spectrum analyzer. This is the default sweep type. In a Cartesian diagram the measurement
result is displayed as a trace over a linear frequency scale (spectral representation). The following
example shows a Lin. Frequency sweep with a stimulus range between 4.5 GHz and 6 GHz, the forward
transmission parameter S12 as measured quantity, and a dB Mag scaled y-axis.
Operating Manual 1303.6580.32-01
219
R&S® ZVL
GUI Reference
Channel Menu
Remote control:
[SENSe<Ch>:]SWEep:TPYE
[SENSe<Chn>:]FUNCtion[:ON] "XFRequency:..."
LINear
Log Frequency
In a Log. Frequency sweep the stimulus frequency is swept on a logarithmic scale over the continuous
frequency range. The frequency range (sweep range) is defined with the Stimulus settings. The sweep
points are calculated from the Span and the specified Number of Points (n > 1) with the condition that the
step width is constant on the logarithmic scale. The internal generator power can be set, if so desired, in
the Power Bandwidth Average submenu.
Log Frequency sweeps are suitable for the analysis of a DUT over a large frequency range, e.g. over
several octaves. In a Cartesian diagram the measurement result is displayed as a trace over a logarithmic
frequency scale. The following example shows a Log. Frequency sweep with a stimulus range between 50
MHz and 6 GHz, the forward transmission parameter S12 as measured quantity, and a dB Mag scaled yaxis
Remote control:
[SENSe<Ch>:]SWEep:TPYE
[SENSe<Chn>:]FUNCtion[:ON] "XFRequency:..."
LOGarithmic
Segmented Frequency
In a Segmented Frequency sweep the sweep range can be composed of several continuous, non-
Operating Manual 1303.6580.32-01
220
R&S® ZVL
GUI Reference
Channel Menu
overlapping frequency sub-ranges or single frequency points. The sub-ranges are termed sweep
segments and defined in the Define Segments dialog. The segment list must contain at least 2 distinct
frequency points before a Segmented Frequency sweep can be started.
Instrument settings such as the internal generator power, the measurement (IF) bandwidth, the selectivity
of the measurement filter, the frequency band of the local oscillator, and the measurement time can be set
independently for the individual segments.
Due to this flexibility Segmented Frequency sweeps are suitable for any detailed analysis of a DUT at
specified frequencies. In a Cartesian diagram the measurement result is displayed as a trace over a linear
frequency scale ranging from the lowest to the highest frequency point of all segments. The following
example shows a Segmented Frequency sweep with 3 segments in the stimulus range between 50 MHz
and 6 GHz, the forward transmission parameter S12 as measured quantity, and a dB Mag scaled y-axis.
In the frequency ranges between the sweep segments the trace is displayed as a straight line.
Remote control:
[SENSe<Ch>:]SWEep:TPYE
[SENSe<Chn>:]FUNCtion[:ON] "XFRequency:..."
SEGMent
Define Segments
Opens a dialog to define all channel settings for a Segmented Frequency sweep and to import and export
segmented sweep settings.
Operating Manual 1303.6580.32-01
221
R&S® ZVL
GUI Reference
Channel Menu
The Define Segments dialog contains a table to edit the individual segments of the sweep range. Sweep
segments must not overlap, however, two adjacent segments can have one common point; see Columns
in the Define Limit Line table.
Below the table, three groups of controls provide additional settings. Refer to the following sections below:
•
Inserting and Deleting Segments
•
Individual Settings
•
Point List, Segment Import and Export
Columns in the Define Limit Line table
The table contains an automatically assigned current number for each segment plus the following editable
or non-editable columns:
•
On provides check boxes to activate or deactivate each individual segment. Sweep points
belonging to inactive segments only are not measured and not listed in the Point List.
•
Start is the stimulus (x-axis) value of the first point of the segment. If the segment contains more
than one Point, then Start must be smaller than the Stop value. If a Start value equal to or larger
than the current Stop value is set, Stop is adjusted to the new Start value plus 1 Hz.
•
Stop is the stimulus (x-axis) value of the last point of the segment. If the segment contains more
than one Point, then Stop must be larger or equal than the Start value. If a Stop value equal to or
smaller than the current Start value is set, Start is adjusted to the new Stop value minus 1 Hz.
•
Points is the number of sweep points in the segment. A single segment can consist of only one
point, however, the entire sweep range must contain at least 2 distinct frequency points. If Points
is set to 1, then the Stop frequency is set equal to the Start frequency.
•
The remaining columns show the channel settings for each segment. They are displayed only if
they are selected in the Individual Segment Settings panel.
Operating Manual 1303.6580.32-01
222
R&S® ZVL
GUI Reference
Channel Menu
When a new segment is defined or when the stimulus range of a segment is modified, the
analyzer automatically checks whether it is compatible with the existing segments. The Start
and Stop values of the existing segments are modified so that there is no overlap between
any of the segments. If this is not possible (e.g. because of the limited frequency range of the
analyzer), the entry of the new Start or Stop value is denied.
Use the paste marker list for convenient entry of Start and Stop values.
Remote control:
The commands in the [SENSe<Chn>:]SEGMent...
define all sweep segment settings.
subsystem
Inserting and Deleting Segments
Three buttons on the left side below the table in the Define Segments dialog extend or shorten the
segment list:
•
Insert New Segment
adds a new segment to the list. The new segment is inserted after the active segment. The segment
numbers (#) of all segments after the new segment are adapted.
To avoid overlapping segments, the new segment ranges from the Stop value of the previously active
segment to either the Start valueof the next segment or the maximum frequency of the analyzer. The
analyzer places no restriction on the number of segments in a sweep range.
•
Delete Segment removes the selected segment from the list.
•
Del All Segments clears the entire segment list so it is possible to define or load a new
segmented sweep range.
Remote control:
[SENSe<Chn>:]SEGMent<Seg>:INSert
[SENSe<Chn>:]SEGMent<Seg>:DELete
[SENSe<Chn>:]SEGMent<Seg>:DELete:ALL
Individual Settings
The options in the Individual Settings panel can be used to vary the channel settings of every individual
segment in the list.
The first sweep segment is created with the channel settings defined for general sweep types. When any
further sweep segment created, it uses the channel settings of the previously active segment. Each
selected (checked) option adds a column to the segment list.
•
Name adds a column to assign a name to each segment. A segment name is a string
Operating Manual 1303.6580.32-01
223
R&S® ZVL
GUI Reference
Channel Menu
that may contain letters, numbers and special characters.
•
Power defines the internal source Power for each individual sweep segment.
•
Meas Bandwidth defines the Meas Bandwidth for each individual sweep segment.
•
Selectivity defines the Selectivity of the IF filter used for each sweep segment.
•
MeasDelay sets a delay time allowing the DUT to settle before the hardware settings
of the analyzer are changed and a new partial measurement is started.
Remote control:
[SENSe<Chn>:]SEGMent<Seg>:POWer[:LEVel]
[SENSe<Chn>:]SEGMent<Seg>:BWIDth[RESolution]
[SENSe<Chn>:]SEGMent<Seg>:DEFine
[SENSe<Chn>:]SEGMent<Seg>:INSert
[SENSe<Chn>:]SEGMent<Seg>:SWEep:TIME
[SENSe<Chn>:]SEGMent<Seg>:SWEep:DWELl
Point List, Segment Import and Export
The buttons on the right side below the table in the Define Segments dialog are used to retrieve the
position of the defined sweep points import and export limit line data.
•
Show Point List
opens a list of all active sweep points and their channel settings.
Points in inactive sweep segments (i.e. segments that are not switched On in the segment table) are not
shown. The table provides a check of the settings made and can not be edited.
•
Import Segment List... calls up an Open File dialog to load a sweep segment list from a
sweep segment file. Sweep segment files are ASCII files with the default extension
*.seglist and a special file format.
•
Export Segment List... calls up a Save As... dialog to store the current sweep segments
to a sweep segment file. Sweep segment files are ASCII files with the default
extension *.seglist and a special file format.
To import a segment list file (*.seglist) you can also use the Windows Explorer and simply
double-click the file or drag and drop the file into the NWA application. You must enable the
segmented sweep separately.
Operating Manual 1303.6580.32-01
224
R&S® ZVL
GUI Reference
Channel Menu
Remote control:
MMEMory:LOAD:SEGMent
<Ch_no>,"file_name"
MMEMory:STORe:SEGMent <Ch_no>,"file_name"
File Format for Sweep Segments
The analyzer uses a simple ASCII format to export sweep segment data. By default, the sweep segment
file extension is *.seglist. The file starts with two comment lines containing the version and a third line
reproducing the header of the segment list. The following lines contain the entries of all columns of the
segment list, including the Individual Segment Settings that may be actually hidden.
Example of a sweep segment file
The segmented sweep range:
is described by the following sweep segment file:
The sweep segment file actually contains more columns listing all channel settings of the
individual sweep segments. The headings of the additional columns read:
Source Power [dBm]; IF Bandwidth [Hz]; enIF Selectivity; en IF Sideband; Meas Delay [µs];
boSweep Time Auto;
Number of Points
Sets the total number of measurement points per sweep. The minimum number of points is 2.
Together with the sweep range defined with the Stimulus settings, this parameter defines the grid of
sweep points. The sweep points are equidistantly distributed over the entire sweep range: The step width
between two consecutive sweep points is constant on a linear scale (sweep type Lin. Frequency) or on a
logarithmic scale (sweep types Log. Frequency and Power).
In Segmented Frequency sweeps, the number of points can be set independently for each segment; see
Define Segments.
As an alternative to the Number of Points, the Stimulus Step Size can be set.
Measurement time and screen resolution
A large number of points improves the resolution of the trace but increases the measurement time.
Operating Manual 1303.6580.32-01
225
R&S® ZVL
GUI Reference
Channel Menu
The overall measurement time is composed of a hardware settling time at the beginning of the sweep plus
the sum of the measurement times at each individual sweep point. This implies that the measurement time
increases roughly linearly with the number of points.
After changing the channel settings or selecting another measured quantity, the analyzer
needs some time to initialize the new sweep. This preparation period increases with the
number of points and the number of partial measurements involved. It is visualized by a
Preparing Sweep symbol in the status bar:
All analyzer settings can still be changed during sweep initialization. If necessary, the
analyzer terminates the current initialization and starts a new preparation period.
Remote control:
[SENSe<Ch>:]SWEep:POINts
Frequency Step Size
Sets the distance between two consecutive frequency sweep points.
The step size is an alternative to the Number of Points setting:
•
If the sweep range is defined by means of the Start and Stop variables, both the Stop value and
the Number of Points can vary as the Stimulus Step Size is changed. The Stop value is changed
as little as possible so that the condition Stimulus Step Size = (Stop – Start) / (Number of Points –
1) can be fulfilled. Changing the Start and Stop values modifies the Stimulus Step Size.
•
If the sweep range is defined by means of the Center and Span variables, both the Span value
and the Number of Points can vary as the Stimulus Step Size is changed. The Span is reduced as
little as possible so that the condition Stimulus Step Size = (Stop – Start) / (Number of Points – 1)
can be fulfilled. Changing the Span modifies the Stimulus Step Size.
This setting is valid for linear frequency sweeps only. It does not apply to logarithmic and
segmented sweeps. Increasing the Frequency Step Size generally increases the
measurement time.
Remote control:
[SENSe<Ch>:]SWEep:STEP
Meas Delay
Sets the delay time before the start of each partial measurement.
A measurement delay time increases the accuracy, in particular in measurements on DUTs with long
settling times (e.g. quartzes, SAW filters).
Remote control:
[SENSe<Ch>:]SWEep:DWELl
Operating Manual 1303.6580.32-01
226
R&S® ZVL
GUI Reference
Channel Menu
Restart
Stops the current measurement and restarts a measurement sequence. In Single sweep mode a new
single sweep sequence is started.
Remote control:
INITiate<Ch>[:IMMediate]
Single (All Chans)
Toggles between single sweep and continuous sweep mode.
•
In continuous mode (Single (All Chans) not selected), the analyzer measures continuously,
repeating the current sweep.
•
In single sweep mode, the measurement is stopped after the number of sweeps selected in the
Define Restart dialog.
Press Single to activate the single sweep mode and start a single sweep sequence. To start
further sweep sequences press Restart.
Remote control:
INITiate<Ch>:CONTinuous ON | OFF
Define Restart
Opens a dialog to configure the Single sweep mode.
•
Number of Sweeps selects the number of sweeps to be measured in single sweep mode: either
one (Single Sweep) or a group of consecutive sweeps.
•
Scopesindicates that the active sweep mode (single or continuous) and the Number of Sweeps
are valid for All Channels in the active setup. The number of sweeps in the single sweep
sequence is equal to the selected Number of Sweeps times the number of channels. The
sequence starts with the first sweep in channel no. 1.
In remote control, it is possible to retrieve the results acquired in any of the sweeps within a
single sweep group; see Sweep History.
Remote control:
[SENSe<Ch>:]SWEep:COUNt
Operating Manual 1303.6580.32-01
227
R&S® ZVL
GUI Reference
Channel Menu
Average Factor
Opens the numeric entry bar to define the number of consecutive sweeps to be averaged.
An average over several sweeps reduces the influence of random effects in the measurement and
therefore minimizes the noise level. The effect increases with the average factor, however, obtaining an
averaged result requires several sweeps and therefore increases the measurement time.
The average factor is also valid for calibration sweeps: The calculation of system correction
data is based on the averaged trace.
Smoothing is an alternative method of compensating for random effects on the trace by
averaging adjacent measurement points. Compared to the sweep average, smoothing does
not significantly increase the measurement time but can eliminate narrow peaks and thus
produce misleading results.
The sweep average is not frequency selective. To eliminate a spurious signal in the vicinity of the
measurement frequency, alternative techniques (e.g. a smaller filter bandwidth) must be used.
Calculation of sweep average
The average trace is obtained as follows:
Let c be the Average Factor and assume that n sweeps have been measured since the start of the
average cycle (start of the measurement or Restart Average). The following two situations are
distinguished:
•
n < c: At each sweep point, the average trace no. n is calculated from the average trace no. n – 1
and the current trace no. n according to the following recurrence:
The average trace represents the arithmetic mean value over all n sweeps.
•
n > c: At each sweep point, the average trace no. n is calculated from the average trace no. n – 1
and the current trace no. n according to:
The formulas hold for Average Factor n = 1 where the average trace becomes equal to the current trace.
Remote control:
[SENSe<Ch>:]AVERage[:STATe]
[SENSe<Ch>:]AVERage:COUNt
[SENSe<Ch>:]AVERage:CLEar
ON
|
OFF
Sweep
The Sweep submenu defines the scope of measurement in the current channel. This includes the sweep
type with various parameters, the trigger conditions the periodicity of the measurement, and the sweep
average.
Operating Manual 1303.6580.32-01
228
R&S® ZVL
GUI Reference
Channel Menu
Sweeps
A sweep is a series of consecutive measurements taken over a specified sequence of stimulus values. It
represents the basic measurement cycle of the analyzer.
The analyzer can perform sweeps at constant power but variable frequency (frequency sweeps); see
Sweep Type.
The sweeps are further specified by the number of measurement points, the total measurement time and
the trigger mode. A measurement may consist of a single sweep or a series of sweeps repeated
continuously.
On the other hand, depending on the measurement task and the measured quantity, the measurement at
each point can consist of several partial measurements with definite hardware settings.
The Sweep menu provides the following settings:
•
Sweep Type defines the sweep variable (frequency/power/time) and the position of sweep points
in the sweep range.
•
Number of Points sets the total number of measurement points over the sweep range.
•
Frequency Step Size sets the distance between two consecutive frequency sweep points.
•
Meas Delay delays the start of each sweep.
•
Restart aborts the current measurement and restarts a new sweep sequence.
•
If Single (All Chans) is selected the measurement is terminated after a single sweep or a group of
single sweeps defined in the Define Restart dialog.
•
Define Restart opens a dialog to specify how many sweeps are repeated.
•
Average On activates or de-activates the sweep average. With average on the measurement
results are averaged over a selected number of consecutive sweeps (Average Factor).
•
Average Factor defines the number of consecutive sweeps to be averaged.
•
Restart Average starts a new average cycle, clearing all previous results and thus eliminating their
effect on the new cycle. The new cycle is started as fast as possible; an ongoing sweep is
terminated immediately.
Operating Manual 1303.6580.32-01
229
R&S® ZVL
GUI Reference
Channel Menu
Channel Select
The Channel Select submenu provides functions to create and delete channels and select a channel as
the active channel.
(No direct access via
front panel keys)
•
Next Channel selects the next channel as the active channel (disabled if only one channel is
defined).
•
Select Channel opens a box to select an arbitrary channel of the active setup as the active
channel (disabled if only one channel is defined).
•
Add Chan + Trace creates a new channel and a new trace in the active diagram area.
•
Add Chan + Trace + Diag Area creates a new channel and a new trace in a new diagram area.
•
Delete Channel deletes the active channel.
•
Channel Manager opens a dialog to perform the previous actions systematically, rename
channels.
Active and inactive traces and channels
A window can display several diagram areas simultaneously, each with a variable number of traces. One
of these traces is active at each time. The active trace is highlighted in the trace list on top of the active
diagram area (Trc 4 in the figure below):
A mouse click onto a trace in the list selects the trace as the active trace. Alternatively, use the functions
of the Trace – Traces menu.
The active channel is the channel belonging to the active trace. The channels of all traces in a diagram
area are listed at the bottom of the diagram, together with the Stimulus values and the display colors of all
traces. The active channel is highlighted (Ch1 in the example below, with two associated traces).
A mouse click onto a trace in the trace list selects the channel associated to the trace as the active
channel. Channels with no traces are not indicated in the diagram areas but can be accessed via the
Operating Manual 1303.6580.32-01
230
R&S® ZVL
GUI Reference
Channel Menu
Channel Manager.
You can monitor the channel activity using the OUTPut<Ch>:UPORt[:VALue]
<numeric_value> command and the output signals at pins 8 to 11 of the USER CONTROL
connector.
Next Channel
Selects the next channel in a list of defined channels as the active channel. This function is disabled if the
current setup contains only one channel.
If one or several traces are assigned to the next channel, one of these traces becomes the active trace.
The order of all channels belonging to a setup is given by the channels' creation time. By default, the
channels are named Ch1, Ch2, ... so that Ch<n> follows Ch<n – 1>. This order is always maintained,
even if channels are renamed, invisible (because no traces are assigned to them) or distributed over
several diagram areas.
Remote control:
The numeric suffix <Ch> appended to the first-level mnemonic of a
command selects a channel as active channel.
Select Channel
•
Opens a box to select an arbitrary trace of the active setup as the active trace. This function is
disabled if the current setup contains only one channel.
If one or several traces are assigned to the selected channel, one of these traces becomes the active
trace.
The order of all channels belonging to a setup is given by the channels' creation time. By default, the
channels are named Ch1, Ch2, ... so that Ch<n – 1> precedes Ch<n>. This order is always maintained,
even if channels are renamed, invisible (because no traces are assigned to them) or distributed over
several diagram areas.
Remote control:
The numeric suffix <Ch> appended to the first-level mnemonic of a
command selects a channel as active channel.
Operating Manual 1303.6580.32-01
231
R&S® ZVL
GUI Reference
Channel Menu
Add Chan + Trace
Creates a new channel and a new trace, which is displayed in the active diagram area. The new channel
settings (including a possible channel calibration) are identical to the previous channel settings; the trace
is created with the trace settings of the former active trace but displayed with another color. The former
and the new active trace are superimposed but can be easily separated, e.g. by changing the Reference
Position.
The new channel is named Ch<n>, where <n> is the largest of all existing channel numbers plus one. The
name can be changed in the Channel Manager.
To create a new trace in the active channel, use the Trace – Traces – Add Trace function. To
create a new channel and a new trace and display it in a new diagram area, use Add Chan +
Trace + Diag Area.
Remote control:
CONFigure:CHANnel<Ch>[:STATe] ON
CALCulate<Ch>:PARameter:SDEFine "<Trc_name>", "<Parameter>"
DISPlay:WINDow<No>:TRACe:FEED "<Trc_name>"
Add Chan + Trace + Diag Area
Creates a new channel and a new trace, which is displayed in a new diagram area. The new channel
settings (including a possible channel calibration) are identical to the previous channel settings; the trace
is created with the trace settings of the former active trace but displayed with another color.
The new channel is named Ch<n>, where <n> is the largest of all existing channel numbers plus one. The
name can be changed in the Channel Manager.
To create a new trace in the active channel, use the Trace – Traces – Add Trace function. To
create a new channel and a new trace and display it in the active diagram area, use Add
Chan + Trace.
Remote control:
CONFigure:CHANnel<Ch>[:STATe] ON
CALCulate<Ch>:PARameter:SDEFine "<Trc_name>", "<Parameter>"
DISPlay:WINDow<No>:STATe ON
DISPlay:WINDow<No>:TRACe:FEED "<Trc_name>"
Delete Channel
Deletes the current channel including all traces assigned to the channel and removes all display elements
related to the channel from the diagram area. Delete Channel is disabled if the setup contains only one
channel: In manual control, each setup must contain at least one diagram area with one channel and one
trace.
To restore a channel that was unintentionally deleted, use the Undo function.
Remote control:
CONFigure:CHANnel<Ch>[:STATe] OFF
Operating Manual 1303.6580.32-01
232
R&S® ZVL
GUI Reference
Channel Menu
Channel Manager
Opens a dialog to perform the actions in the Channel Select menu systematically and rename channels.
All existing channels of the current setup are listed in a table; see below. Below the table the Trace
Manager provides the following buttons:
•
Add Channel adds a new channel to the list. The new channel is named Ch<n>, where <n> is the
largest of all existing channel numbers plus one.
•
Delete Channel deletes the channel selected in the drop-down menu. This button is disabled if the
setup contains only one channel: In manual control, each setup must contain at least one diagram
area with one channel and one trace.
Columns in the Channel Manager table
The channel table contains several editable (white) or non-editable (gray) columns.
•
Channel indicates the current channel name. The default names for new channels are Ch<n>
where <n> is a current number.
•
Traces indicates the names of all traces assigned to the channel.
Remote control:
CONFigure:CHANnel<Ch>:CATalog?
CONFigure:CHANnel<Ch>:NAME
CONFigure:CHANnel<Ch>:NAME:ID?
CONFigure:CHANnel<Ch>[:STATe]
Operating Manual 1303.6580.32-01
233
R&S® ZVL
GUI Reference
Nwa-Setup Menu
Nwa-Setup Menu
The Nwa-Setup menu provides all display settings and the functions to activate, modify and arrange
different diagram areas.
Diagram Areas
A diagram area is a rectangular portion of the screen used to display traces. Diagram areas are arranged
in windows; they are independent of trace and channel settings.
•
A diagram area can contain a practically unlimited number of traces, assigned to different
channels (overlay mode); see Traces, Channels and Diagram Areas.
•
The traces displayed in the diagram area are listed in the upper left corner.
•
The channels for all traces are listed in the lower left corner.
The contents of the diagram areas are explained in section Display Elements. Diagram areas are
controlled and configured by means of the functions in the Nwa-Setup – Display submenu.
(No direct access via front
panel keys)
The Nwa-Setup menu contains the following functions and submenus:
•
Display provides functions to delete diagram areas, arrange traces to diagram areas and arrange
the diagram areas in the active window.
•
Display Config configures the entire screen and the individual diagram areas.
•
Undo reverses the previous operation.
•
Redo reverses the action of the Undo command.
•
Setup Info displays information on the active setup and the instrument.
•
System Config opens a dialog to define various system-related settings.
•
Integrated Window sets the window to normal size or full-screen mode respectively.
•
External Tools opens a submenu with various demo setups and editing tools.
Operating Manual 1303.6580.32-01
234
R&S® ZVL
GUI Reference
Nwa-Setup Menu
Display
The Display submenu provides functions to delete diagram areas, and arrange areas in the active window.
Active and inactive traces and diagram areas
The active window can display several diagram areas simultaneously, each with a variable number of
traces. One of these areas and traces is active at each time. The area number in the upper right corner of
the active area is highlighted. At the same time the active trace is highlighted in the trace list on top of the
active diagram area (Trc 4 in the figure below):
The analyzer provides several tools to activate a diagram area:
•
A left mouse click on a point in the diagram activates the diagram including the last active trace in
the diagram.
•
A left mouse click on a trace list activates the trace including the corresponding diagram.
•
Some of the functions of the Trace – Traces menu activate a particular trace including the
corresponding diagram.
•
Delete Diag Area deletes the active diagram area.
•
Overlay All places all traces in a single diagram area which occupies the whole window.
•
Split All splits the active window into as many diagram areas as there are traces and assigns a
single trace to each area.
•
Maximize maximizes the active diagram area to occupy the whole window.
•
Dual Split splits the active window into two diagram areas and distributes the traces among the
two areas.
•
Triple Split splits the active window into three diagram areas and distributes the traces among the
three areas.
•
Quad Split splits the active window into four diagram areas and distributes the traces among the
four areas.
•
Split Manager opens a dialog to arrange the diagram areas in the active window.
Operating Manual 1303.6580.32-01
235
R&S® ZVL
GUI Reference
Nwa-Setup Menu
•
Title opens a dialog to define a title and display it in one of the diagram areas.
Delete Diag Area
Deletes the current diagram area including all traces displayed in the diagram area. Delete Diag Area is
disabled if the setup contains only one diagram area: In manual control, each setup must contain at least
one diagram area with one channel and one trace.
To restore a diagram area that was unintentionally deleted, use the Undo function.
Remote control:
DISPlay:WINDow<Wnd>:STATe OFF
Dual Split
Splits the window horizontally into two diagram areas and distributes the traces among the two areas,
separating diagrams with different trace Format and Channel settings (e.g. Cartesian and polar diagrams).
To vary the size and position of the two diagram areas, drag and drop the separating
frames or use the Split Manager.
Remote control:
No command, display configuration only.
Triple Split
Splits the active window into three diagram areas and distributes the traces among the three areas,
separating diagrams with different trace Format and Channel settings (e.g. Cartesian and polar diagrams).
Operating Manual 1303.6580.32-01
236
R&S® ZVL
GUI Reference
Nwa-Setup Menu
If less than three traces are available, some diagram areas are empty and display No Trace.
To vary the size and position of the diagram areas, drag and drop the separating frames or
use the Split Manager.
Remote control:
No command, display configuration only.
Quad Split
Splits the active window into four diagram areas and distributes the traces among the four areas,
separating diagrams with different trace Format and the Channel settings (e.g. Cartesian and polar
diagrams).
If less than four traces are available, some diagram areas are empty and display No Trace.
Operating Manual 1303.6580.32-01
237
R&S® ZVL
GUI Reference
Nwa-Setup Menu
To vary the size and position of the diagram areas, drag and drop the separating frames or
use the Split Manager.
Remote control:
No command, display configuration only.
Split Manager
Opens a dialog to arrange the diagram areas in the active window.
•
Split Mode provides a drow-down list to select alternative display schemes for the diagram areas
(see examples for split modes below).
•
Number of Diagram Areas indicates the total number of diagram areas. Increasing/decreasing the
number creates new diagram areas or deletes diagram areas.
Examples for split modes
•
The following examples were obtained with 3 diagram areas, each with 1 trace.
Lineup
Operating Manual 1303.6580.32-01
238
R&S® ZVL
GUI Reference
Nwa-Setup Menu
Stack
Tile
Horizontally
Operating Manual 1303.6580.32-01
239
R&S® ZVL
GUI Reference
Nwa-Setup Menu
Tile Vertically
Rows
and
Columns (2 |
1): the 3rd
trace
is
displayed
in
overlay mode.
Remote control:
No command, display configuration only.
Title
Opens a dialog to opens a dialog to define a title and display it in one of the diagram areas.
Operating Manual 1303.6580.32-01
240
R&S® ZVL
GUI Reference
Nwa-Setup Menu
•
Title provides an input field for the title string. The title may comprise a practically unlimited
number of characters and is centered in a line below the top of the diagram area.
•
Diagram Area provides a drop-down list of all diagram areas of the current setup. The title is
assigned to the selected area.
•
All Titles Off removes the titles from all diagram areas. The titles are hidden but not deleted:
Unchecking All Titles Off displays the titles again.
Remote control:
DISPlay:WINDow<Wnd>:TITle:DATA
DISPlay:WINDow<Wnd>:TITle:STATe <Boolean>
'<title>'
Display Config
The Display Config submenu configures the screen by showing or hiding controls and information
elements and controls the appearance of the individual diagrams.
The Display Config menu contains the following functions:
•
Color Scheme controls the colors in all diagram areas.
•
Softkey Labels shows or hides the softkey bar at the right edge of the screen.
•
Status Bar shows or hides the status bar across the bottom of the screen.
•
Front Panel Keys shows or hides the hardkey bar at the top of the screen.
•
Frequency Info shows or hides the frequency values in the diagram areas.
Hiding the controls and information elements leaves more space for the diagram areas. All elements may
be shown or hidden simultaneously. A checkmark next to the menu item indicates that the view element is
displayed.
Operating Manual 1303.6580.32-01
241
R&S® ZVL
GUI Reference
Nwa-Setup Menu
Color Scheme
Controls the colors in the diagram areas. Color schemes are global settings and apply to all active setups.
The following Predefined Schemes are optimized for the analyzer screen and for color hardcopies,
respectively:
•
Dark Background sets a black background color. The traces and information elements
in the diagram areas are displayed in different colors. This setting is usually suitable
for observing results on the analyzer screen.
•
Light Background sets a light background color. The traces and information elements in
the diagram areas are displayed in different colors.This setting is suitable for
generating color hardcopies of the screen.
The following Predefined Schemes can be appropriate for generating black-and-white hardcopies of the
screen:
•
Black and White Line Styles sets a white background color. All traces and information
elements in the diagram areas are black, however, the traces are drawn in different
line styles.
•
Black and White Solid sets a white background color. All traces and information
elements in the diagram areas are black. All traces are drawn with solid lines.
Define User Scheme... opens a dialog to modify the predefined schemes, changing the colors and styles
of the individual display elements.
Use Define User Scheme to create, save and recall your own color scheme.
Remote control:
SYSTem:DISPlay:COLor
Define User Color Scheme
The Define User Color Scheme dialog modifies the predefined color schemes, changing the colors and
styles of the individual display elements. User-defined color schemes can be saved to a file for later reuse.
Operating Manual 1303.6580.32-01
242
R&S® ZVL
GUI Reference
Nwa-Setup Menu
The following control elements change the current color scheme:
•
The screen element to be modified is selected from the Element drop-down list. The list contains
the background and all traces, text elements and lines in the diagrams.
•
Color opens a standard color dialog to assign a color to the selected element. Use the What's
•
Trace Style and Trace Width are enabled if the selected element is a trace.
•
Use same Color for all Markers allows to select a common marker color, which is independent of
the trace colors. To define the common color, select the Same Color for all Markers element.
•
Keep Trace Color over Reassignment of Diagram Area controls the color of traces that are
assigned to another diagram area or created together with a new diagram areas; see background
information below.
This? help button
in the dialog to obtain detailed information.
Effects of Keep Trace Color...
The analyzer assigns trace colors according to a predefined scheme, starting with the colors that are
easiest to distinguish. On one hand it is advantageous to use the colors at the beginning of the scheme.
On the other hand, it is often desirable to use different colors in different diagram areas so that any trace
that is moved from one diagram area to another can keep its color.
Keep Trace Color... changed between these two alternative color modes as shown below.
Keep
Trace
Color
Move trace to another
diagram area (Trace
Manager)
Add Trace + Diag. Area (Trace – Trace Select...)
Trace color changed
according to the new
diagram area's color
scheme
Color scheme of the new diagram area is independent,
restarts with the first colors. Consequently the new trace is
displayed with a color that has been already used.
Trace keeps its color
Color scheme of the new diagram area continues color
scheme of the previously active area. The new trace is
displayed with a new color.
See also program example for DISPlay:CMAP<Element>:TRACe:COLor[:STATe].
Two buttons at the bottom of the dialog are used to save or recall user-defined color schemes.
Operating Manual 1303.6580.32-01
243
R&S® ZVL
GUI Reference
Nwa-Setup Menu
•
Save... opens a Save As... dialog to select a color scheme file and save the current settings. Color
scheme files are non-editable files with the extension *ColorScheme; the default directory is
C:\Rohde&Schwarz\NWA\ColorSchemes.
•
Recall... opens an Open File... dialog to load and apply a color scheme saved before.
To recall a color scheme file (*.ColorScheme) you can also use the Windows Explorer and
simply double-click the file or drag and drop the file into the NWA application.
Remote control:
DISPlay:CMAP<Element>:RGB
<red>,
<green>,
<blue>
[,<trace_style>,
<trace_width>]
DISPlay:CMAP<Element>:MARKer[:STATe]
ON
|
OFF
DISPlay:CMAP<Element>:TRACe:COLor[:STATe]
ON
|
OFF
MMEMory:LOAD:CMAP
MMEMory:STORe:CMAP
Softkey Labels
Shows or hides the softkey bar at the right edge of the screen.
The softkey bar shows up to 7 commands of the active menu indicated above softkey no. 1. The figure
above shows the upper part of the softkey bar corresponding to the Trace – Meas submenu. Pressing the
key to the right of a softkey directly activates a submenu, calls up the numeric entry bar or a dialog or
initiates an action. See Softkey Bar in the introductory chapter for more information.
Status Bar
Shows or hides the status bar across the bottom of the screen.
The status bar describes the current channel (if the setup contains only one channel), the progress of the
sweep and the control mode of the analyzer (LOCAL or REMOTE).
Front Panel Keys
Shows or hides the hardkey bar (front panel key bar) at the top of the screen (to the left of the softkey
bar).
Operating Manual 1303.6580.32-01
244
R&S® ZVL
GUI Reference
Nwa-Setup Menu
The hardkey bar represents the most commonly used front panel keys of the analyzer. Clicking a key
symbol executes the action of the corresponding key.
See Hardkey Bar in the introductory chapter for more information.
Frequency Info
Shows or hides all frequency stimulus values in the diagrams. This comprises:
•
The frequency stimulus ranges below the diagram area.
•
The frequency stimulus values in the marker info field, at the marker position and in the marker
table.
The Frequency Info setting is valid for frequency and segmented frequency sweeps only.
Remote control:
DISPlay:ANNotation:FREQuency[:STATe] ON | OFF
Undo
Reverses the last action, if possible. Otherwise, Undo is disabled (grayed).
You can use Undo even after a Preset, in order to restore your own instrument settings.
Redo
Reverses the action of the Undo command. If Undo was not used before, Redo is disabled (grayed).
Setup Info
Displays the channel and trace settings of the active setup and the main characteristics of the instrument
including its IP address.
System Config
Opens a dialog to define various system-related settings.
Operating Manual 1303.6580.32-01
245
R&S® ZVL
GUI Reference
Nwa-Setup Menu
The System Configuration dialog is divided into the following tabs:
•
User Interface
The two check boxes in the Messages and Sounds panel switch the instrument messages or acoustic
messages on or off. Sounds are generated when the analyzer generates a notice/status message or a
warning (alarm sounds) or during calibration. The settings are also valid if the instrument is remotecontrolled.
Dialog Transparency varies the transparency of all dialogs on a scale between 0% and 100%. 0%
transparency means that dialogs completely hide the diagram area in the background. With a maximum
transparency of 100%, the dialogs are still visible but clearly show the underlying traces and display
elements.
Keep Measurement Data for >Repeat Previous Cal< causes the raw measurement data of the standards
to be stored after the calibration is completed. This function is equivalent to the parameter in the
Measured Standards dialog of the calibration wizard (see detailed description there) but applies to all
calibrations.
No of Sliding Match Positions defines the maximum number of different positions to be measured if a
sliding match standard (sliding load) is used for calibration. The different positions appear in the Measure
Standards dialog of the calibration wizard. A sliding match calibration is valid after three calibration
sweeps at different match positions; however, calibration sweeps at additional positions can still improve
the accuracy. In general 4 to 6 positions are recommended.
•
Presets
The tab specifies whether a Preset affects the Active Setup or all open setups (Instrument). A preset does
not change any of the properties listed in the Resets tab of the System Configuration dialog.
In the Preset Configuration panel, it is possible to specify whether the Preset command will perform a
factory preset or restore the settings stored to a user preset file. A user preset file is an arbitrary setup
(.zvx) file, to be stored using the Nwa File – Save Network Analysis... command. If the current user preset
Operating Manual 1303.6580.32-01
246
R&S® ZVL
GUI Reference
Nwa-Setup Menu
file is not found (e.g. because it was deleted or moved), the analyzer performs a factory preset.
In remote control, a user-defined preset must be initiated using the commands in the
SYSTem:PRESet:USER... subsystem. *RST and SYSTem:PRESet always restore the
factory preset settings.
•
Channel Bits
•
Resets
Provides several buttons to reset global instrument settings and properties. Global settings (e.g. the data
related to global resources) are not affected by an instrument Preset.
The Use Default Directories button is inactive in the current firmware version.
•
Remote Settings
Specifies the Remote Language and an ID String for the analyzer, to be queried via *IDN?.
•
If the DEFAULT language is activated, the factory ID string Rohde&Schwarz,ZVL<Max.
Freq.-Ports>Port,<Serial_no>,<FW_Version>
(e.g.
Rohde&Schwarz,ZVL62Port,1145101010100001,1.70.5) is set. The bit order for transferred binary data is
swapped (FORMat:BORDer SWAPped).
•
If the PNA is activated, an Agilent-compatible ID string is set. The bit order for transferred
binary data is normal.
The ID string can be changed or reset by using the SETUP key.
Show Error Messages activates a information popup box (tooltip) to be displayed whenever the parser
encounters an remote control command error. The tooltip appears at the bottom of the remote or manual
screen; it is not displayed for SCPI errors no. –113, Undefined header:
The tooltip is to provide information that can be useful for program development and optimization; it does
not necessarily indicate that a remote control script is faulty or non-executable.
Remote
SYSTem:SOUNd:ALARm[:STATe]
control
SYSTem:SOUNd:STATus[:STATe]
(for
Messages
and Sounds)
Remote
[SENSe<Ch>:]CORRection:COLLect[:ACQuire]:RSAVe:DEFault
control
(for
Keep
Measurement
Data...)
Remote
control
(for preset):
SYSTem:PRESet:SCOPe SINGle | ALL
Remote
CONTrol:AUXiliary:C[:DATA]
control
OUTPut<Ch>:UPORt[:VALue]
(for channel
Operating Manual 1303.6580.32-01
247
R&S® ZVL
GUI Reference
Help Menu
bits):
Remote
control
(for GPIB):
FORMat:BORDer NORMal | SWAPped
SYSTem:ERRor:DISPlay
Integrated Window
Restores the window to normal size (if checked). If Integrated Window is unchecked, the window is
displayed in full-screen mode. This function is intended for the use with Remote Desktop. It is provided in
the Network Analyzer mode only.
Remote control:
No command, display configuration only.
External Tools
Opens a submenu with various demo setups: Demo*.vbs: Shows how to perform the settings for typical
measurement tasks.
After running a *vbs file you can modify the demo setup according to your own needs and store it to
a *.nwa file for later reuse.
Help Menu
The Help menu provides assistance with the network analyzer and its operation.
The Help menu contains the following functions:
•
Help Topics opens this help system.
•
About NWA... opens a dialog to retrieve information about the network analyzer and the current
firmware version.
Help Topics
Opens this help system. The help file is opened with the Welcome topic and remembers its last size,
position and default navigation tab (Contents, Index,...). For more information see About this Help.
Operating Manual 1303.6580.32-01
248
R&S® ZVL
GUI Reference
Help Menu
About NWA...
Opens a dialog to retrieve information about the network analyzer and the current firmware version. OK
closes the dialog.
Operating Manual 1303.6580.32-01
249
R&S® ZVL
Remote Control - General Description
Remote Control Operation
6
Remote Control - General Description.............................................................. 253
Remote Control Operation..............................................................................................................253
Remote Control: Introduction ..........................................................................................................253
GPIB Explorer .................................................................................................................................254
Switchover to Remote Control ........................................................................................................255
Setting the Device Address.............................................................................................................257
Return to Manual Operation............................................................................................................257
Combining Manual and Remote Control.........................................................................................257
Messages..........................................................................................................................................259
GPIB Interface Messages.............................................................................................................259
RSIB and VXI-11 Interface Messages..........................................................................................259
Device Messages (Commands and Device Responses) .............................................................259
SCPI Command Structure and Syntax ...........................................................................................260
Common Commands....................................................................................................................260
Instrument-Control Commands ....................................................................................................260
Structure of a Command Line.......................................................................................................262
Responses to Queries.....................................................................................................................263
SCPI Parameters ............................................................................................................................263
Numeric Values ............................................................................................................................263
Boolean Parameters.....................................................................................................................264
Text Parameters ...........................................................................................................................264
Strings...........................................................................................................................................264
Block Data Format........................................................................................................................264
Overview of Syntax Elements.......................................................................................................265
Basic Remote Control Concepts....................................................................................................265
Traces, Channels, and Diagram Areas...........................................................................................266
Active Traces in Remote Control ....................................................................................................266
Initiating Measurements, Speed Considerations ............................................................................268
Command Processing.....................................................................................................................268
Input Unit ......................................................................................................................................269
Operating Manual 1303.6580.32-01
251
R&S® ZVL
Remote Control - General Description
Remote Control Operation
Command Recognition .................................................................................................................269
Data Base and Instrument Hardware ...........................................................................................270
Status Reporting System..............................................................................................................270
Output Unit....................................................................................................................................270
Command Sequence and Command Synchronization ................................................................270
Status Reporting System ................................................................................................................272
Overview of Status Registers..........................................................................................................273
Structure of an SCPI Status Register..............................................................................................273
Status Registers ..............................................................................................................................275
Contents of the Status Registers ....................................................................................................275
STB and SRE ...............................................................................................................................276
IST Flag and PPE .........................................................................................................................276
ESR and ESE ...............................................................................................................................277
STATus:OPERation......................................................................................................................277
STATus:QUEStionable.................................................................................................................277
STATus:QUEStionable:LIMit1<1|2>.............................................................................................278
Application of the Status Reporting System....................................................................................278
Service Request ...........................................................................................................................279
Serial Poll......................................................................................................................................280
Parallel Poll...................................................................................................................................280
Query of an Instrument Status......................................................................................................280
Error Queue ..................................................................................................................................281
Reset Values of the Status Reporting System................................................................................281
Operating Manual 1303.6580.32-01
252
R&S® ZVL
Remote Control - General Description
Remote Control Operation
6 Remote Control - General Description
This chapter provides instructions on how to set up the analyzer for remote control, a general introduction
to remote control of programmable instruments, and the description of the analyzer's remote control
concept. For reference information about all remote control commands implemented by the instrument,
complemented by comprehensive program examples, refer to the SCPI Reference chapter.
Remote Control Operation
Remote Control: Introduction
The instrument is equipped with different interfaces for remote control:
!
A GPIB bus interface according to standard IEC 625.1/IEEE 488.1. The GPIB bus connector for
direct connection to a controller is located on the rear panel of the instrument.
!
Instruments connected to a Local Area Network can be controlled via the RSIB or VX 11 protocol.
Two connectors for LAN connection are located on the rear panel.
The GPIB Explorer is a easy-to-use program tool that allows you to obtain an overview of all
implemented remote control programs, test programs, compile and run test scripts.
This section assumes basic knowledge of GPIB bus programming and operation of the controller. A
description of the interface commands can be found in the Annexes sections GPIB Bus Interface and
RSIB Interface Functions respectively.
SCPI compatibility
The analyzers are compatible to the final SCPI version 1999.0. Not all of the commands supported by the
instrument are taken from the SCPI standard (Standard Commands for Programmable Instruments),
however, their syntax follows SCPI rules. The SCPI standard is based on standard IEEE 488.2 and aims
at the standardization of instrument-control commands, error handling and the status registers.
The requirements that the SCPI standard places on command syntax, error handling and configuration of
the status registers are explained in detail in the following sections. Tables provide a fast overview of the
bit assignment in the status registers. The tables are supplemented by a comprehensive description of the
status registers.
Reset values
In contrast to instruments with manual control, which are designed for maximum possible operating
convenience, the priority of remote control is the "predictability" of the device status. This means that
when incompatible settings are attempted, the command is ignored and the device status remains
unchanged, i.e. other settings are not automatically adapted. Therefore, GPIB bus control programs
Operating Manual 1303.6580.32-01
253
R&S® ZVL
Remote Control - General Description
Remote Control Operation
should always define an initial device status (e.g. with the command *RST) and then implement the
required settings.
GPIB Explorer
The GPIB Explorer is a easy-to-use program tool that allows you to obtain an overview of all implemented
remote control programs, test programs, compile and run test scripts. The program can be opened by
starting the executable file iecwin32.exe in the program directory of the network analyzer (e.g.
C:\R_S\Instr\Bin).
After the GPIB Explorer is started, the interface for the connection to the instrument can be selected in a
dialog:
The following options are provided:
!
NT named pipe (not supported at present)
!
GPIB address (for connection to controllers equipped with a National Instrument GPIB interface
using the GPIB bus connector)
!
RSIB address (for LAN connection via RSIB protocol, requires an appropriate IP or local host
address; see LAN Connection sections in Chapter 1)
!
VXI-11/VISA (for LAN connections via the VXI-11 protocol; requires an installed VISA library)
!
NT pipe A/B (only for local connection on the analyzer, recommended for remote test on the
instrument)
!
EB200 (not supported at present)
A connection requires the default settings "Rohde & Schwarz" (for the SCPI command set)
and "Use SRQ: On". Select Nwa-Setup – Setup Info to look up the IP address information of
your analyzer.
After the connection is established, the GPIB explorer displays a tree view of all commands included in the
Operating Manual 1303.6580.32-01
254
R&S® ZVL
Remote Control - General Description
Remote Control Operation
current firmware version of the network analyzer. The programs can be selected for execution by a single
mouse click.
Refer to the GPIB explorer's help system for more information.
Switchover to Remote Control
On power-up, the instrument is always in the manual operating state and can be operated via the front
panel controls. The instrument is switched to remote control as soon as it receives a command from the
controller. If the instrument is controlled via RSIB or VX 11 protocol, the alternative commands @REM
and @LOC can be used to switch from manual to remote control and back.
While remote control is active, operation via the front panel is disabled with the exception of two softkeys.
The instrument settings are optimized for maximum measurement speed; the display is switched off:
Operating Manual 1303.6580.32-01
255
R&S® ZVL
Remote Control - General Description
Remote Control Operation
The two softkeys in the remote screen are used to modify or quit the remote state:
!
Go to Local switches the instrument to local state.
!
Display On/Off switches the display on or off.
Display On/Off states
Switching on the display means that the analyzer shows the measurement screen with the current setups,
diagram areas and traces without leaving the remote state. In this operating mode, it is possible to
observe the screen while a remote control script is executed and the control elements on the front panel
are still disabled:
Switching on the display is ideal for program test purposes but tends to slow down the measurement.
Therefore it is recommended to switch off the display in real measurement applications where a tested
program script is to be executed repeatedly.
The analyzer provides a third display option where the measurement screen is only updated
when this is triggered by a remote control command; see SYSTem:DISPlay:UPDate ONCE.
The instrument remains in the remote state until it is reset to the manual state via the GUI or via GPIB bus
(see section Return to Manual Operation).
Operating Manual 1303.6580.32-01
256
R&S® ZVL
Remote Control - General Description
Remote Control Operation
You can create you own keys to replace the two default softkeys Go to Local and Display
On/Off.
See
Combining
Manual
and
Remote
Control.
A tooltip across the bottom of the remote screen indicates a remote command error, e.g.
. You can switch off this tooltip using
SYSTem:ERRor:DISPlay OFF.
Remote control:
@REM
SYSTem:DISPlay:UPDate
SYSTem:USER:DISPlay:TITLe (define a title for the remote
display)
SYSTem:ERRor:DISPlay (switch tooltip on or off)
Setting the Device Address
The GPIB address (primary address) of the instrument is factory-set to 20. It can be changed manually in
the System menu or via GPIB bus. For remote control, addresses 0 through 30 are permissible. The GPIB
address is maintained after a reset of the instrument settings.
Remote control:
SYSTem:COMMunicate:GPIB[:SELF]:ADDRess
Return to Manual Operation
Return to manual operation can be initiated via the front panel or via remote control.
!
Manually: Click the Local softkey in the remote screen.
!
Via GPIB bus: CALL IBLOC(device%)
!
Via RSIB or VX 11 protocol: @LOC and @REM can be used to switch from remote to manual
control and back.
Local lockout
Before returning to manual control, command processing must be completed. If this is not the case, the
analyzer switches back to remote control immediately.
Returning to manual control by pressing the Local softkey can be disabled by the GPIB Local Lockout
Message (LLO; see GPIB Bus Interface, Universal Commands) which is also included in the NI
commands SetRWLS (Set Remote With Lockout State) or SendLLO. This prevents unintentional switchover, i.e. return to manual control is possible via the GPIB bus only.
Returning to manual control via the front panel keys can be enabled again by deactivating the REN control
line of the GPIB bus.
Combining Manual and Remote Control
Using a remote control script is the quickest and easiest way of performing complicated tasks which need
to be repeated many times. On the other hand, it is often preferable to control a previously configured
measurement manually in order to observe the result on the screen.
Operating Manual 1303.6580.32-01
257
R&S® ZVL
Remote Control - General Description
Remote Control Operation
The analyzer provides a number of tools for combining manual and remote control:
!
User Keys
The remote control commands SYSTem:USER:KEY... place up to 8 softkeys with arbitrary
functionality on the remote screen. The softkeys replace the default softkeys Go to Local and
Display On/Off.
Pressing a user softkey or clicking the corresponding command across the top of the remote
screen executes the assigned functionality.
If you want to use more than 8 user keys, you can easily introduce additional levels: Simply
reserve one key for re-defining the entire user key bar. If you press or click the key, your
remote script should re-assign the labels and functions of the existing keys. If you use this
procedure repeatedly, you can emulate an arbitrary number of manual control features on
your remote screen.
!
Menu key commands
The commands in the DISPlay:MENU:KEY... subsystem open the manual control screen,
activate menus or submenus for manual control, or execute a specified menu command.
DISPlay:MENU:KEY:EXECute '<menu_key>' can be used in different ways:
!
If the menu key causes an event (e.g. selection of the measured quantity: S11, S12 etc.),
the function is executed immediately. No further action is required; the instrument remains
in remote control mode.
!
If the menu key requires a numeric entry (e.g. entry of the sweep range: Start, Stop etc.)
the command opens the numeric entry bar. The instrument is switched back to remote
control mode as soon as the entry has been made manually.
!
If the menu key requires several entries to be made in a dialog or in a wizard (e.g. the SParam Wizard), the command opens this dialog/wizard. All entries can be made manually.
The instrument is switched back to remote control mode as soon as the dialog or wizard is
closed.
Operating Manual 1303.6580.32-01
258
R&S® ZVL
Remote Control - General Description
Messages
DISPlay:MENU:KEY:EXECute '<menu_key>' works for all menu keys, even though the
analyzer may not provide an equivalent remote control command.
Remote control:
SYSTem:USER:KEY
SYSTem:USER:KEY:FUNCtion
DISPlay:MENU:KEY:EXECute
DISPlay:MENU:KEY:SELect
Messages
The messages transferred on the data lines of the GPIB bus or via the RSIB / VXI-11 interface can be
either interface messages or device messages.
GPIB Interface Messages
GPIB interface messages are transferred on the data lines of the GPIB bus, the ATN control line being
active. They are used for communication between controller and instrument and can only be sent by a
computer which has the function of an GPIB bus controller.
GPIB interface messages can be further subdivided into
!
Universal commands act on all devices connected to the GPIB bus without previous addressing.
!
Addressed commands only act on devices previously addressed as listeners.
The interface messages relevant to the instrument are listed in the GPIB bus section.
RSIB and VXI-11 Interface Messages
The RSIB and VXI-11 interfaces allow the instrument to be controlled in a Local Area Network. For a short
introduction and a list of interface functions refer to the following sections:
!
RSIB Interface
!
VXI-11 Interface
Device Messages (Commands and Device Responses)
Device messages are transferred via the data lines of the GPIB bus, the "ATN" control line not being
active. The ASCII character set is used. A distinction is made according to the direction in which device
messages are transferred:
!
Commands are messages the controller sends to the instrument. They operate the device
functions and request information.
!
Device responses are messages the instrument sends to the controller after a query. They can
contain measurement results, instrument settings and information on the instrument status.
Commands are subdivided according to two criteria:
Operating Manual 1303.6580.32-01
259
R&S® ZVL
Remote Control - General Description
Messages
1. According to the effect they have on the instrument:
!
Setting commands cause instrument settings such as a reset of the instrument or setting the
output level to some value.
!
Queries cause data to be provided for output on the GPIB bus, e.g. for identification of the device
or polling the active input.
2. According to their definition in standard IEEE 488.2:
!
Common commands have a function and syntax that is exactly defined in standard IEEE 488.2.
Typical tasks are the management of the standardized status registers, reset and selftest.
!
Instrument-control commands are functions that depend on the features of the instrument such as
frequency settings. A majority of these commands has also been standardized by the SCPI
consortium.
The device messages have a characteristic structure and syntax. In the SCPI reference chapter all
commands are listed and explained in detail.
SCPI Command Structure and Syntax
SCPI commands consist of a so-called header and, in most cases, one or more parameters. The header
and the parameters are separated by a "white space" (ASCII code 0 to 9, 11 to 32 decimal, e.g. blank).
The headers may consist of several key words. Queries are formed by directly appending a question mark
to the header.
Common commands and device-specific commands differ in their syntax.
Common Commands
Common (=device-independent) commands consist of a header preceded by an asterisk "*" and possibly
one or more parameters.
Examples:
*RST
RESET, resets the instrument.
*ESE 253
EVENT STATUS ENABLE, sets the bits of the event status enable registers.
*ESR?
EVENT STATUS QUERY, queries the contents of the event status register.
Instrument-Control Commands
Instrument-control commands are based on a hierarchical structure and can be represented in a
command tree. The command headers are built with one or several mnemonics (keywords). The first level
(root level) mnemonic identifies a complete command system.
Example:
SENSe
This mnemonic identifies the command system SENSe.
For commands of lower levels, the complete path has to be specified, starting on the left
with the highest level, the individual key words being separated by a colon ":".
Operating Manual 1303.6580.32-01
260
R&S® ZVL
Remote Control - General Description
Messages
Example:
SENSe:FREQuency:STARt 1GHZ
This command is located on the third level of the SENSe system. It defines the start
frequency of the sweep.
The following rules simplify and abbreviate the command syntax:
!
Multiple mnemonics
Some mnemonics occur on several levels within one command system. Their effect depends on
the structure of the command, i. e. on the position in the command header they are inserted in.
Example:
SOURce:FREQuency:CW lGHZ
This command contains the key word SOURce in the first command level. It defines the frequency
for sweep types operating at fixed frequency.
TRIGger:SOURce EXTernal
This command contains the key word SOURce in the second command level. It defines the trigger
source “external trigger”.
!
Optional mnemonics
Some command systems permit certain mnemonics to be optionally inserted into the header or
omitted. These mnemonics are marked by square brackets in this manual. The full command
length must be recognized by the instrument for reasons of compatibility with the SCPI standard.
Some commands are considerably shortened by omitting optional mnemonics.
Example:
TRIGger[:SEQuence]:SOURce EXTernal
This command defines the trigger source “external trigger”. The following command has the same
effect:
TRIGger:SOURce EXTernal
An optional mnemonic must not be omitted if its effect is additionally specified by a numeric
suffix.
!
Long and short form
The key words feature a long form and a short form. Either the short form or the long form can be
entered; other abbreviations are not permitted.
Example:
TRIGger:SOURce EXTernal
TRIG:SOUR EXT
Operating Manual 1303.6580.32-01
261
R&S® ZVL
Remote Control - General Description
Messages
The short form is marked by upper case letters, the long form corresponds to the complete
word. Upper case and lower case notation only serves to distinguish the two forms in the
manual, the instrument itself is case-insensitive.
!
Parameters
Parameters must be separated from the header by a "white space". If several parameters are
specified in a command, they are separated by a comma ",". For a description of the parameter
types, refer to section Parameters.
Example:
SOURce:GROup 1,1
This command defines a group of measured ports.
!
Numeric suffix
If a device features several functions or features of the same kind, e.g. several channels or test
ports, the desired function can be selected by a suffix added to the command. Entries without
suffix are interpreted like entries with the suffix 1.
Example:
SOURce:GROup2 1,1
This command defines a second group (group no 2) of measured ports.
Structure of a Command Line
A command line may consist of one or several commands. It is terminated by a <New Line>, a <New
Line> with EOI or an EOI together with the last data byte. Visual BASIC automatically produces an EOI
together with the last data byte.
Several commands in a command line must be separated by a semicolon ";". If the next command
belongs to a different command system, the semicolon is followed by a colon.
Example: CALL
1GHZ")
IBWRT(device%,
"TRIGger:SOURce
EXTernal;:SENSe:FREQuency:STARt
This command line contains two commands. The first command belongs to the TRIGger system and
defines the trigger source (external trigger). The second command belongs to the SENSe system and
defines the start frequency of the sweep.
If the successive commands belong to the same system, having one or several levels in common, the
command line can be abbreviated. To this end, the second command after the semicolon starts with the
level that lies below the common levels. The colon following the semicolon must be omitted in this case.
Example: CALL IBWRT(device%, "TRIG:SOUR EXT;:TRIG:TIM 0.1")
This command line is represented in its full length and contains two commands separated from each other
by the semicolon. Both commands are part of the TRIGger command system, i.e. they have one level in
common.
When abbreviating the command line, the second command begins with the level below TRIG. The colon
after the semicolon is omitted. The abbreviated form of the command line reads as follows:
CALL IBWRT(device%, "TRIG:SOUR EXT; TIM 0.1")
However, a new command line always begins with the complete path.
Operating Manual 1303.6580.32-01
262
R&S® ZVL
Remote Control - General Description
Messages
Example:
CALL IBWRT(device%, "TRIG:SOUR EXT ")
CALL IBWRT(device%, "TRIG:THR LOW ")
Responses to Queries
A query is defined for each setting command unless explicitly specified otherwise. It is formed by adding a
question mark to the associated setting command. According to SCPI, the responses to queries are partly
subject to stricter rules than in standard IEEE 488.2.
1. The requested parameter is transmitted without header.
Example: TRIGger:SOURce? Response: IMM
2. Maximum values, minimum values and all further quantities which are requested via a special text
parameter are returned as numerical values.
Example: SENSe:FREQuency:STOP? MAX Response: 8000000000
3. Numerical values are output without their unit. The default unit for each command is reported in the
SCPI command description.
Example: SENSe:FREQuency:STOP? MAX Response: 8000000000 for 8 GHz
4. Boolean values are returned as 0 (for OFF) and 1 (for ON).
Example: SWEep:TIME:AUTO? Response: 1
5. Text (character data) is returned in short form (see also next section).
Example: TRIGger:SOURce? Response: IMM
SCPI Parameters
Most commands require a parameter to be specified. The parameters must be separated from the header
by a "white space". Permissible parameters are numerical values, Boolean parameters, text, character
strings and block data. The type of parameter required for the respective command and the permissible
range of values are specified in the command description.
Numeric Values
Numeric values can be entered in any form, i.e. with sign, decimal point and exponent. Values exceeding
the resolution of the instrument are rounded up or down. The mantissa may comprise up to 255
characters, the values must be in the value range –9.9E37 to 9.9E37. The exponent is introduced by an
"E" or "e". Entry of the exponent alone is not allowed. In the case of physical quantities, the unit can be
entered. Permissible unit prefixes are G (giga), MA (mega), MOHM and MHZ are also permissible), K
(kilo), M (milli), U (micro) and N (nano). If the unit is missing, the default unit is used.
Example:
SOUR:RFG:FREQ 1.5GHz is equivalent to
SOUR:RFG:FREQ 1.5E9
Special numeric values
The texts MINimum, MAXimum, DEFault, UP and DOWN are interpreted as special numeric values. A
query returns the associated numerical value.
Example:
Setting command: SENSe:FREQuency:STARt
Operating Manual 1303.6580.32-01
MINimum
263
R&S® ZVL
Remote Control - General Description
Messages
The query SENSe:FREQuency:STARt? returns 300000 (the exact value depends on the analyzer
model).
The following special values can be used:
!
MIN/MAX MINimum and MAXimum denote the minimum and maximum value of a range of
numeric values.
!
DEF DEFault denotes the preset value. This value is set by the *RST command.
!
UP/DOWN UP, DOWN increases or reduces the numeric value by one step. The step width is
reported in the detailed command description.
!
INF/NINF Negative INFinity (NINF) represent the numerical values –9.9E37 or +9.9E37,
respectively. INF and NINF are only sent as device responses.
!
NAN Not a Number (NAN) represents the value 9.91E37. NAN is only sent as device response.
This value is not defined. Possible causes are division by zero, subtraction or addition of infinite
and the representation of missing values.
Unless it is explicitly stated in the command description you can use the special numeric parameters
for all commands of the analyzer.
Boolean Parameters
Boolean parameters represent two states. The ON state (logically true) is represented by ON or a
numerical value different from 0. The OFF state (logically false) is represented by OFF or the numerical
value 0. A query responds with 0 or 1.
Example: Setting command: SWEep:TIME:AUTO ON
Query: SWEep:TIME:AUTO? returns 1
Text Parameters
Text parameters observe the syntax rules for key words, i.e. they can be entered using a short or long
form. Like any parameter, they have to be separated from the header by a white space. In the case of a
query, the short form of the text is provided.
Example: Setting command: TRIGger:SOURce EXTernal
Query: TRIGger:SOURce? returns EXT
Strings
Strings must always be entered within single or double quotation marks (' or ").
Example: CONFigure:CHANnel:NAME "Channel 4" or
CONFigure:CHANnel:NAME 'Channel 4'
Block Data Format
Block data is a transmission format which is suitable for the transmission of large amounts of data. A
command using a block data parameter with definite length has the following structure:
Operating Manual 1303.6580.32-01
264
R&S® ZVL
Remote Control - General Description
Basic Remote Control Concepts
Example: HEADer:HEADer #45168xxxxxxxx
The hash symbol # introduces the data block. The next number indicates how many of the following digits
describe the length of the data block. In the example the 4 following digits indicate the length to be 5168
bytes. The data bytes follow. During the transmission of these data bytes all End or other control signs are
ignored until all bytes are transmitted.
A #0 combination introduces a data block of indefinite length. The use of the indefinite format requires a
NL^END message to terminate the data block. This format is useful when the length of the transmission is
not known or if speed or other considerations prevent segmentation of the data into blocks of definite
length.
Overview of Syntax Elements
:
The colon separates the key words of a command. In a command line the
separating semicolon marks the uppermost command level.
;
The semicolon separates two commands of a command line. It does not alter
the path.
,
The comma separates several parameters of a command.
?
The question mark forms a query.
*
The asterisk marks a common command.
',
"
Quotation marks introduce a string and terminate it.
#
The hash sign # introduces binary, octal, hexadecimal and block data.
Binary: #B10110
Octal: #O7612
Hexadecimal: #HF3A7
Block: #21312
A "white space" (ASCII-Code 0 to 9, 11 to 32 decimal, e.g. blank) separates
header and parameter.
Basic Remote Control Concepts
The functionality of the network analyzer's remote control commands has been defined in close analogy to
the menu commands and control elements of the graphical user interface (GUI). The basic concepts of
setups, traces, channels, and diagram areas remain valid in remote control. Moreover, all commands
follow SCPI syntax rules, and SCPI-confirmed commands have been used whenever possible. These
principles largely simplify the development of remote control scripts.
The GUI and the remote control command set both aim at maximum operating convenience. In manual
control this generally means that the control elements are easy to find and intuitive to handle, and that the
effect of each operation is easy to verify on the screen. Convenient remote control operation depends on a
Operating Manual 1303.6580.32-01
265
R&S® ZVL
Remote Control - General Description
Basic Remote Control Concepts
simple and systematic program syntax and on a predictable instrument state; the display of results is
secondary.
These differences suggest the peculiarities in the analyzer's remote control concept discussed in the
following sections.
Traces, Channels, and Diagram Areas
Like in manual control, traces can be assigned to a channel and displayed in diagram areas (see section
Traces, Channels and Diagram Areas in Chapter 3). There are two main differences between manual and
remote control:
!
A trace can be created without being displayed on the screen.
!
A channel must not necessarily contain a trace. Channel and trace configurations are independent
of each other.
The following frequently used commands create and delete traces, channels, and diagram areas:
Create new trace
and new channel
(if channel <Ch>
does not exist
yet)
CALCulate<Ch>:PARameter:SDEFine '<Trace Name>',
'< Meas Parameter>
Delete trace
CALCulate<Ch>:PARameter:DELete <Trace Name>
Create or delete
channel
CONFigure:CHANnel<Ch>[:STATe] ON | OFF
Create or delete
diagram area
DISPlay:WINDow<Wnd>:STATe ON | OFF
Display trace in
diagram area
DISPlay:WINDow<Wnd>:TRACe<WndTr>:FEED
The assignment between traces, channels, and diagram areas is defined via numeric suffixes as
illustrated in the following example:
CALC4:PAR:SDEF 'Ch4Tr1', 'S11'
Create channel 4 (channel suffix 4) and a trace named Ch4Tr1 to measure the input reflection coefficient
S11. The trace is created but not displayed.
DISP:WIND2:STAT ON
Create diagram area no. 2 (window suffix 2).
DISP:WIND2:TRAC9:FEED 'CH4TR1'
Display the generated trace (identified by its name Ch4Tr1) in diagram area no. 2 (window suffix 2),
assigning the trace number 9 (trace suffix 9) to it.
Active Traces in Remote Control
In manual control there is always exactly one active trace, irrespective of the number of channels and
Operating Manual 1303.6580.32-01
266
R&S® ZVL
Remote Control - General Description
Basic Remote Control Concepts
traces defined. The active channel contains the active trace; see section Trace Settings in Chapter 3.
In remote control, each channel contains an active trace (unless the channel contains no trace at all), so
the notion of active channel is meaningless. This principle actually simplifies the remote control command
syntax, because it allows the active trace in a particular channel to be referenced by means of the channel
suffix. No additional trace identifier is needed; there is no need either to distinguish channel and trace
settings using mnemonics or suffixes.
The active traces are handled as follows:
!
After a preset (*RST), the analyzer displays a single diagram area with the default trace no. 1
named TRC1. The trace is active in manual and in remote control.
!
In manual control, a new, added trace automatically becomes the active trace. To select another
trace as the active trace, click inside the trace list.
!
In remote control, a new trace added via CALCulate<Ch>:PARameter:SDEFine
'<trace_name>', '<parameter>' also becomes the active trace. To select another trace as
the active trace, use (CALCulate<Ch>:PARameter:SELect '<trace_name>').
!
The active traces for manual and remote control may be different.
The following program example illustrates how to create, select and reference traces. It is instructive to
observe the analyzer screen in order to check the effect of each step.
*RST
Reset the analyzer, creating channel no. 1 with the default trace Trc1. The trace is displayed in diagram
area no. 1.
CALC1:PAR:SDEF 'Trc2', 'S11'; DISP:WIND:TRAC2:FEED 'Trc2'
Create a new trace named Trc2, assigned to channel no. 1 (the suffix 1 after CALC, may be omitted), and
display the trace. The new trace automatically becomes the active trace for manual and for remote control.
To check this, click Trace – Marker – Marker 1 to create a marker. The marker is assigned to Trc2. Delete
all markers (Trace – Marker – All Markers Off).
Operating Manual 1303.6580.32-01
267
R&S® ZVL
Remote Control - General Description
Command Processing
CALC1:MARK ON
To verify that Trc2 is also active for remote control, use the channel suffix 1 after CALC (may be omitted)
to reference the active trace in channel 1 and create a marker Mkr 1. The marker is assigned to Trc2.
CALC:PAR:SEL 'Trc1'; CALC1:MARK ON
Select the old default trace Trc1 as the active trace for remote control. Create a new marker to verify that
Trc1 is now the active trace in channel 1.
In the SCPI command description, the numeric suffix <Ch> is used for channel settings (it
denotes the configured channel), whereas <Chn> is used for trace settings (it denotes the
active trace in the channel).
Initiating Measurements, Speed Considerations
After a reset the network analyzer measures in continuous mode. The displayed trace shows the result of
the last sweep and is continuously updated. This provides a permanent visual control over the
measurement and the effect of any analyzer settings.
In remote control, it is advisable to follow a different approach in order use the analyzer's resources to full
capacity and gain measurement speed. The following principles can help to optimize a remote control
program (see also programming example Typical Stages of a Measurement):
•
Switch off the measurement while configuring your instrument.
•
Use a minimum number of suitably positioned sweep points.
•
Start a single sweep, observing proper command synchronization, and retrieve your results.
The following command sequence performs a single sweep in a single channel.
*RST; INITiate:CONTinous OFF
Activate single sweep mode for all channels (including the channels created later).
INITiate:SCOPe SING
State that a single sweep will be performed in the active channel only.
INITiate[:IMMediate]; *WAI
Start a single sweep in channel no. 2, wait until the sweep is terminated before proceeding to the next
command (see Command Synchronization).
Command Processing
The block diagram below shows how GPIB bus commands are serviced in the instrument.
The individual components work independently and simultaneously. They communicate with each other by
means of so-called "messages".
Operating Manual 1303.6580.32-01
268
R&S® ZVL
Remote Control - General Description
Command Processing
Input Unit
The input unit receives commands character by character from the controller and collects them in the input
buffer. The input unit sends a message to the command recognition as soon as the input buffer is full or as
soon as it receives a delimiter, <PROGRAM MESSAGE TERMINATOR>, as defined in IEEE 488.2, or the
interface message DCL.
If the input buffer is full, the message data traffic is stopped and the data received up to then is processed.
Subsequently the traffic is continued. If, however, the buffer is not yet full when receiving the delimiter, the
input unit can already receive the next command during command recognition and execution. The receipt
of a DCL clears the input buffer and immediately initiates a message to the command recognition.
Command Recognition
The command recognition stage analyzes the data received from the input unit. It proceeds in the order in
which it receives the data. Only a DCL is serviced with priority, e.g. a GET (Group Execute Trigger) is only
executed after the commands received before. Each recognized command is immediately transferred to
the data set but not executed immediately.
The command recognition detects syntax errors in the commands and transfers them to the status
reporting system. The rest of a command line after a syntax error is still executed, if possible. After the
syntax check, the range of the numerical parameters is checked, if required.
If the command recognition detects a delimiter or a DCL, it also requests the data set to perform the
necessary instrument hardware settings. Subsequently it is immediately prepared to process further
Operating Manual 1303.6580.32-01
269
R&S® ZVL
Remote Control - General Description
Command Processing
commands. This means that new commands can already be serviced while the hardware is still being set
("overlapping execution").
Data Base and Instrument Hardware
The expression "instrument hardware" denotes the part of the instrument fulfilling the actual instrument
function – signal generation, measurement etc. The controller is not included. The data base manages all
the parameters and associated settings required for the instrument hardware.
Setting commands lead to an alteration in the data set. The data set management enters the new values
(e.g. frequency) into the data set, however, it only passes them on to the hardware when requested by the
command recognition. This can only occur at the end of a command line, therefore the order of the setting
commands in the command line is not relevant.
The commands are only checked for their compatibility among each other and with the instrument
hardware immediately before they are transmitted to the instrument hardware. If the instrument detects
that execution is not possible, an "execution error" is signalled to the status reporting system. All
alterations of the data set are cancelled, the instrument hardware is not reset. Due to the delayed
checking and hardware setting, however, impermissible instrument states can be set for a short period of
time within one command line without this leading to an error message (example: simultaneous activation
of a frequency and a power sweep). At the end of the command line, however, a permissible instrument
state must have been reached again.
Before passing on the data to the hardware, the settling bit in the STATus:OPERation register is set (cf.
section STATus:OPERation Register). The hardware executes the settings and resets the bit again as
soon as the new state has settled. This fact can be used to synchronize command servicing.
Queries induce the data set management to send the desired data to the output unit.
Status Reporting System
The status reporting system collects information on the instrument state and makes it available to the
output unit on request. The exact structure and function are described in section Status Reporting System.
Output Unit
The output unit collects the information requested by the controller, which it receives from the data set
management. It processes it according to the SCPI rules and makes it available in the output buffer. If the
information requested is longer, it is made available "in portions" without this being recognized by the
controller.
If the instrument is addressed as a talker without the output buffer containing data or awaiting data from
the data set management, the output unit sends the error message "Query UNTERMINATED" to the
status reporting system. No data is sent on the GPIB bus or via the Ethernet, the controller waits until it
has reached its time limit. This behavior is specified by SCPI.
Command Sequence and Command Synchronization
IEEE 488.2 defines a distinction between overlapped and sequential commands:
!
A sequential command is one which finishes executing before the next command starts executing.
Commands that are processed quickly are usually implemented as sequential commands.
Operating Manual 1303.6580.32-01
270
R&S® ZVL
Remote Control - General Description
Command Processing
!
An overlapping command is one which does not automatically finish executing before the next
command starts executing. Usually, overlapping commands take longer to process and allow the
program to do other tasks while being executed. If overlapping commands do have to be executed
in a defined order, e.g. in order to avoid wrong measurement results, they must be serviced
sequentially. This is called synchronization between the controller and the analyzer.
According to section Data Set and Instrument Hardware, setting commands within one command line,
even though they may be implemented as sequential commands, are not necessarily serviced in the order
in which they have been received. In order to make sure that commands are actually carried out in a
certain order, each command must be sent in a separate command line. Examples:
Example 1: Commands and queries in one message
The response to a query combined in a program message with commands that affect the queried value is
not predictable. Sending
:FREQ:STAR 1GHZ;SPAN 100
:FREQ:STAR?
always returns 1000000000 (1 GHz). When:
:FREQ:STAR 1GHz;STAR?;SPAN 1000000
is sent, however, the result is not specified by SCPI. The result could be the value of STARt before the
command was sent since the instrument might defer executing the individual commands until a program
message terminator is received. The result could also be 1 GHz if the instrument executes commands as
they are received.
As a general rule, send commands and queries in different program messages.
Example 2: Overlapping command with *OPC
The analyzer implements INITiate[:IMMediate] as an overlapped command. Assuming that
INITiate[:IMMediate] takes longer to execute than *OPC, sending the command sequence
INIT; *OPC.
results in initiating a sweep and, after some time, setting the OPC bit in the ESR. Sending the commands:
INIT; *OPC; *CLS
still initiates a sweep. Since the operation is still pending when the analyzer executes *CLS, forcing it into
the Operation Complete Command Idle State (OCIS), *OPC is effectively skipped. The OPC bit is not set
until the analyzer executes another *OPC command.
The analyzer provides only one overlapped command, INITiate<Ch>[:IMMediate].
What is said below is not relevant for the other (sequential) SCPI commands.
Preventing overlapping execution
To prevent an overlapping execution of commands, one of the commands *OPC, *OPC? or *WAI can be
used. For a programming example refer to section Command Synchronization in Chapter Programming
Examples.
Operating Manual 1303.6580.32-01
271
R&S® ZVL
Remote Control - General Description
Status Reporting System
Command
Action after the hardware has settled
Programming the controller
*WAI
Stops further command processing until all
commands sent before *WAI have been
executed
Note: The GPIB bus handshake is not stopped
Send *WAI directly after the command
which should be terminated before the
next command is executed.
*OPC?
Stops command processing until 1 is returned,
i.e. until the Operation Complete bit has been set
in the ESR. This bit indicates that the previous
commands have been completed.
Send *OPC? directly after the
command which should be terminated
before the next command is executed.
*OPC
Sets the operation complete bit in the ESR
after all previous commands have been
executed.
– Set bit 0 in the ESE
– Set bit 5 in the SRE
– Wait for service request (SRQ)
Status Reporting System
The status reporting system stores all information on the present operating state of the instrument, and on
errors which have occurred. This information is stored in the status registers and in the error queue. Both
can be queried via GPIB bus or Ethernet (STATus... commands).
Hierarchy of status registers
As shown in the graphical overview, the status information is of hierarchical structure.
!
STB, SRE The STatus Byte (STB) register and its associated mask register Service Request
Enable (SRE) form the highest level of the status reporting system. The STB provides a rough
overview of the instrument status, collecting the information of the lower-level registers.
!
ESR, SCPI registers
The STB receives its information from the following registers:
!
The Event Status Register (ESR) with the associated mask register standard event status
enable (ESE).
!
The STATus:OPERation and STATus:QUEStionable registers which are defined by SCPI
and contain detailed information on the instrument.
!
IST, PPE The IST flag ("Individual STatus"), like the SRQ, combines the entire instrument status
in a single bit. The PPE is associated to the IST flag. It fulfills an analogous function for the IST
flag as the SRE does for the service request.
!
Output buffer contains the messages the instrument returns to the controller. It is not part of the
status reporting system but determines the value of the MAV bit in the STB and thus is
represented in the overview.
All status registers have the same internal structure.
The service request enable register SRE can be used as ENABle part of the STB if the STB
is structured according to SCPI. By analogy, the ESE can be used as the ENABle part of the
ESR.
Operating Manual 1303.6580.32-01
272
R&S® ZVL
Remote Control - General Description
Status Reporting System
Overview of Status Registers
The status registers of the network analyzer are implemented as shown below.
Structure of an SCPI Status Register
Each standard SCPI register consists of 5 parts which each have a width of 16 bits and have different
functions. The individual bits are independent of each other, i.e. each hardware status is assigned a bit
number which is valid for all five parts. Bit 15 (the most significant bit) is set to zero for all parts. Thus the
contents of the register parts can be processed by the controller as positive integer.
Operating Manual 1303.6580.32-01
273
R&S® ZVL
Remote Control - General Description
Status Reporting System
Description of the five status register parts
The five parts of an SCPI register have different properties and function:
!
CONDition
The CONDition part is permanently overwritten by the hardware or the sum bit of the next lower
register. Its contents always reflect the current instrument state.
This register part can only be read, but not overwritten or cleared. Reading the CONDition register
is nondestructive.
!
PTRansition
The two transition register parts define which state transition of the condition part (none, 0 to 1, 1
to 0 or both) is stored in the EVENt part.
The Positive TRansition part acts as a transition filter. When a bit of the CONDition part is
changed from 0 to 1, the associated PTR bit decides whether the EVENt bit is set to 1:
!
PTR bit =1: the EVENt bit is set.
!
PTR bit =0: the EVENt bit is not set.
This status register part can be overwritten and read at will. Reading the PTRansition register is
nondestructive.
!
NTRansition
The Negative TRansition part also acts as a transition filter. When a bit of the CONDition part is
changed from 1 to 0, the associated NTR bit decides whether the EVENt bit is set to 1.
NTR bit =1: the EVENt bit is set.
NTR bit =0: the EVENt bit is not set.
This part can be overwritten and read at will. Reading the PTRansition register is nondestructive.
!
EVENt
The EVENt part indicates whether an event has occurred since the last reading, it is the "memory"
of the condition part. It only indicates events passed on by the transition filters. It is permanently
updated by the instrument. This part can only be read by the user. Reading the register clears it.
This part is often equated with the entire register.
Operating Manual 1303.6580.32-01
274
R&S® ZVL
Remote Control - General Description
Status Reporting System
!
ENABle
The ENABle part determines whether the associated EVENt bit contributes to the sum bit (cf.
below). Each bit of the EVENt part is ANDed with the associated ENABle bit (symbol '&'). The
results of all logical operations of this part are passed on to the sum bit via an OR function
(symbol '+').
!
ENAB bit =0: The associated EVENt bit does not contribute to the sum bit.
!
ENAB bit =1: If the associated EVENT bit is "1", the sum bit is set to "1" as well.
This part can be overwritten and read by the user at will. Its contents are not affected by reading.
As shown in the graphical overview, the status information is of hierarchical structure.
!
STB, SRE The register STatus Byte (STB) defined in IEEE 488.2 and its associated mask register
Service Request Enable (SRE) form the highest level of the status reporting system. The STB
provides a rough overview of the instrument status, collecting the information of the lower-level
registers.
!
ESR, SCPI registers
The STB receives its information from the following registers:
!
The standard IEEE 488.2 Event Status Register (ESR) with the associated mask register
standard event status enable (ESE).
!
The STATus:OPERation and STATus:QUEStionable registers which are defined by SCPI
and contain detailed information on the instrument.
!
IST, PPE The IST flag ("Individual STatus"), like the SRQ, combines the entire instrument status
in a single bit. The PPE is associated to the IST flag. It fulfills an analogous function for the IST
flag as the SRE does for the service request.
!
Output buffer contains the messages the instrument returns to the controller. It is not part of the
status reporting system but determines the value of the MAV bit in the STB and thus is
represented in the overview.
The sum bit is obtained from the EVENt and ENABle part for each register. The result is then entered into
a bit of the CONDition part of the higher-order register.
The instrument automatically generates the sum bit for each register. Thus an event can lead to a service
request throughout all levels of the hierarchy.
Status Registers
Contents of the Status Registers
The individual status registers are used to report different classes of instrument states or errors. The
following status registers belong to the general model described in IEEE 488.2:
!
The STatus Byte (STB) gives a rough overview of the instrument status.
!
The IST flag combines the entire status information into a single bit that can be queried in a
parallel poll.
!
The Event Status Register (ESR) indicates general instrument states.
The status registers below belong to the device-dependent SCPI register model:
!
The STATus:OPERation register contains conditions which are part of the instrument's normal
operation.
Operating Manual 1303.6580.32-01
275
R&S® ZVL
Remote Control - General Description
Status Reporting System
!
The STATus:QUEStionable register indicates whether the data currently being acquired is of
questionable quality.
!
The STATus:QUEStionable:LIMit<1|2> register indicates the result of the limit check.
STB and SRE
The STatus Byte (STB) provides a rough overview of the instrument status by collecting the pieces of
information of the lower registers. The STB represents the highest level within the SCPI hierarchy. A
special feature is that bit 6 acts as the summary bit of the remaining bits of the status byte.
SRE and Service Request
The STatus Byte (STB) is linked to the Service Request Enable (SRE) register on a bit-by-bit basis.
!
The STB corresponds to the CONDition part of an SCPI register, indicating the current instrument
state.
!
The SRE corresponds to the ENABle part of an SCPI register.If a bit is set in the SRE and the
associated bit in the STB changes from 0 to 1, a Service Request (SRQ) is generated on the
GPIB bus.
Bit 6 of the SRE is ignored, because it corresponds to the summary bit of the STB.
Related common commands
The STB is read out using the command *STB? or a serial poll.
The SRE can be set using command *SRE and read using *SRE?.
The bits in the STB are defined as follows:
Bit
No.
Meaning
3
QUEStionable status summary bit
This bit is set if an EVENt bit is set in the QUEStionable register and the associated ENABle bit is set to
1.
The bit indicates a questionable instrument status, which can be further pinned down by polling the
QUEStionable register.
5
ESB bit
Sum bit of the event status register. It is set if one of the bits in the event status register is set and
enabled in the event status enable register.
Setting of this bit implies an error or an event which can be further pinned down by polling the event
status register.
IST Flag and PPE
In analogy to the Service Request (SRQ), the IST flag combines the entire status information in a single
bit. It can be queried by means of a parallel poll.
The Parallel Poll Enable (PPE) register determines which bits of the STB contribute to the IST flag. The
bits of the STB are ANDed with the corresponding bits of the PPE, with bit 6 being used as well in contrast
to the SRE. The IST flag results from the ORing of all results.
Operating Manual 1303.6580.32-01
276
R&S® ZVL
Remote Control - General Description
Status Reporting System
Related common commands
The IST flag is queried using the command *IST?.
The PPE can be set using *PRE and read using command *PRE?.
ESR and ESE
The Event Status Register (ESR) indicates general instrument states. It is linked to the Event Status
Enable (ESE) register on a bit-by-bit basis.
!
The ESR corresponds to the CONDition part of an SCPI register, indicating the current instrument
state.
!
The ESE corresponds to the ENABle part of an SCPI register. If a bit is set in the ESE and the
associated bit in the ESR changes from 0 to 1, the ESB bit in the STatus Byte is set.
Related common commands
The Event Status Register (ESR) can be queried using ESR?.
The Event Status Enable (ESE) register can be set using the command *ESE and read using *ESE?.
The bits in the ESR are defined as follows:
Bit No.
Meaning
0
Operation Complete
This bit is set on receipt of the command *OPC after all previous commands have been executed.
STATus:OPERation
The STATus:OPERation register contains conditions which are part of the instrument's normal operation.
The analyzer does not use the STATus:OPERation register:
STATus:QUEStionable
The STATus:QUEStionable register indicates whether the acquired data is of questionable quality and
monitors hardware failures of the analyzer. It can be queried using the commands
STATus:QUEStionable:CONDition? or STATus:QUEStionable[:EVENt]?
The bits in the STATus:QUEStionable register are defined as follows:
Bit
No.
Meaning
9
Integrity Register summary
This bit is set if a bit is set in the STATus:QUEStionable:INTegrity register and the associated ENABle
bit is set to 1.
10
Limit Register summary
This bit is set if a bit is set in the STATus:QUEStionable:LIMit1 register and the associated ENABle bit is
set to 1.
Operating Manual 1303.6580.32-01
277
R&S® ZVL
Remote Control - General Description
Status Reporting System
STATus:QUEStionable:LIMit1<1|2>
The STATus:QUEStionable:LIMit<1|2> registers indicate the result of the limit check. They can be queried
using
the
commands
STATus:QUEStionable:LIMit<1|2>:CONDition?
or
STATus:QUEStionable:LIMit<1|2>[:EVENt]? STATus:QUEStionable:LIMit1 is also the summary
register of the lower-level STATus:QUEStionable:LIMit2 register.
The bits in the STATus:QUEStionable:LIMit1 register are defined as follows:
Bit
No.
Meaning
0
LIMit2 Register summary
This bit is set if a bit is set in the STATus:QUEStionable:LIMit2 register and the associated ENABle bit
1
Failed Limit Check for Trace no. 1
is set to 1.
This bit is set if any point on trace no. 1 fails the limit check.
...
...
14
Failed Limit Check for Trace no. 14
This bit is set if any point on trace no. 14 fails the limit check.
The bits in the STATus:QUEStionable:LIMit2 register are defined as follows:
Bit No.
Meaning
0
Not used
1
Failed Limit Check for Trace no. 15
This bit is set if any point on trace no. 15 fails the limit check.
2
Failed Limit Check for Trace no. 16
This bit is set if any point on trace no. 16 fails the limit check.
Numbering of traces
The traces numbers 1 to 16 are assigned as follows:
!
Traces assigned to channels with smaller channel numbers have smaller trace numbers.
!
Within a channel, the order of traces reflects their creation time: The oldest trace has the smallest,
the newest trace has the largest trace number. This is equivalent to the order of traces in the
response string of the CALCulate<Ch>:PARameter:CATalog? query.
!
The number of traces monitored cannot exceed 16. If a setup contains more traces, the newest
traces are not monitored.
Application of the Status Reporting System
The purpose of the status reporting system is to monitor the status of one or several devices in a
measuring system. To do this and react appropriately, the controller must receive and evaluate the
Operating Manual 1303.6580.32-01
278
R&S® ZVL
Remote Control - General Description
Status Reporting System
information of all devices. The following standard methods are used:
!
Service request (SRQ) initiated by the measuring device
!
Serial poll of all devices in the bus system, initiated by the controller in order to find out who sent a
SRQ and why
!
Parallel poll of all devices
!
Query of a specific instrument status by means of commands
!
Query of the error queue
Service Request
The measuring device can send a service request (SRQ) to the controller. Usually this service request
causes an interrupt, to which the control program can react appropriately.
Initiating an SRQ
As shown in the graphical overview, an SRQ is initiated if one or several of bits 2, 3, 4, 5 or 7 of the status
byte are set and enabled in the SRE. Each of these bits summarizes the information of a further register,
the error queue or the output buffer.
The ENABle parts of the status registers can be set such that arbitrary bits in an arbitrary status register
initiate an SRQ. To use the possibilities of the service request effectively, all bits in the enable registers
SRE and ESE should be set to "1".
Examples:
!
Use *OPC to generate an SRQ
1. Set bit 0 in the ESE (Operation Complete).
2. Set bit 5 in the SRE (ESB).
3. Insert *OPC in the command sequence (e.g. at the end of a sweep).
As soon as all commands preceding *OPC have been completed, the instrument generates an
SRQ.
!
Generate an SRQ when a limit is exceeded
4. Set bit 3 in the SRE (summary bit of the STATus:QUEStionable register, set after
STATus:PRESet)
5. Set bit 10 in the STATus:QUEStionable:ENABle register (summary bit of the
STATus:QUEStionable:LIMit1 register)
6. Set bit 1 in the STATus:QUEStionable:LIMit1:ENABle register
The analyzer generates a SRQ when the event associated with bit 1 of the
STATus:QUEStionable:LIMit1:ENABle register occurs, i.e. when any point on the first trace fails
the limit check.
!
Find out which event caused an SRQ
The procedure to find out which event caused an SRQ is analogous to the procedure to generate
an SRQ:
7. STB? (query the contents of the status byte in decimal form)
If bit 3 (QUEStionable summary bit) is set, then:
Operating Manual 1303.6580.32-01
279
R&S® ZVL
Remote Control - General Description
Status Reporting System
8. STAT:QUES:EVENT? (query STATus:QUEStionable register)
If bit 10 (QUEStionable:LIMit1 summary bit) is set, then:
9. Query STAT:QUES:LIMit1:EVENT? (query STATus:QUEStionable:LIMit1 register)
If bit 1 is set, then the first trace failed the limit check.
The SRQ is the only possibility for the instrument to become active on its own. Each
controller program should set the instrument such that a service request is initiated in the
case of malfunction. The program should react appropriately to the service request.
Serial Poll
In a serial poll, the controller queries the STatus Bytes of the devices in the bus system one after another.
The query is made via interface messages, so it is faster than a poll by means of *STB?.
Serial poll procedure
The serial poll method is defined in IEEE 488.1 and used to be the only standard possibility for different
instruments to poll the status byte. The method also works for instruments which do not adhere to SCPI or
IEEE 488.2.
The Visual BASIC command for executing a serial poll is "IBRSP()".
The serial poll is mainly used to obtain a fast overview of the state of several instruments connected to the
controller.
Parallel Poll
In a parallel poll, up to eight instruments are simultaneously requested by the controller by means of a
single command to transmit 1 bit of information each on the data lines, i.e., to set the data line allocated to
each instrument to a logical "0" or "1".
Parallel poll procedure
In addition to the SRE register, which determines the conditions under which an SRQ is generated, there
is a Parallel Poll Enable register (PPE) which is ANDed with the STB bit by bit, considering bit 6 – AND as
well. This register is ANDed with the STB bit by bit, considering bit 6 as well. The results are ORed, the
result is possibly inverted and then sent as a response to the parallel poll of the controller. The result can
also be queried without parallel poll by means of the command "*IST?".
The instrument first has to be set for the parallel poll using the Visual BASIC command "IBPPC()". This
command allocates a data line to the instrument and determines whether the response is to be inverted.
The parallel poll itself is executed using "IBRPP()".
The parallel poll method is mainly used to find out quickly which one of the instruments connected to the
controller has sent a service request. To this effect, SRE and PPE must be set to the same value.
Query of an Instrument Status
Each part of any status register can be read by means of queries. There are two types of commands:
Operating Manual 1303.6580.32-01
280
R&S® ZVL
Remote Control - General Description
Status Reporting System
!
The common commands *ESR?, *IDN?, *IST?, *STB? query the higher-level registers.
!
The commands of the STATus system query the SCPI registers (STATus:QUEStionable...)
All queries return a decimal number which represents the bit pattern of the status register. This number is
evaluated by the controller program.
Decimal representation of a bit pattern
The STB and ESR registers contain 8 bits, the SCPI registers 16 bits. The contents of a status register is
keyed and transferred as a single decimal number. To make this possible, each bit is assigned a weighted
value. The decimal number is calculated as the sum of the weighted values of all bits in the register that
are set to 1.
Bits
0
1
1
2
2
3
4
5
6
7
...
16
32
64
128
...
Weight
4
8
Example: The decimal value 40 = 32 + 8 indicates that bits no. 3 and 5 in the status register (e.g. the
QUEStionable status summary bit and the ESB bit in the STatus Byte) are set.
Queries are usually used after an SRQ in order to obtain more detailed information on the cause of the
SRQ.
Error Queue
Each error state in the instrument leads to an entry in the error queue. The entries of the error queue are
detailed plain text error messages that can be looked up in the Error Log or queried via remote control
using SYSTem:ERRor[:NEXT]? or SYSTem:ERRor:ALL?. Each call of SYSTem:ERRor[:NEXT]?
provides one entry from the error queue. If no error messages are stored there any more, the instrument
responds with 0, "No error".
The error queue should be queried after every SRQ in the controller program as the entries describe the
cause of an error more precisely than the status registers. Especially in the test phase of a controller
program the error queue should be queried regularly since faulty commands from the controller to the
instrument are recorded there as well.
Reset Values of the Status Reporting System
The table below indicates the effects of various commands upon the status reporting system of the
analyzer.
Event
Effect
Switching
on
supply
voltage
Power-OnStatus-Clear
0
DCL,SDC(Device
Clear,
Selected Device
Clear)
*RST or
SYSTem:PRESet
STATus:PRESet
*CLS
1
Clear STB,ESR
yes
Clear SRE,ESE
yes
Operating Manual 1303.6580.32-01
yes
281
R&S® ZVL
Remote Control - General Description
Status Reporting System
Clear PPE
yes
Clear EVENt parts of the
registers
yes
Clear ENABle parts of all
OPERation-and
QUESTionable registers,
Fill ENABle parts of all
other registers with "1".
yes
yes
Fill PTRansition parts
with „1"
Clear NTRansition parts
yes
yes
Clear error queue
yes
yes
Clear output buffer
yes
yes
Clear command
processing and input
buffer
yes
yes
yes
yes
yes
1)
1)
1)
yes
1) Every command being the first in a command line, i.e. immediately following a <PROGRAM MESSAGE TERMINATOR> clears
the output buffer.
Operating Manual 1303.6580.32-01
282
R&S® ZVL
Command Reference
Special Terms and Notation
7
Command Reference.......................................................................................... 291
Special Terms and Notation ...........................................................................................................291
Common Commands.......................................................................................................................293
CALCulate.........................................................................................................................................294
CALCulate:CLIMits..........................................................................................................................294
CALCulate<Chn>:CLIMits... .........................................................................................................294
CALCulate:DATA ............................................................................................................................295
CALCulate<Chn>:DATA...............................................................................................................295
CALCulate:DLINe............................................................................................................................297
CALCulate<Chn>:DLINe... ...........................................................................................................297
CALCulate:FORMat ........................................................................................................................298
CALCulate<Chn>:FORMat...........................................................................................................298
CALCulate:LIMit ..............................................................................................................................299
CALCulate<Chn>:LIMit.................................................................................................................299
CALCulate:MARKer ........................................................................................................................314
CALCulate<Chn>:MARKer<Mk>..................................................................................................314
CALCulate:MATH............................................................................................................................331
CALCulate<Chn>:MATH... ...........................................................................................................331
CALCulate:PARameter ...................................................................................................................332
CALCulate<Ch>:PARameter........................................................................................................332
CALCulate:PHOLd ..........................................................................................................................336
CALCulate<Chn>:PHOLd.............................................................................................................336
CALCulate:SMOothing....................................................................................................................337
CALCulate<Chn>:SMOothing... ...................................................................................................337
CALCulate:STATistics.....................................................................................................................338
CALCulate<Chn>:STATistics... ....................................................................................................338
CALCulate:TRANsform ...................................................................................................................342
CALCulate<Chn>:TRANsform......................................................................................................342
Operating Manual 1303.6580.32-01
283
R&S® ZVL
Command Reference
Special Terms and Notation
CONFigure ........................................................................................................................................343
CONFigure:CHANnel<Ch>... ..........................................................................................................343
CONFigure:CHANnel<Ch>:CATalog? .........................................................................................343
CONFigure:CHANnel<Ch>:NAME '<Ch_name>'.........................................................................343
CONFigure:CHANnel<Ch>:NAME:ID? '<Ch_name>' ..................................................................344
CONFigure:CHANnel<Ch>[:STATe] <Boolean>..........................................................................344
DIAGnostic .......................................................................................................................................344
DIAGnostic:SERVice.......................................................................................................................344
DIAGnostic:SERVice:FUNCtion <numeric_value>,... ..................................................................345
DIAGnostic:SERVice:SFUNction '<string>',... ..............................................................................345
DISPlay..............................................................................................................................................345
DISPlay... ........................................................................................................................................345
DISPlay:ANNotation:FREQuency[:STATe] <Boolean>................................................................345
DISPlay:CMAP<Element>:MARKer[:STATe] <Boolean> ............................................................345
DISPlay:CMAP<Element>:RGB <red>, <green>, <blue> [,<trace_style>, <trace_width>] .........346
DISPlay:CMAP<Element>:TRACe:COLor[:STATe] <Boolean> ..................................................348
DISPlay:MENU:KEY:EXECute '<menu_key>'..............................................................................349
DISPlay:MENU:KEY:SELect '<menu_key>'.................................................................................349
DISPlay[:WINDow<Wnd>]:MAXimize <Boolean> ........................................................................350
DISPlay[:WINDow<Wnd>]:STATe <Boolean> .............................................................................350
DISPlay[:WINDow<Wnd>]:TITLe:DATA '<string>' .......................................................................351
DISPlay[:WINDow<Wnd>]:TITLe[:STATe] <Boolean> ................................................................351
DISPlay[:WINDow<Wnd>]:TRACe<WndTr>:DELete...................................................................351
DISPlay[:WINDow<Wnd>]:TRACe<WndTr>:FEED '<trace_name>' ...........................................352
DISPlay[:WINDow<Wnd>]:TRACe<WndTr>:X:OFFSet <numeric_value> .................................353
DISPlay[:WINDow<Wnd>]:TRACe<WndTr>:Y:OFFSet <Magnitude>[,<Phase>, <Real>,
<Imaginary>].................................................................................................................................353
DISPlay[:WINDow<Wnd>]:TRACe<WndTr>:Y[:SCALe]:AUTO ONCE[, '<trace_name>']..........354
DISPlay[:WINDow<Wnd>]:TRACe<WndTr>:Y[:SCALe]:BOTTom <lower_value>[,
'<trace_name>'] ............................................................................................................................354
Operating Manual 1303.6580.32-01
284
R&S® ZVL
Command Reference
Special Terms and Notation
DISPlay[:WINDow<Wnd>]:TRACe<WndTr>:Y[:SCALe]:PDIVision <numeric_value>[,
'<trace_name>'] ............................................................................................................................355
DISPlay[:WINDow<Wnd>]:TRACe<WndTr>:Y[:SCALe]:RLEVel <numeric_value>[,
'<trace_name>'] ............................................................................................................................356
DISPlay[:WINDow<Wnd>]:TRACe<WndTr>:Y[:SCALe]:RPOSition <numeric_value>[,
'<trace_name>'] ............................................................................................................................357
DISPlay[:WINDow<Wnd>]:TRACe<WndTr>:Y[:SCALe]:TOP <upper_value>[, '<trace_name>']357
Units for DISPlay... Commands....................................................................................................358
WINDow ..........................................................................................................................................358
DISPlay:ANNotation:FREQuency[:STATe] <Boolean>................................................................359
DISPlay:CMAP<Element>:MARKer[:STATe] <Boolean> ............................................................359
DISPlay:CMAP<Element>:RGB <red>, <green>, <blue> [,<trace_style>, <trace_width>] .........359
DISPlay:CMAP<Element>:TRACe:COLor[:STATe] <Boolean> ..................................................362
DISPlay:MENU:KEY:EXECute '<menu_key>'..............................................................................362
DISPlay:MENU:KEY:SELect '<menu_key>'.................................................................................363
DISPlay[:WINDow<Wnd>]:MAXimize <Boolean> ........................................................................363
DISPlay[:WINDow<Wnd>]:STATe <Boolean> .............................................................................364
DISPlay[:WINDow<Wnd>]:TITLe:DATA '<string>' .......................................................................364
DISPlay[:WINDow<Wnd>]:TITLe[:STATe] <Boolean> ................................................................365
DISPlay[:WINDow<Wnd>]:TRACe<WndTr>:DELete...................................................................365
DISPlay[:WINDow<Wnd>]:TRACe<WndTr>:FEED '<trace_name>' ...........................................366
DISPlay[:WINDow<Wnd>]:TRACe<WndTr>:X:OFFSet <numeric_value> .................................366
DISPlay[:WINDow<Wnd>]:TRACe<WndTr>:Y:OFFSet <Magnitude>[,<Phase>, <Real>,
<Imaginary>].................................................................................................................................367
DISPlay[:WINDow<Wnd>]:TRACe<WndTr>:Y[:SCALe]:AUTO ONCE[, '<trace_name>']..........367
DISPlay[:WINDow<Wnd>]:TRACe<WndTr>:Y[:SCALe]:BOTTom <lower_value>[,
'<trace_name>'] ............................................................................................................................368
DISPlay[:WINDow<Wnd>]:TRACe<WndTr>:Y[:SCALe]:PDIVision <numeric_value>[,
'<trace_name>'] ............................................................................................................................369
DISPlay[:WINDow<Wnd>]:TRACe<WndTr>:Y[:SCALe]:RLEVel <numeric_value>[,
'<trace_name>'] ............................................................................................................................370
DISPlay[:WINDow<Wnd>]:TRACe<WndTr>:Y[:SCALe]:RPOSition <numeric_value>[,
'<trace_name>'] ............................................................................................................................370
Operating Manual 1303.6580.32-01
285
R&S® ZVL
Command Reference
Special Terms and Notation
DISPlay[:WINDow<Wnd>]:TRACe<WndTr>:Y[:SCALe]:TOP <upper_value>[, '<trace_name>']371
Units for DISPlay... Commands....................................................................................................372
FORMat .............................................................................................................................................372
FORMat...........................................................................................................................................372
FORMat:BORDer NORMal | SWAPped .......................................................................................372
FORMat[:DATA] ASCii | REAL [,<length>] ...................................................................................373
FORMat:DEXPort:SOURce FDATa | SDATa | MDATa ...............................................................373
INITiate ..............................................................................................................................................375
INITiate<Ch>... ................................................................................................................................375
INITiate<Ch>:CONTinuous <Boolean>........................................................................................375
INITiate<Ch>[:IMMediate] ............................................................................................................375
INPut..................................................................................................................................................376
INPut... ............................................................................................................................................376
INPut<port_no>:ATTenuation <numeric_value>..........................................................................376
INSTrument.......................................................................................................................................377
INSTrument... ..................................................................................................................................377
INSTrument:NSELect <Ch> .........................................................................................................377
INSTrument:PORT:COUNt?.........................................................................................................377
INSTrument[:SELect] CHANNEL1 | CHANNEL2 | CHANNEL3 | CHANNEL4 ............................377
MEMory .............................................................................................................................................378
MEMory... ........................................................................................................................................378
MEMory:CATalog? .......................................................................................................................378
MEMory:DEFine '<setup_name>'.................................................................................................378
MEMory:DELete[:NAME] '<file_name>' .......................................................................................379
MEMory:SELect '<setup_name>' .................................................................................................379
MMEMory ..........................................................................................................................................380
MMEMory... .....................................................................................................................................380
MMEMory:AKAL:FACTory:CONVersion '<directory_name>'.......................................................380
MMEMory:CATalog? [<directory_name>] ....................................................................................380
MMEMory:CATalog:ALL? [<directory_name>].............................................................................381
Operating Manual 1303.6580.32-01
286
R&S® ZVL
Command Reference
Special Terms and Notation
MMEMory:CDIRectory '<directory_name>' ..................................................................................382
MMEMory:COPY '<file_source>','<file_destination>' ...................................................................382
MMEMory:DATA '<file_name>', <data> .......................................................................................382
MMEMory:DELete '<file_name>' ..................................................................................................383
MMEMory:DELete:CORRection <file_name>' .............................................................................383
MMEMory:LOAD:CKIT '<file_name>' ...........................................................................................383
MMEMory:LOAD:CKIT:SDATa '<conn_name>', '<ckit_name>', MMTHrough | MFTHrough |
FFTHrough | MMLine | MFLine | FFLine | MMATten | MFATten | FFATten | MMSNetwork |
MFSNetwork | FFSNetwork | MOPen | FOPen | MSHort | FSHort | MOSHort | FOSHort |
MREFlect | FREFlect | MMTCh | FMTCh | MSMatch | FSMatch, '<stdlabel_name>', '<file_name>'
[,<port1_no>][,<port2_no>]...........................................................................................................384
MMEMory:LOAD:CMAP '<file_name>'.........................................................................................385
MMEMory:LOAD:CORRection <Ch>,'<file_name>' .....................................................................385
MMEMory:LOAD:CORRection:RESolve <Ch>[,'<file_name>']....................................................386
MMEMory:LOAD:LIMit '<trc_name>','<file_name>'[,'<param_name>', <x_offset>, <y_offset>,
<type>]386
MMEMory:LOAD:SEGMent <Ch>,'<file_name>'..........................................................................388
MMEMory:LOAD:STATe <numeric_value>,'<file_name>' ...........................................................388
MMEMory:LOAD:TRACe '<trc_name>','<file_name>'[,'<parameter_name>'] .............................389
MMEMory:MDIRectory '<directory_name>'..................................................................................390
MMEMory:MOVE '<file_source>','<file_destination>'...................................................................390
MMEMory:NAME '<file_name>'....................................................................................................391
MMEMory:RDIRectory '<directory_name>' ..................................................................................391
MMEMory:STORe:CKIT '<kit_name>', '<file_name>' ..................................................................391
MMEMory:STORe:CMAP '<file_name>' ......................................................................................392
MMEMory:STORe:CORRection <Ch>,'<file_name>'...................................................................392
MMEMory:STORe:LIMit '<trc_name>', '<file_name>' ..................................................................393
MMEMory:STORe:MARKer '<file_name>' ...................................................................................393
MMEMory:STORe:SEGMent <Ch>, '<file_name>' ......................................................................394
MMEMory:STORe:STATe <numeric_value>,'<file_name>'.........................................................394
MMEMory:STORe:TRACe '<trc_name>','<file_name>'[,UNFormatted , COMPlex | LINPhase |
LOGPhase] ...................................................................................................................................394
Operating Manual 1303.6580.32-01
287
R&S® ZVL
Command Reference
Special Terms and Notation
OUTPut..............................................................................................................................................395
OUTPut<Pt>....................................................................................................................................395
OUTPut<Chn>:DPORt PORT1 | PORT2 .....................................................................................395
PROGram..........................................................................................................................................396
PROGram........................................................................................................................................396
PROGram[:SELected]:EXECute '<file_name>[ <command>]'.....................................................396
PROGram[:SELected]:NAME PROG ..........................................................................................397
PROGram[:SELected]:WAIT ........................................................................................................397
[SENSe...]..........................................................................................................................................398
[SENSe<Ch>:]AVERage.................................................................................................................398
[SENSe<Ch>:]AVERage... ...........................................................................................................398
[SENSe<Ch>:]BANDwidth ..............................................................................................................399
[SENSe<Ch>:]BANDwidth............................................................................................................399
[SENSe<Ch>:]CORRection ............................................................................................................400
[SENSe<Ch>:]CORRection..........................................................................................................400
[SENSe:]CORRection:CKIT .........................................................................................................401
[SENSe:]CORRection:COLLect ...................................................................................................407
[SENSe<Ch>:]FREQuency .............................................................................................................423
[SENSe<Ch>:]FREQuency... .......................................................................................................423
[SENSe<Ch>:]FREQuency... .......................................................................................................424
[SENSe<Ch/Tr>:]FUNCtion ............................................................................................................426
[SENSe<Chn>:]FUNCtion... .........................................................................................................426
[SENSE<Ch/r>:]ROSCillator ...........................................................................................................427
[SENSe<Ch>:]ROSCillator... ........................................................................................................427
[SENSe<Ch>:]SEGMent .................................................................................................................428
[SENSe<Ch>:]SEGMent<Seg>....................................................................................................428
[SENSe<Ch>:]SEGMent<Seg>:BWIDth[:RESolution] <numeric_value> ....................................429
[SENSe<Ch>:]SEGMent<Seg>:BWIDth[:RESolution]:CONTrol <Boolean> ...............................429
[SENSe<Ch>:]SEGMent:CLEar ...................................................................................................430
[SENSe<Ch>:]SEGMent<Seg>:COUNt? .....................................................................................430
Operating Manual 1303.6580.32-01
288
R&S® ZVL
Command Reference
Special Terms and Notation
[SENSe<Ch>:]SEGMent<Seg>:DEFine <Start>,<Stop>,<Points>,<Power>,<Point
Delay>,<Unused>,<Meas. Bandwidth>[,<LO>]............................................................................431
[SENSe<Ch>:]SWEep ....................................................................................................................441
[SENSe<Ch>:]SWEep..................................................................................................................441
SOURce.............................................................................................................................................446
SOURce<Ch>:POWer... .................................................................................................................446
SOURce<Ch>:POWer<Pt>[:LEVel][:IMMediate][:AMPlitude] <numeric_value> .........................446
STATus .............................................................................................................................................447
STATus... ........................................................................................................................................447
STATus:PRESet ...........................................................................................................................447
STATus:QUEStionable:CONDition?.............................................................................................447
STATus:QUEStionable:ENABle ...................................................................................................447
STATus:QUEStionable[:EVENt]? .................................................................................................448
STATus:QUEStionable:NTRansition ............................................................................................448
STATus:QUEStionable:PTRansition ............................................................................................448
STATus:QUEStionable:LIMit<1|2>:CONDition? ..........................................................................449
STATus:QUEStionable:LIMit<1|2>:ENABle .................................................................................449
STATus:QUEStionable:LIMit<1|2>[:EVENt]?...............................................................................449
STATus:QUEStionable:LIMit<1|2>:NTRansition..........................................................................449
STATus:QUEStionable:LIMit<1|2>:PTRansition ..........................................................................450
STATus:QUEue[:NEXT]? .............................................................................................................450
SYSTem ............................................................................................................................................451
SYSTem... .......................................................................................................................................451
SYSTem:COMMunicate:GPIB[:SELF]:ADDRess <address_no> ................................................451
SYSTem:COMMunicate:GPIB[:SELF]:RTERminator LFEoi | EOI...............................................451
SYSTem:DATA:SIZE ALL | AUTO ...............................................................................................452
SYSTem:DISPlay:COLor DBACkground | LBACkground | BWLStyles | BWSolid ......................452
SYSTem:DISPlay:UPDate <Boolean> | ONCE............................................................................453
SYSTem:ERRor[:NEXT]?.............................................................................................................453
SYSTem:ERRor:ALL? ..................................................................................................................453
Operating Manual 1303.6580.32-01
289
R&S® ZVL
Command Reference
Special Terms and Notation
SYSTem:ERRor:DISPlay <Boolean>...........................................................................................454
SYSTem:FIRMware:UPDate '<file_name>'..................................................................................454
SYSTem:KLOCk <Boolean> ........................................................................................................454
SYSTem:PASSword[:CENable] '<password>' .............................................................................455
SYSTem:PRESet .........................................................................................................................455
SYSTem:PRESet:SCOPe ALL | SINGle ......................................................................................455
SYSTem:PRESet:USER[:STATe] <Boolean>..............................................................................456
SYSTem:PRESet:USER:NAME '<Setup_file>' ............................................................................456
SYSTem:SETTings:UPDate ONCE .............................................................................................457
SYSTem:VERSion?......................................................................................................................459
TRACe ...............................................................................................................................................459
TRACe.............................................................................................................................................459
Reserved Trace Names................................................................................................................459
TRACe:CLEar MDATA1 | MDATA2 | MDATA3 | MDATA4 | MDATA5 | MDATA6 | MDATA7 |
MDATA8 460
TRACe:COPY <memory_trc>,<data_trc> ....................................................................................460
TRACe:COPY:MATH <memory_trc>,<data_trc>.........................................................................461
TRACe[:DATA][:RESPonse][:ALL]? CH1DATA | CH2DATA | CH3DATA | CH4DATA | CH1MEM |
CH2MEM | CH3MEM | CH4MEM | MDATA1 | MDATA2 | MDATA3 | MDATA4 | MDATA5 |
MDATA6 | MDATA7 | MDATA8 ....................................................................................................463
TRACe[:DATA]:STIMulus[:ALL]? CH1DATA | CH2DATA | CH3DATA | CH4DATA | CH1MEM |
CH2MEM | CH3MEM | CH4MEM | MDATA1 | MDATA2 | MDATA3 | MDATA4 | MDATA5 |
MDATA6 | MDATA7 | MDATA8 ....................................................................................................463
Operating Manual 1303.6580.32-01
290
R&S® ZVL
Command Reference
Special Terms and Notation
7 Command Reference
This chapter lists all common commands and SCPI commands implemented by the analyzer.
Special Terms and Notation
This section explains the meaning of special syntax elements used in the SCPI command reference
sections. A general description of the SCPI command syntax can be found in section SCPI Command
Structure and Syntax in Chapter Remote Control.
Compatibility with ZVR and other instruments
The SCPI command set for the R&S ZVL vector network analyzer has been designed for
compatibility with older R&S network analyzers of the ZVR type. A special class of commands,
, has been implemented primarily for compatibility reasons. Use
marked with the symbol
these commands if you want to maintain compatibility with ZVR analyzers. If you want to make full
use of the ZVL features and don't need ZVR compatibility, you should use the generalized, R&S
ZVL-specific commands. A link to a generalized command is provided in the description of each
ZVR-specific command.
Similar considerations also hold for other commands that have been "implemented for compatibility
reasons".
•
Information in the command tables
All commands are described according to the same scheme. The following information is
provided:
1. Complete command syntax and parameter list
2. Description of the command and its relationship with other commands
3. List and description of the parameters with their numerical ranges, default values and
default units
4. SCPI conformance information, supported command types (setting command, query)
5. Program example
•
Order of commands
The commands are arranged in alphabetical order. SCPI systems or subsystems are arranged in
one topic.
•
Parameters
Many commands are supplemented by a parameter or a list of parameters. Parameters either
provide alternative options (setting a or setting b or setting c ..., see special character "|"), or they
form a list separated by commas (setting x,y).
•
<Par_Name> In the command tables and lists, parameters are generally described by a name
(literal) written in angle brackets (<>). This literal merely serves as a parameters description; in an
application program it must be replaced by one of the possible settings reported in the detailed
parameter description.
•
Example: CONTrol:AUXiliary:C[:DATA] <numeric_value>
with <numeric_value> = 0 to 15
Operating Manual 1303.6580.32-01
291
R&S® ZVL
Command Reference
Special Terms and Notation
possible command syntax:
CONT:AUX:C 1
•
NAN (Not A Number) is generally used to represent missing data, e.g. if a portion of a trace has
not been acquired yet. It is also returned after invalid mathematical operations such as division by
zero. As defined in the SCPI standard, NAN is represented as 9.91 E 37.
•
INV (invalid) is returned e.g. if a limit check is performed without defining the appropriate tolerance
values.
•
Upper/lower case
Upper/lower case characters characterize the long and short form of the mnemonics in a
command. The short form consists of all upper-case characters, the long form of all upper
case plus all lower case characters. On the ZVL, either the short form or the long form are
allowed; mixed forms will generally not be recognized. The instrument itself does not
distinguish upper case and lower case characters.
•
Special characters
•
| A vertical stroke in the parameter list characterizes alternative parameter settings. Only one of
the parameters separated by | must be selected.
•
Example: The following command has two alternative settings:
FORMat[:DATA] ASCii | REAL
•
[ ]Key words in square brackets can be omitted when composing the command header (see
SCPI Command Structure and Syntax). The complete command must be recognized by the
instrument for reasons of compatibility with the SCPI standard. Parameters in square brackets are
optional as well. They may be entered in the command or omitted.
•
{ } Braces or curly brackets enclose one or more parameters that may be included zero or more
times.
•
Numeric suffixes
Symbols in angular brackets (<Ch>, <Chn>, <Mk>,...) denote numeric suffixes. Numeric
suffixes are replaced by integer numbers to distinguish various items of the same type.
The analyzer provides numeric suffixes for channels, traces, ports, markers etc. If
unspecified, a numeric suffix is replaced by 1.
The marker suffix must be in the range between 1 and 10, the number of ports depends
on the analyzer model. No restrictions apply to channel, trace, and diagram area suffixes.
In remote control, one active trace can be selected for each channel; see Active Traces in
Remote Control. This concept simplifies the remote control command syntax, because it
allows the active trace in a particular channel to be referenced by means of the channel
suffix. To keep the syntax transparent, <Ch> is used for channel settings (it denotes the
configured channel), whereas <Chn> is used for trace settings (it denotes the active trace
in the channel).
Operating Manual 1303.6580.32-01
292
R&S® ZVL
Command Reference
Common Commands
Common Commands
Common commands are described in the IEEE 488.2 (IEC 625-2) standard. These commands have the
same effect on different devices. The headers of these commands consist of "*" followed by three letters.
Many common commands are related to the status reporting system.
Command
Parameters
*CLS CLear Status sets the status byte (STB), the standard event register (ESR)
and the EVENt -part of the QUEStionable and the OPERation registers to zero. The
command does not alter the mask and transition parts of the registers. It clears the
output buffer.
*ESE Event Status Enable sets the event status enable register to the value
indicated. The query *ESE? returns the contents of the event status enable register in
decimal form.
Short
Description
Clear Status;
no query
0...255
Event Status
Enable
*ESR? Event Status Read returns the contents of the event status register in
decimal form (0 to 255) and subsequently sets the register to zero.
Standard Event
Status Query;
query only
*IDN? IDeNtification query returns the instrument identification. The response is of
the form "Rohde&Schwarz,ZVA8-4Port,12345,0.10.1.23", where
ZVxx-nPort is the analyzer type
12345 is the serial number of the analyzer
0.10.1.23 is the firmware version number.
The ID string can be changed in the System Config dialog.
Identification
Query;
query only
*IST? Individual STatus query returns the contents of the IST flag in decimal form (0
| 1). The IST-flag is the status bit which is sent during a parallel poll.
Individual Status
Query;
query only
*OPC OPeration Complete sets bit 0 in the event status register when all preceding
commands have been executed. This bit can be used to initiate a service request.
The query form writes a "1" into the output buffer as soon as all preceding commands
have been executed. This is used for command synchronization.
Operation
Complete
*OPT? OPTion identification query queries the options included in the instrument
and returns a list of the options installed. The response consists of arbitrary ASCII
response data according to IEEE 488.2. The options are returned at fixed positions in
a comma-separated string. A zero is returned for options that are not installed.
Option
Identification
Query;
query only
*PCB Pass Control Back indicates the controller address to which GPIB bus control
is returned after termination of the triggered action.
0...30
Pass Control
Back;
no query
*PRE Parallel poll Register Enable sets parallel poll enable register to the value
indicated. The query *PRE? returns the contents of the parallel poll enable register in
decimal form.
0...255
Parallel Poll
Register Enable
*PSC Power on Status Clear determines whether the contents of the ENABle
registers is maintained or reset when the analyzer is switched on.
*PSC = 0 causes the contents of the status registers to be maintained. Thus a service
request can be triggered on switching on in the case of a corresponding configuration
of status registers ESE and SRE.
*PSC ≠ 0 resets the registers.
0|1
Power On Status
Clear
Operating Manual 1303.6580.32-01
293
R&S® ZVL
Command Reference
CALCulate
*RST ReSeT sets the instrument to a defined default status. The command resets all
setups, restoring the factory default values defined for remote control operation. In
contrast the command SYSTem:PRESet resets the active setup only. The default
settings are indicated in the description of commands.
*SRE Service Request Enable sets the service request enable register to the value
indicated. Bit 6 (MSS mask bit) remains 0. This command determines under which
conditions a service request is triggered. The query *SRE? returns the contents of the
service request enable register in decimal form. Bit 6 is always 0.
Reset;
no query
0...255
Service Request
Enable
*STB? STatus Byte query reads the contents of the status byte in decimal form.
Status Byte Query;
query only
*TRG TRiGger triggers all actions waiting for a trigger event. In particular *TRG
generates a manual trigger signal (Manual Trigger). This common command
complements the commands of the TRIGger subsystem.
Trigger;
no query
*TST? self TeST query triggers selftests of the instrument and returns an error code
in decimal form.
Self Test Query;
query only
*WAI WAIt to continue prevents servicing of the subsequent commands until all
preceding commands have been executed and all signals have settled (see also
command synchronization and *OPC).
Wait to continue;
no query
CALCulate
CALCulate:CLIMits
CALCulate<Chn>:CLIMits...
This subsystem controls the composite limit check.
CALCulate<Chn>:CLIMits:FAIL?
Returns a 0 or 1, to indicate whether or not a composite limit check on several traces has failed.
<Chn>
Channel number used to identify the active trace. This suffix is not relevant
because the command provides a summary of all individual limit fails.
Response
0 | 1 - 0 represents pass for all individual limit checks (also returned if no limit
check is active at all), 1 means that the limit checks for one or more traces failed.
0
*RST value
SCPI,
Command
Types
Example:
Device-specific, query only.
*RST; CALC:LIM:CONT 1 GHZ, 2 GHZ
Define an upper limit line segment in the stimulus range between 1 GHz and 2
Operating Manual 1303.6580.32-01
294
R&S® ZVL
Command Reference
CALCulate
GHz, using default response values.
CALC:LIM:STAT ON; FAIL?
Switch the limit check on and query the result.
CALC:CLIM:FAIL?
Query the result for the composite limit check. As only one trace is tested, the
response should be equal to the previous response..
CALCulate:DATA
CALCulate<Chn>:DATA...
This subsystem provides access to the results of a measurement.
The trace data is transferred in either ASCII or block data (REAL) format, depending on the
FORMat[:DATA] setting. If the block data format is used, it is recommended to select EOI as
receive terminator (SYSTem:COMMunicate:GPIB[:SELF]:RTERminator EOI).
CALCulate<Chn>:DATA FDATa | SDATa | MDATa | SCORr1 | ... | SCORr27
Reads the current response values of the active data trace or memory trace and reads or writes error
terms.
<Chn>
Channel number used to identify the active trace. If unspecified the numeric suffix
is set to 1.
Parameters
Range [def. unit]
See list of parameters below.
The data format is parameter-dependent; see below. The unit is the default unit of
the measured parameter; see CALCulate<Ch>:PARameter:SDEFine.
–
*RST value
SCPI,
Command
Types
Example:
Confirmed, command (for error terms) or query.
*RST; SWE:POIN 20
Create a trace with 20 sweep points, making the created trace the active trace of
channel 1 (omitted optional mnemonic SENSe1).
CALC:DATA? FDAT
Query the 20 response values of the created trace. In the FDATa setting, 20
comma-separated ASCII values are returned.
CALC:DATA:STIM?
Query the 20 stimulus values of the created trace. 20 comma-separated ASCII
values are returned.
Operating Manual 1303.6580.32-01
295
R&S® ZVL
Command Reference
CALCulate
The following parameters are related to trace data (see also Data Flow diagram):
FDATa Formatted trace data, according to the selected trace format (CALCulate<Chn>:FORMat). 1 value per trace point for
Cartesian diagrams, 2 values for polar diagrams.
SDATa Unformatted trace data: Real and imaginary part of each measurement point. 2 values per trace point irrespective of the
selected trace format. The trace mathematics is not taken into account.
MDATa Unformatted trace data (see SDATa) after evaluation of the trace mathematics.
The following parameters denote the error terms generated during a calibration:
Error Term
Description
Receive Ports (S-parameter)
SCORr1, ... SCORr12 2-port error terms; see [SENSe<Ch>:]CORRection:DATA. 1 and 2 (S11, S12, S21, S22)
SCORr13
Directivity
3 (S33)
SCORr14
Source match
3 (S33)
SCORr15
Reflection tracking
3 (S33)
SCORr16
Isolation
3 (S31)
SCORr17
Load match
3 (S31)
SCORr18
Transmission tracking
3 (S13)
SCORr19
Isolation
1 (S13)
SCORr20
Load match
1 (S13)
SCORr21
Transmission tracking
1 (S13)
SCORr22
Isolation
3 (S32)
SCORr23
Load match
3 (S32)
SCORr24
Transmission tracking
3 (S32)
SCORr25
Isolation
2 (S23)
SCORr26
Load match
2 (S23)
SCORR27
Transmission tracking
2 (S23)
Use the generalized command [SENSe<Ch>:]CORRection:COLLect:CDATa to read or
write error terms for arbitrary analyzer ports.
CALCulate<Chn>:DATA:NSWeep? SDATa, <Trace_Hist_Count>
Reads the response values of a trace acquired in single sweep mode (INITiate<Ch>:CONTinuous
OFF). The trace can be any of the traces acquired during the single sweep cycle.
<Chn>
Channel number used to identify the active trace.
SDATa
Read unformatted sweep data (fixed parameter): Returns the real and
imaginary part of each measurement point (2 values per trace point
irrespective of the selected trace format).
Number of sweep to be read. 1 denotes the last sweep acquired, 2
denotes the second-last and so forth.
1 to sweep count defined via [SENSe<Ch>:]SWEep:COUNt [–]
<Trace_Hist_Count>
Range [def. unit]
Operating Manual 1303.6580.32-01
296
R&S® ZVL
Command Reference
CALCulate
*RST value
–
SCPI, Command Types
Device-specific, query only
Example (see also
Sweep History):
SWE:COUN 10
Define the number of sweeps (10) to be measured in single sweep
mode.
INIT:CONT OFF; INIT
Activate single sweep mode and start a single sweep in channel no. 1.
CALC:DATA:NSW? SDAT,5
Query the results of the 5th sweep.
CALCulate<Chn>:DATA:STIMulus?
Reads the stimulus values of the active data or memory trace.
<Chn>
Channel number used to identify the active trace.
Parameters
Range [def. unit]
–
The data is transferred in the data format defined via FORMat[:DATA]. The unit
is the default unit of the sweep variable (Hz or dBm or s).
–
*RST value
SCPI, Command
Types
Example:
Device-specific, query only
See CALCulate<Chn>:DATA?
CALCulate:DLINe
CALCulate<Chn>:DLINe...
This subsystem controls the horizontal line used to mark and retrieve response values (display line).
CALCulate<Chn>:DLINe <numeric_value>
Defines the position (response value) of the horizontal line.
<Chn>
Channel number used to identify the active trace. If unspecified the numeric suffix
is set to 1.
Parameters
Range [def.
unit]
See list of parameters below.
The data is transferred in the data format defined via FORMat[:DATA]. The unit is
the default unit of the measured parameter; see
CALCulate<Ch>:PARameter:SDEFine.
–
*RST value
Operating Manual 1303.6580.32-01
297
R&S® ZVL
Command Reference
CALCulate
Device-specific, command or query.
SCPI,
Command
Types
Example:
*RST; CALC:DLIN 10
Define the position of the horizontal line in the default dB Mag diagram at +10
dBm.
CALC:DLIN:STAT ON
Display the defined horizontal line.
CALCulate<Chn>:DLINe:STATe <Boolean>
Switches the horizontal line on or off.
Channel number used to identify the active trace.
<Chn>
*RST value
ON | OFF - Horizontal line on or off.
OFF
SCPI, Command Types
Device-specific, command or query.
Example:
See CALC:DLIN.
<Boolean>
CALCulate:FORMat
CALCulate<Chn>:FORMat...
This subsystem determines a post-processing of the measured data in order to obtain various display
formats.
CALCulate<Chn>:FORMat MLINear | MLOGarithmic | PHASe | UPHase | POLar |
SMITh | ISMith | GDELay | REAL | IMAGinary | SWR | COMPlex | MAGNitude
Defines how the measured result at any sweep point is post-processed and presented in the graphical
display.
Note:
The analyzer allows arbitrary combinations of display formats and measured quantities; see
Trace - Format and CALCulate<Chn>:PARameter commands. Nevertheless, it is advisable to
check which display formats are generally appropriate for an analysis of a particular
measured quantity; see Measured Quantities and Display Formats.
<Chn>
Channel number used to identify the active trace. If unspecified the numeric
suffix is set to 1.
Parameters
*RST value
See list of parameters below.
MLOGarithmic
SCPI, Command
Types
Confirmed, command or query
Operating Manual 1303.6580.32-01
298
R&S® ZVL
Command Reference
CALCulate
Example:
CALC4:PAR:SDEF 'Ch4Tr1', 'S11'
Create channel 4 and a trace named Ch4Tr1 to measure the input reflection
coefficient S11. The trace becomes the active trace in channel 4.
CALC4:FORM MLIN; DISP:WIND:TRAC:FEED 'CH4TR1'
Calculate the magnitude of S11 and display it in a linearly scaled Cartesian
diagram.
Assume that the result at a sweep point is given by the complex quantity z = x + jy. The meaning of the
parameters is as follows (see also table in CALCulate<Chn>:MARKer<Mk>:FORMat description):
MLINear
Calculate the magnitude of z, to be displayed in a Cartesian diagram with a linear scale
MLOGarithmic
Calculate the magnitude of z, displayed in a Cartesian diagram with a logarithmic scale
PHASe
Phase of z, displayed in a Cartesian diagram with a linear vertical axis
UPHase
Unwrapped phase of z, displayed in a Cartesian diagram with a linear vertical axis
POLar
Magnitude and phase, displayed in a polar diagram
SMITh
Magnitude and phase, displayed in a Smith chart
ISMith
Magnitude and phase, displayed in an inverted Smith chart
GDELay
Group delay, displayed in a Cartesian diagram
REAL
Real part (x), displayed in a Cartesian diagram
IMAGinary
Imaginary part (y), displayed in a Cartesian diagram
SWR
Standing Wave Ratio (SWR), displayed in a Cartesian diagram
COMPlex
x, y, displayed in a polar diagram
2
MAGNitude
2
Magnitude (sqrt(x + y )), displayed in a Cartesian diagram with a logarithmic scale
CALCulate:LIMit
CALCulate<Chn>:LIMit...
This subsystem defines the limit lines and controls the limit check.
CALCulate<Chn>:LIMit:CONTrol[:DATA]
<numeric_value>,<numeric_value>{,<numeric_value>,<numeric_value>}
Defines the stimulus values of the limit line and/or creates new limit line segments.
Rules for creating segments
The following rules apply to an active trace with n existing limit line segments:
•
An odd number of values is rejected; an error message –109,"Missing parameter..." is generated.
•
An even number of 2*k values updates or generates k limit line segments.
Operating Manual 1303.6580.32-01
299
R&S® ZVL
Command Reference
CALCulate
•
For n > k the stimulus values of all existing limit line segments no. 1 to k are updated, the existing
limit line segments no. k+1, ..., n are deleted.
•
For n < k the stimulus values of the limit line segments no. 1 to n are updated, the limit line
segments n+1, ,..., k are generated with default response values (see
CALCulate<Chn>:LIMit:UPPer[:DATA], CALCulate<Chn>:LIMit:LOWer[:DATA]).
The generated segments are upper or lower limit line segments, depending on the
CALCulate<Chn>:LIMit:SEGMent<Seg>:TYPE
setting.
CALCulate<Chn>:LIMit:CONTrol[:DATA] does not overwrite the type setting.
To define additional new limit line segments without overwriting the old segments use
CALCulate<Chn>:LIMit:DATA.
<Chn>
Channel number used to identify the active trace.
<numeric_value>
Pair(s) of frequency, power or time values, to be defined in accordance with the
domain setting (CALCulate<Chn>:LIMit:CONTrol:DOMain).
Almost no restriction for limit segments; see Rules for Limit Line Definition. [Hz
for frequency sweeps, dBm for power sweeps, s for time sweeps]
–
A segment that is created implicitly, e.g. by means of
CALCulate<Chn>:LIMit:UPPer[:DATA] or
CALCulate<Chn>:LIMit:LOWer[:DATA,], covers the maximum sweep
range of the analyzer.
Range [def. unit]
*RST value
SCPI, Command
Types
Example:
Confirmed, with query.
*RST; CALC:LIM:CONT 1 GHZ, 2 GHZ
Define an upper limit line segment in the stimulus range between 1 GHz and 2
GHz, using default response values.
CALC:LIM:DISP ON
Show the limit line segment in the active diagram.
CALCulate<Chn>:LIMit:CONTrol:DOMain FLIN | FLOG | FSEG | FSINgle | TLIN |
TLOG | PLIN | PLOG | PSINgle
Deletes the existing limit line and (re-)defines the physical units of the stimulus values of the limit line. The
units of the response values and the scaling of the y-axis are defined via
CALCulate<Chn>:LIMit:RDOMain:...
<Chn>
Channel number used to identify the active trace.
Parameters
Keywords for the units of the stimulus values.
The selected unit must be compatible with the sweep type
([SENSe<Ch>:]SWEep:TYPE); otherwise the limit line can not be displayed and
no limit check is possible.
The parameters form three groups:
Range [def. unit]
•
FLIN, FLOG, FSEG, and FSINgle select frequency units [default: Hz] for
Operating Manual 1303.6580.32-01
300
R&S® ZVL
Command Reference
CALCulate
the limit line.
*RST value
SCPI,
Command
Types
Example:
•
TLIN and TLOG select time units [default: s].
•
PLIN, PLOG and PSINgle select power units [default: dBm].
FLIN
Device-specific, no query.
SWE:TYPE POW
Select a power sweep.
CALC:LIM:CONT:DOM PLIN
Delete all existing limit line segments and select level units for the limit line of the
active trace.
CALC:LIM:CONT -20 DBM, -10 DBM
Define a limit line segment in the stimulus range between –20 dBm and –10 dBm.
CALCulate<Chn>:LIMit:CONTrol:SHIFt <numeric_value>
Shifts the limit line in horizontal direction.
<Chn>
Channel number used to identify the active trace.
<numeric_value>
Range [def. unit]
Amount that the limit line is shifted.
Almost no restriction for limit segments; see Rules for Limit Line Definition. [Hz
for frequency sweeps, dBm for power sweeps, s for time sweeps, see
CALCulate<Chn>:LIMit:CONTrol:DOMain]
–
*RST value
SCPI, Command
Types
Example:
Device-specific, no query.
*RST; CALC:LIM:CONT 1 GHZ, 2 GHZ
Define a limit line segment in the stimulus range between 1 GHz and 2 GHz,
using default response values.
CALC:LIM:CONT:SHIF 1; CALC:LIM:CONT?
Shift the segment by 1 Hz. The modified limit line segment extends from
1000000001 (Hz) to 2000000001 (Hz).
CALCulate<Chn>:LIMit:DATA <type>, <start_stim>, <stop_stim>, <start_resp>,
<stop_resp>{,<type>, <start_stim>, <stop_stim>, <start_resp>, <stop_resp>}
Defines the limit line type, the stimulus and response values for a limit line with an arbitrary number of limit
line segments.
Operating Manual 1303.6580.32-01
301
R&S® ZVL
Command Reference
CALCulate
In contrast to CALCulate<Chn>:LIMit:CONTrol[:DATA], this command does not overwrite
existing limit line segments. The defined segments are appended to the segment list as new
segments.
<Chn>
Channel number used to identify the active trace.
<type>
Range [def. unit]
Identifier for the type of the limit line segment.
0 – Limit line segment off, segment defined but no limit check performed
1 – Upper limit line segment
2 – Lower limit line segment
Stimulus and response values of the first and last points of the limit line segment.
<start_stim>,
<stop_stim>,
<start_resp>,
<stop_resp>
Range [def. unit]
*RST values
SCPI,
Command
Types
Example:
Almost no restriction for limit segments; see Rules for Limit Line Definition. [Hz for
frequency sweeps, dBm for power sweeps, s for time sweeps, see
CALCulate<Chn>:LIMit:CONTrol:DOMain]
– (no limit line defined after *RST)
Device-specific, with query.
*RST; CALC:LIM:CONT 1 GHZ, 1.5 GHZ
Define an upper limit line segment in the stimulus range between 1 GHz and 1.5
GHz, using default response values.
CALC:LIM:DATA 1,1500000000, 2000000000,2,3
Define an upper limit line segment in the stimulus range between 1.5 GHz and 2
GHz, assigning response values of +2 dBm and +3 dBm.
CALC:LIM:DISP ON
Show the limit line segment in the active diagram.
CALCulate<Chn>:LIMit:DELete:ALL
Deletes all limit line segments.
<Chn>
Channel number used to identify the active trace.
*RST value
SCPI, Command
Types
Example:
–
Device-specific, no query.
*RST; CALC:LIM:CONT 1 GHZ, 1.5 GHZ
Define an upper limit line segment in the stimulus range between 1 GHz and 1.5
GHz, using default response values.
CALC:LIM:DATA 1,1500000000, 2000000000,2,3
Define an upper limit line segment in the stimulus range between 1.5 GHz and 2
GHz, assigning response values of +2 dBm and +3 dBm.
CALC:LIM:DEL:ALL
Operating Manual 1303.6580.32-01
302
R&S® ZVL
Command Reference
CALCulate
Delete both created limit line segments.
CALCulate<Chn>:LIMit:DISPlay[:STATe] <Boolean>
Displays or hides the entire limit line (including all segments) associated to the active trace.
<Chn>
Channel number used to identify the active trace.
<Boolean>
*RST value
ON | OFF - Limit line on or off.
OFF
SCPI, Command
Types
Example:
Device-specific, command or query.
*RST; CALC:LIM:CONT 1 GHZ, 2 GHZ
Define an upper limit line segment in the stimulus range between 1 GHz and 2
GHz, using default response values.
CALC:LIM:DISP ON
Show the limit line segment in the active diagram.
CALCulate<Chn>:LIMit:FAIL?
Returns a 0 or 1, to indicate whether or not the limit check has failed.
Use CALCulate<Chn>:CLIMits:FAIL? to perform a composite (global) limit check.
<Chn>
Channel number used to identify the active trace.
Response
*RST value
0 | 1 - 0 represents pass, 1 represents fail.
0
SCPI, Command
Types
Example:
Confirmed, query only.
*RST; CALC:LIM:CONT 1 GHZ, 2 GHZ
Define an upper limit line segment in the stimulus range between 1 GHz and 2
GHz, using default response values.
CALC:LIM:STAT ON; FAIL?
Switch the limit check on and query the result.
CALCulate<Chn>:LIMit:LOWer[:DATA]
<numeric_value>,<numeric_value>{,<numeric_value>,<numeric_value>}
Defines the response (y-axis) values of the lower limit line and/or creates new limit line segments.
Operating Manual 1303.6580.32-01
303
R&S® ZVL
Command Reference
CALCulate
The
commands
CALCulate<Chn>:LIMit:LOWer[:DATA]
and
CALCulate<Chn>:LIMit:UPPer[:DATA] use a fixed numbering scheme for limit line
segments: Upper limit line segments are assigned odd numbers (1, 3, 5,...), lower limit line
segments are assigned even numbers (2, 4, 6,...).
Rules for creating segments
The following rules apply to an active trace with n existing upper and n existing lower limit line segments:
•
An odd number of values is rejected; an error message –109,"Missing parameter..." is generated.
•
An even number of 2*k values updates or generates k lower limit line segments.
•
For n > k the response values of all existing lower limit line segments no. 2, 4, ...,2*k are updated,
the existing upper and lower limit line segments no. 2*k+1, ..., 2*n are deleted. The existing upper
limit line segments no. 1, 3, 2*k–1 are not affected.
•
For n < k the response values of the lower limit line segments no. 2, 4 to 2*n are updated, the
lower limit line segments 2*n+2, 2*n+4,..., 2*k are generated with default stimulus values (see
CALCulate<Chn>:LIMit:CONTrol[:DATA]. In addition, the missing upper limit line segments
2*n+1, 2*n+3,..., 2*k–1 are generated with default stimulus and response values
<Chn>
Channel number used to identify the active trace.
<numeric_value>
Range [def. unit]
*RST value
Pair(s) of response values.
Almost no restriction for limit segments; see Rules for Limit Line Definition. [dB]
–
The response value of a segment that is created implicitly, e.g. an upper limit
line segment, is –20 dB.
SCPI, Command
Types
Example:
Confirmed, with query.
CALC:LIM:LOW -10, 0, 0, -10
Define the following lower and (default) upper limit line segments:
CALC:LIM:DISP ON
Show the limit line segments in the active diagram.
CALCulate<Chn>:LIMit:LOWer:FEED
<stimulus_offset>,<response_offset>[,<trace_name>]
Generates a lower limit line using the stimulus values of a data or memory trace and specified offset
values.
<Chn>
Channel number used to identify the active trace. This trace provides the
stimulus data for the limit line unless another trace <trace_name> is
Operating Manual 1303.6580.32-01
304
R&S® ZVL
Command Reference
CALCulate
specified.
<stimulus_offset>
Range [def. unit]
*RST value
<response_offset>
Range [def. unit]
*RST value
<trace_name>
SCPI, Command
Types
Example:
Stimulus offset value, used to shift all imported limit line segments in
horizontal direction.
-1000 GHz to +1000 GHz [Hz]
0 Hz
Response offset value, used to shift all imported limit line segments in vertical
direction.
-1012 dB to +1012 dB [dB]
0 dB
Name of the selected trace as used e.g. in
CALCulate<Ch>:PARameter:SDEFine. If no trace name is specified the
analyzer uses the active trace no. <Chn>.
Device-specific, no query.
CALC:LIM:LOW:FEED 1 GHZ, -10
Use the stimulus values of the active trace, shifted by 1 GHz to the right and
decreased by 10 dB, to create a lower limit line.
CALC:LIM:LOW:SHIF -3; CALC:LIM:CONT:SHIF 1 GHz
Shift the limit line by an additional –3 dB in vertical and by 1 GHz in horizontal
direction. If an upper limit line exists it is also shifted.
CALCulate<Chn>:LIMit:LOWer:SHIFt <numeric_value>
Shifts all lower and upper limit line segments assigned to the active trace in vertical direction.
This command is identical with CALCulate<Chn>:LIMit:UPPer:SHIFt.
<Chn>
Channel number used to identify the active trace.
<numeric_value>
Range [def. unit]
Response offset value for all limit line segments.
Almost no restriction for limit segments; see Rules for Limit Line Definition.
[dB]
–
*RST value
SCPI, Command
Types
Example:
Device-specific, no query.
See CALCulate<Chn>:LIMit:LOWer:FEED.
CALCulate<Chn>:LIMit:LOWer:STATe <Boolean>
Switches the lower limit check on or off. Lower limit line segments are assigned even numbers; see
CALCulate<Chn>:LIMit:LOWer[:DATA]. The command does not affect segments with odd numbers.
Operating Manual 1303.6580.32-01
305
R&S® ZVL
Command Reference
CALCulate
Use CALCulate<Chn>:LIMit:STATe to switch on or off the entire limit check, including
upper and lower limit lines.
<Chn>
Channel number used to identify the active trace.
<Boolean>
*RST value
ON | OFF - Limit check on or off.
OFF
SCPI, Command
Types
Example:
Confirmed, command or query.
CALC:LIM:LOW -10, 0, 0, -10
Define the following lower and (default) upper limit line segments:
CALC:LIM:LOW:STAT ON; CALC:LIM:FAIL?
Switch the limit check on and query the result.
CALCulate<Chn>:LIMit:RDOMain:COMPlex S | SINV | Y | Z | YREL | ZREL
Deletes the existing limit line and (re-)defines the physical units of the response values of the limit line.
The units of the stimulus values are defined via CALCulate<Chn>:LIMit:CONTrol:DOMain.
This command is complemented by CALCulate<Chn>:LIMit:RDOMain:FORMat and
CALCulate<Chn>:LIMit:RDOMain:SPACing.
<Chn>
Channel number used to identify the active trace.
Parameters
Range [def. unit]
Keyword for the physical unit of the response values.
The parameters form four groups:
*RST value
SCPI, Command Types
•
S and SINV select relative units (dB) for the limit line.
•
Y selects admittance units (S/Siemens).
•
Z selects impedance units (Ω).
•
YREL and ZREL select dimensionless numbers (U).
[–]
–
Device-specific, no query.
CALCulate<Chn>:LIMit:RDOMain:FORMat COMPlex | MAGNitude | PHASe | REAL |
Operating Manual 1303.6580.32-01
306
R&S® ZVL
Command Reference
CALCulate
IMAGinary | SWR | GDELay | L | C
Deletes the existing limit line and (re-)defines the physical units of the response values of the limit line.
The units of the stimulus values are defined via CALCulate<Chn>:LIMit:CONTrol:DOMain.
This command is complemented by CALCulate<Chn>:LIMit:RDOMain:COMPlex and
CALCulate<Chn>:LIMit:RDOMain:SPACing.
<Chn>
Channel number used to identify the active trace.
Parameters
Range [def. unit]
Keyword for the physical unit of the response values.
The parameters form four groups:
*RST value
SCPI, Command
Types
•
COMPlex, REAL, IMAGinary, and SWR select dimensionless numbers
(U) for the limit line.
•
MAGNitude selects relative units (dB).
•
PHASe selects phase units (deg).
•
GDELay selects time units (s).
•
L selects inductance units (H/Henry).
•
C selects capacitance units (F/Farad).
[–]
–
Device-specific, no query.
CALCulate<Chn>:LIMit:RDOMain:SPACing LINear | LOGarithmic | dB | SIC
Deletes the existing limit line and (re-)defines the physical units of the response values of the limit line.
The units of the stimulus values are defined via CALCulate<Chn>:LIMit:CONTrol:DOMain.
This command is complemented by CALCulate<Chn>:LIMit:RDOMain:COMPlex and
CALCulate<Chn>:LIMit:RDOMain:FORMat.
<Chn>
Channel number used to identify the active trace.
Parameters
Range [def. unit]
Keyword for the physical unit of the response values.
The analyzer uses dB units, irrespective of the parameter selected.
[–]
–
*RST value
SCPI, Command Types
Device-specific, no query.
CALCulate<Chn>:LIMit:SEGMent<Seg>:AMPlitude:STARt <numeric_value>
Changes the start response value (i.e. the response value assigned to the start stimulus value) of a limit
line segment. A segment must be created first to enable this command (e.g CALC:LIM:DATA).
Operating Manual 1303.6580.32-01
307
R&S® ZVL
Command Reference
CALCulate
To define the response values of several limit line segments with a single command, use
CALCulate<Chn>:LIMit:LOWer[:DATA]
or
CALCulate<Chn>:LIMit:UPPer[:DATA].
<Chn>
Channel number used to identify the active trace.
<Seg>
Segment number
<numeric_value>
Range [def. unit]
Response value
Almost no restriction for limit segments; see Rules for Limit Line Definition.
[dB]
–
The default response values of a segment that is created by defining its
stimulus values only (e.g. by means of
CALCulate<Chn>:LIMit:CONTrol[:DATA]), is –20 dB.
*RST value
SCPI, Command
Types
Example:
Device-specific, with query.
CALC:LIM:DATA 1,1500000000, 2000000000,2,3
Define an upper limit line segment (segment no. 1) in the stimulus range
between 1.5 GHz and 2 GHz, assigning response values of +2 dBm and +3
dBm.
:CALC:LIM:SEGM:AMPL:STAR 5; STOP 5; CALC:LIM:SEGM:TYPE LMIN
Change the segment to a lower limit line segment with a constant response
value of +5 dB.
CALC:LIM:DATA?
Query the type, the stimulus and response values of the created segment with
a single command. The response is 2,1000000,2000000,5,5.
CALCulate<Chn>:LIMit:SEGMent<Seg>:AMPlitude:STOP <numeric_value>
Changes the stop response value (i.e. the response value assigned to the stop stimulus value) of a limit
line segment. A segment must be created first to enable this command (e.g CALC:LIM:DATA).
To define the response values of several limit line segments with a single command, use
CALCulate<Chn>:LIMit:LOWer[:DATA]
or
CALCulate<Chn>:LIMit:UPPer[:DATA].
<Chn>
Channel number used to identify the active trace.
<Seg>
Segment number
<numeric_value>
Range [def. unit]
Response value
Almost no restriction for limit segments; see Rules for Limit Line Definition.
[dB]
–
The default response values of a segment that is created by defining its
stimulus values only (e.g. by means of
CALCulate<Chn>:LIMit:CONTrol[:DATA]), is –20 dB.
*RST value
Operating Manual 1303.6580.32-01
308
R&S® ZVL
Command Reference
CALCulate
SCPI, Command
Types
Example:
Device-specific, with query.
See CALCulate<Chn>:LIMit:SEGMent<Seg>:AMPlitude:STARt.
CALCulate<Chn>:LIMit:SEGMent<Seg>:STIMulus:STARt <numeric_value>
Changes the start stimulus value (i.e. the largest or smallest stimulus value) of a limit line segment. A
segment must be created first to enable this command (e.g CALC:LIM:DATA).
To define the stimulus values of several limit line segments with a single command, use
CALCulate<Chn>:LIMit:CONTrol[:DATA].
<Chn>
Channel number used to identify the active trace.
<Seg>
Segment number
<numeric_value>
Frequency, power or time value, to be defined in accordance with the domain
setting (CALCulate<Chn>:LIMit:CONTrol:DOMain).
Almost no restriction for limit segments; see Rules for Limit Line Definition. In
particular, the start value can be larger than the stop value
CALCulate<Chn>:LIMit:SEGMent<Seg>:STIMulus:STOP.
[Hz for frequency sweeps, dBm for power sweeps, s for time sweeps]
–
A segment that is created implicitly, e.g. by means of
CALCulate<Chn>:LIMit:UPPer[:DATA] or
CALCulate<Chn>:LIMit:LOWer[:DATA,], covers the maximum sweep
range of the analyzer.
Range [def. unit]
*RST value
SCPI, Command
Types
Example:
Device-specific, with query.
CALC:LIM:DATA 1,1500000000, 2000000000,2,3
Define an upper limit line segment (segment no. 1) in the stimulus range
between 1.5 GHz and 2 GHz, assigning response values of +2 dBm and +3
dBm.
CALC:LIM:SEGM:STIM:STAR 1GHZ; STOP 2 GHZ; CALC:LIM:SEGM:TYPE LMIN
Change the segment to a lower limit line segment with a stimulus range
between 1 GHz and 2 GHz.
CALC:LIM:DATA?
Query the type, the stimulus and response values of the created segment with a
single command. The response is 2,1000000,2000000,2,3.
CALCulate<Chn>:LIMit:SEGMent<Seg>:STIMulus:STOP <numeric_value>
Changes the stop stimulus value (i.e. the largest or smallest stimulus value) of a limit line segment. A
segment must be created first to enable this command (e.g CALC:LIM:DATA).
Operating Manual 1303.6580.32-01
309
R&S® ZVL
Command Reference
CALCulate
To define the stimulus values of several limit line segments with a single command, use
CALCulate<Chn>:LIMit:CONTrol[:DATA].
<Chn>
Channel number used to identify the active trace.
<Seg>
Segment number
<numeric_value>
Frequency, power or time value, to be defined in accordance with the domain
setting (CALCulate<Chn>:LIMit:CONTrol:DOMain).
Almost no restriction for limit segments; see Rules for Limit Line Definition. In
particular, the stop value can be smaller than the start value
CALCulate<Chn>:LIMit:SEGMent<Seg>:STIMulus:START.
[Hz for frequency sweeps, dBm for power sweeps, s for time sweeps]
–
A segment that is created implicitly, e.g. by means of
CALCulate<Chn>:LIMit:UPPer[:DATA] or
CALCulate<Chn>:LIMit:LOWer[:DATA,], covers the maximum sweep
range of the analyzer.
Range [def. unit]
*RST value
SCPI, Command
Types
Example:
Device-specific, with query.
See CALCulate<Chn>:LIMit:SEGMent<Seg>:STIMulus:STARt.
CALCulate<Chn>:LIMit:SEGMent<Seg>:TYPE LMIN | LMAX | OFF
Selects the limit line type for a limit line segment. This can be done before or after defining the stimulus
and response values of the segment, however, a segment must be created first to enable this command
(e.g CALC:LIM:DATA).
The type command overwrites the CALCulate<Chn>:LIMit:DATA settings and is overwritten
by them. It is not affected by the other commands in the LIMit subsystem defining stimulus
and response values of limit lines.
<Chn>
Channel number used to identify the active trace.
<Seg>
Segment number
Parameters
Range [def. unit]
Limit line type
LMAX (upper limit line segment), LMIN (lower limit line segment), OFF (limit
check switched off, limit line segment not deleted) [–]
LMAX
*RST value
SCPI, Command
Types
Example:
Device-specific, with query.
*RST; CALC:LIM:UPP 1 GHZ, 2 GHZ
Define an upper limit line segment in the stimulus range between 1 GHz and 2
GHz, using default response values.
CALC:LIM:SEG:TYPE LMIN
Turn the defined limit line segment into a lower limit line segment.
Operating Manual 1303.6580.32-01
310
R&S® ZVL
Command Reference
CALCulate
CALCulate<Chn>:LIMit:SOUNd[:STATe]
Switches the acoustic signal (fail beep) on or off. The fail beep is generated each time the analyzer
detects an exceeded limit.
<Chn>
Channel number used to identify the active trace.
<Boolean>
*RST value
ON | OFF - Fail beep on or off.
OFF
SCPI, Command Types
Confirmed, command or query.
Example:
CALC:LIM:STAT ON; SOUN ON
Switch the limit check on and activate the fail beep.
CALCulate<Chn>:LIMit:STATe
Switches the limit check (including upper and lower limits) on or off.
Use CALCulate<Chn>:LIMit:UPPer:STATe or CALCulate<Chn>:LIMit:LOWer:
STATe to switch on or off the individual limit checks for upper or lower limit lines.
<Chn>
Channel number used to identify the active trace.
<Boolean>
*RST value
ON | OFF - Limit check on or off.
OFF
SCPI, Command
Types
Example:
Confirmed, command or query.
*RST; CALC:LIM:CONT 1 GHZ, 2 GHZ
Define an upper limit line segment in the stimulus range between 1 GHz and 2
GHz, using default response values.
CALC:LIM:STAT ON; CALC:LIM:FAIL?
Switch the limit check on and query the result.
CALCulate<Chn>:LIMit:UPPer[:DATA]
<numeric_value>,<numeric_value>{,<numeric_value>,<numeric_value>}
Defines the response (y-axis) values of the upper limit line and/or creates new limit line segments.
The
commands
CALCulate<Chn>:LIMit:LOWer[:DATA]
and
CALCulate<Chn>:LIMit:UPPer[:DATA] use a fixed numbering scheme for limit line
segments: Upper limit line segments are assigned odd numbers (1, 3, 5,...), lower limit line
segments are assigned even numbers (2, 4, 6,...).
Operating Manual 1303.6580.32-01
311
R&S® ZVL
Command Reference
CALCulate
Rules for creating segments
The following rules apply to an active trace with n existing upper and n existing lower limit line segments:
•
An odd number of values is rejected; an error message –109,"Missing parameter..." is generated.
•
An even number of 2*k values updates or generates k upper limit line segments.
•
For n > k the response values of all existing upper limit line segments no. 1, 3, ...,2*k–1 are
updated, the existing upper and lower limit line segments no. 2*k+1, ..., 2*n are deleted. The
existing lower limit line segments no. 2, 4, 2*k are not affected.
•
For n < k the response values of the upper limit line segments no. 1, 3 to 2*n–1 are updated, the
upper limit line segments 2*n+1, 2*n+3,..., 2*k–1 are generated with default stimulus values (see
CALCulate<Chn>:LIMit:CONTrol[:DATA]. In addition, the missing lower limit line segments
2*n+2, 2*n+4,..., 2*k are generated with default stimulus and response values
<Chn>
Channel number used to identify the active trace.
<numeric_value>
Range [def. unit]
*RST value
Pair(s) of response values.
Almost no restriction for limit segments; see Rules for Limit Line Definition. [dB]
–
The response value of a segment that is created implicitly, e.g. an lower limit
line segment, is –20 dB.
SCPI, Command
Types
Example:
Confirmed, with query.
CALC:LIM:UPP -10, 0, 0, -10
Define the following upper and (default) lower limit line segments:
CALC:LIM:DISP ON
Show the limit line segments in the active diagram.
CALCulate<Chn>:LIMit:UPPer:FEED
Generates an upper limit line using the stimulus values of a data or memory trace and specified offset
values.
<Chn>
Channel number used to identify the active trace. This trace provides the
stimulus data for the limit line unless another trace <trace_name> is
specified.
<stimulus_offset>
Stimulus offset value, used to shift all imported limit line segments in
horizontal direction.
Range [def. unit]
*RST value
-1000 GHz to +1000 GHz [Hz]
0 Hz
Operating Manual 1303.6580.32-01
312
R&S® ZVL
Command Reference
CALCulate
<response_offset>
Range [def. unit]
*RST value
<trace_name>
SCPI, Command
Types
Example:
Response offset value, used to shift all imported limit line segments in vertical
direction.
-1012 dB to +1012 dB [dB]
0 dB
Name of the selected trace as used e.g. in
CALCulate<Ch>:PARameter:SDEFine. If no trace name is specified the
analyzer uses the active trace no. <Chn>.
Device-specific, no query.
CALC:LIM:UPP:FEED 1 GHZ, 10
Use the stimulus values of the active trace, shifted by 1 GHz to the right and
increased by 10 dB, to create an upper limit line.
CALC:LIM:UPP:SHIF 3; CALC:LIM:CONT:SHIF 1 GHz
Shift the limit line by an additional 3 dB in vertical and by 1 GHz in horizontal
direction. If a lower limit line exists it is also shifted.
CALCulate<Chn>:LIMit:UPPer:SHIFt <numeric_value>
Shifts all lower and upper limit line segments assigned to the active trace in vertical direction.
This command is identical with CALCulate<Chn>:LIMit:LOWer:SHIFt.
<Chn>
Channel number used to identify the active trace.
<numeric_value>
Range [def. unit]
Response offset value for all limit line segments.
Almost no restriction for limit segments; see Rules for Limit Line Definition.
[dB]
–
*RST value
SCPI, Command
Types
Example:
Device-specific, no query.
See CALCulate<Chn>:LIMit:UPPer:FEED.
CALCulate<Chn>:LIMit:UPPer:STATe <Boolean>
Switches the upper limit check on or off. Upper limit line segments are assigned odd numbers; see
CALCulate<Chn>:LIMit:UPPer[:DATA]. The command does not affect segments with even
numbers.
Use CALCulate<Chn>:LIMit:STATe to switch on or off the entire limit check, including
upper and lower limit lines.
<Chn>
Channel number used to identify the active trace.
<Boolean>
*RST value
ON | OFF - Limit check on or off.
OFF
Operating Manual 1303.6580.32-01
313
R&S® ZVL
Command Reference
CALCulate
Confirmed, command or query.
SCPI, Command
Types
Example:
CALC:LIM:UPP -10, 0, 0, -10
Define the following upper and (default) lower limit line segments:
CALC:LIM:UPP:STAT ON; CALC:LIM:FAIL?
Switch the limit check on and query the result.
CALCulate:MARKer
CALCulate<Chn>:MARKer<Mk>...
This subsystem controls the marker functions. The commands are device-specific and beyond what is
specified in the SCPI subsystem SOURce:MARKer.
CALCulate<Chn>:MARKer<Mk>:AOFF
Removes all markers from all traces of the active setup. The removed markers remember their properties
(stimulus value, format, delta mode, number) when they are restored (CALC<Chn>:MARK<Mk> ON). The
marker properties are definitely lost if the associated trace is deleted.
<Chn>
Channel number used to identify the active trace. If unspecified the numeric
suffix is set to 1.
<Mk>
Marker number in the range 1 to 10. This numeric suffix is ignored and may
be set to any value.
*RST value
SCPI, Command
Types
Example:
–
Device-specific, no query.
Suppose that the active setup contains an active trace no. 1.
CALC:MARK1 ON; MARK2 ON
Create markers 1 and 2 and assign them to the trace no. 1.
CALC:MARK:AOFF
Remove both markers.
Operating Manual 1303.6580.32-01
314
R&S® ZVL
Command Reference
CALCulate
CALCulate<Chn>:MARKer<Mk>:BWIDth <x_dB_Bandwidth>
Sets the bandfilter level for a bandfilter search or returns the results. The command is only available after
a bandfilter search has been executed (CALCulate<Chn>:MARKer<Mk>:FUNCtion:EXECute
BFILter; see example below).
<Chn>
Channel number used to identify the active trace.
<Mk>
Marker number in the range 1 to 10. This numeric suffix is ignored and may
be set to any value because the bandfilter search functions always use
markers Mkr1 to Mkr4.
<x_dB_Bandwidth>
x dB Bandwidth parameter. The x dB Bandwidth is the difference between
the band edges and the center response value of a bandfilter peak; it must be
negative for a bandpass search and positive for a bandstop search.
For bandpass: –100.00 dB to –0.01 dB, the increment (UP/DOWN) is 0.3 dB.
[dB]
For bandstop: +0.01 dB to +100.00 dB, the increment (UP/DOWN) is 0.3 dB.
[dB]
–3 dB
Range [def. unit]
*RST value
Response for
query:
<Bandwidth>
<Center_Stimulus>
<Q>
<Loss>
<LBE>
<UBE>
Range [def. unit]
*RST value
SCPI, Command
Types
Example:
Search result in the format <Bandwidth>, <Center_Stimulus>, <Q>, <Loss>,
<LBE>, <UBE> where:
n-dB bandwidth of the bandpass/bandstop region, where n is the selected x
dB Bandwidth (setting command CALCulate<Chn>:MARKer<Mk>:BWIDth
<x dB Bandwidth>).
Stimulus frequency at the center of the bandpass/bandstop region (the
stimulus value of marker no. 4).
Quality factor, i.e. the ratio between the center frequency and the 3-dB
bandwidth
Loss at the center of the bandpass/bandstop region (the response value of
marker no. 4 at the time of the bandfilter search).
Lower band edge
Upper band edge
Depending on the measurement parameter. [units depending on the sweep
type and the marker format; see CALCulate<Chn>:MARKer<Mk>:FORMat]
–
Device-specific, query only.
CALC:MARK:FUNC:BWID:MODE BST
Select a bandstop filter search.
CALC:MARK:FUNC:EXEC BFIL
Initiate the bandpass filter search for the current trace. Create markers 1 to 4.
CALC:MARK:SEAR:BFIL:RES ON
Display the marker info field in the diaram area.
CALC:MARK:BWID 6
Select a 6-dB bandwidth for the bandstop.
CALC:MARK:BWID?
Query the results of the bandfilter search. An error message is generated if
Operating Manual 1303.6580.32-01
315
R&S® ZVL
Command Reference
CALCulate
the bandfilter search fails so that no valid results are available.
CALCulate<Chn>:MARKer<Mk>:COUPled[:STATe] <Boolean>
Couples the markers of all traces in the active setup to the markers of trace no. <Chn>, provided that they
have the same sweep type (SENSe<Chn>:FUNCtion).
<Chn>
Channel number used to identify the active trace. The effects of marker coupling
depend on the active trace number; see Coupled Markers in the GUI Reference
chapter.
<Mk>
Marker number in the range 1 to 10. This suffix is ignored because the command
affects all markers.
<Boolean>
*RST value
ON | OFF - Enables or disables marker coupling.
OFF
SCPI,
Command
Types
Example:
Device-specific, command or query.
Suppose that the active setup contains two traces Trc1 and Trc2, assigned to
channels no. 1 and 2, respectively.
:CALC1:PAR:SEL 'TRC1'; CALC1:MARK1 ON; MARK2 ON
Select Trc1 as the active trace and create the two markers no. 1 and 2. The
default position for both markers is the center of the sweep range.
CALC1:MARK:COUP ON
Create two markers no. 1 and 2 on Trc 2 and couple them to the markers of Trc 1.
CALCulate<Chn>:MARKer<Mk>:DELTa[:STATe] <Boolean>
Switches the delta mode for marker <Mk> on trace no. <Chn> on or off. The marker must be created
before using CALCulate<Chn>:MARKer<Mk>[:STATe] ON. If the active trace contains no reference
marker, the command also creates a reference marker.
<Chn>
Channel number used to identify the active trace.
<Mk>
Marker number in the range 1 to 10.
<Boolean>
*RST value
ON | OFF - Enables or disables the delta mode.
OFF
SCPI, Command
Types
Example:
Device-specific, command or query.
Suppose that the active setup contains an active trace no. 1.
CALC:MARK ON
Create marker no. 1 and set it to the center of the sweep range.
CALC:MARK:DELT ON
Operating Manual 1303.6580.32-01
316
R&S® ZVL
Command Reference
CALCulate
Create a reference marker at the center of the sweep range and set marker 1
to delta mode.
CALCulate<Chn>:MARKer<Mk>:FORMat MLINear | MLOGarithmic | PHASe | POLar
| COMPlex | GDELay | REAL | IMAGinary | SWR | LINPhase | LOGPhase |
IMPedance | ADMittance | MDB | MLPHase | MDPHase
Defines the output format for the (complex) value of marker <Mk> on trace no. <Chn>.
Note:
The formats of the markers assigned to a trace are independent of each other and of the
trace format settings; see CALCulate<Chn>:FORMat.
<Chn>
Channel number used to identify the active trace.
<Mk>
Marker number in the range 1 to 10.
Parameters
*RST value
See list of parameters below.
DEF – This means the format of the trace no. <Chn> (MLOG after *RST); see
CALCulate<Chn>:FORMat.
SCPI, Command
Types
Example:
Device-specific, command or query
Suppose that the active setup contains an active trace no. 1.
CALC:MARK ON; CALC:MARK:FORM?
Create marker 1, assign it to the trace no. 1 and query its format. The analyzer
returns the format of the active trace.
Assume that the marker result is given by the complex quantity z = x + jy. The meaning of the parameters
is as follows:
|z| = sqrt ( x2 + y2 )
MLINear
MLOGarithmic
MDB
|z| = sqrt ( x2 + y2 )
dB Mag(z) = 20 * log|z| dB
PHASe
φ (z) = arctan ( Im(z) / Re(z) )
POLar
x, y (Real and Imag)
COMPlex
GDELay
Group Delay, – d φ (z)/dω
REAL
x
IMAGinary
y
SWR
Standing Wave Ratio, SWR = (1 + |z|) / (1 – |z|)
LINPhase
Lin Mag and Phase, |z|, arctan ( Im(z) / Re(z) )
MLPhase
LOGPhase
dB Mag and Phase, 20 * log|z| dB, arctan ( Im(z) / Re(z) )
MDPhase
IMPedance
R, X, L or C (depending on sign(X))
ADMittance
G, B, L/C (depending on sign(X))
Operating Manual 1303.6580.32-01
317
R&S® ZVL
Command Reference
CALCulate
CALCulate<Chn>:MARKer<Mk>:FUNCtion:BWIDth <x dB Bandwidth>
Defines the bandfilter level, i.e. the minimum excursion for the bandpass and bandstop peaks.
Use CALCulate<Chn>:MARKer<Mk>:BWIDth to set the x dB Bandwidth and query the
results of a bandfilter search. Note the sign convention for input values.
<Chn>
Channel number used to identify the active trace.
<Mk>
Marker number in the range 1 to 10. This numeric suffix is ignored and may be set
to any value because the bandfilter search functions always use markers Mkr1 to
Mkr4.
<x dB
Bandwidth>
Range [def. unit]
*RST value
x dB Bandwidth parameter.
SCPI,
Command
Types
Example:
0.01 dB to 100.00 dB, the increment (UP. DOWN) is 0.3 dB. [dB]
3 dB.
Device-specific, command or query.
See CALCulate<Chn>:MARKer<Mk>:BWIDth.
CALCulate<Chn>:MARKer<Mk>:FUNCtion:BWIDth:MODE BPASs | BSTop |
BPRMarker | BSRMarker
Selects the bandfilter search mode.
<Chn>
Channel number used to identify the active trace.
<Mk>
Marker number in the range 1 to 10. This numeric suffix is ignored and may be set
to any value because the bandfilter search functions always use markers Mkr1 to
Mkr4.
Parameters
Bandfilter search type:
BPASs: Bandpass Search Ref to Max
BSTop: Bandstop Search Ref to Max
BPRMarker: Bandpass Search Ref to Marker
BSRMarker: Bandstop Search Ref to Marker
BPASs
*RST value
SCPI,
Command
Types
Example:
Device-specific, command or query.
See CALCulate<Chn>:MARKer<Mk>:BWIDth.
CALCulate<Chn>:MARKer<Mk>:FUNCtion:CENTer
Sets the center of the sweep range equal to the stimulus value of the marker <Mk> on trace no. <Chn>.
<Chn>
Channel number used to identify the active trace.
Operating Manual 1303.6580.32-01
318
R&S® ZVL
Command Reference
CALCulate
Marker number in the range 1 to 10.
<Mk>
Range [def. unit]
*RST value
SCPI, Command
Types
Example:
– [–]
–
Device-specific, no query.
*RST; CALC:MARK ON
Create marker 1 in the center of the current sweep range and assign it to
trace no. 1.
CALC:MARK:FUNC:CENT
Leave the sweep range unchanged.
CALCulate<Chn>:MARKer<Mk>:FUNCtion:DELTa[:STATe] <Boolean>
Switches the delta mode for marker <Mk> on trace no. <Chn> on or off.
Note: This command is the ZVR-compatible equivalent of
CALCulate<Chn>:MARKer<Mk>:DELTa[:STATe].
Channel number used to identify the active trace.
<Chn>
Marker number in the range 1 to 10.
<Mk>
<Boolean>
*RST value
SCPI, Command Types
ON | OFF - Enables or disables the delta mode.
OFF
Device-specific, command or query.
CALCulate<Chn>:MARKer<Mk>:FUNCtion:DOMain:USER <numeric_value>
Assigns a search range no. <numeric_value> to marker no <Mk> and selects the search range, e.g. in
order to define the start and stop values.
<Chn>
Channel number used to identify the active trace.
<Mk>
Marker number in the range 1 to 10.
<numeric_value>
Range [def. unit]
Number of the search range.
0 – fixed full span search range (equal to the sweep range)
1 to 10 – user-definable search ranges; see example
0 (reserved for full span search range)
*RST value
SCPI, Command Types
Device-specific, command or query.
Example:
CALC1:MARK1:FUNC:DOM:USER 2
Select the search range no. 2, assigned to marker no. 1 and trace no. 1.
CALC:MARK:FUNC:DOM:USER:STARt 1GHz
Set the start frequency of the search range to 1 GHz.
CALC:MARK:FUNC:DOM:USER:STOP 1.2GHz
Set the stop frequency of the search range to 1.2 GHz.
Operating Manual 1303.6580.32-01
319
R&S® ZVL
Command Reference
CALCulate
CALCulate<Chn>:MARKer<Mk>:FUNCtion:DOMain:USER:STARt <numeric_value>
Defines the start value of the search range selected with
CALCulate<Chn>:MARKer<Mk>:FUNCtion:DOMain:USER <numeric_value>.
<Chn>
Channel number used to identify the active trace.
<Mk>
Marker number in the range 1 to 10.
<numeric_value>
Range [def. unit]
Beginning of the search range.
Maximum allowed sweep range, depending on the instrument model and on
the sweep type. [Hz, dBm or s, depending on the sweep type]
0 Hz
*RST value
SCPI, Command
Types
Example:
Device-specific, command or query.
See CALCulate<Chn>:MARKer<Mk>:FUNCtion:DOMain:USER <numeric_value>
CALCulate<Chn>:MARKer<Mk>:FUNCtion:DOMain:USER:STOP <numeric_value>
Defines the stop value of the search range selected with
CALCulate<Chn>:MARKer<Mk>:FUNCtion:DOMain:USER <numeric_value>.
<Chn>
Channel number used to identify the active trace.
<Mk>
Marker number in the range 1 to 10.
<numeric_value>
Range [def. unit]
End of the search range.
Maximum allowed sweep range, depending on the instrument model and on
the sweep type. [Hz, dBm or s, depending on the sweep type]
0 Hz
*RST value
SCPI, Command
Types
Example:
Device-specific, command or query.
See CALCulate<Chn>:MARKer<Mk>:FUNCtion:DOMain:USER <numeric_value>
CALCulate<Chn>:MARKer<Mk>:FUNCtion:EXECute MAXimum | MINimum | RPEak
| LPEak | NPEak | TARGet | LTARget | RTARget | BFILter
Selects a search mode for marker no. <Mk> and initiates the search. The marker must be created before
using CALCulate<Chn>:MARKer<Mk>[:STATe] ON (exception: bandfilter search).
<Chn>
Channel number used to identify the active trace.
<Mk>
Marker number in the range 1 to 10. For a bandfilter search (BFILter) this
numeric suffix is ignored and may be set to any value because the bandfilter
search functions always use markers Mkr1 to Mkr4.
Parameters
*RST value
See list of parameters below.
–
Operating Manual 1303.6580.32-01
320
R&S® ZVL
Command Reference
CALCulate
SCPI,
Command
Types
Example:
Device-specific, no query.
Suppose that the active setup contains an active trace no. 1.
CALC:MARK ON
Create marker 1 and assign it to trace no. 1.
CALC:MARK:FUNC:EXEC MAX; RES?
Move the created marker to the absolute maximum of the trace and query the
stimulus and response value of the search result.
The analyzer provides the following search modes:
Mode
Find...
MAXimum
Absolute maximum in the search range (see
CALCulate<Chn>:MARKer<Mk>:FUNCtion:DOMain:USER
<numeric_value>)
MINimum
Absolute maximum in the search range
RPEak
Next valid peak to the right of the current marker position
LPEak
Next valid peak to the left
NPEak
Next highest or lowest value among the valid peaks (next peak)
TARGet
Target value (see CALCulate<Chn>:MARKer<Mk>:TARget)
RTARget
Next target value to the right of the current marker position
LTARget
Next target value to the left
BFILter
Bandfilter search. The results are queried using
CALCulate<Chn>:MARKer<Mk>:BWIDth.
CALCulate<Chn>:MARKer<Mk>:FUNCtion:RESult?
Returns the result (stimulus and response value) of a search started by means of
CALCulate<Chn>:MARKer<Mk>:FUNCtion:EXECute. The search must be executed before the
command is enabled.
<Chn>
Channel number used to identify the active trace.
<Mk>
Marker number in the range 1 to 10. This numeric suffix is ignored and may be set
to any value.
Response
Range [def.
unit]
*RST value
Search result in the format <Stimulus value>, <Response_value>.
Depending on the measurement parameter. [unit depending on the sweep type and
the marker format; see CALCulate<Chn>:MARKer<Mk>:FORMat]
–
SCPI,
Command
Types
Example:
Device-specific, query only.
See CALCulate<Chn>:MARKer<Mk>:FUNCtion:EXECute.
Operating Manual 1303.6580.32-01
321
R&S® ZVL
Command Reference
CALCulate
CALCulate<Chn>:MARKer<Mk>:FUNCtion[:SELect] MAXimum | MINimum | RPEak
| LPEak | NPEak | TARGet | LTARget | RTARget | BFILter
Selects a search mode for marker no. <Mk>, which can then be initiated using one of the
CALCulate<Chn>:MARKer<Mk>:SEARch..., CALCulate<Chn>:MARKer<Mk>:MAXimum or
CALCulate<Chn>:MARKer<Mk>:MINimum functions. The marker must be created before using
CALCulate<Chn>:MARKer<Mk>[:STATe] ON.
Note: This command is not needed expect for compatibility with ZVR programs. Use
CALCulate<Chn>:MARKer<Mk>:FUNCtion:EXECute to select a search mode and at the same
time initiate the search. The CALCulate<Chn>:MARKer<Mk>:SEARch...,
CALCulate<Chn>:MARKer<Mk>:MAXimum or CALCulate<Chn>:MARKer<Mk>:MINimum
functions also select the search mode.
Channel number used to identify the active trace.
<Chn>
<Mk>
Marker number in the range 1 to 10. For a bandfilter search (BFILter) this
numeric suffix is ignored and may be set to any value because the bandfilter
search functions always use markers Mkr1 to Mkr4.
Parameters
*RST value
See list of parameters below.
–
SCPI,
Command
Types
Device-specific, command or query.
The analyzer provides the following search modes:
Mode
Selected search mode
MAXimum
Absolute maximum in the search range (see
CALCulate<Chn>:MARKer<Mk>:FUNCtion:DOMain:USER
<numeric_value>)
MINimum
Absolute maximum in the search range
RPEak
Next valid peak to the right of the current marker position
LPEak
Next valid peak to the left
NPEak
Next highest value among the valid peaks
TARGet
Target value (see CALCulate<Chn>:MARKer<Mk>:TARget)
RTARget
Next target value to the right of the current marker position
LTARget
Next target value to the left
BFILter
Bandfilter search. Bandfilter search. The results are queried using
CALCulate<Chn>:MARKer<Mk>:BWIDth.
CALCulate<Chn>:MARKer<Mk>:FUNCtion:STARt
Sets the beginning (start) of the sweep range equal to the stimulus value of the marker <Mk> on trace no.
<Chn>.
<Chn>
Channel number used to identify the active trace.
<Mk>
Marker number in the range 1 to 10.
Range [def. unit]
*RST value
– [–]
–
Operating Manual 1303.6580.32-01
322
R&S® ZVL
Command Reference
CALCulate
SCPI, Command
Types
Example:
Device-specific, no query.
*RST; CALC:MARK ON
Create marker 1 in the center of the current sweep range and assign it to
trace no. 1.
CALC:MARK:FUNC:STAR
Divide the sweep range in half, starting at the current marker position.
CALCulate<Chn>:MARKer<Mk>:FUNCtion:STOP
Sets the end (stop) of the sweep range equal to the stimulus value of the marker <Mk> on trace no.
<Chn>.
<Chn>
Channel number used to identify the active trace.
<Mk>
Marker number in the range 1 to 10.
Range [def. unit]
*RST value
SCPI, Command
Types
Example:
– [–]
–
Device-specific, no query.
*RST; CALC:MARK ON
Create marker 1 in the center of the current sweep range and assign it to
trace no. 1.
CALC:MARK:FUNC:STOP
Divide the sweep range in half, ending at the current marker position.
CALCulate<Chn>:MARKer<Mk>:FUNCtion:TARget <numeric_value>
Defines the target value for the target search of marker no. <Mk>, which can be activated using
CALCulate<Chn>:MARKer<Mk>:FUCTion:EXECute TARGet.
Note: This command is the ZVR-compatible equivalent of CALCulate<Chn>:MARKer<Mk>:TARget.
Channel number used to identify the active trace.
<Chn>
<Mk>
Marker number in the range 1 to 10.
<numeric_value>
Range [def. unit]
Target search value of marker no. <Mk>.
Depending on the format of the active trace (CALCulate<Chn>:FORMat). For
a dB Mag trace the range is –300 dB to +200 dB, the increment (UP. DOWN)
is 0.1 dB. [dB, deg etc., depending on the trace format]
Depending on the trace format; 0 dB for a dB Mag trace.
*RST value
SCPI, Command
Types
Device-specific, command or query.
Operating Manual 1303.6580.32-01
323
R&S® ZVL
Command Reference
CALCulate
CALCulate<Chn>:MARKer<Mk>:MAXimum
Selects a search mode for marker no. <Mk> and initiates a maximum search. The marker must be created
before using CALCulate<Chn>:MARKer<Mk>[:STATe] ON.
Note: This command is the ZVR-compatible equivalent of
CALCulate<Chn>:MARKer<Mk>:FUNCtion:EXECute MAXimum.
Channel number used to identify the active trace.
<Chn>
Marker number in the range 1 to 10.
<Mk>
Range [def. unit]
*RST value
SCPI, Command Types
– [–]
–
Device-specific, no query.
CALCulate<Chn>:MARKer<Mk>:MINimum
Selects a search mode for marker no. <Mk> and initiates a minimum search. The marker must be created
before using CALCulate<Chn>:MARKer<Mk>[:STATe] ON.
Note: This command is the ZVR-compatible equivalent of
CALCulate<Chn>:MARKer<Mk>:FUNCtion:EXECute MAXimum.
Channel number used to identify the active trace.
<Chn>
Marker number in the range 1 to 10.
<Mk>
Range [def. unit]
*RST value
SCPI, Command Types
– [–]
–
Device-specific, no query.
CALCulate<Chn>:MARKer<Mk>:MODE CONTinuous | DISCrete
Sets marker no. <Mk> to continuous or discrete mode. The marker doesn't have to be created before
(CALCulate<Chn>:MARKer<Mk>[:STATe] ON), the mode can be assigned in advance.
<Chn>
Channel number used to identify the active trace.
<Mk>
Marker number in the range 1 to 10.
Parameters
CONTinuous – marker can be positioned on any point of the trace, and its
response values are obtained by interpolation.
DISCrete – marker can be set to discrete sweep points only.
CONT
*RST value
SCPI, Command
Types
Example:
Device-specific, command or query.
Suppose that the active setup contains an active trace no. 1.
CALC:MARK:MODE DISC; MARK2 CONT
Create marker 1 in discrete mode and marker 2 in continuous mode.
CALC:MARK ON; MARK2 ON
Operating Manual 1303.6580.32-01
324
R&S® ZVL
Command Reference
CALCulate
Display the two markers. Due to the different modes the horizontal position can
be different.
CALCulate<Chn>:MARKer<Mk>:REFerence[:STATe] <Boolean>
Creates the reference marker and assigns it to trace no. <Chn>.
<Chn>
Channel number used to identify the active trace.
<Mk>
Marker number in the range 1 to 10. This numeric suffix is ignored and may be
set to any value.
<Boolean>
*RST value
ON | OFF - Creates or removes the marker.
OFF
SCPI, Command
Types
Example:
Device-specific, command or query.
Suppose that the active setup contains an active trace no. 1.
CALC:MARK:REF ON; CALC:MARK ON
Create the reference marker and marker 1 and assign them to trace no. 1. The
default position of both markers is the center of the sweep range.
CALCulate<Chn>:MARKer<Mk>:REFerence:X <numeric_value>
Defines the stimulus (in Cartesian diagrams: x-axis) value of the reference marker, which can (but doesn't
have to) be displayed using CALCulate<Chn>:MARKer<Mk>:REFerence[:STATe] ON.
<Chn>
Channel number used to identify the active trace.
<Mk>
Marker number in the range 1 to 10. This numeric suffix is ignored and may
be set to any value.
<numeric_value>
Range [def. unit]
*RST value
Stimulus value of the reference marker.
–9.9E+11 Hz to +9.9E+11 Hz [Hz]
0 Hz
SCPI, Command
Types
Example:
Device-specific, command or query.
Suppose that the active setup contains an active trace no. 1 and that the
sweep range for a frequency sweep starts at 1 GHz.
CALC:MARK:REF ON
Create the reference marker and display it in the center of the sweep range.
CALC:MARK:REF:X 1GHz
Set the reference marker to the beginning of the sweep range.
Operating Manual 1303.6580.32-01
325
R&S® ZVL
Command Reference
CALCulate
CALCulate<Chn>:MARKer<Mk>:REFerence:Y?
Returns the response (in Cartesian diagrams: y-axis) value of the reference marker. The reference marker
must be created before using CALCulate<Chn>:MARKer<Mk>:REFerence[:STATe] ON.
<Chn>
Channel number used to identify the active trace.
<Mk>
Marker number in the range 1 to 10. This numeric suffix is ignored and may be
set to any value.
Response
Range [def. unit]
Response value of the reference marker.
Depending on the measured quantity. [unit depending on the marker format; see
CALCulate<Chn>:MARKer<Mk>:FORMat]
–
*RST value
SCPI,
Command
Types
Example:
Device-specific, query only.
Suppose that the active setup contains an active trace no. 1.
CALC:MARK:REF ON
Create the reference marker and display it in the center of the sweep range.
CALC:MARK:REF:Y?
Query the measurement value at the reference marker position.
CALCulate<Chn>:MARKer<Mk>SEARch:BFILter:RESult[:STATe] <Boolean>
Shows or hides the bandfilter search results in the diagram area.
<Chn>
Channel number used to identify the active trace.
<Mk>
Marker number in the range 1 to 10. This numeric suffix is ignored and may be set to
any value.
<Boolean>
ON - Show the bandfilter search results. If no bandfilter search has been initiated
before (CALCulate<Chn>:MARKer<Mk>:FUNCtion:EXECute BFILter),
nothing is displayed.
OFF - hide the bandfilter search results.
OFF
*RST value
SCPI,
Command
Types
Example:
Device-specific, command or query.
See CALCulate<Chn>:MARKer<Mk>:BWIDth.
CALCulate<Chn>:MARKer<Mk>:SEARch[:IMMediate]
Initiates a search according to the search function selected with
CALCulate<Chn>:MARKer<Mk>:FUNCtion[:SELect]. The marker must be created before using
CALCulate<Chn>:MARKer<Mk>[:STATe] ON.
Operating Manual 1303.6580.32-01
326
R&S® ZVL
Command Reference
CALCulate
Note: Together with CALCulate<Chn>:MARKer<Mk>:FUNCtion[:SELect] this command is the ZVRcompatible equivalent of CALCulate<Chn>:MARKer<Mk>:FUNCtion:EXECute ....
Channel number used to identify the active trace.
<Chn>
<Mk>
Marker number in the range 1 to 10. For a bandfilter search (BFILter) this
numeric suffix is ignored and may be set to any value because the bandfilter
search functions always use markers Mkr1 to Mkr4.
Range [def.
unit]
*RST value
SCPI,
Command
Types
– [–]
–
Device-specific, no query.
CALCulate<Chn>:MARKer<Mk>:SEARch:LEFT
Selects a search mode for marker no. <Mk> and initiates a search for the next valid peak to the left. The
marker must be created before using CALCulate<Chn>:MARKer<Mk>[:STATe] ON.
Note: This command is the ZVR-compatible equivalent of
CALCulate<Chn>:MARKer<Mk>:FUNCtion:EXECute LPEak.
Channel number used to identify the active trace.
<Chn>
Marker number in the range 1 to 10.
<Mk>
Range [def. unit]
*RST value
SCPI, Command Types
– [–]
–
Device-specific, no query.
CALCulate<Chn>:MARKer<Mk>:SEARch:NEXT
Selects a search mode for marker no. <Mk> and initiates a search for the next highest or lowest value
among
the
valid
peaks.
The
marker
must
be
created
before
using
CALCulate<Chn>:MARKer<Mk>[:STATe] ON.
Note: This command is the ZVR-compatible equivalent of
CALCulate<Chn>:MARKer<Mk>:FUNCtion:EXECute NPEak.
Channel number used to identify the active trace.
<Chn>
Marker number in the range 1 to 10.
<Mk>
Range [def. unit]
*RST value
SCPI, Command Types
– [–]
–
Device-specific, no query.
CALCulate<Chn>:MARKer<Mk>:SEARch:RIGHt
Selects a search mode for marker no. <Mk> and initiates a search for the next valid peak to the right. The
marker must be created before using CALCulate<Chn>:MARKer<Mk>[:STATe] ON.
Operating Manual 1303.6580.32-01
327
R&S® ZVL
Command Reference
CALCulate
Note: This command is the ZVR-compatible equivalent of
CALCulate<Chn>:MARKer<Mk>:FUNCtion:EXECute RPEak.
Channel number used to identify the active trace.
<Chn>
Marker number in the range 1 to 10.
<Mk>
Range [def. unit]
*RST value
SCPI, Command Types
– [–]
–
Device-specific, no query.
CALCulate<Chn>:MARKer<Mk>:SEARch:TRACking <Boolean>
Enables or disables the marker tracking mode for marker no. <Mk>. Tracking mode causes the active
minimum/maximum or target search of the active marker to be repeated after each sweep. A marker must
be created and a search mode must be active (CALCulate<Chn>:MARKer<Mk>:FUNCtion:EXECute
...) to use this command.
If the current search mode is a bandfilter search this command enables or disables bandfilter
tracking.
<Chn>
Channel number used to identify the active trace.
<Mk>
Marker number in the range 1 to 10. For a bandfilter search (BFILter) this
numeric suffix is ignored and may be set to any value because the bandfilter
search functions always use markers Mkr1 to Mkr4.
<Boolean>
*RST value
ON | OFF - Enables or disables the marker tracking mode.
OFF
SCPI,
Command
Types
Example:
Device-specific, command or query.
Suppose that the active setup contains an active trace no. 1.
CALC:MARK ON; FUNC:EXEC MAXimum
Create marker no. 1 and assign them to trace no. 1. Activate a maximum search
for marker no. 1.
CALC:MARK:SEAR:TRAC ON
Enable the tracking mode for the created marker.
CALCulate<Chn>:MARKer<Mk>[:STATe] <Boolean>
Creates the marker numbered <Mk> and assigns it to trace no. <Chn>.
<Chn>
Channel number used to identify the active trace.
<Mk>
Marker number in the range 1 to 10. If unspecified the numeric suffix is set to
1.
<Boolean>
ON | OFF - Creates or removes the marker.
Operating Manual 1303.6580.32-01
328
R&S® ZVL
Command Reference
CALCulate
*RST value
SCPI, Command
Types
Example:
OFF
Device-specific, command or query.
Suppose that the active setup contains an active trace no. 1.
CALC:MARK ON; MARK2 ON
Create markers 1 and 2 and assign them to trace no. 1. The default position of both markers is
the center of the sweep range.
CALCulate<Chn>:MARKer<Mk>:TARget <numeric_value>
Defines the target value for the target search of marker no. <Mk>, which can be activated using
CALCulate<Chn>:MARKer<Mk>:FUCTion:EXECute TARGet.
<Chn>
Channel number used to identify the active trace.
<Mk>
Marker number in the range 1 to 10.
<numeric_value>
Range [def. unit]
Target search value of marker no. <Mk>.
Depending on the format of the active trace (CALCulate<Chn>:FORMat). For
a dB Mag trace the range is –300 dB to +200 dB, the increment (UP. DOWN)
is 0.1 dB. [dB, deg etc., depending on the trace format]
Depending on the trace format; 0 dB for a dB Mag trace.
*RST value
SCPI, Command
Types
Example:
Device-specific, command or query.
CALC:MARK ON
Create marker no. 1 and display it in the center of the sweep range.
:CALC:MARK:TARG -10; FUNC:EXEC TARG
Define a target search value of –10 dB and start the target search.
CALC:MARK:X?
Query the stimulus value corresponding to the target search result.
CALCulate<Chn>:MARKer<Mk>:TYPE NORMal | FIXed
Sets marker no. <Mk> to normal or fixed mode. The marker must be created before using
CALCulate<Chn>:MARKer<Mk>[:STATe] ON.
<Chn>
Channel number used to identify the active trace.
<Mk>
Marker number in the range 1 to 10.
Parameters
NORMal – response value changes according to the measurement result.
FIXed – marker keeps its current response value.
NORMal
*RST value
SCPI, Command
Types
Example:
Device-specific, command or query.
CALC:MARK ON; CALC:MARK:TYPE FIX
Create marker 1and display it in the center of the sweep range as a fixed
Operating Manual 1303.6580.32-01
329
R&S® ZVL
Command Reference
CALCulate
marker.
CALC:MARK:X 1GHz
Shift the marker horizontally. The response value remains fixed.
CALCulate<Chn>:MARKer<Mk>:X <numeric_value>
Defines the stimulus (in Cartesian diagrams: x-axis) value of the marker no. <Mk>, which can (but doesn't
have to) be created using CALCulate<Chn>:MARKer<Mk>[:STATe] ON.
<Chn>
Channel number used to identify the active trace.
<Mk>
Marker number in the range 1 to 10.
<numeric_value>
Range [def. unit]
*RST value
Stimulus value of marker no. <Mk>.
–9.9E+11 Hz to +9.9E+11 Hz [Hz] (for frequency sweeps)
0 Hz
SCPI, Command
Types
Example:
Device-specific, command or query.
Suppose that the active setup contains an active trace no. 1 and the sweep range for a
frequency sweep starts at 1 GHz.
CALC:MARK ON
Create marker no. 1 and display it in the center of the sweep range.
CALC:MARK:X 1GHz
Set the marker to the beginning of the sweep range.
CALCulate<Chn>:MARKer<Mk>:Y?
Returns the response (in Cartesian diagrams: y-axis) value of marker no. <Mk>. The marker must be
created before using CALCulate<Chn>:MARKer<Mk>[:STATe] ON.
<Chn>
Channel number used to identify the active trace.
<Mk>
Marker number in the range 1 to 10.
Response
Range [def. unit]
Response value of marker no. <Mk>.
Depending on the measured quantity. [unit depending on the marker format; see
CALCulate<Chn>:MARKer<Mk>:FORMat]
–
*RST value
SCPI,
Command
Types
Example:
Device-specific, query only.
Suppose that the active setup contains an active trace no. 1.
CALC:MARK ON
Create marker no. 1 and display it in the center of the sweep range.
CALC:MARK:Y?
Query the measurement value at the marker position.
Operating Manual 1303.6580.32-01
330
R&S® ZVL
Command Reference
CALCulate
CALCulate:MATH
CALCulate<Chn>:MATH...
This subsystem permits processing of measured data in numerical expression format. The operators are -,
/ and use of constants and data arrays are permitted.
CALCulate<Chn>:MATH:FUNCtion NORMal | SUBTract | DIVide
Defines a simple mathematical relation between the active trace and the active memory trace to calculate
a new mathematical trace and displays the mathematical trace.
This command places some restrictions on the mathematical expression and the operands.
Use CALCulate<Chn>:MATH[:EXPRession]:SDEFine to define general expressions.
<Chn>
Channel number used to identify the active trace. If unspecified the numeric suffix
is set to 1.
NORMal
SUBTract
DIVide
*RST value
Math. trace = active data trace
Math. trace = data – memory
Math. trace = data / memory
NORMal
SCPI,
Command
Types
Example:
Confirmed, with query.
*RST; CALC:MATH:MEM
Copy the current state of the default trace Trc1 to a memory trace named
'Mem2[Trc1]'. The memory trace is not displayed.
CALC:MATH:FUNC DIV
Define a mathematical trace, dividing the data trace by the stored memory trace.
The mathematical trace is displayed instead of the active data trace.
CALC:MATH:STAT?
The response is 1 (mathematical mode switched on, mathematical trace
displayed).
CALCulate<Chn>:MATH:MEMorize
Copies the current state of the active data trace to a memory trace. If a mathematical trace is active, the
data trace associated with the mathematical trace is copied. The memory trace is named
Mem<n>[<Data_Trace>] where <n> counts all data and memory traces in the active setup in chronological
order, and <Data_Trace> is the name of the associated (copied) data trace.
The exact function of the command depends on the number of memory traces associated to the active
Operating Manual 1303.6580.32-01
331
R&S® ZVL
Command Reference
CALCulate
data trace:
•
If no memory trace is associated to the active trace, a new memory trace is generated.
•
If several memory traces are associated to the active trace, the current measurement data
overwrites the last generated or changed memory trace.
To copy a trace to the memory without overwriting an existing memory trace or define a
memory trace name, use TRACe:COPY <memory_trc>,<data_trc>. To copy an active
mathematical trace use TRACe:COPY:MATH <memory_trc>,<data_trc>
<Chn>
*RST value
Channel number used to identify the active trace.
–
Device-specific, no query
SCPI, Command
Types
Example:
*RST; CALC:MATH:MEM
Copy the current state of the default trace Trc1 to a memory trace named
'Mem2[Trc1]'. The memory trace is not displayed.
DISP:WIND:TRAC2:FEED 'Mem2[Trc1]'
Display the created memory trace in the active diagram area (diagram area no.
1).
CALCulate:PARameter
CALCulate<Ch>:PARameter...
This subsystem assigns names and measurement parameters to traces. The commands are devicespecific.
CALCulate<Ch>:PARameter:CATalog?
Returns the trace names and measurement parameters of all traces assigned to a particular channel.
<Ch>
Channel number. If unspecified the numeric suffix is set to 1.
Response
String parameter with comma-separated list of trace names and measurement
parameters, e.g. 'CH4TR1,S11,CH4TR2,S12'. The measurement parameters are
returned according to the naming convention of
CALCulate<Ch>:PARameter:SDEFine. The order of traces in the list reflects their
creation time: The oldest trace is the first, the newest trace is the last trace in the list.
*RST value
SCPI,
Command
Types
Example:
–
Device-specific, query only.
CALC4:PAR:SDEF 'Ch4Tr1', 'S11'
Operating Manual 1303.6580.32-01
332
R&S® ZVL
Command Reference
CALCulate
Create channel 4 and a trace named Ch4Tr1 to measure the input reflection
coefficient S11.
CALC4:PAR:CAT?
Query the traces assigned to channel 4. If Ch4Tr1 is the only trace assigned to
channel 4, the response is 'CH4TR1,S11'.
CALCulate<Ch>:PARameter:DEFine '<string>', S11 | S12 | S21 | S22
Creates a trace and assigns a channel number, a name and a measurement parameter to it. The trace is
not displayed. To display a trace defined via CALCulate<Ch>:PARameter:DEFine, a window must be
created (DISPlay:WINDow<Wnd>[:STATe] ON) and the trace must be assigned to this window
(DISPlay:WINDow<Wnd>:TRACe:FEED); see example below.
Traces must be selected to become active traces; see CALCulate:PARameter:SELect.
This command has been implemented for compatibility reasons. The parameter names in this
command differ from ZVL conventions; moreover the parameter list is not complete. The
alternative command CALCulate<Ch>:PARameter:SDEFine uses a complete parameter list
with compatible names.
<Ch>
Channel number. <Ch> may be used to reference a previously defined channel. If
<Ch> does not exist, it is generated with default channel settings.
'<string>'
Trace name, e.g. 'Trc4'. See Rules for trace names in the Trace Manager
description.
S11, S12, S21,
S22
*RST value
Measurement parameter
SCPI,
Command
Types
Example:
Device-specific, no query. CALCulate<Ch>:PARameter:CATalog? returns a list
of all defined traces.
–
CALC4:PAR:DEF 'Ch4Tr1', S11
Create channel 4 and a trace named Ch4Tr1 to measure the input reflection
coefficient S11.
DISP:WIND:STAT ON
Create diagram area no. 1.
DISP:WIND:TRAC:FEED 'CH4TR1'
Display the generated trace in diagram area no. 1.
CALCulate<Ch>:PARameter:DELete '<string>'
Deletes a trace with a specified trace name and channel.
<Ch>
Channel number.
Operating Manual 1303.6580.32-01
333
R&S® ZVL
Command Reference
CALCulate
'<string>'
*RST value
SCPI, Command
Types
Example:
Trace name, e.g. 'Trc4'. See Rules for trace names in the Trace Manager
description.
–
Device-specific, no query.
CALC4:PAR:SDEF 'Ch4Tr1', 'S11'
Create channel 4 and a trace named Ch4Tr1 to measure the input reflection
coefficient S11.
CALC4:PAR:CAT?
Query the traces assigned to channel 4. If Ch4Tr1 is the only trace assigned to
channel 4, the response is 'CH4TR1,S11'.
CALC4:PAR:DEL 'CH4TR1'
Delete the created trace.
CALCulate<Ch>:PARameter:MEASure '<string>', 'S11' | 'Y-S11' | ... | 'Z-S11'
Assigns a measurement parameter to an existing trace.
Note: To create a new trace and at the same time assign the attributes, use
CALCulate<Ch>:PARameter:SDEFine . To display the trace, create a window
(DISPlay:WINDow<Wnd>[:STATe] ON) and assign the trace to this window
(DISPlay:WINDow<Wnd>:TRACe:FEED); see example below.
Traces must be selected to become active traces; see CALCulate:PARameter:SELect.
CALCulate<Ch>:PARameter:CATalog? returns a list of all defined traces. You can open the trace
manager (DISPlay:MENU:KEY:EXECute 'Trace Manager') to obtain an overview of all channels
and traces, including the traces that are not displayed.
<Ch>
Channel number of an existing channel containing the referenced trace.
'<string>'
Trace name, e.g. 'Trc4'. See Rules for trace names in the Trace Manager
description.
'S11', ...
Measurement parameter (string variable); see list of in the
CALCulate<Ch>:PARameter:SDEFine command description.
–
*RST value
SCPI,
Command
Types
Example:
Device-specific, with query (see 'S11',... parameter description above).
CALC4:PAR:SDEF 'Ch4Tr1', 'S11'
Create channel 4 and a trace named Ch4Tr1 to measure the input reflection
coefficient S11.
CALC4:PAR:MEAS 'Ch4Tr1', 'S12'
Change the measurement parameter of the trace and measure the transmission
coefficient S12.
CALC4:PAR:MEAS? 'Ch4Tr1'
Operating Manual 1303.6580.32-01
334
R&S® ZVL
Command Reference
CALCulate
Query the measured quantity. The response is 'S12'.
CALCulate<Ch>:PARameter:SDEFine '<string>', 'S11' | ... | 'Y-S11' | ... | 'Z-S11' | ...
Creates a trace and assigns a channel number, a name and a measurement parameter to it. The trace
becomes the active trace in the channel but is not displayed.
To display the trace defined via CALCulate<Ch>:PARameter:SDEFine, create a window
(DISPlay:WINDow<Wnd>[:STATe] ON) and assign the trace to this window
(DISPlay:WINDow<Wnd>:TRACe:FEED);
see
example
below.
CALCulate<Ch>:PARameter:MEASure changes the measurement parameter of an
existing trace.
To select an existing trace as the active trace, use CALCulate:PARameter:SELect. You can open the
trace manager (DISPlay:MENU:KEY:EXECute 'Trace Manager') to obtain an overview of all
channels and traces, including the traces that are not displayed.
In FW versions <V1.90, traces created with CALCulate<Ch>:PARameter:SDEFine must
be selected explicitly (CALCulate:PARameter:SELect) in order to become active traces.
<Ch>
Channel number. <Ch> may be used to reference a previously defined channel. If
<Ch> does not exist, it is generated with default channel settings.
'<string>'
Trace name, e.g. 'Trc4'. See Rules for trace names in the Trace Manager
description.
'S11', ...
*RST value
Measurement parameter (string variable); see list of parameters below.
–
SCPI,
Command
Types
Device-specific, no query. CALCulate<Ch>:PARameter:MEASure?
'<Trc_name>' queries the measurement parameter of the trace.
CALCulate<Ch>:PARameter:CATalog? returns a list of all defined traces.
Example:
CALC4:PAR:SDEF 'Ch4Tr1', 'S11'
Create channel 4 and a trace named Ch4Tr1 to measure the input reflection
coefficient S11.
DISP:WIND2:STAT ON
Create diagram area no. 2.
DISP:WIND2:TRAC:FEED 'CH4TR1'
Display the generated trace in diagram area no. 2.
The measurement parameter is selected by means of the following keywords (the selection depends on
the number of test ports of the analyzer, e.g. S44 is not available on 2-port analyzers):
'S11' | 'S12' | ...
Normal mode S-parameters S<out><in>, where <out> and <in> denote the output and input port
numbers of the DUT.
'Y-S11' | ... 'Z-S11'
| ...
S-parameters converted to matched-circuit admittances and impedances with port numbers like for
Operating Manual 1303.6580.32-01
335
R&S® ZVL
Command Reference
CALCulate
normal mode S-parameters.
'KFAC21' | 'KFAC12' |
...
Stability factor K (for unbalanced ports only)
'MUF121' | 'MUF112' |
...
Stability factor µ1 (for unbalanced ports only)
'MUF221' | 'MUF212' |
...
Stability factor µ2 (for unbalanced ports only)
*)Selecting a parameter Y...<n><m> or Z...<n><m> sets the range of port numbers to be considered for
the Y and Z-parameter measurement to <n>:<m>.
CALCulate<Ch>:PARameter:SELect <string>
Selects an existing trace as the active trace of the channel. All trace commands without explicit reference
to
the
trace
name
act
on
the
active
trace
(e.g.
CALCulate<Ch>:FORMat).
CALCulate<Ch>:PARameter:SELect is also necessary if the active trace of a channel has been
deleted.
<Ch>
Channel number.
<string>
Trace name, e.g. 'Trc4'. See Rules for trace names in the Trace Manager
description.
*RST value
SCPI, Command
Types
Example:
–
Device-specific, with query (returns the name of the active trace).
CALC4:PAR:SDEF 'Ch4Tr1', 'S11'
Create channel 4 and a trace named Ch4Tr1 to measure the input reflection
coefficient S11. The trace is the active trace in channel 4.
CALC4:PAR:SDEF 'Ch4Tr2', 'S22'
Create another trace named Ch4Tr2 to measure the output reflection coefficient
S22. Again this new trace becomes the active trace in channel 4.
CALC4:PAR:SEL 'Ch4Tr1'
Select the first trace Ch4Tr1 as the active trace.
CALC4:FORM MLIN
Calculate the magnitude of S11 and display it in a linearly scaled Cartesian
diagram.
CALCulate:PHOLd
CALCulate<Chn>:PHOLd
This subsystem controls the max hold (peak hold) function.
Operating Manual 1303.6580.32-01
336
R&S® ZVL
Command Reference
CALCulate
CALCulate<Chn>:PHOLd MAX | OFF
Enables, disables, or restarts the max hold function.
<Chn>
Channel number used to identify the active trace.
Parameters
MAX - Enable the max hold function
OFF - Disables the max hold function
OFF
*RST value
SCPI, Command Types
Device-specific, command or query.
Example:
*RST; CALC:PHOL MAX
Reset the instrument and enable the max hold function.
CALC:PHOL OFF; PHOL MAX
Restart max hold.
CALCulate:SMOothing
CALCulate<Chn>:SMOothing...
This subsystem provides the settings for trace smoothing.
CALCulate<Chn>:SMOothing:APERture <numeric_value>
Defines how many measurement points are averaged to smooth the trace.
<Chn>
Channel number used to identify the active trace. If unspecified the numeric
suffix is set to 1.
<numeric_value>
Range [def. unit]
Smoothing aperture.
0.05% to 100%. A smoothing aperture of n % means that the smoothing
interval for each sweep point i with stimulus value xi is equal to [xi –
span*n/200, xi + span*n/200], and that the result of i is replaced by the
arithmetic mean value of all measurement points in this interval. [%]
1
*RST value
SCPI, Command
Types
Example:
Device-specific, command or query.
*RST; CALC:SMO ON
Activate smoothing for the default trace.
CALC:SMO:APER 0.5
Reduce the smoothing aperture to 0.5 %.
Operating Manual 1303.6580.32-01
337
R&S® ZVL
Command Reference
CALCulate
CALCulate<Chn>:SMOothing[:STATe] <Boolean>
Enables or disables smoothing for trace no. <Chn>.
<Chn>
Channel number used to identify the active trace.
<Boolean>
ON | OFF - Smoothing on or off.
OFF
*RST value
SCPI, Command Types
Device-specific, command or query.
Example:
See CALCulate<Chn>:STATistics:SMOothing:APERture
CALCulate:STATistics
CALCulate<Chn>:STATistics...
This subsystem evaluates and displays statistical and phase information of the trace.
CALCulate<Chn>:STATistics:DOMain:USER <numeric_value>
Selects one out of 10 evaluation ranges to be configured with the
CALCulate<Chn>:STATistics:DOMain:USER:STARt and
CALCulate<Chn>:STATistics:DOMain:USER:STOP commands.
<Chn>
Channel number used to identify the active trace. If unspecified the numeric
suffix is set to 1.
<numeric_value>
Range [def. unit]
Number of the evaluation range.
1 to 10. In addition, 0 denotes the (non-configurable) Full Span evaluation
range. [–]
0
*RST value
SCPI, Command
Types
Example:
Device-specific, command or query.
*RST; CALC:STAT:DOM:USER?
Query the default evaluation range. The response is zero, i.e. the evaluation
range is equal to the complete sweep range
CALC:STAT:DOM:USER 1; :CALC:STAT:DOM:USER:STARt 1GHZ; STOP 2GHZ
Select evaluation range no. 1 and define the evaluation range between 1
GHz and 2 GHz.
CALCulate<Chn>:STATistics:DOMain:USER:STARt <numeric_value>
Defines the start value of the evaluation range selected via
CALCulate<Chn>:STATistics:DOMain:USER.
Operating Manual 1303.6580.32-01
338
R&S® ZVL
Command Reference
CALCulate
<Chn>
Channel number used to identify the active trace.
<numeric_value>
Range [def. unit]
*RST value
Start value of the evaluation range.
–1000 GHz to 999.999999999 GHz. [Hz]
Lowest frequency of the analyzer, depending on the analyzer model.
SCPI, Command Types
Device-specific, command or query.
Example:
See CALCulate<Chn>:STATistics:DOMain:USER
CALCulate<Chn>:STATistics:DOMain:USER:STOP <numeric_value>
Defines the stop value of the evaluation range selected via
CALCulate<Chn>:STATistics:DOMain:USER.
<Chn>
Channel number used to identify the active trace.
<numeric_value>
Range [def. unit]
*RST value
Stop value of the evaluation range.
–999.999999999 GHz to 1000 GHz. [Hz]
Highest frequency of the analyzer, depending on the analyzer model.
SCPI, Command Types
Device-specific, command or query.
Example:
See CALCulate<Chn>:STATistics:DOMain:USER
CALCulate<Chn>:STATistics:EPDelay[:STATe] <Boolean>
Displays or hides the Phase Delay/El Length results in the diagram area of trace no. <Chn>.
Channel number used to identify the active trace.
<Chn>
<Boolean>
*RST value
ON | OFF - Statistical info field on or off.
OFF
SCPI, Command Types
Device-specific, command or query.
Example:
See CALCulate<Chn>:STATistics:[:STATe]
CALCulate<Chn>:STATistics:MMPTpeak[:STATe] <Boolean>
Displays or hides the Min/Max/Peak-Peak results in the diagram area of trace no. <Chn>.
Channel number used to identify the active trace.
<Chn>
<Boolean>
*RST value
ON | OFF - Statistical info field on or off.
OFF
SCPI, Command Types
Device-specific, command or query.
Example:
See CALCulate<Chn>:STATistics:[:STATe]
Operating Manual 1303.6580.32-01
339
R&S® ZVL
Command Reference
CALCulate
CALCulate<Chn>:STATistics:MSTDev[:STATe] <Boolean>
Displays or hides the Mean/Std Dev results in the diagram area of trace no. <Chn>.
<Chn>
Channel number used to identify the active trace.
<Boolean>
ON | OFF - Statistical info field on or off.
OFF
*RST value
SCPI, Command Types
Device-specific, command or query.
Example:
See CALCulate<Chn>:STATistics:[:STATe]
CALCulate<Chn>:STATistics:RESult? MEAN | STDDev | MAX | MIN | RMS | PTPeak
| ELENgth | PDELay | ALL
Returns a single statistical parameters of the trace no. <Chn> or all parameters. It is not necessary to
display the info field (CALCulate<Chn>:STATistics[:STATe] ON) before using this command.
<Chn>
Channel number used to identify the active trace.
Parameters
MEAN – Return arithmetic mean value of all response values of the trace in the
entire sweep range (or in the evaluation range defined in manual control)
STDDev – Return standard deviation of all response values
MAX – Return the maximum of all response values
MIN – Return the minimum of all response values
RMS – Return the root mean square of all response values
PTPeak – Return the peak-to-peak value (MAX – MIN)
ELENgth – Return the electrical length
PDELay – Return the phase delay
ALL – Return all statistical values, observing the order used above
Range [def.
unit]
*RST value
SCPI,
Command
Types
Example:
The data is returned as a comma-separated list of real numbers. The unit is the
default unit of the measured parameter; see
CALCulate<Ch>:PARameter:SDEFine but also depends on the trace format
(linear or logarithmic scale, see CALCulate<Chn>:FORMat). If a polar trace format
is selected, then the statistical parameters are calculated from the linear magnitude
of the measurement parameter. [–]
–
Device-specific, query only.
*RST; CALC:STAT:RES? MAX
Calculate and return the maximum of the default trace showing an S-parameter on a
dB Mag scale.
:CALC:FORM POL; STAT:RES? MAX
Display the trace in a polar diagram and re-calculate the maximum. The result
corresponds to the previous result but is converted to a unitless linear value.
Operating Manual 1303.6580.32-01
340
R&S® ZVL
Command Reference
CALCulate
CALCulate<Chn>:STATistics:RMS[:STATe] <Boolean>
Displays or hides the RMS results in the diagram area of trace no. <Chn>.
<Chn>
Channel number used to identify the active trace.
<Boolean>
ON | OFF - Statistical info field on or off.
OFF
*RST value
SCPI, Command Types
Device-specific, command or query.
Example:
See CALCulate<Chn>:STATistics:[:STATe]
CALCulate<Chn>:STATistics[:STATe] <Boolean>
Displays or hides all statistical results in the diagram area of trace no. <Chn> except the compression
point results.
You can display or hide the Min/Max/Peak-Peak, Mean/Std Dev, RMS, and the Phase
Delay/El Length results separately; see example below.
<Chn>
Channel number used to identify the active trace.
<Boolean>
*RST value
ON | OFF - Statistical info field on or off.
OFF
SCPI, Command
Types
Example:
Device-specific, command or query.
*RST; CALC:STAT:MMPT ON
Reset the instrument, hiding all statistical results. Display the Min/Max/PeakPeak results.
CALC:STAT:MSTD ON
Display the Mean/Std Dev results in addition.
CALC:STAT:RMS ON
Display the RMS results in addition.
CALC:STAT:EPD ON
Display the Phase Delay/El Length results in addition.
CALC:STAT OFF
Hide all results.
Operating Manual 1303.6580.32-01
341
R&S® ZVL
Command Reference
CALCulate
CALCulate:TRANsform
CALCulate<Chn>:TRANsform...
This subsystem converts measured data from one representation to another.
CALCulate<Chn>:TRANsform:COMPlex S | Y | Z
Converts S-parameters into matched-circuit (converted) Y-parameters or Z-parameters and vice versa,
assuming that port no. i is terminated with Z0i so that the three parameter sets are equivalent and the
following formulas apply:
<Chn>
Channel number used to identify the active trace. If unspecified the numeric
suffix is set to 1.
S|Y|P
*RST value
S-parameters, Y-parameters, Z-parameters
– (The initial representation of the trace is determined by means of
CALCulate<Ch>:PARameter:SDEFine)
SCPI, Command
Types
Example:
Device-specific, command or query.
*RST; CALC:PAR:MEAS 'Trc1'", '"Y-S22'
Select the converted admittance Y<–S22 as measurement parameter of the
default trace.
CALC:TRAN:COMP S
Convert the converted Y-parameter into an S-parameter.
Operating Manual 1303.6580.32-01
342
R&S® ZVL
Command Reference
CONFigure
CONFigure
CONFigure:CHANnel<Ch>...
This subsystem creates and deletes channels and assigns names to channels. The commands are
device-specific.
CONFigure:CHANnel<Ch>:CATalog?
Returns the numbers and names of all channels in the current setup.
<Ch>
Channel number. This parameter is ignored because the command returns all
channels.
Response
String with comma-separated list of channel numbers and names, see example
below. If all channels have been deleted the response is an empty string ("").
*RST value
–
Device-specific, query only.
SCPI,
Command
Types
Example:
*RST; CONF:CHAN2:STAT ON; NAME 'New Channel'
Create channel 2 and assign the channel name "New Channel".
CONF:CHAN:CAT?
Query all channels and their names. As a default channel no. 1 is created on
*RST, the response is '1,Ch1,2,New_Channel'.
CONF:CHAN:NAME:ID? 'New Channel'
Query the channel number for the channel named "New Channel". The response
is 2.
CONFigure:CHANnel<Ch>:NAME '<Ch_name>'
Assigns a name to channel number <Ch>. The channel must be created before
(CONFigure:CHANnel<Ch>[:STATe] ON). Moreover it is not possible to assign the same name to two
different channels. CONFigure:CHANnel<Ch>:CATalog? returns a list of all defined channels with their
names.
<Ch>
Number of an existing channel.
'<Ch_name>'
Channel name, e.g. 'Channel 4'.
*RST value
'Ch1'
SCPI, Command Types
Device-specific, command or query.
Example:
See CONFigure:CHANnel<Ch>:CATalog?
Operating Manual 1303.6580.32-01
343
R&S® ZVL
Command Reference
DIAGnostic
CONFigure:CHANnel<Ch>:NAME:ID? '<Ch_name>'
Queries the channel number (numeric suffix) of a channel with kown channel name. A channel name must
be assigned before (CONFigure:CHANnel<Ch>NAME '<Ch_name>').
CONFigure:CHANnel<Ch>:CATalog? returns a list of all defined channels with their names.
<Ch>
Channel number. This suffix is not relevant and may be omitted (the command
returns the right channel number).
'<Ch_name>'
Channel name, e.g. 'Channel 4'.
*RST value
SCPI, Command
Types
Example:
–
Device-specific, command or query.
See CONFigure:CHANnel<Ch>:CATalog?
CONFigure:CHANnel<Ch>[:STATe] <Boolean>
Creates or deletes channel no. <Ch> and selects
CONFigure:CHANnel<Ch>:NAME defines the channel name.
it
as
the
active
channel.
A channel created with CONFigure:CHANnel<Ch>[:STATe] ON can be configured but has
no trace assigned so that no measurement can be initiated. Use
CALCulate<Ch>:PARameter:SDEFine "<Trace_name>,"<Parameter>" to create a
new channel and a new trace.
In remote control it is possible to remove all channels. This is in contrast to manual control
where at least one channel with one diagram area and one trace must be available.
<Ch>
Number of the channel to be created or deleted.
<Boolean>
ON - Create channel no. <Ch>. If the channel no. <Ch> exists already, it is not
modified but selected as the active channel
OFF - Delete channel no. <Ch>.
ON for channel no. 1 (created on *RST), OFF for all other channels.
*RST value
SCPI, Command
Types
Example:
Device-specific, command or query.
See CONFigure:CHANnel<Ch>:CATalog?
DIAGnostic
DIAGnostic:SERVice...
This subsystem provides access to service and diagnostic routines used in service, maintenance and
repair. In accordance with the SCPI standard all commands are device-specific.
Operating Manual 1303.6580.32-01
344
R&S® ZVL
Command Reference
DISPlay
Service functions are password-protected (SYSTem:PASSword[:CENable]) and should be used by a
R&S service representative only. Refer to the service manual for more information.
DIAGnostic:SERVice:FUNCtion <numeric_value>,...
DIAGnostic:SERVice:SFUNction '<string>',...
Activates a service function (for internal use only).
DISPlay
DISPlay...
This subsystem controls the selection and presentation of graphical and trace information on the screen.
Note: Traces are generally identified by a string parameter defining the trace name (e.g.
CALCulate<Ch>:PARameter:SELect <Trace_Name>). In the DISPlay... subsystem, traces
are assigned to diagram areas (DISPlay:WINDow<Wnd>:TRACe<WndTr>:FEED
<Trace_Name>). While this assignment is valid, the trace is identified by the numeric suffix
<WndTr> and the trace name is not needed.
DISPlay:ANNotation:FREQuency[:STATe] <Boolean>
Shows or hides all frequency stimulus values in the diagrams.
ON | OFF - Show or hide stimulus values.
<Boolean>
*RST value
SCPI, Command
Types
Example:
ON
Confirmed, command or query
*RST; DISP:ANN:FREQ OFF
Create diagram area no. 1 (with default trace) and hide the frequency
stimulus values.
DISPlay:CMAP<Element>:MARKer[:STATe] <Boolean>
Displays all markers with the same color or display each marker with the color of the associated trace. The
colors of all display elements are defined via DISPlay:CMAP<Element>:RGB <red>, <green>,
<blue>,....
<Element>
Numeric suffix, not used in this command. Implemented for compatibility with
DISPlay:CMAP<Element>:RGB.
Operating Manual 1303.6580.32-01
345
R&S® ZVL
Command Reference
DISPlay
<Boolean>
*RST value
SCPI,
Command
Types
Example:
ON – All markers have the same color, to be defined via DISPlay:CMAP6:RGB
<red>, <green>, <blue>. The marker color is independent of the trace
colors.
OFF - Each marker has the color of the associated trace.
*RST does not affect the color settings; see also description of the Preset
command.
Device-specific, command or query
See DISPlay:CMAP<Element>:RGB.
DISPlay:CMAP<Element>:RGB <red>, <green>, <blue> [,<trace_style>,
<trace_width>]
Defines the color of all display elements based on the Red/Green/Blue color model.
<Element>
Number of the display element. The display elements corresponding to the
numbers 1 to 28 are listed below.
<red>
<green>
<blue>
Range [def. unit]
Red, green, and blue content of the defined color.
<trace_style>
Optional trace style, only for traces (<Element> > 12): One of the string
parameters SOLid | DASHed | DOTTed | DDOTted | DDDotted.
Optional trace width, only for traces (<Element> > 12).
1 to 20 [–]
*RST does not affect the color settings; see also description of the Preset
command.
<trace_width>
Range [def. unit]
*RST values
0 (zero intensity, corresponding to a 0 in the 24-bit color model) to 1 (full
intensity, corresponding to 255 in the 24-bit color model) [–]
SCPI, Command
Types
Confirmed (with device-specific numeric suffix and parameters), command or
query. The query returns three values between 0 and one, separated by
commas, corresponding to the red, green, and blue color content.
Example:
*RST; DISP:CMAP:MARK ON; CALC:MARK ON
Create diagram area no. 1 (with default trace showing the S-parameter S21) and
a marker Mkr 1.
CALC:PAR:SDEF 'TRC2', 'S11'; DISP:WIND:TRAC2:FEED 'TRC2'
Create a new trace named TRC2 and display the trace in diagram area no. 1.
Note that the new trace automatically becomes the active trace.
CALC:MARK2 ON
Assign a marker Mkr 2 to the trace. Both markers are displayed with the same
color.
DISP:CMAP13:RGB 1,0,0; DISP:CMAP14:RGB 0,1,0
Color the first trace red, the second trace green.
DISP:CMAP6:RGB?
Operating Manual 1303.6580.32-01
346
R&S® ZVL
Command Reference
DISPlay
Query the marker color. The marker color depends on the settings made in
previous sessions; it is not reset. A possible response is 0,0,0 for black markers.
DISP:CMAP:MARK OFF
Change the marker colors: Mkr 1 turns red, Mkr 2 turns green.
The numeric suffixes <Element> denote the following display elements:
<Element>
Display Element
1
Background
2
Text
3
Selected Text
4
Grid
5
Reference Line
6
Same Color for all Markers
7
Horizontal Line / Vertical Range Lines
8
Diagram Title
9
Limit Fail Trace Color
10
Limit Line Type Off
11
Limit Line Type Upper
12
Limit Line Type Lower
13
Trace 1
14
Trace 2
15
Trace 3
16
Trace 4
17
Trace 5
Operating Manual 1303.6580.32-01
347
R&S® ZVL
Command Reference
DISPlay
18
Trace 6
19
Trace 7
20
Trace 8
21
Trace 9
22
Trace 10
23
Trace 11
24
Trace 12
25
Trace 13
26
Trace 14
27
Trace 15
28
Trace 16
DISPlay:CMAP<Element>:TRACe:COLor[:STATe] <Boolean>
Defines the trace color schemes in different diagram areas.
<Element>
Numeric suffix, not used in this command. Implemented for compatibility with
DISPlay:CMAP<Element>:RGB.
<Boolean>
OFF – Independent color scheme in new diagram area. Moved traces change
their color.
ON – Color scheme in new diagram area continues the previous color scheme.
Moved traces keep their color.
*RST value
SCPI, Command
Types
Example:
*RST does not affect the color settings; see also description of the Preset
command.
Device-specific, command or query
*RST; DISP:CMAP13:RGB 1,0,0
Create diagram area no. 1 (with default trace showing the S-parameter S21) and
color the trace red.
DISP:CMAP:TRAC:COL OFF; DISP:WIND2:STAT ON
Select independent color schemes for new diagram areas. Create a new
diagram area no. 2.
CALC:PAR:SDEF 'TRC2', 'S11'; DISP:WIND2:TRAC2:FEED 'TRC2'
Operating Manual 1303.6580.32-01
348
R&S® ZVL
Command Reference
DISPlay
Create a new trace named TRC2 and display the trace in a new diagram area
no. 2. The new trace is red like the first trace.
DISP:CMAP:TRAC:COL ON; DISP:WIND3:STAT ON
Continue the same color scheme in new diagram areas. Create a new diagram
area no. 3.
CALC:PAR:SDEF 'TRC3', 'S22'; DISP:WIND3:TRAC3:FEED 'TRC3'
Create a new trace named TRC3 and display the trace in a new diagram area
no. 3. The new trace is not red.
DISPlay:MENU:KEY:EXECute '<menu_key>'
Executes the function of a key with a specified name and switches to the local screen.
You can use this command to execute part of your measurement task manually; see
Combining Manual and Remote Control. Menu keys that initiate events are executed
immediately,
because
no
additional
input
is
necessary.
However,
DISPlay:MENU:KEY:EXECute can be used as well for manual entries in numeric entry
bars, dialogs or wizards.
'<menu_key>'
*RST value
SCPI,
Command
Types
Example:
Name of the key as shown in the analyzer's softkey bar (case-sensitive string
variable, may contain blanks but no dots). If the name is not unique, the complete
menu path can be specified, e.g. 'Trace:Format:Phase'. Menus, submenus and
menu function must be separated by colons.
–
Device-specific, no query
*RST; DISP:MENU:KEY:EXEC 'S11'; EXEC 'Trace:Format:Phase'
Assign the S-parameter S11 to the default trace, open the local analyzer screen,
then display the phase of the measured quantity. The commands are executed
immediately without any manual entry.
DISP:MENU:KEY:EXEC 'Start'
Open the numeric input bar for the start frequency of the sweep. The frequency
can be entered manually.
DISP:MENU:KEY:EXEC 'About Nwa'
Display information about your network analyzer and the firmware version. The
info box is closed when you click the analyzer screen or if you send another
command.
DISPlay:MENU:KEY:SELect '<menu_key>'
Activates the menu or submenu of the specified key.
Operating Manual 1303.6580.32-01
349
R&S® ZVL
Command Reference
DISPlay
Name of the key as shown in the analyzer's softkey bar (case-sensitive
string variable).
'<menu_key>'
*RST value
–
Device-specific, no query
SCPI, Command
Types
Example:
*RST; DISP:MENU:KEY:SEL 'S11'
Open the Trace – Meas menu in order to select a measured quantity.
DISPlay[:WINDow<Wnd>]:MAXimize <Boolean>
Maximizes all diagram areas in the active setup or restores the previous display configuration.
<Wnd>
Number of the diagram area to become the active diagram area.
DISPlay:WINDow<Wnd>:MAXimize acts on all diagrams of the current setup,
however, the diagram no. <Wnd> is displayed on top of the others.
<Boolean>
ON | OFF - Maximize all diagram areas or restore the previous display
configuration.
*RST value
SCPI,
Command
Types
Example:
OFF
Device-specific, command or query (returns whether or not the diagrams are
maximized).
*RST; DISP:WIND2:STAT ON
Create diagram areas no. 1 (with default trace) and 2 (with no trace).
DISP:WIND2:MAXimize ON
Maximize the diagram areas, placing area no. 2 on top.
DISPlay[:WINDow<Wnd>]:STATe <Boolean>
Creates or deletes a diagram area, identified by its area number <Wnd>.
<Wnd>
Number of the diagram area to be created or deleted.
<Boolean>
ON | OFF - Creates or deletes diagram area no. <Wnd>.
*RST value
–
SCPI, Command
Types
Device-specific, command or query (returns whether or not a particular
diagram area exists).
Example:
CALC4:PAR:SDEF 'Ch4Tr1', 'S11'
Create channel 4 and a trace named Ch4Tr1 to measure the input reflection
coefficient S11.
DISP:WIND2:STAT ON
Create diagram area no. 2.
Operating Manual 1303.6580.32-01
350
R&S® ZVL
Command Reference
DISPlay
DISP:WIND2:TRAC9:FEED 'CH4TR1'
Display the generated trace in diagram area no. 2, assigning the trace
number 9 to it.
DISPlay[:WINDow<Wnd>]:TITLe:DATA '<string>'
Defines a title for diagram area <Wnd>.
<Wnd>
Number of the diagram area.
'<string>'
String variable for the title. The length of the title is practically unlimited but
should be kept short enough to be displayed in the diagrams.
*RST value
SCPI, Command
Types
Example:
''
Device-specific, command or query
*RST; :DISP:WIND:TITL:DATA 'S21 Test Diagram'
Define a title for the default diagram area. The title is displayed below the top of
the diagram area.
DISP:WIND:TITL OFF; TITL:DATA?
Hide the title. The title is no longer displayed but still defined so it can be
displayed again.
DISPlay[:WINDow<Wnd>]:TITLe[:STATe] <Boolean>
Displays
or
hides
the
title
for
DISPlay:WINDow<Wnd>:TITLe:DATA.
area
number
<Wnd>,
<Wnd>
Number of the diagram area.
<Boolean>
ON | OFF - Displays or hides the title.
*RST value
defined
by
means
of
ON
SCPI, Command Types
Device-specific, command or query
Example:
See DISPlay:WINDow<Wnd>:TITLe:DATA.
DISPlay[:WINDow<Wnd>]:TRACe<WndTr>:DELete
Releases the assignment between a trace and a diagram area, as defined by means of
DISPlay:WINDow<Wnd>:TRACe<WndTr>:FEED <Trace_Name> and expressed by the <WndTr>
suffix. The trace itself is not deleted; this must be done via CALCulate<Ch>:PARameter:DELete
<Trace_Name>.
<Wnd>
Number of an existing diagram area (defined by means of
DISPlay:WINDow<Wnd>:STATe ON).
Operating Manual 1303.6580.32-01
351
R&S® ZVL
Command Reference
DISPlay
Trace number used to distinguish the traces of the same diagram area <Wnd>.
<WndTr>
*RST value
SCPI, Command
Types
Example:
–
Device-specific, no query.
CALC4:PAR:SDEF 'Ch4Tr1', 'S11'
Create channel 4 and a trace named Ch4Tr1 to measure the input reflection
coefficient S11.
DISP:WIND2:STAT ON
Create diagram area no. 2.
DISP:WIND2:TRAC9:FEED 'CH4TR1'
Display the generated trace in diagram area no. 2, assigning the trace number 9
to it.
DISP:WIND2:TRAC9:DELete
Release the assignment between trace no. 9 and window no. 2. The trace can
still be referenced with its trace name Ch4Tr1.
DISPlay[:WINDow<Wnd>]:TRACe<WndTr>:FEED '<trace_name>'
Assigns an existing trace (CALCulate<Ch>:PARameter:SDEFine <Trace_Name>) to a diagram area,
using the <WndTr> suffix, and displays the trace.
A trace can be assigned to a diagram only once. If a attempt is made to assign the same
trace a second time (e.g. by typing DISP:WIND2:TRAC8:FEED 'CH4TR1' after executing
the program example below) an error message –114,"Header suffix out of range is
generated.
You can open the trace manager (DISPlay:MENU:KEY:EXECute 'Trace Manager') to
obtain an overview of all channels and traces, including the traces that are not displayed.
<Wnd>
Number of an existing diagram area (defined by means of
DISPlay:WINDow<Wnd>:STATe ON).
<WndTr>
Trace number used to distinguish the traces of the same diagram area
<Wnd>.
'<trace_name>'
String parameter for the trace name, e.g. 'Trc4'.
*RST value
SCPI, Command
Types
Example:
–
Device-specific, no query.
CALC4:PAR:SDEF 'Ch4Tr1', 'S11'
Create channel 4 and a trace named Ch4Tr1 to measure the input reflection
coefficient S11.
DISP:WIND2:STAT ON
Create diagram area no. 2.
DISP:WIND2:TRAC9:FEED 'CH4TR1'
Operating Manual 1303.6580.32-01
352
R&S® ZVL
Command Reference
DISPlay
Display the generated trace in diagram area no. 2, assigning the trace
number 9 to it.
DISPlay[:WINDow<Wnd>]:TRACe<WndTr>:X:OFFSet <numeric_value>
Shifts the trace <WndTr> in horizontal direction, leaving the positions of all markers unchanged.
<Wnd>
Number of an existing diagram area (defined by means of
DISPlay:WINDow<Wnd>:STATe ON).
<WndTr>
Existing trace number, assigned by means of
DISPlay:WINDow<Wnd>:TRACe<WndTr>:FEED.
<numeric_value>
Stimulus offset value.
Range [def. unit]
*RST value
SCPI, Command
Types
Example:
–1000 GHz to +1000 GHz [Hz, for frequency sweeps]. The range and unit
depends on the sweep type ([SENSe<Ch>:]SWEep:TYPE).
0.
Device-specific, with query.
*RST; :DISP:WIND:TRAC:X:OFFS 1MHZ; :DISP:WIND:TRAC:Y:OFFS 10
Create the default trace and shift it horizontally by 1 MHz, vertically by 10 dB.
DISPlay[:WINDow<Wnd>]:TRACe<WndTr>:Y:OFFSet <Magnitude>[,<Phase>,
<Real>, <Imaginary>]
Modifies all points of the trace <WndTr> by means of an added and/or a multiplied complex constant. The
response values M of the trace are transformed according to:
<Wnd>
Number of an existing diagram area (defined by means of
DISPlay:WINDow<Wnd>:STATe ON).
<WndTr>
Existing trace number, assigned by means of
DISPlay:WINDow<Wnd>:TRACe<WndTr>:FEED.
<Magnitude>
Range [def. unit]
*RST value
Multiplied magnitude factor
–300 dB to + 300 dB [dB]
0 dB
<Phase>
Range [def. unit]
*RST value
Multiplied phase factor, optional for setting command but returned by query
–3.4*1038 deg to +3.4*1038 deg [deg]
0 deg
<Real>,
<Imaginary>
Real and imaginary part of added complex constant, optional for setting
command but returned by query
Range [def. unit]
*RST value
–3.4*1038 to +3.4*1038 [–]
0.
Operating Manual 1303.6580.32-01
353
R&S® ZVL
Command Reference
DISPlay
SCPI, Command
Types
Example:
Device-specific, with query.
*RST; :DISP:WIND:TRAC:X:OFFS 1MHZ; :DISP:WIND:TRAC:Y:OFFS 10
Create the default trace and shift it horizontally by 1 MHz, vertically by 10 dB.
DISP:WIND:TRAC:Y:OFFS?
Query all response offset values. The response is 10,0,0,0.
DISPlay[:WINDow<Wnd>]:TRACe<WndTr>:Y[:SCALe]:AUTO ONCE[,
'<trace_name>']
Displays the entire trace in the diagram area, leaving an appropriate display margin. The trace can be
referenced either by its number <WndTr> or by its name <trace_name>.
<Wnd>
Number of an existing diagram area (defined by means of
DISPlay:WINDow<Wnd>:STATe ON).
<WndTr>
Existing trace number, assigned by means of
DISPlay:WINDow<Wnd>:TRACe<WndTr>:FEED. This suffix is ignored if the
optional <trace_name> parameter is used.
ONCE
Activate the autoscale function.
'<trace_name>'
Optional string parameter for the trace name, e.g. 'Trc4'. If this optional
parameter is present, the trace number <WndTr> is ignored.
–
*RST value
SCPI, Command
Types
Example:
Confirmed, no query.
*RST; DISP:WIND:TRAC:Y:PDIV?; RLEV?
Query the value between two grid graticules and the reference value for the
default trace. The response is 10;0.
DISP:WIND:TRAC:Y:AUTO ONCE; PDIV?; RLEV?
or: DISP:WIND:TRAC:Y:AUTO ONCE, 'Trc1'; PDIV?; RLEV?
Autoscale the default trace and query the scaling parameters again. In general
both values have changed.
DISPlay[:WINDow<Wnd>]:TRACe<WndTr>:Y[:SCALe]:BOTTom <lower_value>[,
'<trace_name>']
Sets the lower (minimum) edge of the diagram area <Wnd>.
<Wnd>
Number of an existing diagram area (defined by means of
DISPlay:WINDow<Wnd>:STATe ON).
<WndTr>
Existing trace number, assigned by means of
DISPlay:WINDow<Wnd>:TRACe<WndTr>:FEED. This suffix is ignored if the
optional <trace_name> parameter is used.
Operating Manual 1303.6580.32-01
354
R&S® ZVL
Command Reference
DISPlay
<lower_value>
Range [def. unit]
*RST value
'<trace_name>'
*RST value
SCPI, Command
Types
Example:
Value and unit for the lower diagram edge.
Range and unit depend on the measured quantity, see Units for DISPlay...
Commands.
Depending on the measured quantity. The default lower edge for a dB Mag
diagram is –80 dB.
Optional string parameter for the trace name, e.g. 'Trc4'. If this optional
parameter is present, the trace number <WndTr> is ignored.
–
Confirmed, with query.
CALC4:PAR:SDEF 'Ch4Tr1', 'S11'
Create channel 4 and a trace named Ch4Tr1 to measure the input reflection
coefficient S11.
DISP:WIND2:STAT ON
Create diagram area no. 2.
DISP:WIND2:TRAC9:FEED 'CH4TR1'
Display the generated trace in diagram area no. 2, assigning the trace number 9
to it.
DISP:WIND2:TRAC9:Y:BOTT -40; TOP 10
or: DISP:WIND2:TRAC:Y:BOTT -40, 'CH4TR1'; TOP 10, 'CH4TR1'
Scale the diagram between -40 dB and +10 dB.
DISPlay[:WINDow<Wnd>]:TRACe<WndTr>:Y[:SCALe]:PDIVision
<numeric_value>[, '<trace_name>']
Sets the value between two grid graticules (value “per division”) for the diagram area <Wnd>. When a new
PDIVision value is entered, the current RLEVel is kept the same, while the top and bottom scaling is
adjusted for the new PDIVision value.
<Wnd>
Number of an existing diagram area (defined by means of
DISPlay:WINDow<Wnd>:STATe ON).
<WndTr>
Existing trace number, assigned by means of
DISPlay:WINDow<Wnd>:TRACe<WndTr>:FEED. This suffix is ignored if the
optional <trace_name> parameter is used.
<numeric_value>
Value and unit for the vertical diagram divisions.
Range [def. unit]
*RST value
'<trace_name>'
*RST value
SCPI, Command
Range and unit depend on the measured quantity, see Units for DISPlay...
Commands.
Depending on the measured quantity. The default reference level for an Sparameter displayed in a dB Mag diagram is 10 dB.
Optional string parameter for the trace name, e.g. 'Trc4'. If this optional
parameter is present, the trace number <WndTr> is ignored.
–
Confirmed, with query.
Operating Manual 1303.6580.32-01
355
R&S® ZVL
Command Reference
DISPlay
Types
Example:
CALC4:PAR:SDEF 'Ch4Tr1', 'S11'
Create channel 4 and a trace named Ch4Tr1 to measure the input reflection
coefficient S11.
DISP:WIND2:STAT ON
Create diagram area no. 2.
DISP:WIND2:TRAC9:FEED 'CH4TR1'
Display the generated trace in diagram area no. 2, assigning the trace number
9 to it.
DISP:WIND2:TRAC9:Y:PDIV 5
or: DISP:WIND2:TRAC:Y:PDIV 5, 'CH4TR1'
Set the value per division to 5 dB.
DISPlay[:WINDow<Wnd>]:TRACe<WndTr>:Y[:SCALe]:RLEVel <numeric_value>[,
'<trace_name>']
Sets the reference level (or reference value) for a particular displayed trace. Setting a new reference level
does not affect the value of PDIVision. The trace can be referenced either by its number <WndTr> or by
its name <trace_name>.
<Wnd>
Number of an existing diagram area (defined by means of
DISPlay:WINDow<Wnd>:STATe ON).
<WndTr>
Existing trace number, assigned by means of
DISPlay:WINDow<Wnd>:TRACe<WndTr>:FEED. This suffix is ignored if the
optional <trace_name> parameter is used.
<numeric_value>
Value and unit for the reference level (or reference value, if the trace does not
show a level).
Range [def. unit]
*RST value
'<trace_name>'
*RST value
SCPI, Command
Types
Example:
Range and unit depend on the measured quantity, see Units for DISPlay...
Commands.
Depending on the measured quantity. The default reference level for an Sparameter displayed in a dB Mag diagram is 0 dB.
Optional string parameter for the trace name, e.g. 'Trc4'. If this optional
parameter is present, the trace number <WndTr> is ignored.
–
Confirmed, with query.
CALC4:PAR:SDEF 'Ch4Tr1', 'S11'
Create channel 4 and a trace named Ch4Tr1 to measure the input reflection
coefficient S11.
DISP:WIND2:STAT ON
Create diagram area no. 2.
DISP:WIND2:TRAC9:FEED 'CH4TR1'
Display the generated trace in diagram area no. 2, assigning the trace number
Operating Manual 1303.6580.32-01
356
R&S® ZVL
Command Reference
DISPlay
9 to it.
DISP:WIND2:TRAC9:Y:RLEV -10
or: DISP:WIND2:TRAC:Y:RLEV -10, 'CH4TR1'
Change the reference level to –10 dB.
DISPlay[:WINDow<Wnd>]:TRACe<WndTr>:Y[:SCALe]:RPOSition
<numeric_value>[, '<trace_name>']
Sets the point on the y-axis to be used as the reference position as a percentage of the length of the yaxis. The reference position is the point on the y-axis which should equal the RLEVel.
<Wnd>
Number of an existing diagram area (defined by means of
DISPlay:WINDow<Wnd>:STATe ON).
<WndTr>
Existing trace number, assigned by means of
DISPlay:WINDow<Wnd>:TRACe<WndTr>:FEED. This suffix is ignored if the
optional <trace_name> parameter is used.
<numeric_value>
Value of the reference position in percent. The top of the y-axis is defined to
have a reference position of 100%, while the bottom of the y-axis is defined to
have a reference position of 0%.
Range [def. unit]
*RST value
'<trace_name>'
*RST value
SCPI, Command
Types
Example:
0 to 100 [PCT].
80 PCT.
Optional string parameter for the trace name, e.g. 'Trc4'. If this optional
parameter is present, the trace number <WndTr> is ignored.
–
Confirmed, with query.
CALC4:PAR:SDEF 'Ch4Tr1', 'S11'
Create channel 4 and a trace named Ch4Tr1 to measure the input reflection
coefficient S11.
DISP:WIND2:STAT ON
Create diagram area no. 2.
DISP:WIND2:TRAC9:FEED 'CH4TR1'
Display the generated trace in diagram area no. 2, assigning the trace number
9 to it.
DISP:WIND2:TRAC9:Y:RPOS 50
or: DISP:WIND2:TRAC:Y:RPOS 50, 'CH4TR1'
Set the reference position to the center of the diagram area.
DISPlay[:WINDow<Wnd>]:TRACe<WndTr>:Y[:SCALe]:TOP <upper_value>[,
'<trace_name>']
Sets the upper (maximum) edge of the diagram area <Wnd>.
Operating Manual 1303.6580.32-01
357
R&S® ZVL
Command Reference
DISPlay
<Wnd>
Number of an existing diagram area (defined by means of
DISPlay:WINDow<Wnd>:STATe ON).
<WndTr>
Existing trace number, assigned by means of
DISPlay:WINDow<Wnd>:TRACe<WndTr>:FEED. This suffix is ignored if the
optional <trace_name> parameter is used.
<upper_value>
Value and unit for the upper diagram edge.
Range [def. unit]
*RST value
'<trace_name>'
*RST value
SCPI, Command
Types
Example:
Range and unit depend on the measured quantity, see Units for DISPlay...
Commands.
Depending on the measured quantity. The default upper edge for a dB Mag
diagram is +20 dB.
Optional string parameter for the trace name, e.g. 'Trc4'. If this optional
parameter is present, the trace number <WndTr> is ignored.
–
Confirmed, with query.
See DISPlay:WINDow<Wnd>:TRACe<WndTr>:Y[:SCALe]:BOTTom
Units for DISPlay... Commands
The DISPlay... subsystem contains commands to define particular points in the diagram, e.g. to set the
scale or a reference value. This requires the entry of a numeric value and a physical unit, depending on
the parameter type displayed. The following table lists the physical units accepted by the analyzer.
Power
Voltage
Phase
Group delay
Impedance
Admittance
Inductance
Capacitance
Dimensionless
DBM, DB, DBW, W, MW, UW, NW, PW
V, MV, UV, NV, PV, DBV, DBMV, DBUV
DEG, KDEG, MDEG, UDEG, NDEG, PDEG
S, MS, US, NS, PS
OHM, GOHM, MOHM, KOHM
SIE, MSIE, USIE, NSIE
H, MH, UH, NH, PH, FH
F, MF, UF, NF, PF, FF
UNIT, MUNIT, UUNIT, NUNIT, PUNIT, FUNIT
WINDow
This subsystem controls the selection and presentation of graphical and trace information on the screen.
Operating Manual 1303.6580.32-01
358
R&S® ZVL
Command Reference
DISPlay
Note: Traces are generally identified by a string parameter defining the trace name (e.g.
CALCulate<Ch>:PARameter:SELect <Trace_Name>). In the DISPlay... subsystem, traces
are assigned to diagram areas (DISPlay:WINDow<Wnd>:TRACe<WndTr>:FEED
<Trace_Name>). While this assignment is valid, the trace is identified by the numeric suffix
<WndTr> and the trace name is not needed.
DISPlay:ANNotation:FREQuency[:STATe] <Boolean>
Shows or hides all frequency stimulus values in the diagrams.
ON | OFF - Show or hide stimulus values.
<Boolean>
*RST value
SCPI, Command
Types
Example:
ON
Confirmed, command or query
*RST; DISP:ANN:FREQ OFF
Create diagram area no. 1 (with default trace) and hide the frequency
stimulus values.
DISPlay:CMAP<Element>:MARKer[:STATe] <Boolean>
Displays all markers with the same color or display each marker with the color of the associated trace. The
colors of all display elements are defined via DISPlay:CMAP<Element>:RGB <red>, <green>,
<blue>,....
<Element>
Numeric suffix, not used in this command. Implemented for compatibility with
DISPlay:CMAP<Element>:RGB.
<Boolean>
ON – All markers have the same color, to be defined via DISPlay:CMAP6:RGB
<red>, <green>, <blue>. The marker color is independent of the trace
colors.
OFF - Each marker has the color of the associated trace.
*RST value
SCPI,
Command
Types
Example:
*RST does not affect the color settings; see also description of the Preset
command.
Device-specific, command or query
See DISPlay:CMAP<Element>:RGB.
DISPlay:CMAP<Element>:RGB <red>, <green>, <blue> [,<trace_style>,
<trace_width>]
Defines the color of all display elements based on the Red/Green/Blue color model.
<Element>
Number of the display element. The display elements corresponding to the
numbers 1 to 28 are listed below.
Operating Manual 1303.6580.32-01
359
R&S® ZVL
Command Reference
DISPlay
<red>
<green>
<blue>
Range [def. unit]
Red, green, and blue content of the defined color.
<trace_style>
Optional trace style, only for traces (<Element> > 12): One of the string
parameters SOLid | DASHed | DOTTed | DDOTted | DDDotted.
Optional trace width, only for traces (<Element> > 12).
1 to 20 [–]
*RST does not affect the color settings; see also description of the Preset
command.
<trace_width>
Range [def. unit]
*RST values
0 (zero intensity, corresponding to a 0 in the 24-bit color model) to 1 (full
intensity, corresponding to 255 in the 24-bit color model) [–]
SCPI, Command
Types
Confirmed (with device-specific numeric suffix and parameters), command or
query. The query returns three values between 0 and one, separated by
commas, corresponding to the red, green, and blue color content.
Example:
*RST; DISP:CMAP:MARK ON; CALC:MARK ON
Create diagram area no. 1 (with default trace showing the S-parameter S21) and
a marker Mkr 1.
CALC:PAR:SDEF 'TRC2', 'S11'; DISP:WIND:TRAC2:FEED 'TRC2'
Create a new trace named TRC2 and display the trace in diagram area no. 1.
Note that the new trace automatically becomes the active trace.
CALC:MARK2 ON
Assign a marker Mkr 2 to the trace. Both markers are displayed with the same
color.
DISP:CMAP13:RGB 1,0,0; DISP:CMAP14:RGB 0,1,0
Color the first trace red, the second trace green.
DISP:CMAP6:RGB?
Query the marker color. The marker color depends on the settings made in
previous sessions; it is not reset. A possible response is 0,0,0 for black markers.
DISP:CMAP:MARK OFF
Change the marker colors: Mkr 1 turns red, Mkr 2 turns green.
The numeric suffixes <Element> denote the following display elements:
<Element>
Display Element
1
Background
2
Text
3
Selected Text
4
Grid
5
Reference Line
Operating Manual 1303.6580.32-01
360
R&S® ZVL
Command Reference
DISPlay
6
Same Color for all Markers
7
Horizontal Line / Vertical Range Lines
8
Diagram Title
9
Limit Fail Trace Color
10
Limit Line Type Off
11
Limit Line Type Upper
12
Limit Line Type Lower
13
Trace 1
14
Trace 2
15
Trace 3
16
Trace 4
17
Trace 5
18
Trace 6
19
Trace 7
20
Trace 8
21
Trace 9
22
Trace 10
23
Trace 11
24
Trace 12
25
Trace 13
26
Trace 14
27
Trace 15
Operating Manual 1303.6580.32-01
361
R&S® ZVL
Command Reference
DISPlay
28
Trace 16
DISPlay:CMAP<Element>:TRACe:COLor[:STATe] <Boolean>
Defines the trace color schemes in different diagram areas.
<Element>
Numeric suffix, not used in this command. Implemented for compatibility with
DISPlay:CMAP<Element>:RGB.
<Boolean>
OFF – Independent color scheme in new diagram area. Moved traces change
their color.
ON – Color scheme in new diagram area continues the previous color scheme.
Moved traces keep their color.
*RST value
SCPI, Command
Types
Example:
*RST does not affect the color settings; see also description of the Preset
command.
Device-specific, command or query
*RST; DISP:CMAP13:RGB 1,0,0
Create diagram area no. 1 (with default trace showing the S-parameter S21) and
color the trace red.
DISP:CMAP:TRAC:COL OFF; DISP:WIND2:STAT ON
Select independent color schemes for new diagram areas. Create a new
diagram area no. 2.
CALC:PAR:SDEF 'TRC2', 'S11'; DISP:WIND2:TRAC2:FEED 'TRC2'
Create a new trace named TRC2 and display the trace in a new diagram area
no. 2. The new trace is red like the first trace.
DISP:CMAP:TRAC:COL ON; DISP:WIND3:STAT ON
Continue the same color scheme in new diagram areas. Create a new diagram
area no. 3.
CALC:PAR:SDEF 'TRC3', 'S22'; DISP:WIND3:TRAC3:FEED 'TRC3'
Create a new trace named TRC3 and display the trace in a new diagram area
no. 3. The new trace is not red.
DISPlay:MENU:KEY:EXECute '<menu_key>'
Executes the function of a key with a specified name and switches to the local screen.
You can use this command to execute part of your measurement task manually; see
Combining Manual and Remote Control. Menu keys that initiate events are executed
immediately,
because
no
additional
input
is
necessary.
However,
DISPlay:MENU:KEY:EXECute can be used as well for manual entries in numeric entry
bars, dialogs or wizards.
Operating Manual 1303.6580.32-01
362
R&S® ZVL
Command Reference
DISPlay
'<menu_key>'
*RST value
Name of the key as shown in the analyzer's softkey bar (case-sensitive string
variable, may contain blanks but no dots). If the name is not unique, the complete
menu path can be specified, e.g. 'Trace:Format:Phase'. Menus, submenus and
menu function must be separated by colons.
–
Device-specific, no query
SCPI,
Command
Types
Example:
*RST; DISP:MENU:KEY:EXEC 'S11'; EXEC 'Trace:Format:Phase'
Assign the S-parameter S11 to the default trace, open the local analyzer screen,
then display the phase of the measured quantity. The commands are executed
immediately without any manual entry.
DISP:MENU:KEY:EXEC 'Start'
Open the numeric input bar for the start frequency of the sweep. The frequency
can be entered manually.
DISP:MENU:KEY:EXEC 'About Nwa'
Display information about your network analyzer and the firmware version. The
info box is closed when you click the analyzer screen or if you send another
command.
DISPlay:MENU:KEY:SELect '<menu_key>'
Activates the menu or submenu of the specified key.
Name of the key as shown in the analyzer's softkey bar (case-sensitive
string variable).
'<menu_key>'
*RST value
–
Device-specific, no query
SCPI, Command
Types
Example:
*RST; DISP:MENU:KEY:SEL 'S11'
Open the Trace – Meas menu in order to select a measured quantity.
DISPlay[:WINDow<Wnd>]:MAXimize <Boolean>
Maximizes all diagram areas in the active setup or restores the previous display configuration.
<Wnd>
Number of the diagram area to become the active diagram area.
DISPlay:WINDow<Wnd>:MAXimize acts on all diagrams of the current setup,
however, the diagram no. <Wnd> is displayed on top of the others.
<Boolean>
ON | OFF - Maximize all diagram areas or restore the previous display
configuration.
*RST value
OFF
Operating Manual 1303.6580.32-01
363
R&S® ZVL
Command Reference
DISPlay
SCPI,
Command
Types
Example:
Device-specific, command or query (returns whether or not the diagrams are
maximized).
*RST; DISP:WIND2:STAT ON
Create diagram areas no. 1 (with default trace) and 2 (with no trace).
DISP:WIND2:MAXimize ON
Maximize the diagram areas, placing area no. 2 on top.
DISPlay[:WINDow<Wnd>]:STATe <Boolean>
Creates or deletes a diagram area, identified by its area number <Wnd>.
<Wnd>
Number of the diagram area to be created or deleted.
<Boolean>
ON | OFF - Creates or deletes diagram area no. <Wnd>.
*RST value
–
SCPI, Command
Types
Device-specific, command or query (returns whether or not a particular
diagram area exists).
Example:
CALC4:PAR:SDEF 'Ch4Tr1', 'S11'
Create channel 4 and a trace named Ch4Tr1 to measure the input reflection
coefficient S11.
DISP:WIND2:STAT ON
Create diagram area no. 2.
DISP:WIND2:TRAC9:FEED 'CH4TR1'
Display the generated trace in diagram area no. 2, assigning the trace
number 9 to it.
DISPlay[:WINDow<Wnd>]:TITLe:DATA '<string>'
Defines a title for diagram area <Wnd>.
<Wnd>
Number of the diagram area.
'<string>'
String variable for the title. The length of the title is practically unlimited but
should be kept short enough to be displayed in the diagrams.
*RST value
SCPI, Command
Types
Example:
''
Device-specific, command or query
*RST; :DISP:WIND:TITL:DATA 'S21 Test Diagram'
Define a title for the default diagram area. The title is displayed below the top of
the diagram area.
DISP:WIND:TITL OFF; TITL:DATA?
Operating Manual 1303.6580.32-01
364
R&S® ZVL
Command Reference
DISPlay
Hide the title. The title is no longer displayed but still defined so it can be
displayed again.
DISPlay[:WINDow<Wnd>]:TITLe[:STATe] <Boolean>
Displays
or
hides
the
title
for
DISPlay:WINDow<Wnd>:TITLe:DATA.
area
number
<Wnd>,
<Wnd>
Number of the diagram area.
<Boolean>
ON | OFF - Displays or hides the title.
*RST value
defined
by
means
of
ON
SCPI, Command Types
Device-specific, command or query
Example:
See DISPlay:WINDow<Wnd>:TITLe:DATA.
DISPlay[:WINDow<Wnd>]:TRACe<WndTr>:DELete
Releases the assignment between a trace and a diagram area, as defined by means of
DISPlay:WINDow<Wnd>:TRACe<WndTr>:FEED <Trace_Name> and expressed by the <WndTr>
suffix. The trace itself is not deleted; this must be done via CALCulate<Ch>:PARameter:DELete
<Trace_Name>.
<Wnd>
Number of an existing diagram area (defined by means of
DISPlay:WINDow<Wnd>:STATe ON).
<WndTr>
Trace number used to distinguish the traces of the same diagram area <Wnd>.
*RST value
SCPI, Command
Types
Example:
–
Device-specific, no query.
CALC4:PAR:SDEF 'Ch4Tr1', 'S11'
Create channel 4 and a trace named Ch4Tr1 to measure the input reflection
coefficient S11.
DISP:WIND2:STAT ON
Create diagram area no. 2.
DISP:WIND2:TRAC9:FEED 'CH4TR1'
Display the generated trace in diagram area no. 2, assigning the trace number 9
to it.
DISP:WIND2:TRAC9:DELete
Release the assignment between trace no. 9 and window no. 2. The trace can
still be referenced with its trace name Ch4Tr1.
Operating Manual 1303.6580.32-01
365
R&S® ZVL
Command Reference
DISPlay
DISPlay[:WINDow<Wnd>]:TRACe<WndTr>:FEED '<trace_name>'
Assigns an existing trace (CALCulate<Ch>:PARameter:SDEFine <Trace_Name>) to a diagram area,
using the <WndTr> suffix, and displays the trace.
A trace can be assigned to a diagram only once. If a attempt is made to assign the same
trace a second time (e.g. by typing DISP:WIND2:TRAC8:FEED 'CH4TR1' after executing
the program example below) an error message –114,"Header suffix out of range is
generated.
You can open the trace manager (DISPlay:MENU:KEY:EXECute 'Trace Manager') to
obtain an overview of all channels and traces, including the traces that are not displayed.
<Wnd>
Number of an existing diagram area (defined by means of
DISPlay:WINDow<Wnd>:STATe ON).
<WndTr>
Trace number used to distinguish the traces of the same diagram area
<Wnd>.
'<trace_name>'
String parameter for the trace name, e.g. 'Trc4'.
*RST value
SCPI, Command
Types
Example:
–
Device-specific, no query.
CALC4:PAR:SDEF 'Ch4Tr1', 'S11'
Create channel 4 and a trace named Ch4Tr1 to measure the input reflection
coefficient S11.
DISP:WIND2:STAT ON
Create diagram area no. 2.
DISP:WIND2:TRAC9:FEED 'CH4TR1'
Display the generated trace in diagram area no. 2, assigning the trace
number 9 to it.
DISPlay[:WINDow<Wnd>]:TRACe<WndTr>:X:OFFSet <numeric_value>
Shifts the trace <WndTr> in horizontal direction, leaving the positions of all markers unchanged.
<Wnd>
Number of an existing diagram area (defined by means of
DISPlay:WINDow<Wnd>:STATe ON).
<WndTr>
Existing trace number, assigned by means of
DISPlay:WINDow<Wnd>:TRACe<WndTr>:FEED.
<numeric_value>
Stimulus offset value.
Range [def. unit]
*RST value
SCPI, Command
Types
–1000 GHz to +1000 GHz [Hz, for frequency sweeps]. The range and unit
depends on the sweep type ([SENSe<Ch>:]SWEep:TYPE).
0.
Device-specific, with query.
Operating Manual 1303.6580.32-01
366
R&S® ZVL
Command Reference
DISPlay
Example:
*RST; :DISP:WIND:TRAC:X:OFFS 1MHZ; :DISP:WIND:TRAC:Y:OFFS 10
Create the default trace and shift it horizontally by 1 MHz, vertically by 10 dB.
DISPlay[:WINDow<Wnd>]:TRACe<WndTr>:Y:OFFSet <Magnitude>[,<Phase>,
<Real>, <Imaginary>]
Modifies all points of the trace <WndTr> by means of an added and/or a multiplied complex constant. The
response values M of the trace are transformed according to:
<Wnd>
Number of an existing diagram area (defined by means of
DISPlay:WINDow<Wnd>:STATe ON).
<WndTr>
Existing trace number, assigned by means of
DISPlay:WINDow<Wnd>:TRACe<WndTr>:FEED.
<Magnitude>
Range [def. unit]
*RST value
Multiplied magnitude factor
–300 dB to + 300 dB [dB]
0 dB
<Phase>
Range [def. unit]
*RST value
Multiplied phase factor, optional for setting command but returned by query
–3.4*1038 deg to +3.4*1038 deg [deg]
0 deg
<Real>,
<Imaginary>
Real and imaginary part of added complex constant, optional for setting
command but returned by query
Range [def. unit]
*RST value
SCPI, Command
Types
Example:
–3.4*1038 to +3.4*1038 [–]
0.
Device-specific, with query.
*RST; :DISP:WIND:TRAC:X:OFFS 1MHZ; :DISP:WIND:TRAC:Y:OFFS 10
Create the default trace and shift it horizontally by 1 MHz, vertically by 10 dB.
DISP:WIND:TRAC:Y:OFFS?
Query all response offset values. The response is 10,0,0,0.
DISPlay[:WINDow<Wnd>]:TRACe<WndTr>:Y[:SCALe]:AUTO ONCE[,
'<trace_name>']
Displays the entire trace in the diagram area, leaving an appropriate display margin. The trace can be
referenced either by its number <WndTr> or by its name <trace_name>.
<Wnd>
Number of an existing diagram area (defined by means of
DISPlay:WINDow<Wnd>:STATe ON).
<WndTr>
Existing trace number, assigned by means of
DISPlay:WINDow<Wnd>:TRACe<WndTr>:FEED. This suffix is ignored if the
Operating Manual 1303.6580.32-01
367
R&S® ZVL
Command Reference
DISPlay
optional <trace_name> parameter is used.
ONCE
Activate the autoscale function.
'<trace_name>'
Optional string parameter for the trace name, e.g. 'Trc4'. If this optional
parameter is present, the trace number <WndTr> is ignored.
–
*RST value
SCPI, Command
Types
Example:
Confirmed, no query.
*RST; DISP:WIND:TRAC:Y:PDIV?; RLEV?
Query the value between two grid graticules and the reference value for the
default trace. The response is 10;0.
DISP:WIND:TRAC:Y:AUTO ONCE; PDIV?; RLEV?
or: DISP:WIND:TRAC:Y:AUTO ONCE, 'Trc1'; PDIV?; RLEV?
Autoscale the default trace and query the scaling parameters again. In general
both values have changed.
DISPlay[:WINDow<Wnd>]:TRACe<WndTr>:Y[:SCALe]:BOTTom <lower_value>[,
'<trace_name>']
Sets the lower (minimum) edge of the diagram area <Wnd>.
<Wnd>
Number of an existing diagram area (defined by means of
DISPlay:WINDow<Wnd>:STATe ON).
<WndTr>
Existing trace number, assigned by means of
DISPlay:WINDow<Wnd>:TRACe<WndTr>:FEED. This suffix is ignored if the
optional <trace_name> parameter is used.
<lower_value>
Value and unit for the lower diagram edge.
Range [def. unit]
*RST value
'<trace_name>'
*RST value
SCPI, Command
Types
Example:
Range and unit depend on the measured quantity, see Units for DISPlay...
Commands.
Depending on the measured quantity. The default lower edge for a dB Mag
diagram is –80 dB.
Optional string parameter for the trace name, e.g. 'Trc4'. If this optional
parameter is present, the trace number <WndTr> is ignored.
–
Confirmed, with query.
CALC4:PAR:SDEF 'Ch4Tr1', 'S11'
Create channel 4 and a trace named Ch4Tr1 to measure the input reflection
coefficient S11.
DISP:WIND2:STAT ON
Create diagram area no. 2.
DISP:WIND2:TRAC9:FEED 'CH4TR1'
Display the generated trace in diagram area no. 2, assigning the trace number 9
Operating Manual 1303.6580.32-01
368
R&S® ZVL
Command Reference
DISPlay
to it.
DISP:WIND2:TRAC9:Y:BOTT -40; TOP 10
or: DISP:WIND2:TRAC:Y:BOTT -40, 'CH4TR1'; TOP 10, 'CH4TR1'
Scale the diagram between -40 dB and +10 dB.
DISPlay[:WINDow<Wnd>]:TRACe<WndTr>:Y[:SCALe]:PDIVision
<numeric_value>[, '<trace_name>']
Sets the value between two grid graticules (value “per division”) for the diagram area <Wnd>. When a new
PDIVision value is entered, the current RLEVel is kept the same, while the top and bottom scaling is
adjusted for the new PDIVision value.
<Wnd>
Number of an existing diagram area (defined by means of
DISPlay:WINDow<Wnd>:STATe ON).
<WndTr>
Existing trace number, assigned by means of
DISPlay:WINDow<Wnd>:TRACe<WndTr>:FEED. This suffix is ignored if the
optional <trace_name> parameter is used.
<numeric_value>
Value and unit for the vertical diagram divisions.
Range [def. unit]
*RST value
'<trace_name>'
*RST value
SCPI, Command
Types
Example:
Range and unit depend on the measured quantity, see Units for DISPlay...
Commands.
Depending on the measured quantity. The default reference level for an Sparameter displayed in a dB Mag diagram is 10 dB.
Optional string parameter for the trace name, e.g. 'Trc4'. If this optional
parameter is present, the trace number <WndTr> is ignored.
–
Confirmed, with query.
CALC4:PAR:SDEF 'Ch4Tr1', 'S11'
Create channel 4 and a trace named Ch4Tr1 to measure the input reflection
coefficient S11.
DISP:WIND2:STAT ON
Create diagram area no. 2.
DISP:WIND2:TRAC9:FEED 'CH4TR1'
Display the generated trace in diagram area no. 2, assigning the trace number
9 to it.
DISP:WIND2:TRAC9:Y:PDIV 5
or: DISP:WIND2:TRAC:Y:PDIV 5, 'CH4TR1'
Set the value per division to 5 dB.
Operating Manual 1303.6580.32-01
369
R&S® ZVL
Command Reference
DISPlay
DISPlay[:WINDow<Wnd>]:TRACe<WndTr>:Y[:SCALe]:RLEVel <numeric_value>[,
'<trace_name>']
Sets the reference level (or reference value) for a particular displayed trace. Setting a new reference level
does not affect the value of PDIVision. The trace can be referenced either by its number <WndTr> or by
its name <trace_name>.
<Wnd>
Number of an existing diagram area (defined by means of
DISPlay:WINDow<Wnd>:STATe ON).
<WndTr>
Existing trace number, assigned by means of
DISPlay:WINDow<Wnd>:TRACe<WndTr>:FEED. This suffix is ignored if the
optional <trace_name> parameter is used.
<numeric_value>
Value and unit for the reference level (or reference value, if the trace does not
show a level).
Range [def. unit]
*RST value
'<trace_name>'
*RST value
SCPI, Command
Types
Example:
Range and unit depend on the measured quantity, see Units for DISPlay...
Commands.
Depending on the measured quantity. The default reference level for an Sparameter displayed in a dB Mag diagram is 0 dB.
Optional string parameter for the trace name, e.g. 'Trc4'. If this optional
parameter is present, the trace number <WndTr> is ignored.
–
Confirmed, with query.
CALC4:PAR:SDEF 'Ch4Tr1', 'S11'
Create channel 4 and a trace named Ch4Tr1 to measure the input reflection
coefficient S11.
DISP:WIND2:STAT ON
Create diagram area no. 2.
DISP:WIND2:TRAC9:FEED 'CH4TR1'
Display the generated trace in diagram area no. 2, assigning the trace number
9 to it.
DISP:WIND2:TRAC9:Y:RLEV -10
or: DISP:WIND2:TRAC:Y:RLEV -10, 'CH4TR1'
Change the reference level to –10 dB.
DISPlay[:WINDow<Wnd>]:TRACe<WndTr>:Y[:SCALe]:RPOSition
<numeric_value>[, '<trace_name>']
Sets the point on the y-axis to be used as the reference position as a percentage of the length of the yaxis. The reference position is the point on the y-axis which should equal the RLEVel.
<Wnd>
Number of an existing diagram area (defined by means of
DISPlay:WINDow<Wnd>:STATe ON).
<WndTr>
Existing trace number, assigned by means of
DISPlay:WINDow<Wnd>:TRACe<WndTr>:FEED. This suffix is ignored if the
Operating Manual 1303.6580.32-01
370
R&S® ZVL
Command Reference
DISPlay
optional <trace_name> parameter is used.
<numeric_value>
Range [def. unit]
*RST value
'<trace_name>'
*RST value
SCPI, Command
Types
Example:
Value of the reference position in percent. The top of the y-axis is defined to
have a reference position of 100%, while the bottom of the y-axis is defined to
have a reference position of 0%.
0 to 100 [PCT].
80 PCT.
Optional string parameter for the trace name, e.g. 'Trc4'. If this optional
parameter is present, the trace number <WndTr> is ignored.
–
Confirmed, with query.
CALC4:PAR:SDEF 'Ch4Tr1', 'S11'
Create channel 4 and a trace named Ch4Tr1 to measure the input reflection
coefficient S11.
DISP:WIND2:STAT ON
Create diagram area no. 2.
DISP:WIND2:TRAC9:FEED 'CH4TR1'
Display the generated trace in diagram area no. 2, assigning the trace number
9 to it.
DISP:WIND2:TRAC9:Y:RPOS 50
or: DISP:WIND2:TRAC:Y:RPOS 50, 'CH4TR1'
Set the reference position to the center of the diagram area.
DISPlay[:WINDow<Wnd>]:TRACe<WndTr>:Y[:SCALe]:TOP <upper_value>[,
'<trace_name>']
Sets the upper (maximum) edge of the diagram area <Wnd>.
<Wnd>
Number of an existing diagram area (defined by means of
DISPlay:WINDow<Wnd>:STATe ON).
<WndTr>
Existing trace number, assigned by means of
DISPlay:WINDow<Wnd>:TRACe<WndTr>:FEED. This suffix is ignored if the
optional <trace_name> parameter is used.
<upper_value>
Value and unit for the upper diagram edge.
Range [def. unit]
*RST value
'<trace_name>'
*RST value
SCPI, Command
Types
Range and unit depend on the measured quantity, see Units for DISPlay...
Commands.
Depending on the measured quantity. The default upper edge for a dB Mag
diagram is +20 dB.
Optional string parameter for the trace name, e.g. 'Trc4'. If this optional
parameter is present, the trace number <WndTr> is ignored.
–
Confirmed, with query.
Operating Manual 1303.6580.32-01
371
R&S® ZVL
Command Reference
FORMat
Example:
See DISPlay:WINDow<Wnd>:TRACe<WndTr>:Y[:SCALe]:BOTTom
Units for DISPlay... Commands
The DISPlay... subsystem contains commands to define particular points in the diagram, e.g. to set the
scale or a reference value. This requires the entry of a numeric value and a physical unit, depending on
the parameter type displayed. The following table lists the physical units accepted by the analyzer.
Power
DBM, DB, DBW, W, MW, UW, NW, PW
Voltage
V, MV, UV, NV, PV, DBV, DBMV, DBUV
Phase
DEG, KDEG, MDEG, UDEG, NDEG, PDEG
Group delay
S, MS, US, NS, PS
Impedance
OHM, GOHM, MOHM, KOHM
Admittance
SIE, MSIE, USIE, NSIE
Inductance
H, MH, UH, NH, PH, FH
Capacitance
F, MF, UF, NF, PF, FF
Dimensionless
UNIT, MUNIT, UUNIT, NUNIT, PUNIT, FUNIT
FORMat
FORMat...
This subsystem sets a data format for transferring numeric and array information from and to the analyzer.
FORMat:BORDer NORMal | SWAPped
Controls whether binary data is transferred in normal or swapped byte order.
Parameters
*RST value
SCPI, Command
Types
Example:
SWAPped – The least significant bit is transferred first (little endian)
NORMal – The most significant bit is transferred first (big endian)
SWAPpped (if the GPIB Language is set to PNA or HP xxxx, then the order
is NORMal)
Confirmed, command or query
FORM:BORD NORM
Change the bit order to normal mode.
Operating Manual 1303.6580.32-01
372
R&S® ZVL
Command Reference
FORMat
FORMat[:DATA] ASCii | REAL [,<length>]
Selects the format for numeric data transferred to and from the analyzer.
The format setting is only valid for commands and queries whose description states that the
response is formatted as described by FORMat[:DATA]. In particular, it affects trace data
transferred by means of the commands in the TRACe:... system.
ASCII
Numeric data is transferred as ASCII bytes. The numbers are separated by commas
as specified in IEEE 488.2.
REAL
Data is transferred in a definite length block as IEEE floating point numbers of the
specified <length>. See block data format.
If binary data is transferred to the analyzer, the receive terminator should be
set to EOI (SYSTem:COMMunicate:GPIB[:SELF]:RTERminator EOI) to
avoid inadvertent interruption of the data transfer.
<length>
*RST value
The optional <length> parameter is needed for REAL format only. It defines the length
of the floating point numbers in bits. Valid values are 32 and 64.
ASCII. The default length of REAL data is 32 bits (single precision).
Confirmed, command or query
SCPI,
Command
Types
Example:
FORM REAL, 32
Select real data format.
SYST:COMM:GPIB:RTER EOI
Set the terminator to EOI.
(During a calibration) ... CORR:CDAT? 'REFLTRACK',1,0
Query a system error correction term. The data is transferred in a definite length block
which can be written to a file; the analyzer displays the message <no_of_bytes> bytes
binary data received.
FORMat:DEXPort:SOURce FDATa | SDATa | MDATa
Defines
the
format
for
traces
TRACe[:DATA][:RESPonse][:ALL]?
retrieved
with
the
ZVR-compatible
command
This command is not relevant for results read with the CALCulate:DATA... commands.
Parameters
Range [def. unit]
See list of parameters below.
Depending on the measured parameter and format. The unit is the default unit of
the measured parameter; see CALCulate<Ch>:PARameter:SDEFine.
Operating Manual 1303.6580.32-01
373
R&S® ZVL
Command Reference
FORMat
*RST value
SCPI,
Command
Types
Example:
SDATa
Device-specific, command or query.
See TRACe[:DATA][:RESPonse][:ALL]?
The following parameters are related to trace data (see also Data Flow diagram):
FDATa Formatted trace data, according to the selected trace format (CALCulate<Chn>:FORMat). 1 value per trace point for
Cartesian diagrams, 2 values for polar diagrams.
SDATa Unformatted trace data: Real and imaginary part of each measurement point. 2 values per trace point irrespective of the
selected trace format. The trace mathematics is not taken into account.
MDATa Unformatted trace data (see SDATa) after evaluation of the trace mathematics.
Operating Manual 1303.6580.32-01
374
R&S® ZVL
Command Reference
INITiate
INITiate
INITiate<Ch>...
This subsystem control the initiation of the trigger system and defines the scope of the triggered
measurement.
INITiate<Ch>:CONTinuous <Boolean>
Qualifies whether the analyzer measures in single sweep or in continuous sweep mode.
<Ch>
Channel number. The channel is ignored because the command affects all
channels.
<Boolean>
ON - The analyzer measures continuously, repeating the current sweep.
OFF - The measurement is stopped after the number of sweeps defined via
[SENSe<Ch>:]SWEep:COUNt. INITiate<Ch>[:IMMediate] initiates a new
measurement cycle.
ON
*RST value
Confirmed, command or query
SCPI,
Command
Types
Example:
*RST; INIT:CONT OFF
Activate single sweep mode for all channels (including channel no. 2 created
later).
INIT:SCOP SING
State that a single sweep will be performed in the active channel only.
CALC2:PAR:SDEF 'TRC2','S11'; INIT2
Create channel no. 2 with a new trace and start a single sweep in channel no. 2.
INITiate<Ch>[:IMMediate]
Starts a new single sweep sequence. This command is available in single sweep mode only
(INITiate<Ch>:CONTinuous OFF). The data of the last sweep (or previous sweeps, see Sweep History)
can be read using CALCulate<Ch>:DATA:NSWeep? SDATa, <history_count>.
In contrast to all other commands of the analyzer, INITiate<Ch>[:IMMediate] has been
implemented for overlapped execution; see Command Synchronization.
<Ch>
*RST value
SCPI,
Channel number. If the channel number does not exist the analyzer returns an error
message. If INITiate<Ch>[:IMMediate]:SCOPe ALL is active, this suffix is
ignored.
–
Confirmed, no query
Operating Manual 1303.6580.32-01
375
R&S® ZVL
Command Reference
INPut
Command
Types
Example:
See INITiate<Ch>:CONTinuous
INPut
INPut...
This subsystem controls the characteristics of the analyzer’s input ports.
INPut<port_no>:ATTenuation <numeric_value>
Sets the attenuation for the received waves.
Note: INPut<port_no>:ATTenuation is not channel-specific; the value is valid for all channels. Use
[SENSe<Ch>:]POWer:ATTenuation to set or query a channel-specific attenuation value.
Test port number of the analyzer, 1 or 2. If unspecified the numeric suffix is
<port_no>
set to 1.
Attenuation factor for the received wave.
<numeric_value>
Range [def. unit]
0 dB to 30 dB. UP and DOWN increment/decrement the attenuation in 5 dB
steps. The analyzer rounds any entered value below the maximum attenuation
to the closest step.
*RST value
0 dB
SCPI, Command
Types
Confirmed, no query (query can not return channel-specific settings, would be
misleading).
Example:
INP2:ATT 10
Set the step attenuator for the wave received at port 2 and for all channels to
10 dB. The waves at the other test ports are not affected.
SENS1:POW:ATT? BREC
Query the receiver step attenuator setting at port 2 and for channel no. 1. The
response is 10.
Operating Manual 1303.6580.32-01
376
R&S® ZVL
Command Reference
INSTrument
INSTrument
INSTrument...
This subsystem identifies and selects particular resources (SCPI: logical instruments) of the analyzer.
INSTrument:NSELect <Ch>
Selects a channel <Ch> as the active channel.
<Ch>
Range [def. unit]
*RST value
Number of the channel to be activated. The channel must be created before
using CONFigure:CHANnel<Ch>:STATe ON.
1, 2, ... [–]
1
Confirmed, command or query. If all channels have been deleted
CONFigure:CHANnel<Ch>:STATe OFF the query returns 0.
SCPI,
Command
Types
Example:
CONF:CHAN2:STAT ON; INST:NSEL?
Create channel no. 2 and select it as the active channel.
The query returns 2.
INSTrument:PORT:COUNt?
Returns the number of test ports of the analyzer.
Response
Range [def. unit]
*RST value
Number of ports (integer number).
2
–
SCPI, Command Types
Device-specific, query only.
Example:
INST:PORT:COUN?
Return the number of test ports. The response is 2.
INSTrument[:SELect] CHANNEL1 | CHANNEL2 | CHANNEL3 | CHANNEL4
Selects a channel <Ch> as active channel.
To select a channel number > 4 use the generalized command INSTrument:NSELect
<Ch>.
Parameters
Range [def. unit]
Number of the channel to be activated. The channel must be created before
using CONFigure:CHANnel<Ch>:STATe ON.
CHANNEL1, CHANNEL2, CHANNEL3, CHANNEL4 [–]
Operating Manual 1303.6580.32-01
377
R&S® ZVL
Command Reference
MEMory
*RST value
CHANNEL1
SCPI, Command
Types
Confirmed, command or query. If all channels have been deleted
(CONFigure:CHANnel<Ch>:STATe OFF) the query returns CHANNEL0.
Example:
CONF:CHAN2:STAT ON; INST CHANNEL2
Create channel no. 2 and select it as the active channel.
MEMory
MEMory...
The MEMory system controls the loaded setups of the analyzer.
The MEMory... command don't affect any stored files. Use the MEMory... commands to store
and load data and to manage files stored on a mass storage device.
MEMory:CATalog?
Returns the names of all loaded setups.
Response
*RST value
Comma-separated list of all setups.
'Set1' (the default setup is created after each *RST).
SCPI, Command
Types
Example:
Confirmed (with device-specific response), query only.
*RST; MEM:DEF 'SETUP_2'
Create a setup named 'Setup_2' and make it the active
setup.
MEM:CAT?
Query all setups. The response is 'Set1,Setup_2'.
MMEM:STOR:STAT
1, 'C:\Rohde&Schwarz\NWA\RecallSets\Setup_2.nwa'; MEM:DEL
'Setup_2.nwa'
Store the active setup Setup_2 to a file, renaming it Setup_2.nwa. Close the
setup.
MEMory:DEFine '<setup_name>'
Creates a new setup <setup_name> using default settings for the traces, channels and diagram areas.
The created setup becomes the active setup.
'<setup_name>'
String parameter to specify the name of the created setup.
Operating Manual 1303.6580.32-01
378
R&S® ZVL
Command Reference
MEMory
*RST value
–
SCPI, Command Types
Device-specific, no query.
Example:
See MEM:CAT?.
MEMory:DELete[:NAME] '<file_name>'
Closes the specified setup.
'<setup_name>'
*RST value
String parameter to specify the name of the setup to be closed.
–
SCPI, Command Types
Confirmed, no query.
Example:
See MEM:CAT?.
MEMory:SELect '<setup_name>'
Selects a setup as the active setup.
'<setup_name>'
*RST value
String parameter to specify the setup.
–
SCPI, Command
Types
Example:
Device-specific, no query.
*RST; MEM:DEF 'SETUP_2'
Create a setup named 'Setup_2' and make it the active
setup.
MEM:SEL 'Set1'
Activate the default setup Set1.
MMEM:STOR:STAT
1, 'C:\Rohde&Schwarz\NWA\RecallSets\Set1.nwa'; MEM:DEL
'Set1.nwa'
Store the active setup Set1 to a file, renaming it Set1.nwa. Close the setup.
Operating Manual 1303.6580.32-01
379
R&S® ZVL
Command Reference
MMEMory
MMEMory
MMEMory...
The MMEMory system provides mass storage capabilities for the analyzer.
Internal and external mass storage
The mass storage of the analyzer may be internal or external. The internal mass storage device can be
any section of the internal hard disk (mapped to drive C:\). The external mass storage device can be a
floppy disk inserted into the drive at the front panel of the instrument, which is mapped to drive a:\ (see
MMEMory:MSIS), a USB memory stick connected to one of the USB ports (mapped to any free drive
letter) or a network connection.
File and directory names
The <file_name> and <directory_name> parameters are strings. Some commands use a fixed directory;
for others the <file_name> can contain the complete path including the drive name and all subdirectories,
e.g. 'C:\TEMP\TRASH\test.txt' for the file named test.txt in the TEMP\TRASH subdirectory of the internal
hard disk drive C:\. If no complete path is specified, the file location is relative to the current directory
(queried with MMEMory:CDIRectory?). The file name itself may contain the period as a separator for
extensions.
File and directory names can be chosen according to Windows™ conventions; the restrictions placed on
file names known from DOS systems do not apply. All letters and numbers are allowed, as well as the
special characters "_", "^", "$", "~", "!", "#", "%", "&", "-", "{", "}", "(", ")", "@" and "`". Reserved file names
are CON, AUX, COM1, ..., COM4, LPT1, ..., LPT3, NUL and PRN.
The use of wildcards ? and * is not allowed.
MMEMory:AKAL:FACTory:CONVersion '<directory_name>'
Converts
the
calibration
data
of
the
standards
in
the
active
calibration
unit
(SYSTem:COMMunicate:RDEVice:AKAL:ADDRess) to Touchstone format and copies it to the specified
directory.
'<directory_name>'
*RST value
String parameter to specify the directory.
–
SCPI, Command
Types
Example:
Device-specific, command or query (returns the current directory).
MMEM:AKAL:FACTory:CONVersion 'C:\AKAL\Touchstone'
Convert and copy the calibration data of the standards
to the specified directory.
MMEMory:CATalog? [<directory_name>]
Returns the contents of the current or of a specified directory.
Operating Manual 1303.6580.32-01
380
R&S® ZVL
Command Reference
MMEMory
Use MMEMory:CATalog:ALL? to query the contents of the current directory and all
subdirectories.
'<directory_name>'
String parameter to specify the directory. If the directory is omitted, the
command queries the contents of the current directory, to be queried with
MMEMory:CDIRectory?
Response
Directory information in the following format:
<used_size>,<free_disk_space> {,<file_name>,,<file_size>}
*RST value
SCPI, Command
Types
Example:
The first two numeric parameters denote the total amount of storage currently
used in the directory and the total amount of storage available, both
expressed in bytes. All files are returned with their file name and their size in
bytes.
–
Confirmed, query only.
MMEM:CAT?
Response:
2056878, 809734144, zvl_quickstart.pdf, , 2056878,
MMEMory:CATalog:ALL? [<directory_name>]
Returns the contents of the current or of a specified directory and all subdirectories.
Use MMEMory:CATalog? to query the contents of the current directory.
'<directory_name>'
String parameter to specify the directory. If the directory is omitted, the
command queries the contents of the current directory, to be queried with
MMEMory:CDIRectory?
Response
Directory information in the following format:
Directory of <Dir_name>, <used_size>, <free_disk_space>
{, <Subdir>, <DIR>,}{,<file_name>,,<file_size>},
Directory of <Subdir_name_1>,
<used_size>,<free_disk_space> {, <Subdir>,
<DIR>,}{,<file_name>,,<file_size>},
Directory of <Subdir_name_2>,
<used_size>,<free_disk_space> ...
*RST value
SCPI, Command
Types
Example:
The first line is omitted if the current directory contains no subdirectories. The
following lines are analogous to the output of MMEMory:CATalog?.
–
Confirmed, query only.
MMEM:CAT:ALL?
Response:
Directory of C:\Rohde&Schwarz\Nwa\DOC\,
809734144, zvl_quickstart.pdf, , 2056878,
Operating Manual 1303.6580.32-01
2056878,
381
R&S® ZVL
Command Reference
MMEMory
MMEMory:CDIRectory '<directory_name>'
Changes the default directory for mass memory storage.
'<directory_name>'
*RST value
String parameter to specify the directory.
– (A *RST does not change the current directory)
SCPI, Command
Types
Example:
Confirmed, command or query (returns the current directory).
MMEM:CDIR 'C:\Documents and
Settings\NetworkService\Application Data'
Change to the specified directory.
MMEMory:COPY '<file_source>','<file_destination>'
Copies an existing file to a new file.
'<file_source>',
'<file_destination>'
*RST value
String parameters to specify the name of the file to be copied and the
name of the new file.
–
SCPI, Command Types
Confirmed, no query.
Example:
MMEM:COPY 'C:\USER\DATA\SETUP.CFG','A:'
Copy file Setup.cfg in directory C:\USER\DATA to the
external storage medium, mapped to drive A:\.
MMEMory:DATA '<file_name>', <data>
Loads <data> into the file <file_name>.
'<file_name>'
String parameter to specify the name of the file.
<data>
Data in 488.2 block data format. The delimiter EOI must be selected to achieve
correct data transfer.
–
*RST value
SCPI, Command
Types
Confirmed, with query. The query form is MMEMory:DATA? <file_name> with
the response being the associated <data> in block format.
Example:
MMEM:DATA? 'C:\TEMP\TEST01.HCP'
Query the block data contained in file TEST01.HCP.
Operating Manual 1303.6580.32-01
382
R&S® ZVL
Command Reference
MMEMory
MMEMory:DELete '<file_name>'
Removes a file from the specified directory.
String parameter to specify the name and directory of the file to be
removed.
'<file_name>'
*RST value
–
Confirmed, no query.
SCPI, Command
Types
Example:
MMEM:DEL 'C:\TEMP\TEST01.HCP'
Remove TEST01.HCP from the current directory.
MMEMory:DELete:CORRection <file_name>'
Deletes a system error correction data set stored in the cal pool (cal group file).
'<file_name>'
*RST value
SCPI,
Command
Types
Example:
String parameter to specify the name of the cal group file to be deleted. Cal group
files must have the extension *.cal. The directory path must not be specified; the
analyzer always uses the default cal pool directory
C:\Rohde&Schwarz\NWA\Calibration\Data.
–
Device-specific, no query.
See
MMEMory:LOAD:CORRection
MMEMory:LOAD:CKIT '<file_name>'
Loads cal kit data from a specified NWA cal kit file.
'<file_name>'
String parameter to specify the name and directory of the cal kit file to be loaded. If
no path is specified the analyzer searches the current directory, to be queried with
MMEMory:CDIRectory?.
Note: The loaded file must be a NWA-specific cal kit file with the extension *.calkit.
ZVR cal kit files can be imported using the
[SENSe<Ch>:]CORRection:CKIT:INSTall command. Agilent cal kit
files can be imported manually and converted into *.calkit files.
*RST value
SCPI,
Command
Types
Example:
–
Device-specific, no query.
MMEM:LOAD:CKIT
'C:\Rohde&Schwarz\NWA\Calibration\Kits\New_kit.calkit'
Load the previously created cal kit file New_kit.calkit from
Operating Manual 1303.6580.32-01
383
R&S® ZVL
Command Reference
MMEMory
the default cal kit directory.
... :MMEM:STOR:CKIT 'New_kit',
'C:\Rohde&Schwarz\NWA\Calibration\Kits\New_kit.calkit'
Store the data for the user-defined cal
overwrite the cal kit file New_kit.calkit.
kit
Newkit
and
MMEMory:LOAD:CKIT:SDATa '<conn_name>', '<ckit_name>', MMTHrough |
MFTHrough | FFTHrough | MMLine | MFLine | FFLine | MMATten | MFATten |
FFATten | MMSNetwork | MFSNetwork | FFSNetwork | MOPen | FOPen | MSHort |
FSHort | MOSHort | FOSHort | MREFlect | FREFlect | MMTCh | FMTCh | MSMatch |
FSMatch, '<stdlabel_name>', '<file_name>' [,<port1_no>][,<port2_no>]
Loads cal kit data for a specific connector type, cal kit, and calibration standard from a specified
Touchstone file, assigning a label for the cal data. A restriction on the port assignment may be defined in
addition.
'<conn_name>'
String parameters containing the name of the connector type.
'<ckit_name>'
String parameters containing the name of a calibration kit available on the
analyzer.
Parameters
Standard type; for a description refer to the table of standard types.
'<stdlabel_name>'
String parameter defining a label for the cal kit data. An empty string means
that no label is defined.
'<file_name>'
String parameter to specify the name and directory of the Touchstone file to be
loaded. A *.s1p file must be used for one-port standards, a *.s2p file for twoport standards. If no path is specified the analyzer searches the current
directory, to be queried with MMEMory:CDIRectory?.
<port1_no>,
<port2_no>
Port assignment: One port number for one-port standards, two port number for
two-port standards. If the port numbers are omitted, the cal kit data is valid for
all ports.
*RST value
SCPI, Command
Types
Example:
–
Device-specific, no query.
MMEM:LOAD:CKIT:SDAT 'N 50 Ohm','Default Kit',MOPEN,'Test
data','test.s1p',1
Load the file Test.s1p from the current directory in order
to define the properties of an Open (m) standard in the
cal kit named Default Kit for the N 50 Ω connector type.
Assign the label Test data and specify that the data
standard data is only valid for port no. 1.
Connector and cal kit naming conventions
Connector and calibration kit names must be entered as string parameters. The strings contain the
Operating Manual 1303.6580.32-01
384
R&S® ZVL
Command Reference
MMEMory
connector and cal kit names used in the Calibration Kits dialog; a Ω in the name must be replaced by
'Ohm', e.g.:
•
'NewKit1' denotes the user-defined calibration kit NewKit1.
•
'N 50 Ohm Ideal Kit' denotes the N 50 Ω Dummy Kit.
•
'ZV-Z21 typical' denotes the cal kit ZV-Z21 typical.
MMEMory:LOAD:CMAP '<file_name>'
Loads a color scheme from a specified NWA color scheme file.
'<file_name>'
*RST value
SCPI,
Command
Types
Example:
String parameter to specify the name and directory of the cal kit file to be loaded.
The default extension (manual control) for color scheme files is *.ColorScheme,
although other extensions are allowed.
–
Device-specific, no query.
MMEM:LOAD:CMAP
'C:\Rohde&Schwarz\NWA\ColorSchemes\Test.ColorScheme'
Load
the
previously
created
color
scheme
file
Test.ColorScheme from the default color scheme directory.
DISP:CMAP13:RGB 1,0,0; DISP:CMAP14:RGB 0,1,0
Color the first trace red, the second trace green.
MMEM:STOR:CMAP
'C:\Rohde&Schwarz\NWA\ColorSchemes\Test.ColorScheme'
Store the data for the user-defined cal
overwrite the cal kit file New_kit.calkit.
kit
Newkit
and
MMEMory:LOAD:CORRection <Ch>,'<file_name>'
Applies a system error correction data set stored in the cal pool (cal group file) to channel no. <Ch>.
<Ch>
Channel number of an existing channel
<file_name>
String parameter to specify the name of the cal group file to be loaded. Cal group
files must have the extension *.cal. The directory path must not be specified; the
analyzer always uses the default cal pool directory
C:\Rohde&Schwarz\NWA\Calibration\Data.
*RST value
SCPI,
Command
Types
Example:
–
Device-specific, no query.
MMEM:STOR:CORR 1,'Calgroup1.cal'
Copy the current correction data set of channel 1 to a cal
Operating Manual 1303.6580.32-01
385
R&S® ZVL
Command Reference
MMEMory
group file Calgroup1.cal.
CONF:CHAN2:STAT ON; :MMEM:LOAD:CORR 2,'Calgroup1.cal'
Apply the stored correction data to channel 2.
MMEM:LOAD:CORR:RES 2,'Calgroup1.cal'
Undo the previous action: Resolve the link, causing channel 2
to use its previous correction data.
MMEM:DEL:CORR 'Calgroup1.cal'
Delete the created cal group file.
MMEMory:LOAD:CORRection:RESolve <Ch>[,'<file_name>']
Resolves the link between channel <Ch> and the correction data set (cal group file) so that the channel
uses its previous correction data.
<Ch>
Channel number
'<file_name>'
Optional string parameter to specify the name of the cal group file. Cal group files
must have the extension *.cal. The directory path must not be specified.
If there is no link between <Ch> and the specified file, the command has no
effect. If no file is specified, the command resolves any link between <Ch> and
an arbitrary cal group file.
*RST value
SCPI, Command
Types
Example:
–
Device-specific, no query.
See MMEMory:LOAD:CORRection
MMEMory:LOAD:LIMit '<trc_name>','<file_name>'[,'<param_name>', <x_offset>,
<y_offset>, <type>]
Loads a limit line definition from a specified file and assigns it to a trace with a specified name. Limit lines
are created using the CALCulate<Chn>:LIMit... commands.
Limit lines can be loaded from Touchstone files (*.s<n>p, where <n> denotes the number of
ports). The optional parameters '<param_name>', <x_offset>, <y_offset>, <type> are only
relevant for Touchstone files. For *.limit files, no optional parameters can be set.
'<trc_name>'
*RST value
'<file_name>'
Name of an existing trace in the active setup (string parameter). The imported
limit line is assigned to this trace, irrespective of the trace information in the limit
line file.
–
String parameter to specify the name and directory of the limit line file to be
loaded. The default extension (manual control) for limit line files is *.limit,
although other extensions are allowed. If no path is specified the analyzer
searches the current directory, to be queried with MMEMory:CDIRectory?. See
Operating Manual 1303.6580.32-01
386
R&S® ZVL
Command Reference
MMEMory
*RST value
'<param_name>'
*RST value
<x_offset>
Range [def. unit]
*RST value
<y_offset>
Range [def. unit]
*RST value
<type>
*RST value
SCPI, Command
Types
Example:
also note on Touchstone files above.
–
String parameter, selects an S-parameter from a Touchstone file. The parameter
must be compatible with the file type (e.g. for one-port Touchstone files *.s1p,
only the parameter name 'S11' is allowed).
'S11' (if all optional parameters are omitted)
Stimulus offset for limit lines loaded from a Touchstone file. A 1 GHz offset shifts
the limit line by 1 GHz in (positive) horizontal direction.
Depending on the sweep range of the analyzer. [The default units for frequency,
power and time sweeps are Hz, dB and s, respectively.]
0
Response offset for limit lines loaded from a Touchstone file. A 1 dB offset shifts
the limit line by 1 dB in (positive) vertical direction.
Depending on the measured quantity. [dB]
0
Limit line type :
LMAX – upper limit line
LMIN – lower limit line
OFF – limit line off
LMAX (if all optional parameters are omitted)
Device-specific, no query.
Assume that the current setup contains two traces named
Trc1 and Trc2, respectively, and that limit lines have been
defined for Trc1.
MMEM:STOR:LIM 'TRC1',
'C:\Rohde&Schwarz\NWA\LIMitLines\Lim_Trc1.limit'
Store the limit line definition of Trc1 to a limit line
file.
MMEM:LOAD:LIM 'TRC2',
'C:\Rohde&Schwarz\NWA\LIMitLines\Lim_Trc1.limit'
Load the previously created limit line file and assign the
limit lines to Trc2.
MMEM:STOR:TRAC 'TRC1',
'C:\Rohde&Schwarz\NWA\LIMitLines\Trc1.s1p'
Store the current trace data of Trc1 to a limit line file
in Touchstone format.
MMEM:LOAD:LIM 'TRC1',
'C:\Rohde&Schwarz\NWA\LIMitLines\Trc1.s1p', 'S11', 0, 2,
LMAX
Load the previously created Touchstone limit line file and
assign the limit lines to Trc1, applying a response offset
of 2 dB.
CALC:LIMit:DISPlay ON
Operating Manual 1303.6580.32-01
387
R&S® ZVL
Command Reference
MMEMory
Show the limit line in the diagram.
MMEMory:LOAD:SEGMent <Ch>,'<file_name>'
Loads a sweep segment definition from a specified file and assigns it to a specified channel. Sweep
segments are defined using the [SENSe<Ch>:]SEGMent<Seg>... commands.
<Ch>
Channel number.
'<file_name>'
String parameter to specify the name and directory of the sweep segment file to be
loaded. The default extension (manual control) for sweep segment files is *.seglist,
although other extensions are allowed. If no path is specified the analyzer searches
the current directory, to be queried with MMEMory:CDIRectory?.
*RST value
SCPI,
Command
Types
Example:
–
Device-specific, no query.
Assume that the current setup contains two channels numbered 1
and 2, respectively, and that sweep segments have been defined
for channel no. 1.
:MMEM:STOR:SEGM 1,
'C:\Rohde&Schwarz\NWA\SweepSegments\Seg_Ch1.seglist'
Store the sweep segment definition of channel 1 to a sweep
segment file.
MMEM:LOAD:SEGM 2,
'C:\Rohde&Schwarz\NWA\SweepSegments\Seg_Ch1.seglist'
Load the previously created sweep segment file and use the
sweep segments for channel 2.
MMEMory:LOAD:STATe <numeric_value>,'<file_name>'
Loads configuration data from a specified setup file and sets the analyzer to the corresponding instrument
state.
<numeric_value>
1 (the <numeric_value> is used for compatibility with the SCPI standard but is
ignored).
<file_name>
String parameter to specify the name and directory of the setup file to be loaded.
The default extension (manual control) for setup files is *.nwa, although other
extensions are allowed. If no path is specified the analyzer searches the current
directory, to be queried with MMEMory:CDIRectory?.
*RST value
SCPI, Command
Types
–
Confirmed, no query.
Operating Manual 1303.6580.32-01
388
R&S® ZVL
Command Reference
MMEMory
Example:
MMEM:STOR:STAT
1,'C:\Rohde&Schwarz\NWA\RecallSets\Setup_0413.nwa'
Store the current setup configuration in the file
Setup_0413.NWA in the default directory for setup files.
MMEM:LOAD:STAT
1,'C:\Rohde&Schwarz\NWA\RecallSets\Setup_0413.nwa'
Load the settings stored in Setup_0413.NWA.
MMEMory:LOAD:TRACe '<trc_name>','<file_name>'[,'<parameter_name>']
Loads trace data from a specified trace file and assigns it to a trace with a specified name. Traces are
created using the CALCulate<Ch>:PARameter:SDEFine... command.
'<trc_name>'
Name of an existing data trace in the active setup (string parameter). The
trace data is loaded into a memory trace associated with the specified data
trace. If one or more memory traces are already associated with the
specified data trace, the last generated memory trace is overwritten.
'<file_name>'
String parameter to specify the name and directory of the trace file to be
loaded. Several file formats for trace files are supported. If no path is
specified the analyzer searches the current directory, to be queried with
MMEMory:CDIRectory?.
The file extensions *.s<n>p, *.csv, and *.dat for Touchstone, ASCII, and
Matlab files are mandatory.
'<parameter_name>'
Optional string parameter for imported Touchstone files for more than one
port (*.s2p, *.s3p, *.s4p), denotes the imported S-parameter ('S11', 'S12', ...).
If nothing is specified, the first trace in the specified file is imported.
–
*RST value
SCPI, Command
Types
Example:
Confirmed, no query.
Assume that the current setup contains a trace named
Trc1.
MMEM:STOR:TRAC 'TRC1',
'C:\Rohde&Schwarz\NWA\Traces\Trc1.s1p'
Store the current trace data of Trc1 to a trace file.
MMEM:LOAD:TRAC 'TRC1',
'C:\Rohde&Schwarz\NWA\Traces\Trc1.s1p'
Load the previously created trace
memory trace assigned to Trc1.
CALC:PAR:DEF:SGR
file
and
create
a
1,2
Create four traces to measure the two-port S-parameters S11, S12, S21, S22.
The traces are not displayed.
MMEM:STOR:TRAC 'TRC1',
'C:\Rohde&Schwarz\NWA\Traces\Trc1.s2p'
Store
Operating Manual 1303.6580.32-01
the
four
S-parameter
traces
to
a
two-port
389
R&S® ZVL
Command Reference
MMEMory
Touchstone file.
MMEM:LOAD:TRAC 'TRC1',
'C:\Rohde&Schwarz\NWA\Traces\Trc1.s2p'
Load
the
previously
created
Touchstone
file
and
overwrite the previously generated memory trace assigned
to Trc1 with the S11 trace.
MMEMory:MDIRectory '<directory_name>'
Creates a new subdirectory for mass memory storage in an existing directory.
'<directory_name>'
*RST value
SCPI, Command
Types
Example:
String parameter to specify the new directory. Either the full path or a
subdirectory for the current directory (see MMEMory:CDIRectory).
–
Device-specific, no query.
MMEM:MDIR 'C:\Documents and Settings\New_Directory'
Create the specified directory. The parent directory
'C:\Documents and Settings' must have been created
before.
MMEM:MDIR 'C:\Documents and
Settings\New_Directory\New_Subdirectory'
Create an additional subdirectory.
MMEM:CDIR 'C:'; MDIR 'New_Rootdirectory'
Create an additional directory C:\New Rootdirectory.
MMEMory:MOVE '<file_source>','<file_destination>'
Copies an existing file to a new file.
'<file_source>',
'<file_destination>'
*RST value
String parameters to specify the name of the file to be copied and the
name of the new file.
–
SCPI, Command Types
Confirmed, no query.
Example:
MMEM:COPY 'C:\USER\DATA\SETUP.CFG','A:'
Copy file Setup.cfg in directory C:\USER\DATA to the
external storage medium, mapped to drive A:\.
Operating Manual 1303.6580.32-01
390
R&S® ZVL
Command Reference
MMEMory
MMEMory:NAME '<file_name>'
Defines a name for a file which can be used to store the printer output. The file is created when it is
selected as a printer destination (HCOPy:DESTination 'MMEM').
'<file_name>'
*RST value
SCPI,
Command
Types
Example:
String parameter to specify the file name. The supported file formats are *.wmf,
*.ewmf, *.bmp, *.png; see command HCOPy:DEVice:LANGuage. The specified
directory must exist, otherwise no file can be generated. If no path is specified the
analyzer uses the current directory, to be queried with MMEMory:CDIRectory?.
'Hardcopy'
Device-specific, with query.
MMEM:NAME 'C:\Screenshots\PLOT1.BMP'
Define a printer file name, to be stored in the existing
directory C:\Screenshots (without creating the file).
HCOP:DEST 'MMEM'; HCOP
Select 'Print to file' and create the printer file specified
before.
MMEMory:RDIRectory '<directory_name>'
Removes an existing directory from the mass memory storage system.
'<directory_name>'
*RST value
String parameter to specify the directory.
–
SCPI, Command
Types
Example:
Device-specific, no query.
MMEM:RDIR 'C:\Documents and
Settings\NetworkService\Application Data'
Removes the specified directory.
MMEMory:STORe:CKIT '<kit_name>', '<file_name>'
Stores the data of a calibration kit to a specified file.
'<kit_name>'
Name of a user-defined calibration kit available on the analyzer.
It is not possible to modify or store predefined or ideal kits.
'<file_name>'
*RST value
String parameter to specify the name and directory of the cal kit file to be created.
The file is a NWA-specific cal kit file with the extension *.calkit. If no path is specified
the analyzer uses the current directory, to be queried with
MMEMory:CDIRectory?.
–
Operating Manual 1303.6580.32-01
391
R&S® ZVL
Command Reference
MMEMory
SCPI,
Command
Types
Example:
Device-specific, no query.
MMEM:LOAD:CKIT
'C:\Rohde&Schwarz\NWA\Calibration\Kits\New_kit.calkit'
Load the previously created cal kit file New_kit.calkit from
the default cal kit directory.
... :MMEM:STOR:CKIT 'New_kit',
'C:\Rohde&Schwarz\NWA\Calibration\Kits\New_kit.calkit'
Store the data for the user-defined cal
overwrite the cal kit file New_kit.calkit.
kit
Newkit
and
MMEMory:STORe:CMAP '<file_name>'
Stores a color scheme to a specified NWA color scheme file.
'<file_name>'
*RST value
SCPI,
Command
Types
Example:
String parameter to specify the name and directory of the color scheme file to be
created. If no path is specified the analyzer uses the current directory, to be
queried with MMEMory:CDIRectory?. The default extension (manual control) for
color scheme files is *.ColorScheme, although other extensions are allowed.
–
Device-specific, no query.
See MMEMory:LOAD:CMAP
MMEMory:STORe:CORRection <Ch>,'<file_name>'
Copies the correction data of channel <Ch> to the cal pool, generating a new correction data file (cal
group). The file has the extension *.calkit and is stored in the C:\Rohde&Schwarz\NWA\Calibration\Data
directory.
<Ch>
Channel number
'<file_name>'
String parameter to specify the name of the created cal group file. The directory
path must not be specified; the analyzer always uses the default cal pool directory
C:\Rohde&Schwarz\NWA\Calibration\Data.
*RST value
SCPI,
Command
Types
Example:
–
Device-specific, no query.
See MMEMory:LOAD:CORRection
Operating Manual 1303.6580.32-01
392
R&S® ZVL
Command Reference
MMEMory
MMEMory:STORe:LIMit '<trc_name>', '<file_name>'
Saves the limit lines associated to a specified trace to a limit line file. Limit lines are created using the
CALCulte<Chn>:LIMit... commands.
'<trc_name>'
Name of an existing trace in the active setup (string parameter) for which a limit
line definition exists.
'<file_name>'
String parameter to specify the name and directory of the created limit line file. The
default extension (manual control) for limit line files is *.limit, although other
extensions are allowed. If no path is specified the analyzer uses the current
directory, to be queried with MMEMory:CDIRectory?.
*RST value
SCPI,
Command
Types
Example:
–
Device-specific, no query.
See MMEMory:LOAD:LIMit.
MMEMory:STORe:MARKer '<file_name>'
Saves the values of all markers to a ASCII file.
'<file_name>'
*RST value
SCPI,
Command
Types
Example:
String parameter to specify the name and directory of the created ASCII file. The
default extension (manual control) for marker files is *.txt, although other extensions
are allowed. If no path is specified the analyzer uses the current directory, to be
queried with MMEMory:CDIRectory?. An example for the file contents is given
below.
–
Device-specific, no query.
*RST
Reset the analyzer,
channel no. 1.
creating
the
default
trace
no.
1
in
CALC:MARK ON; MARK:X 1GHz
Create marker no. 1 and place it to 1 GHz.
CALC:MARK2 ON; MARK2:X 2GHz
Create a second marker and place it to 2 GHz.
MMEM:STOR:MARK 'Marker.txt'
Store the marker values to an ASCII file. The file contains
both
marker
values:
Operating Manual 1303.6580.32-01
393
R&S® ZVL
Command Reference
MMEMory
MMEMory:STORe:SEGMent <Ch>, '<file_name>'
Saves the sweep segment definition of a specified channel to a sweep segment file. Sweep segments are
defined using the [SENSe<Ch>:]SEGMent<Seg>... commands.
<Ch>
Channel number.
'<file_name>'
String parameter to specify the name and directory of the created sweep segment
file. The default extension (manual control) for sweep segment files is *.seglist,
although other extensions are allowed. If no path is specified the analyzer uses the
current directory, to be queried with MMEMory:CDIRectory?.
*RST value
–
Device-specific, no query.
SCPI,
Command
Types
Example:
See MMEMory:LOAD:SEGMent.
MMEMory:STORe:STATe <numeric_value>,'<file_name>'
Stores the configuration data of the current setup to a specified setup file.
MMEMory:STORe:STATe renames the current setup, appending a .nwa extension. See example for
MMEMory:LOAD:STATe.
1 (the <numeric_value> is used for compatibility with the SCPI standard but is
<numeric_value>
ignored).
'<file_name>'
*RST value
SCPI, Command
Types
Example:
String parameter to specify the name and directory of the created setup file.
The default extension (manual control) for setup files is *.nwa, although other
extensions are allowed. If no path is specified the analyzer uses the current
directory, to be queried with MMEMory:CDIRectory?.
–
Confirmed, no query.
See MMEMory:LOAD:STATe.
MMEMory:STORe:TRACe '<trc_name>','<file_name>'[,UNFormatted , COMPlex |
LINPhase | LOGPhase]
Stores the trace data of a specified trace to a trace file. Traces are created using the
CALCulte<Ch>:PARameter:SDEFine... command.
*.s<n>p Touchstone files (<n> = 1, 2, 3, ...) are intended for a complete set of <n>-port Sparameters. Data export fails if the active channel does not contain the full set of <n>2 traces.
If the necessary trace are available, '<trc_name>' can be the name of any of the traces.
'<trc_name>'
Name of an existing data trace in the active setup (string parameter).
Operating Manual 1303.6580.32-01
394
R&S® ZVL
Command Reference
OUTPut
'<file_name>'
String parameter to specify the name and directory of the created trace file.
Several file formats for trace files are supported. The file extensions *.s<n>p,
*.csv, and *.dat for Touchstone, ASCII, and Matlab files are mandatory.
To generate a multiport Touchstone file *.s2p, *.s3p..., the channel must contain
traces for the full set of S-parameters; the '<trc_name>' is ignored.
If no path is specified the analyzer uses the C:\Rohde&Schwarz\NWA\Traces
directory.
Optional
parameters
UNFormatted – Unformatted data export specified by the second optional
parameter
COMPlex – Complex values (real and imaginary part)
LINPhase – Linear magnitude and phase
LOGPhase – dB-magnitude and phase
If the second optional parameter is omitted the command stores complex data.
– (the default export format is UNFormatted)
*RST value
SCPI,
Command
Types
Example:
Confirmed, no query.
See MMEMory:LOAD:TRACe.
OUTPut
OUTPut<Pt>...
This subsystem controls the characteristics of the analyzer’s output ports.
OUTPut<Chn>:DPORt PORT1 | PORT2
Selects a source port for the stimulus signal (drive port). The setting acts on the active trace. The effect of
the drive port selection depends on the measurement parameter associated to the active trace:
•
If an S-parameter S<out><in> is measured, the second port number index <in> (input port of the DUT
= drive port of the analyzer) is set equal to the selected drive port: Drive port selection affects the
measured quantity.
•
If a wave quantity or a ratio is measured, the drive port is independent from the measured
quantity:
Note: This command is equivalent to [SENSe<Chn>:]SWEep:SRCPort.
Channel number used to identify the active trace. If unspecified the numeric
<Chn>
suffix is set to 1.
PORT1 ...
*RST value
Test port number of the analyzer, 1 to 2.
PORT1
SCPI, Command
Types
Device-specific, with query.
Operating Manual 1303.6580.32-01
395
R&S® ZVL
Command Reference
PROGram
Example:
CALC4:PAR:SDEF 'Ch4Tr1', 'A1'
Create channel 4 and a trace named Ch4Tr1 to measure the wave quantity a1.
The trace automatically becomes the active trace.
OUTP4:DPOR PORT2
Select drive port 2 for the active trace.
PROGram
PROGram...
This subsystem controls external application programs that can be run on the analyzer.
PROGram[:SELected]:EXECute '<file_name>[ <command>]'
Starts an application program or open a file using an application available on the analyzer.
'<file_name>'
Name and path of an application program to be executed or of a file to be opened.
The path can be defined as an absolute path (e.g. 'c:\...') or relative to the current
directory (MMEMory:CDIRectory). Blanks in the file name are not allowed because
everything after a blank is interpreted as a <command>.
<command>
*RST value
Command name in the selected application <file_name> (optional).
–
SCPI,
Command
Types
Example:
Confirmed, no query.
PROG:SEL:NAME
PROG
Selects general program execution on the analyzer.
MMEM:CDIR 'C:\Program Files\Rohde&Schwarz\Network Analyzer\Bin'
Go to the program directory.
PROG:EXEC 'iecwin32.exe'
Start the application iecwin32.
PROG:EXEC:WAIT
Lock command execution and manual control of the analyzer until iecwin32 is
paused or stopped.
Operating Manual 1303.6580.32-01
396
R&S® ZVL
Command Reference
PROGram
PROGram[:SELected]:NAME PROG
Selects the application to be run on the analyzer. At present, only the general parameter PROG is
available: PROGram[:SELected]:EXECute can start any program.
Use this command in order to avoid problems should the default value change in future
firmware versions.
PROG
*RST value
SCPI, Command
Types
Example:
Any program running under Windows XP or any file that can be opened with an
application program available on the analyzer.
PROG
Confirmed, command or query.
See PROGram[:SELected]:EXECute.
PROGram[:SELected]:WAIT
Locks command execution and manual control of the analyzer while a program started via
PROGram[:SELected]:EXECute is running. The analyzer does not execute any further commands or
queries until the program is stopped or paused.
Parameters
*RST value
None.
–
SCPI, Command
Types
Confirmed, command or query. The query also locks command execution; it
returns 1 when the executed program is stopped or paused.
Example:
See PROGram[:SELected]:EXECute.
Operating Manual 1303.6580.32-01
397
R&S® ZVL
Command Reference
[SENSe...]
[SENSe...]
[SENSe<Ch>:]AVERage
[SENSe<Ch>:]AVERage...
This subsystem sets sweep averaging parameters. The sweep average is a noise-reduction technique
which consists of calculating each measurement point as an average of the same measurement point over
several consecutive sweeps.
[SENSe<Ch>:]AVERage:CLEar
Starts a new average cycle, clearing all previous results and thus eliminating their effect on the new cycle.
Channel number. If unspecified the numeric suffix is set to 1.
<Ch>
*RST value
–
SCPI, Command Types
Confirmed, no query
Example:
AVER:COUN 15; AVER ON
Set the average factor for channel 1 to 15 and enable the sweep average.
AVER:COUN 5; CLE
Reduce the average factor and restart the average.
[SENSe<Ch>:]AVERage:COUNt <numeric_value>
Defines the number of consecutive sweeps to be combined for the sweep average (Average Factor).
<Ch>
Channel number.
<numeric_value>
Range [def. unit]
*RST value
Average factor
1 to 1000 [1]
10
SCPI, Command Types
Confirmed, command or query
Example:
AVER:COUN 15
Set the average factor for channel 1 to 15.
AVER ON
Enable the sweep average.
Operating Manual 1303.6580.32-01
398
R&S® ZVL
Command Reference
[SENSe...]
[SENSe<Ch>:]AVERage[:STATe] <Boolean>
Enable or disable the sweep average.
<Ch>
Channel number.
<Boolean>
ON | OFF - Enables or disables the automatic calculation of the sweep average
over the specified number of sweeps ([SENSe<Ch>:]AVERage:COUNt).
ON
*RST value
SCPI,
Command
Types
Example:
Confirmed, command or query
AVER:COUN 15
Set the average factor for channel 1 to 15.
AVER ON
Enable the sweep average over the defined number of sweeps.
[SENSe<Ch>:]BANDwidth
[SENSe<Ch>:]BANDwidth...
This subsystem sets the bandwidth of the IF measurement filter (resolution bandwidth).The forms
BANDwidth and BWIDth are equivalent.
[SENSe<Ch>:]BANDwidth|BWIDth[:RESolution] <bandwidth>
Defines the resolution bandwidth of the analyzer (Meas Bandwidth).
<Ch>
Channel number. If unspecified the numeric suffix is set to 1.
<bandwidth>
Range [def. unit]
Resolution bandwidth
10 Hz to 500 kHz. UP and DOWN increment/decrement the bandwidth in 1-2-5
steps for each decade. The analyzer rounds up any entered value between these
steps and rounds down values exceeding the maximum bandwidth.
10 kHz
*RST value
SCPI,
Command
Types
Example:
Confirmed, command or query
BAND 1.1
Set a resolution bandwidth of approx. 1.1 Hz for channel 1.
BAND?
The analyzer returns the rounded bandwidth of 2 Hz.
Operating Manual 1303.6580.32-01
399
R&S® ZVL
Command Reference
[SENSe...]
[SENSe<Ch>:]CORRection
[SENSe<Ch>:]CORRection...
This subsystem controls system error correction and recording of correction data.
[SENSe<Ch>:]CORRection:CDATa 'DIRECTIVITY' | 'SRCMATCH' | 'REFLTRACK' |
'ISOLATION' | 'LOADMATCH' | 'TRANSTRACK', <port1_no>, <port2_no>
Writes or reads system error correction data for a specific channel <Ch>, calibration method
([SENSe<Ch>:]CORRection:COLLect:METHod:DEFine), and port combination <Port1_no>, <Port2_no>.
The setting command can be used to transfer user-defined correction data to the analyzer; the query
returns the current correction data set. ASCII or block data can be transferred, depending on the selected
data transfer format (FORMat[:DATA])
For an overview of calibration methods and error terms refer to section Calibration Types.
<Ch>
Channel number of the calibrated channel. If unspecified the numeric suffix is set to
1.
Error term
parameters
String parameters describing the different error terms, depending on the current
calibration method; see table below. Each term contains one complex value (real and
imaginary part) for each sweep point.
The error terms consist of dimensionless complex numbers. The parameters must be
transferred in full length and have the following meaning:
'DIRECTIVITY' – Directivity at port <port1_no>
'SRCMATCH' – Source match at port <port1_no>
'REFLTRACK' – Reflection tracking at port <port1_no>
'ISOLATION' – Isolation between port <port1_no> and <port2_no>
'LOADMATCH' – Load match at <port2_no>
'TRANSTRACK' – Transmission tracking between port <port1_no> and <port2_no>
–
The analyzer provides a default calibration corresponding to a test setup which does
not introduce any systematic errors; see
[SENSe<Ch>:]CORRection:COLLect:SAVE:SELected:DEFault.
Range [def.
unit]
*RST value
<port1_no>
Source port number.
<port2_no>
Load port number. If the error term is not related to the load port, a dummy number
can be used; e.g. CORR:CDAT 'REFLTRACK', 1, 0
SCPI,
Command
Types
Example:
Device-specific, command or query
See [SENSe<Ch>:]CORRection:COLLect:SAVE:SELected:DEFault.
The different calibration types of the analyzer provide the following error terms:
Calibration type
Parameters in
[SENSe<Ch>:]CORRection:COLLect:METHod:DEFine
Available error terms (depending
on port numbers)
One-port
REFL, RSHort
'REFLTRACK'
Operating Manual 1303.6580.32-01
400
R&S® ZVL
Command Reference
[SENSe...]
normalization
(reflection)
using an open or a
short standard
Full one port
FOPort
'DIRECTIVITY', 'SRCMATCH',
'REFLTRACK'
Two-port
normalization
FRTRans
'TRANSTRACK'
One path two port
OPTPort
'DIRECTIVITY', 'SRCMATCH',
'REFLTRACK', 'TRANSTRACK'
TOSM
TOSM
'DIRECTIVITY', 'SRCMATCH',
'REFLTRACK', 'LOADMATCH',
'TRANSTRACK'
(at present the 'ISOLATION' terms
are not included)
[SENSe:]CORRection:CKIT
[SENSe<Ch>:]CORRection:CKIT...
This subsystem controls system error correction and recording of correction data.
[SENSe<Ch>:]CORRection:CKIT:<std_type>
'<Conn_Name>','<Ckit_Name>','<Std_No>',<Min_Freq>,<Max_Freq>,<El_Length>,<
Loss>,<Z0>,<C0> , <C1>, <C2>, <C3>, <L0>, <L1>, <L2>, <L3>[, OPEN | SHORt |
MATCh, <Resistance>, <Port_1>, <Port_2>]
Defines the parameters of a non-ideal 1 port or 2-port calibration standard <std_type>. A particular
physical standard can be selected by specifying the name of the calibration kit and its serial number.
Depending on the standard type, only a subset of the parameters may be used; see table below.
<Ch>
Channel number. This suffix is ignored because calibration kits are channelindependent.
<std_type>
Standard type. For reflection standards, the first character denotes the gender, e.g.:
FOPEN, MOPEN: Open (f) or Open (m) standard.
The following reflection standards are supported: MOPen, FOPen, MSHort,
FSHort, OSHort, MOSHort, FOSHort, MMTCh, FFTCh, MREFLect,
FREFLect
For transmission standards, the first two characters denotes the genders
on both ends, e.g.:
FFSNetwork, MFSNetwork, MMSNetwork: Symm. network (ff), symm.
network (mf) or symm. network (mm) standard.
For a complete list of standard types refer to the table of standard types below.
Parameter
list
String parameters to specify the configured standard
('<Conn_Name>','<Ckit_Name>','<Std_No>') and numeric parameters defining its
properties. See detailed description below.
The following transmission standards have only 8 parameters (until <Z0>):
Operating Manual 1303.6580.32-01
401
R&S® ZVL
Command Reference
[SENSe...]
MMTHrough, MFTHrough, FFTHrough, MMLine, MFLine, FFLine
The following reflection and transmission standards have only 5 parameters
(until <Max_Freq>):
MSMatch, FSMatch, MMATten, MFATten, FFATten
*RST value
SCPI,
Command
Types
Example:
–
Device-specific, command or query (see examples below)
CORR:CKIT:FOP 'N 50 Ohm','Test Kit',...
Define the properties of the open (f) standard for a N 50 Ω connector type in cal kit
'Test
Kit'.
See
also
example
for
[SENSe<Ch>:]CORRection:CKIT:<conn_type>:<std_type>.
CORR:CKIT:FOP? 'N 50 Ohm'
Query the properties of the open (f) standard for a N 50 Ω connector type in the
active cal kit.
CORR:CKIT:FOP? 'N 50 Ohm','Test Kit'
Query the properties of the open (f) standard for a N 50 Ω connector type in cal kit
'Test Kit'.
[SENSe<Ch>:]CORRection:CKIT:<conn_type>:<std_type>
'<Ckit_Name>','<Std_No>',<Min_Freq>,<Max_Freq>,<El_Length>,<Loss>,<C0> |
<L0>,<C1> | <L1>,<C2> | <L2>,<C3> | <L3>, OPEN | SHORt
Defines the parameters of a calibration standard <std_type> for a specified connector type <conn_type>.
A particular physical standard can be selected by specifying the name of the calibration kit and its serial
number. Depending on the standard type, only a subset of the parameters may be used; see table below.
<Ch>
Channel number. This suffix is ignored because calibration kits are channelindependent.
<conn_type>
Connector type, one of the following identifiers:
N50, N75: N 50 Ω or N 75 Ω connectors
PC7, PC35, PC292: PC 7, PC 3.5 or 2.92 mm connectors
USER<no>: User-defined connectors UserConn1, UserConn2
This command only supports ZVR-compatible connector types. For general
definitions use [SENSe<Ch>:]CORRection:CKIT:<std_type>.
<std_type>
Standard type. For reflection standards, the first character denotes the gender, e.g.:
FOPEN, MOPEN: Open (f) or Open (m) standard.
For transmission standards, the first two characters denotes the genders
on both ends, e.g.:
FFTHrough, MFTHrough, MMTHrough: Through (ff), Through (mf) or
Through (mm) standard.
For a complete list of standard types refer to the table of standard types below.
Parameter list
String parameters to specify the configured standard ('<Ckit_Name>','<Std_No>')
and numeric parameters defining its properties. See detailed description below.
–
*RST value
Operating Manual 1303.6580.32-01
402
R&S® ZVL
Command Reference
[SENSe...]
SCPI,
Command
Types
Example:
Device-specific, command or query
CORR:CKIT:N50:FOPEN 'ZV-Z21','',0,1.8E+010,0.0151,0,0,0.22,-0.22,0.0022
Define the properties of the open (f) standard for the N 50 Ω connector type
contained in the ZV-Z21 calibration kit: Assign a valid frequency range of 0 Hz to 18
GHz, an electrical length of 15.1 mm, 0 dB loss and define the polynomial
coefficients of the fringing capacitance as 0 fF, 0.22 fF/GHz, –0.22 fF/(GHz)2,
0.0022 fF/(GHz)3.
The
parameters
in
the
[SENSe<Ch>:]CORRection:CKIT:<std_type>
and
[SENSe<Ch>:]CORRection:CKIT:<conn_type>:<std_type> commands have the following
meaning:
Parameter
Meaning
Comment/Unit
'<Conn_Name>'
Name of the connector type
String parameter
'<Ckit_Name>'
Name of the calibration kit
String parameter
'<Std_No>'
Label (e.g. the serial number) of the standard
String parameter
<Min_Freq>
Min. frequency for which the circuit model is valid
Default unit is Hz
<Max_Freq>
Max. frequency for which the circuit model is valid
Default unit is Hz
<El_Length>
Electrical length (offset parameter) of the standard
Default unit is m
<Loss>
Loss (offset parameter) of the standard
To
be
specified
without unit (implicit
unit is dB)
<Z0>
Reference impedance (no unit)
To
be
specified
without unit (implicit
unit is Ω)
<C0> | <L0>
Polynomial coefficients C0 or L0 for the fringing capacitance or residual
inductance of the standard (load parameter)
To
be
specified
without unit (implicit
unit is fF or pH)
<C1> | <L1>
Polynomial coefficients C1 or L1 for the fringing capacitance or residual
inductance of the standard (load parameter)
To
be
specified
without unit (implicit
unit is fF /GHz or pH
/GHz)
<C2> | <L2>
Polynomial coefficients C2 or L2 for the fringing capacitance or residual
inductance of the standard (load parameter)
To
be
specified
without unit (implicit
2
unit is fF/GHz or
2
pH/GHz )
Operating Manual 1303.6580.32-01
403
R&S® ZVL
Command Reference
[SENSe...]
<C3> | <L3>
Polynomial coefficients C3 or L3 for the fringing capacitance or residual
inductance of the standard (load parameter)
To
be
specified
without unit (implicit
3
unit is fF/GHz or
3
pH/GHz )
OPEN | SHORt |
MATCh
Simplified modelling as an open or short or match standard. The load
circuit model generally consists of capacitance C which is connected in
parallel to an inductance L and a resistance R, both connected in series.
OPEN means that R is infinite so that the standard behaves like a
capacitor (no inductance, the polynomial coefficients specify C). SHORt
means that R is zero so that the standard behaves like an inductance (no
capacitance, the polynomial coefficients specify L). MATCh means that the
standard behaves like a match with the specified <Resistance>
Character data
<Resistance>
Optional resistance for the MATCh standard
Numeric value
,
<Port_1>,
<Port_2>
Optional port restriction: one port number for one port standards, two port
numbers for two port standards
Integer value
The different standard types are defined by the following parameters:
<std_type>
Meaning
Parameters
MOPen | FOPen
Open (m) or open (f)
'<Ckit_Name>'
...
<C3>[,
<Port_1>]
complete parameter list with capacitance
coefficients, no OPEN | SHORT | MATCh
MSHort | FSHort
Short (m) or short (f)
'<Ckit_Name>'
...
<L3>[,
<Port_1>]
complete parameter list with inductance
coefficients, no OPEN | SHORT| MATCh
Offset short (sexless) or offset short (m)
or
offset
short
(f)
(for user-defined connector types only)
'<Ckit_Name>'
...
<L3>[,
<Port_1>]
complete parameter list with inductance
coefficients, no OPEN | SHORT| MATCh
MMTCh | FMTCh
Match (m) or match (f)
'<Ckit_Name>' ... <Max_Freq>[, <Port_1>]
no
offset
parameters,
no
polynomial
coefficients, no OPEN | SHORt| MATCh
MREFlect | FREFlect
Reflect (m) or reflect (f)
'<Ckit_Name>' ... OPEN | SHORt[, <Port_1>]
no loss, otherwise complete parameter list
MMTHrough | MFTHrough
| FFTHrough
Through (m - m) or through (m - f) or
through (f - f)
'<Ckit_Name>'
...
<Loss>[,
<Port_1>,
<Port_2>]
no load parameters (polynomial coefficients),
no OPEN | SHORt| MATCh
MMLIne1 | MFLIne1 |
FFLIne1 (suffix 1 optional)
Line1 (m - m) or line1 (m - f) or line1 (f f)
'<Ckit_Name>'
...
<Loss>[,
<Port_1>,
<Port_2>]
no load parameters (polynomial coefficients),
no OPEN | SHORt| MATCh
MMLIne2
FFLIne2
Line1 (m - m) or line2 (m - f) or line2 (f f)
'<Ckit_Name>'
...
<Loss>[,
<Port_1>,
<Port_2>]
no load parameters (polynomial coefficients),
OSHort |
FOSHort
MOSHort
|
MFLIne2
|
|
Operating Manual 1303.6580.32-01
404
R&S® ZVL
Command Reference
[SENSe...]
no OPEN | SHORt| MATCh
MMATten
FFATten
|
MFATten
|
Attenuation (m - m) or attenuation (m f) or attenuation (f - f)
'<Ckit_Name>' ... <Max_Freq>[, <Port_1>,
<Port_2>]
no offset parameters, no load parameters
(polynomial coefficients), no OPEN | SHORt|
MATCh
MMSNetwork
|
MFSNetwork | FFSNetwork
Symmetric network (m - m) or
symmetric network (m - f) or symmetric
network (f - f)
'<Ckit_Name>' ... OPEN | SHORt| MATCh[,
<Port_1>,
<Port_2>]
no loss, otherwise complete parameter list
[SENSe<Ch>:]CORRection:CKIT:<conn_type>:SELect '<ckit_name>'
Selects the calibration kit to be used for a specified connector type <conn_type>.
For connector types with arbitrary, user-defined names you can use the command
[SENSe<Ch>:]CORRection:CKIT:SELect '<conn_name>', '<ckit_name>'.
<Ch>
Channel number. This suffix is ignored because calibration kits are channelindependent.
<conn_type>
Connector type, one of the following identifiers:
N50, N75: N 50 Ω or N 75 Ω connectors
PC7, PC35, PC292: PC 7, PC 3.5 or 2.92 mm connectors
USER<no>: User-defined connectors UserConn1, UserConn2
'<ckit_name>'
String parameters containing the name of a calibration kit available on the
analyzer.
– (A *RST does not change the assignment between connector types and
calibration kits.)
*RST value
SCPI,
Command
Types
Example:
Device-specific, command or query
MMEM:LOAD:CKIT
'C:\Rohde&Schwarz\NWA\Calibration\Kits\New_kit.calkit'
Load the previously created cal kit file New_kit.calkit from
the default cal kit directory.
CORR:CKIT:N50:SEL
'New_kit'
Assign the imported kit to the N 50 Ω connector type (assuming that the cal kit
name stored in New_kit.calkit reads New_kit).
Cal kit naming conventions
Calibration kit names must be entered as string parameters. The string contains the cal kit name used in
the Calibration Kits dialog; a Ω in the name must be replaced by 'Ohm', e.g.:
•
'NewKit1' denotes the user-defined calibration kit NewKit1.
Operating Manual 1303.6580.32-01
405
R&S® ZVL
Command Reference
[SENSe...]
•
'N 50 Ohm Ideal Kit' denotes the N 50 Ω Ideal Kit.
•
'ZV-Z21 typical' denotes the cal kit ZV-Z21 typical.
[SENSe<Ch>:]CORRection:CKIT:SELect '<conn_name>', '<ckit_name>'
Selects the calibration kit to be used for a specified connector type <conn_type>.
The command is suitable for connector types with arbitrary, user-defined names. For
standard connector types you can use the command
[SENSe<Ch>:]CORRection:CKIT:<conn_type>:SELect.
<Ch>
Channel number. This suffix is ignored because calibration kits are channelindependent.
'<conn_name>'
Connector type, e.g. a user-defined connector type (string variable)
'<ckit_name>'
String parameters containing the name of a calibration kit available on the
analyzer.
– (A *RST does not change the assignment between connector types and
calibration kits.)
*RST value
SCPI, Command
Types
Device-specific, command or query (the query requires the first string parameter
only)
Example:
MMEM:LOAD:CKIT
'C:\Rohde&Schwarz\NWA\Calibration\Kits\New_kit.calkit'
Load the previously created cal kit file New_kit.calkit from
the default cal kit directory.
CORR:CKIT:SEL
'N 50 Ohm', 'New_kit'
Assign the imported kit to the N 50 Ω connector type (assuming that the cal kit
name stored in New_kit.calkit reads New_kit).
[SENSe<Ch>:]CORRection:CKIT:INSTall '<file_name>'
Loads cal kit data from a specified ZVR cal kit file.
<Ch>
Channel number. This suffix is ignored because calibration kits are channelindependent.
'<file_name>'
String parameter to specify the name and directory of the cal kit file to be loaded.
Note: The loaded file must be a ZVR-specific cal kit file with the extension *.ck.
NWA cal kit files (*.calkit) can be imported using the MMEMory:LOAD:CKIT
command. Agilent cal kit files can be imported manually and converted into
*.calkit files.
*RST value
SCPI,
Command
Types
Example:
–
Device-specific, no query.
CORR:CKIT:INST 'C:\Rohde&Schwarz\NWA\Calibration\Kits\ZCAN.ck'
Operating Manual 1303.6580.32-01
406
R&S® ZVL
Command Reference
[SENSe...]
Load the previously created ZVR cal kit file ZCAN.ck from the
default cal kit directory.
MMEM:STOR:CKIT 'ZCAN',
'C:\Rohde&Schwarz\NWA\Calibration\Kits\ZCAN.calkit'
Store the imported cal kit data to a NWA cal kit file
ZCAN.calkit (assuming that the cal kit name stored in ZCAN.ck
reads ZCAN).
[SENSe:]CORRection:COLLect
[SENSe<Ch>:]CORRection:COLLect...
This subsystem controls the system error correction and manages calibration kits.
[SENSe<Ch>:]CORRection:COLLect[:ACQuire] THRough | OPEN1 | OPEN2 |
OPEN12 | SHORT1 | SHORT2 | SHORT12 | MATCH1 | MATCH2 | MATCH12 | NET |
ATT | IMATCH12 | REFL1 | REFL2 | SLIDe1 | SLIDE2 | SLIDE12 | LINE1 | LINE2 |
M1O2 | O1M2 | M1S2 | S1M2 | OSHORT1 | OSHORT2
Starts a calibration measurement in order to acquire measurement data for the selected standards. The
standards are reflection or transmission standards and must be connected to port 1 or 2 of the analyzer.
Use the generalized command
[SENSe<Ch>:]CORRection:COLLect[:ACQuire]:SELected to obtain measurement
data at arbitrary analyzer ports.
<Ch>
Channel number of the calibrated channel. If unspecified the numeric suffix is set to 1.
THRough ...
OSHORT2
Standard types: Through, Open, Short, Match (MATCH12 and IMATCH12 are
synonymous), Symmetric Network (NET), Attenuation (ATT), Reflect, Sliding Match
(SLIDe), Line1 (LINE1 and LINE are synonymous), Line2, Match/Open (M1O2,
O1M2), Match/Short (M1S2, S1M2), Open/Short (OSHort).
The numbers in the parameters denote the analyzer ports. Two numbers 12 mean that
two separate calibrations are performed at ports 1 and 2.
ON
*RST value
AUTO |
<delay |
phase>
*RST value
SCPI,
Command
Types
Optional entry of delay time or phase for UTHRough standard:
AUTO – The analyzer determines the delay time or phase during the calibration sweep
<delay or phase> – entry of the delay time in ps (for non-dispersive standards) or of an
estimate of the phase at the start frequency of the sweep in deg (for dispersive
standards). If an estimate of the start phase is entered, the analyzer uses the
calculated value which is closest to the estimate.
AUTO
Confirmed (with device-specific standards), no query
Operating Manual 1303.6580.32-01
407
R&S® ZVL
Command Reference
[SENSe...]
Example:
See [SENSe<Ch>:]CORRection:COLLect:SAVE.
[SENSe<Ch>:]CORRection:COLLect[:ACQuire]:RSAVe <Boolean>
Activates or deactivates the calibration mode where the raw measurement data of the standards is stored
after the calibration is completed. The setting is valid for the current calibration, where it overwrites the
global setting ([SENSe<Ch>:]CORRection:COLLect[:ACQuire]:RSAVe:DEFault). A new
calibration deletes the calibration data acquired in previous calibrations.
<Ch>
Channel number of the calibrated channel.
<Boolean>
*RST value
ON | OFF - Keep measurement data on or off.
OFF
SCPI, Command
Types
Example:
Device-specific, command or query
CORR:COLL:RSAV:DEF ON
Generally keep the raw measurement data of the standards after the
calibration is completed.
CORR:COLL:METH:DEF 'Test',RSHort,1
Select a one-port normalization at port 1 with a short standard as calibration
type.
CORR:COLL:SEL SHOR,1
Measure a short standard connected to port 1 and store the raw measurement
results of this standard.
CORR:COLL:RSAV OFF
To save disk space, delete the current raw calibration data after the calibration
is completed.
CORR:COLL:SAVE:SEL
Calculate the system error correction data and apply them to the active
channel.
[SENSe<Ch>:]CORRection:COLLect[:ACQuire]:RSAVe:DEFault <Boolean>
Activates or deactivates the calibration mode where the raw measurement data of the standards is stored
after the calibration is completed. The setting remains valid for all subsequent calibrations until it is
changed explicitly. A new calibration deletes the calibration data acquired in previous calibrations.
Channel number of the calibrated channel.
<Ch>
<Boolean>
*RST value
ON | OFF - Keep measurement data on or off.
OFF
SCPI, Command Types
Device-specific, command or query
Example:
See [SENSe<Ch>:]CORRection:COLLect[:AQUire]:RSAVe.
Operating Manual 1303.6580.32-01
408
R&S® ZVL
Command Reference
[SENSe...]
[SENSe<Ch>:]CORRection:COLLect[:ACQuire]:SELected THRough | OPEN |
SHORt | MATCh | NET | ATT | REFL | SLIDE | LINE1 | LINE2,<port_no>,<port_no>
Starts a calibration measurement in order to acquire measurement data for the selected standards. The
standards are reflection or transmission standards and can be connected to arbitrary analyzer ports.
<Ch>
Channel number of the calibrated channel.
THRough ...
LINE2
Standard types: Through, Open, Short, Match, Symmetric Network (NET),
Attenuation (ATT), Reflect, Sliding Match (SLIDe), Line1 (LINE1 and LINE are
synonymous), Line2.
<port_no>
Port numbers of the analyzer. For a transmission standard (through, line,
attenuation, symmetric network) the input and output port numbers must be
specified, for reflection standards, only one port number is required.
–
*RST value
Optional entry of delay time or phase for UTHRough standard:
AUTO – The analyzer determines the delay time or phase during the calibration
sweep
<delay or phase> – entry of the delay time in ps (for non-dispersive standards) or of
the phase at the start frequency of the sweep in deg (for dispersive standards)
AUTO
AUTO |
<delay |
phase>
*RST value
Device-specific, no query
SCPI,
Command
Types
Example:
See [SENSe<Ch>:]CORRection:COLLect:SAVE:SELected.
[SENSe<Ch>:]CORRection:COLLect:CONNection<port_no> N50FEMALE |
N50MALE | N75FEMALE | N75MALE | PC7 | PC35FEMALE | PC35MALE |
PC292FEMALE | PC292MALE
Additional parameters (): UFEMALE1 | UMALE1 | UFEMALE2 | UMALE2
Selects a connector type at a specified port <port_no> and its gender.
Use [SENSe<Ch>:]CORRection:COLLect:SCONnection<port_no>
arbitrary connector type using a string variable.
to
select
an
<Ch>
Channel number of the calibrated channel.
<port_no>
Port numbers of the analyzer.
Note: If the analyzer is set to use the same connectors at all ports
([SENSe<Ch>:]CORRection:COLLect:CONNection<port_no>:PORTs
ALL), then a change of a connector type is valid for all ports. The gender of the
connectors can still be different.
Parameters
Connector type and gender of the connectors (omitted for query). UFEMALE1 and
UMALE1 denote the user-defined connector type UserConn1, UFEMALE2 and
UMALE2 denote the user-defined connector type UserConn2. The user-defined
connector types must be defined before being addressed by
[SENSe<Ch>:]CORRection:COLLect:CONNection<port_no>.
Operating Manual 1303.6580.32-01
409
R&S® ZVL
Command Reference
[SENSe...]
*RST value
N50FEMALE for all ports.
Device-specific, command or query.
SCPI,
Command
Types
Example:
*RST; CORR:COLL:CONN1 N75MALE; CONN4?
Change the connector type at port 1 from N50FEMALE to N75MALE. The connector
type at the other ports is also changed to N75, however, the gender (female) is
maintained. CORR:COLL:CONN4? returns N75FEMALE.
[SENSe<Ch>:]CORRection:COLLect:CONNection:PORTs ALL | SINGle
Qualifies whether the connector types at the analyzer ports (but not their gender) are equal or
independent.
In the present firmware version, a calibration must be performed using the same connector
type at all ports. Use [SENSe<Ch>:]CORRection:COLLect:CONNection<port_no>:PORTs
SINGle if you want to perform a measurement with independent port connectors.
<Ch>
Channel number of the calibrated channel.
Parameters
ALL: Equal (uniform) connector types. If the connector type at one port is
changed, the connector type at all other ports is changed accordingly.
SINGle: Independent (possibly non-uniform) connector types at the ports.
<port_no>
Port numbers of the analyzer. This parameter has no effect because the setting
affects all ports.
ALL
*RST value
SCPI, Command
Types
Example:
Device-specific, command or query.
CORR:COLL:CONN:PORTS SING
Select independent connector types at the ports.
CORR:COLL:CONN1 N50MALE; CONN4 N75FEMALE; CONN2?
Select independent connector types at ports 1 and 4. The connector type at port
2 is not changed; the query returns N50FEMALE.
[SENSe<Ch>:]CORRection:COLLect:DELete ['<cal_name>']
Deletes system error correction data generated and stored previously.
<Ch>
Channel number of the calibrated channel.
'<cal_name>'
Name of the calibration (string parameter) defined together with calibration type
[SENSe<Ch>:]CORRection:COLLect:METHod:DEFine. If nothing is specified
the analyzer deletes the last system error correction stored by means of
[SENSe<Ch>:]CORRection:COLLect:SAVE.
–
*RST value
Operating Manual 1303.6580.32-01
410
R&S® ZVL
Command Reference
[SENSe...]
Device-specific, no query
SCPI,
Command
Types
Example:
CORR:COLL:METH:DEF 'Test',RSHort,1
Select a one-port normalization at port 1 with a short standard as calibration type.
CORR:COLL:SEL SHOR,1
Measure a short standard connected to port 1 and store the measurement results of
this standard.
CORR:COLL:SAVE; DEL
Calculate the system error correction data and apply them to the active channel,
then delete the data.
[SENSe<Ch>:]CORRection:COLLect:METHod FRTRans | TOSM | FOPort1 |
FOPort2 | FOPort12 | FOPTport | ROPTport | REFL1 | REFL2 | REFL12 | TPORt
Selects a one-port or two-port calibration type at ports 1/2.
Use the generalized command [SENSe<Ch>:]CORRection:COLLect:METHod:DEFine to
select the calibration type for arbitrary analyzer ports or a multiport calibration type.
<Ch>
Channel number of the calibrated channel.
Parameters
Calibration types: TOSM, Full One Port, One Path Two Port, Normalization
(REFL1, REFL2 and REFL12 for one-port, TPORT for two-port), T.
The numbers in the parameters denote the analyzer ports. Parameters for two-port
calibration types contain no numbers because the command is only valid for ports
1 and 2.
–
*RST value
SCPI,
Command
Types
Example:
Confirmed (with device-specific calibration types), command or query. If several
calibration types are assigned to channel <Ch>, the query returns a list of all
calibration types.
See [SENSe<Ch>:]CORRection:COLLect:SAVE.
[SENSe<Ch>:]CORRection:COLLect:METHod:DEFine '<cal_name>', REFL |
RSHort | FOPort | FRTRans | OPTPort | TOSM, <port_no>[,<port_no>]
Selects a one-port or two-port calibration type at arbitrary analyzer ports.
<Ch>
Channel number of the calibrated channel.
'<cal_name>'
Name of the calibration (string parameter). The name serves as a reference to
delete a particular set of system correction data
([SENSe<Ch>:]CORRection:COLLect:DELete).
Parameters
Calibration types: One-port Normalization (reflection), using an open (REFL) or a
short (RSHort) standard, Full One Port, Two-port Normalization (transmission,
FRTRans), One Path Two Port, TOSM, .
<port_no>
Port numbers of the analyzer. For an n-port calibration type (n = 1 to 2), n port
Operating Manual 1303.6580.32-01
411
R&S® ZVL
Command Reference
[SENSe...]
*RST value
SCPI,
Command
Types
Example:
numbers must be specified. If more than n numbers are defined, the spare
numbers (the last ones in the list) are ignored. Entering less than n numbers
causes an error message.
–
Device-specific, no query. Use [SENSe<Ch>:]CORRection:COLLect:METHod?
to obtain a list of all calibration types for channel <Ch>.
See [SENSe<Ch>:]CORRection:COLLect:SAVE:SELected.
[SENSe<Ch>:]CORRection:COLLect:SAVE
Calculates the system error correction data from the acquired one or two-port measurement results
([SENSe<Ch>:]CORRection:COLLect[:ACQuire]), stores them and applies them to the calibrated
channel <Ch>. To avoid incompatibilities, older system error correction data is deleted unless it has been
transferred into a cal pool (MMEMory:STORe:CORRection <Ch>, '<file_name>').
This
command
is
the
ZVR-compatible
equivalent
of
[SENSe<Ch>:]CORRection:COLLect:SAVE:SELected. It must be used in combination
with the ZVR-compatible commands for calibration method and standard selection; see
example below.
Channel number of the calibrated channel.
<Ch>
*RST value
SCPI, Command
Types
Example:
–
Confirmed, no query
CORR:COLL:METH REFL1
Select a one-port normalization at port 1 as calibration type.
CORR:COLL OPEN1
Measure an open standard connected to port 1 and store the measurement
results of this standard.
CORR:COLL:SAVE
Calculate the system error correction data and apply them to the active
channel.
[SENSe<Ch>:]CORRection:COLLect:SAVE:DEFault
Generates a set of default system error correction data for the selected ports and calibration type. The
default data set corresponds to a test setup which does not introduce any systematic errors; none of the
measurement results acquired previously ([SENSe<Ch>:]CORRection:COLLect[:ACQuire]) is
taken into account.
The main purpose of the default correction data set is to provide a dummy system error
correction which you can replace with your own, external correction data. You may have
acquired the external data in a previous session or even on an other instrument. If you want
Operating Manual 1303.6580.32-01
412
R&S® ZVL
Command Reference
[SENSe...]
to use the external correction data on the analyzer, simply generate the default data set
corresponding to your port configuration and calibration type and overwrite the default data.
For details refer to the program example below.
This command must be used in combination with the ZVR-compatible commands
[SENSe<Ch>:]CORRection:COLLect:METHod and [SENSe<Ch>:]CORRection:DATa. Use
[SENSe<Ch>:]CORRection:COLLect:SAVE:SELected:DEFault if you want to use ZVLspecific calibration commands or if you want to calibrate more than 2 ports.
Channel number of the calibrated channel.
<Ch>
*RST value
SCPI,
Command
Types
Example:
–
Device-specific, no query
CORR:COLL:METH REFL1
Select a one-port normalization at port 1 with an open standard as calibration type.
CORR:COLL:SAVE:DEF
Calculate a dummy system error correction for the normalization at port 1. The
dummy system error correction provides the reflection tracking error term
'SCORR3'.
CORR:DATA? 'SCORR3'
Query the dummy system error correction term. The response is a 1 (written as 1,0
for the real and imaginary part) for each sweep point (no attenuation and no phase
shift between the analyzer and the calibration plane).
CORR:DATA 'SCORR3',<ASCII_data>
Replace the dummy system error correction term with your own correction data,
transferred in ASCII format.
[SENSe<Ch>:]CORRection:COLLect:SAVE:SELected
Calculates the system error correction data from the acquired measurement results
([SENSe<Ch>:]CORRection:COLLect[:ACQuire]:SELected), stores them and applies them to
the calibrated channel <Ch>. To avoid incompatibilities, older system error correction data is deleted
unless it has been transferred into a cal pool (MMEMory:STORe:CORRection <Ch>,
'<file_name>').
Channel number of the calibrated channel.
<Ch>
*RST value
SCPI, Command
Types
Example:
–
Confirmed, no query
CORR:COLL:METH:DEF 'Test',RSHort,1
Select a one-port normalization at port 1 with a short standard as calibration
type.
CORR:COLL:SEL SHOR,1
Measure a short standard connected to port 1 and store the measurement
Operating Manual 1303.6580.32-01
413
R&S® ZVL
Command Reference
[SENSe...]
results of this standard.
CORR:COLL:SAVE:SEL
Calculate the system error correction data and apply them to the active
channel.
[SENSe<Ch>:]CORRection:COLLect:SAVE:SELected:DEFault
Generates a set of default system error correction data for the selected ports and calibration type. The
default data set corresponds to a test setup which does not introduce any systematic errors; none of the
measurement
results
acquired
previously
([SENSe<Ch>:]CORRection:COLLect[:ACQuire]:SELected) is taken into account.
The main purpose of the default correction data set is to provide a dummy system error
correction which you can replace with your own, external correction data. You may have
acquired the external data in a previous session or even on an other instrument. If you want
to use the external correction data on the analyzer, simply generate the default data set
corresponding to your port configuration and calibration type and overwrite the default data.
For details refer to the program example below.
<Ch>
*RST value
SCPI,
Command
Types
Example:
Channel number of the calibrated channel.
–
Device-specific, no query
CORR:COLL:METH:DEF 'Test',RSHort,1
Select a one-port normalization at port 1 with a short standard as calibration type.
CORR:COLL:SAVE:SEL:DEF
Calculate a dummy system error correction for the normalization at port 1. The
dummy system error correction provides the reflection tracking error term
'REFLTRACK'.
CORR:CDAT? 'REFLTRACK',1,0
Query the dummy system error correction term. The response is a 1 (written as 1,0
for the real and imaginary part) for each sweep point (no attenuation and no phase
shift between the analyzer and the calibration plane).
CORR:CDAT 'REFLTRACK',1,0,<ASCII_data>
Replace the dummy system error correction term with your own correction data,
transferred in ASCII format.
[SENSe<Ch>:]CORRection:COLLect:SCONnection<port_no> '<conn_name>',
MALE | FEMale
Selects a connector type at a specified port <port_no> and its gender. In contrast to
[SENSe<Ch>:]CORRection:COLLect:CONnection<port_no>, this command uses a string variable
to identify the connector type.
Operating Manual 1303.6580.32-01
414
R&S® ZVL
Command Reference
[SENSe...]
<Ch>
Channel number of the calibrated channel.
<port_no>
Port numbers of the analyzer.
Note: If the analyzer is set to use the same connectors at all ports
([SENSe<Ch>:]CORRection:COLLect:CONNection<port_no>:PORTs
ALL), then a change of a connector type is valid for all ports. The gender of the
connectors can still be different.
Parameters
Connector type (string parameter) and gender of the connectors. The gender
designation MALE | FEMale is not necessary (and ignored) for sexless connector
types.
'N 50 Ohm',FEM for all ports.
*RST value
SCPI,
Command
Types
Example:
Device-specific, command or query.
*RST; CORR:COLL:SCON1 'N 75 Ohm', MALE; SCON4?
Change the connector type at port 1 from 'N 50 Ohm', FEM to 'N 75 Ohm', MALE.
The connector type at the other ports is also changed to N 75 Ohm, however, the
gender (female) is maintained. CORR:COLL:SCON4? returns 'N 75 Ohm', FEM.
[SENSe<Ch>:]CORRection:CONNection
| NGENder, <perm_rel>, <imped>
'<conn_name>', TEM | WGUide, GENDer
Configures the user-defined connector types.
<Ch>
Channel number
'<conn_name>'
Name of the user-defined connectors, string parameter
TEM | WGUide
GENDer | NGENder
Transverse electric or waveguide type propagation mode
Polar connector type (m/f)
Sexless connector type
Relative permittivity
0.0000000001 to 1000. [–] UP/DOWN/MIN/MAX parameters are not
available for this command
–
<perm_rel>
Range [def. unit]
*RST value
<imped>
Range [def. unit]
*RST value
SCPI, Command
Types
Example:
For TEM type connectors: reference impedance in Ω (without unit),
For WGUide type connectors: cutoff frequency in Hz (without unit)
Ref. impedance: 1µΩ to 1000 MΩ
Cutoff frequency: 0 Hz to 1000 GHz
–
Device-specific, command or query
CORR:CONN 'USERCON',TEM,GEND,1.00000,50
Define a TEM type connector type names USERCON.
CORR:CONN? 'USERCON'
Query the properties of the configured connector type.
CORR:CONN:DEL 'USERCON'
Operating Manual 1303.6580.32-01
415
R&S® ZVL
Command Reference
[SENSe...]
Delete the configured connector type.
[SENSe<Ch>:]CORRection:CONNection:DELete '<conn_name>'
Deletes a user-defined connector type named '<conn_name>'.
<Ch>
Channel number
'<conn_name>'
Name of the user-defined connectors, string parameter
SCPI, Command Types
Device-specific, no query
Example:
See [SENSe<Ch>:]CORRection:CONNection
[SENSe<Ch>:]CORRection:DATA 'SCORR1' | ... | 'SCORR12'
Writes or reads system error correction data for a specific channel <Ch> and calibration method
([SENSe<Ch>:]CORRection:COLLect:METHod). The analyzer test ports 1 or 2 are implicitly specified with
the correction terms. The setting command can be used to transfer user-defined correction data to the
analyzer; the query returns the current correction data set. ASCII or block data can be transferred,
depending on the selected data transfer format (FORMat[:DATA])
Use the generalized command [SENSe<Ch>:]CORRection:COLLect:CDATa to transfer
calibration data for arbitrary analyzer ports.
<Ch>
Channel number of the calibrated channel. If unspecified the numeric suffix is set to
1.
Error term
parameters
String parameters describing the different error terms, depending on the current
calibration method; see table below. Each term contains one complex value (real and
imaginary part) for each sweep point.
The error terms consist of dimensionless complex numbers. The parameters must be
transferred in full length and have the following meaning:
'SCORR1' – Directivity at port 1
'SCORR2' – Source match at port 1
'SCORR3' – Reflection tracking at port 1
'SCORR4' – Forward isolation between port 1 and port 2
'SCORR5' – Load match at port 2
'SCORR6' – Forward transmission tracking between port 1 and port 2
'SCORR7' – Directivity at port 2
'SCORR8' – Source match at port 2
'SCORR9' – Reflection tracking at port 2
'SCORR10' – Reverse isolation between port 2 and port 1
'SCORR11' – Load match at port 1
'SCORR12' – Reverse transmission tracking between port 2 and port 1
–
The analyzer provides a default calibration corresponding to a test setup which does
not introduce any systematic errors; see
Range [def.
unit]
*RST value
Operating Manual 1303.6580.32-01
416
R&S® ZVL
Command Reference
[SENSe...]
[SENSe<Ch>:]CORRection:COLLect:SAVE:DEFault.
SCPI,
Command
Types
Example:
Device-specific, command or query
See [SENSe<Ch>:]CORRection:COLLect:SAVE:DEFault.
The different calibration types of the analyzer provide the following error terms:
Calibration type
Parameter in
[SENSe<Ch>:]CORRection:COLLect:METHod
Available error terms
(depending on port numbers)
One-port normalization
(reflection) using an open
standard
REFL1
REFL2
REFL12
'SCORR3'
'SCORR9'
'SCORR3' and 'SCORR9'
Full one port
FOPort1
FOPort2
FOPort12
'SCORR1' to 'SCORR3'
'SCORR7' to 'SCORR9'
'SCORR1' to 'SCORR3' and
'SCORR7' to 'SCORR9'
Two-port normalization
FTRans
RTRans
FRTRans
'SCORR6'
'SCORR12'
'SCORR6' and 'SCORR12'
One path two port
FOPTport
ROPTport
'SCORR1' to 'SCORR3',
'SCORR6'
'SCORR7' to 'SCORR9',
'SCORR12'
TOSM
TOSM
'SCORR1' to 'SCORR12'
(at present the isolation terms
'SCORR4' and 'SCORR10' are
not included)
[SENSe<Ch>:]CORRection:DATA:PARameter?
Returns the sweep settings of the active system error correction for channel <Ch>.
<Ch>
Channel number of the calibrated channel.
Response
Five values, corresponding to the start and stop frequency of the calibration
sweep, the number of points, the source power, and the sweep type (LIN | LOG |
SEGM).
– (the command generates an execution error if no system error correction is
active)
*RST value
SCPI,
Command
Types
Example:
Device-specific, query only
See [SENSe<Ch>:]CORRection:DATE?
[SENSe<Ch>:]CORRection:DATE?
Returns the date and time when the active system error correction data for channel <Ch> was acquired.
<Ch>
*RST value
Channel number of the calibrated channel.
– (the command generates an execution error if no system error correction is active)
Operating Manual 1303.6580.32-01
417
R&S® ZVL
Command Reference
[SENSe...]
SCPI,
Command
Types
Example:
Device-specific, query only
CORR:COLL:METH REFL1
Select a one-port normalization at port 1 as calibration type.
CORR:COLL OPEN1
Measure an open standard connected to port 1 and store the measurement results
of this standard.
CORR:COLL:SAVE
Calculate the system error correction data and apply them to the active channel.
CORR:DATE?
Query the time when the system error correction became active. The analyzer
returns the data and time, e.g. '03/20/06,18:30:39'.
CORR:DATA:PAR?
Query the sweep settings for the calibration sweep. The analyzer returns the start
and stop frequency, the number of points, source power, and the sweep type, e.g.
300000,8000000000,201,0,LIN.
CORR:SST?
Query the calibration status. The analyzer returns 'CAL OFF' (because the
performed one-port calibration is not sufficient for the measured transmission Sparamter S21).
[SENSe<Ch>:]CORRection:EDELay<port_no>:AUTO ONCE
Defines the offset parameter for the active test port such that the residual delay of the active trace (defined
as the negative derivative of the phase response) is minimized across the entire sweep range.
<Ch>
Channel number of the offset-corrected channel.
<port_no>
Port number of the analyzer. This numeric suffix is ignored; the active port is
determined by the active trace.
ONCE
Applies the Auto Length function.
–
*RST value
SCPI, Command
Types
Example:
Device-specific, no query
*RST; CORR:EDEL:AUTO ONCE
Reset the instrument and apply the auto length function to the default trace
(Trc1 in channel 1).
Operating Manual 1303.6580.32-01
418
R&S® ZVL
Command Reference
[SENSe...]
[SENSe<Ch>:]CORRection:EDELay<port_no>:DIELectric <permittivity>
Defines the permittivity for the offset correction at test port <port_no>.
<Ch>
Channel number of the offset-corrected channel
<port_no>
Port number of the analyzer
<permittivity>
Range [def. unit]
*RST value
Permittivity
1 to +3.4028234664E+038 m
1.00062 [–]
SCPI, Command Types
Device-specific, command or query
Example:
See [SENSe<Ch>:]CORRection:EDELay<port_no>:ELENgth
[SENSe<Ch>:]CORRection:EDELay<port_no>:DISTance <length>
Defines the offset parameter for test port <port_no> as a mechanical length.
<Ch>
Channel number of the offset-corrected channel
<port_no>
Port number of the analyzer
<length>
Range [def.
unit]
Mechanical length
–3.402823466E+038 m to +3.4028234664E+038 m. In contrast to the electrical
length ([SENSe<Ch>:]CORRection:EDELay<port_no>:ELENgth), the distance can
not be incremented (the UP/DOWN parameters do not work).
0 m [m]
*RST value
SCPI,
Command
Types
Example:
Device-specific, command or query
See [SENSe<Ch>:]CORRection:EDELay<port_no>:ELENgth
[SENSe<Ch>:]CORRection:EDELay<port_no>:ELENgth <length>
Defines the offset parameter for test port <port_no> as an electrical length.
<Ch>
Channel number of the offset-corrected channel
<port_no>
Port number of the analyzer
<length>
Range [def.
unit]
*RST value
Electrical length
–3.4028234664E+038 m to +3.4028234664E+038 m [m]. The increment (UP,
DOWN) is 1 cm.
0m
SCPI,
Command
Types
Example:
Device-specific, command or query
CORR:EDEL2:ELEN 0.3
Define an electrical length of 30 cm for channel 1 and port no. 2.
CORR:EDEL2:DIST?; DIEL?
Operating Manual 1303.6580.32-01
419
R&S® ZVL
Command Reference
[SENSe...]
Query the values of the mechanical length and the permittivity at port 2. The
mechanical length is equal to the electrical length divided by the square root of the
permittivity; the latter is set to its default value. The response is
0.29990704322;1.00062.
CORR:EDEL2?
Query the value of the delay at port 2. The delay is equal to the electrical length
divided by the speed of light in the vacuum, so the response is 1.0006922856E-009.
CORR:LOSS2 2; LOSS2:FREQ 1.5 GHz; OFFS 3 dB
Define the offset loss parameters at port 2.
[SENSe<Ch>:]CORRection:EDELay<port_no>[:TIME] <delay>
Defines the offset parameter for test port <port_no> as a delay time.
<Ch>
Channel number of the offset-corrected channel
<port_no>
Port number of the analyzer
<delay>
Range [def.
unit]
Delay
-3.40282346638529E+038 s to +3.40282346638529E+038 s [s]. In contrast to the
electrical length ([SENSe<Ch>:]CORRection:EDELay<port_no>:ELENgth), the delay
time can not be incremented (the UP/DOWN parameters do not work).
0s
*RST value
SCPI,
Command
Types
Example:
Device-specific, command or query
See [SENSe<Ch>:]CORRection:EDELay<port_no>:ELENgth
[SENSe<Ch>:]CORRection:FACTory[:STATe] <Boolean>
Enables or disables the factory calibration for a particular channel.
<Ch>
Channel number of the calibrated channel
<Boolean>
*RST value
Enable or disable factory calibration
ON
SCPI, Command
Types
Example:
Device-specific, command or query
*RST; CORR:FACT?
Reset the instrument and query whether the factory calibration for channel 1 is
enabled. The response is 1.
[SENSe<Ch>:]CORRection:LOSS<port_no> <DC_loss>
Defines the frequency-independent part (DC value) of the offset loss.
Operating Manual 1303.6580.32-01
420
R&S® ZVL
Command Reference
[SENSe...]
<Ch>
Channel number of the offset-corrected channel
<port_no>
Port number of the analyzer
<DC-loss>
Range [def. unit]
*RST value
Frequency-independent part of the offset loss
-200 dB to +200 dB [dB]. The increment (UP/DOWN) is 0.001 dB.
0 dB
SCPI, Command Types
Confirmed, command or query
Example:
See [SENSe<Ch>:]CORRection:EDELay<port_no>:ELENgth
[SENSe<Ch>:]CORRection:LOSS<port_no>:AUTO ONCE
Defines the offset parameters for the active test port such that the residual delay of the active trace
(defined as the negative derivative of the phase response) is minimized and the measured loss is
reproduced as far as possible across the entire sweep range.
<Ch>
Channel number of the offset-corrected channel.
<port_no>
Port number of the analyzer. This numeric suffix is ignored; the active port is
determined by the active trace.
ONCE
Applies the Auto Length and Loss function.
–
*RST value
SCPI, Command
Types
Example:
Device-specific, no query
*RST; CORR:LOSS:AUTO ONCE
Reset the instrument and apply the Auto Length and Loss function to the
default trace (Trc1 in channel 1).
[SENSe<Ch>:]CORRection:LOSS<port_no>:FREQuency <ref_frequency>
Defines the reference frequency for the frequency-dependent
([SENSe<Ch>:]CORRection:LOSS<port_no>:OFFSet).
part
of
the
offset
loss
<Ch>
Channel number of the offset-corrected channel
<port_no>
Port number of the analyzer
<ref_frequency>
Range [def. unit]
Reference frequency
Frequency range of the analyzer model [Hz]. The increment (UP/DOWN) is
1 MHz.
1000000000 Hz (= 1 GHz)
*RST value
SCPI, Command
Types
Example:
Device-specific, command or query
See [SENSe<Ch>:]CORRection:EDELay<port_no>:ELENgth
Operating Manual 1303.6580.32-01
421
R&S® ZVL
Command Reference
[SENSe...]
[SENSe<Ch>:]CORRection:LOSS<port_no>:OFFSet <ref_loss>
Defines the offset loss at the reference frequency
([SENSe<Ch>:]CORRection:LOSS<port_no>:FREQuency).
<Ch>
Channel number of the offset-corrected channel
<port_no>
Port number of the analyzer
<ref_loss>
Range [def. unit]
*RST value
Frequency-dependent part of the offset loss
-200 dB to +200 dB [dB]. The increment (UP/DOWN) is 0.001 dB.
0 dB
SCPI, Command Types
Device-specific, command or query
Example:
See [SENSe<Ch>:]CORRection:EDELay<port_no>:ELENgth
[SENSe<Ch>:]CORRection:OFFSet<port_no>[:STATe] <Boolean>
Resets the offset parameters for all test ports to zero or queries whether any of the offset parameters are
different from zero.
<Ch>
Channel number of the offset-corrected channel
<port_no>
Port number of the analyzer. This numeric suffix is ignored; the command
affects the parameters of all ports.
<Boolean>
The parameter function depends on whether the command is used as a setting
command or as a query:
For setting command:
ON – no effect
OFF – resets all length offsets to zero
For query:
1 – at least one length offset is different from zero
0 – all length offsets are zero
OFF
*RST value
SCPI, Command
Types
Example:
Device-specific, command or query
*RST; CORR:OFFS?
Reset the instrument and query whether the length offset parameters have
been reset as well. The response is 0.
[SENSe<Ch>:]CORRection:OFFSet<port_no>:MAGNitude <ref_loss>
Defines the offset loss at the reference frequency
([SENSe<Ch>:]CORRection:LOSS<port_no>:FREQuency).
Use the [SENSe<Ch>:]CORRection:LOSS<port_no>... commands to define the
complete set of loss offset parameters.
[SENSe<Ch>:]CORRection:OFFSet<port_no>:MAGNitude is equivalent to
Operating Manual 1303.6580.32-01
422
R&S® ZVL
Command Reference
[SENSe...]
[SENSe<Ch>:]CORRection:LOSS<port_no>:OFFSet
<Ch>
Channel number of the offset-corrected channel
<port_no>
Port number of the analyzer
<ref_loss>
Range [def. unit]
*RST value
Frequency-dependent part of the offset loss
-200 dB to +200 dB [dB]. The increment (UP/DOWN) is 0.001 dB.
0 dB
SCPI, Command Types
Confirmed, command or query
[SENSe<Ch>:]FREQuency
[SENSe<Ch>:]FREQuency...
This subsystem sets frequency-related parameters, especially the measurement and display ranges for
the different sweep types.
The frequency ranges for the different instrument models are listed below:
ZVL3
ZVL6
Start, Stop 10 Hz to 3 GHz
10 Hz to 6 GHz
Center
> 10 Hz to < 3 GHz
> 10 Hz to < 6 GHz
Span
10 Hz to 2.99999999 GHz 10 Hz to 5.99999999 GHz
Note: For a frequency sweep the range can be defined alternatively by a combination of Start/Stop
frequencies or a Center frequency and Span.
[SENSe<Ch>:]FREQuency:CENTer <center_frequency>
Defines the center of the measurement and display range for a frequency sweep.
<Ch>
Channel number. If unspecified the numeric suffix is set to 1.
<center_frequency>
Range [def. unit]
Center frequency of the sweep.
Depending on the instrument model [Hz]. The increment (parameters UP or
DOWN) is 0.1 kHz.
Center of the analyzer's maximum frequency range: (fMIN + fMAX)/2
*RST value
SCPI, Command
Types
Example:
Confirmed, command or query.
FUNC "XFR:POW:RAT B1, A2"
Activate a frequency sweep and select the ratio B1/A2 as measured
parameter for channel and trace no. 1.
FREQ:CENT 100MHz
Set center frequency to 100 MHz.
FREQ:SPAN 50000
Operating Manual 1303.6580.32-01
423
R&S® ZVL
Command Reference
[SENSe...]
Set frequency span to 50 kHz.
The measurement range defined by means of the center frequency and the current span
([SENSe<Ch>:]FREQuency:SPAN) must not exceed the allowed frequency range of the
analyzer. If necessary, the span is reduced to min (Center – fMIN, fMAX – Center).
[SENSe<Ch>:]FREQuency...
This subsystem sets frequency-related parameters, especially the measurement and display ranges for
the different sweep types.
Note: For a frequency sweep the range can be defined alternatively by a combination of Start/Stop
frequencies or a Center frequency and Span.
[SENSe<Ch>:]FREQuency:MODE SWEep | SEGMent
Selects the sweep type and defines which set of commands controls the stimulus frequency.
The command [SENSe<Ch>:]SWEep:TYPE provides a complete list of sweep types.
<Ch>
Channel number.
SWEep
Linear or logarithmic frequency sweep, depending on the selected spacing
([SENSe<Ch>:]SWEep:SPACing LINear | LOGarithmic). The frequency
range is set via [SENSe<Ch>:]FREQuency:STARt etc.
Segmented frequency sweep. The sweep range is composed of several continuous
frequency ranges or single frequency points defined by means of the commands in
the [SENSe<Ch>:]SEGMent<Seg>... subsystem.
Confirmed (with device-specific *RST value and parameters), command or query.
SEGMent
SCPI,
Command
Types
Example:
FREQ:MODE SWE
Activate a time sweep.
SWE:TYPE LOG
Set the sweep type Log Frequency.
Operating Manual 1303.6580.32-01
424
R&S® ZVL
Command Reference
[SENSe...]
[SENSe<Ch>:]FREQuency:SPAN <span>
Defines the width of the measurement and display range for a frequency sweep.
<Ch>
Channel number.
<span>
Range [def. unit]
Frequency span of the sweep.
Depending on the instrument model [Hz]. The increment (parameters UP or
DOWN) is 0.1 kHz.
Maximum frequency range of the analyzer: fMAX - fMIN
*RST value
SCPI, Command
Types
Example:
Confirmed, command or query.
FUNC "XFR:POW:RAT B1, A2"
Activate a frequency sweep and select the ratio B1/A2 as measured parameter
for channel and trace no. 1.
FREQ:CENT 100MHz
Set center frequency to 100 MHz.
FREQ:SPAN 50000
Set frequency span to 50 kHz, leaving the center frequency unchanged.
Note: The measurement range defined by means of the span and the current center frequency
([SENSe<Ch>:]FREQuency:CENTer), must not exceed the allowed frequency range of the
analyzer. If necessary, the center frequency is adjusted to fMIN + Span/2 or fMAX – Span/2.
[SENSe<Ch>:]FREQuency:STARt <start_frequency>
Defines the start frequency for a frequency sweep which is equal to the left edge of a Cartesian diagram.
<Ch>
Channel number.
<start_frequency>
Range [def. unit]
Start frequency of the sweep.
Depending on the instrument model [Hz]. The increment (parameters UP or
DOWN) is 0.1 kHz.
Minimum frequency of the analyzer: 300 kHz
*RST value
SCPI, Command
Types
Example:
Confirmed, command or query.
FUNC "XFR:POW:RAT B1, A2"
Activate a frequency sweep and select the ratio B1/A2 as measured
parameter for channel and trace no. 1.
FREQ:STAR 100000
Set start frequency to 100 kHz.
FREQ:STOP 10MHz
Set stop frequency to 10 MHz.
Note: If the start frequency entered is greater than the current stop frequency
([SENSe<Ch>:]FREQuency:STOP), the stop frequency is set to the start frequency plus the
Operating Manual 1303.6580.32-01
425
R&S® ZVL
Command Reference
[SENSe...]
minimum frequency span ([SENSe<Ch>:]FREQuency:SPAN).
[SENSe<Ch>:]FREQuency:STOP <stop_frequency>
Defines the stop frequency for a frequency sweep which is equal to the right edge of a Cartesian diagram.
<Ch>
Channel number.
<stop_frequency>
Range [def. unit]
Stop frequency of the sweep.
Depending on the instrument model [Hz]. The increment (parameters UP or
DOWN) is 0.1 kHz.
Maximum frequency of the analyzer: MAX
*RST value
SCPI, Command
Types
Example:
Confirmed, command or query.
FUNC "XFR:POW:RAT B1, A2"
Activate a frequency sweep and select the ratio B1/A2 as measured
parameter for channel and trace no. 1.
FREQ:STAR 100000
Set start frequency to 100 kHz.
FREQ:STOP 10MHz
Set stop frequency to 10 MHz.
Note: If the stop frequency entered is smaller than the current start frequency
([SENSe<Ch>:]FREQuency:STARt), the start frequency is set to the stop frequency minus the
minimum frequency span ([SENSe<Ch>:]FREQuency:SPAN).
[SENSe<Ch/Tr>:]FUNCtion
[SENSe<Chn>:]FUNCtion...
This subsystem selects the sweep type and the measurement parameter.
[SENSe<Chn>:]FUNCtion[:ON] '<string>'
Defines the sweep type and the measurement parameter in a single string.
Note: To select a measurement parameter without changing the sweep type, use
CALCulate<Ch>:PARameter:MEASure. Use the other commands in the
CALCulate<Ch>:PARameter... subsystem to create or delete traces and select measurement
parameters.
Channel number used to identify the active trace. If
<Chn>
[SENSe<Chn>:]FUNCtion[:ON] is not used as a query, the number must be 1.
'<string>'
Range [def. unit]
Single string parameter defining the sweep type and the parameter to be
measured: <string> = "<sweep_type>:<parameter>".
See list of strings below [–].
Operating Manual 1303.6580.32-01
426
R&S® ZVL
Command Reference
[SENSe...]
*RST value
SCPI,
Command
Types
Example:
"XFR:S21" '
Confirmed, command or query
CALC4:PAR:SDEF "Ch4Tr1", "S11"
Create channel 4 and a trace named Ch4Tr1 to measure the input reflection
coefficient S11. The trace automatically becomes the active trace.
SENS4:FUNC?
Check (query) the sweep type and measurement parameter of the active trace.
The result is 'XFR:POW:S11'.
The following keyword defines the sweep type (see SCPI command reference: presentation layer):
XFRequency Frequency sweep (Lin. Frequency/Log. Frequency/Segmented Frequency)
The following keywords define the measurement parameter (see SCPI command reference: function
name):
POWer:S<Ptout><Ptin>
S-parameter with output and input port number of the DUT, e.g. S11, S21.
POWer:KFACtor
Stability factor K
POWer:MUFactor<1|2> Stability factors µ1 or µ2
[SENSE<Ch/r>:]ROSCillator
[SENSe<Ch>:]ROSCillator...
This subsystem controls the frequency reference oscillator.
[SENSe<Ch>:]ROSCillator[:SOURce] INTernal | EXTernal
Selects the source of the reference oscillator signal.
<Ch>
Channel number. This suffix is ignored in the ROSCillator subsystem and can be
set to any value.
INTernal
EXTernal
Select internal 10 MHz reference oscillator.
Select external reference clock. The frequency of the external reference clock is
specified via [SENSe<Chn>:]ROSCillator:EXTernal:FREQuency.
INTernal
*RST value
SCPI,
Command
Types
Example:
Confirmed, command or query
ROSC EXT
Select external reference oscillator.
Operating Manual 1303.6580.32-01
427
R&S® ZVL
Command Reference
[SENSe...]
ROSC:EXT:FREQ?
Query the frequency of the external reference oscillator. The response is 10000000
Hz, i.e. the frequency of the external reference oscillator must be 10 MHz.
[SENSe<Ch>:]ROSCillator:EXTernal:FREQuency <numeric_value>
Specifies or queries the frequency of the external reference oscillator.
<Ch>
Channel number. This suffix is ignored in the ROSCillator
subsystem and can be set to any value.
<numeric_value>
Frequency of the external reference clock signal. The frequency
must be 10 MHz; any other setting is ignored.
10 MHz [Hz].
10 MHz
Range [def. unit]
*RST value
SCPI, Command
Types
Example:
Confirmed, command or query
See [SENSe<Ch>:]ROSCillator[:SOURce].
[SENSe<Ch>:]SEGMent
[SENSe<Ch>:]SEGMent<Seg>...
This subsystem defines all channel settings for a Segmented Frequency sweep. A segmented sweep is
activated via [SENSe<Ch>:]SWEep:TPYE SEGMent.
The commands in the [SENSe<Ch>:]SEGMent<Seg>... subsystem do not accept the step
parameters UP and DOWN. Numeric values can be entered directly or using the DEFault,
MINimum, MAXimum parameters.
[SENSe<Ch>:]SEGMent<Seg>:ADD
Inserts a new sweep segment using default channel settings (Insert New Segment). The added segment
covers the frequency interval between the maximum frequency of the existing sweep segments and the
stop frequency of the entire sweep range.
Use [SENSe<Ch>:]SEGMent<Seg>:INSert to create a segment with specific channel
settings.
<Ch>
Channel number. If unspecified the numeric suffix is set to 1.
<Seg>
Sweep segment number. Segment numbers must be sequential. If n segments
Operating Manual 1303.6580.32-01
428
R&S® ZVL
Command Reference
[SENSe...]
already exist, the added segment must have the segment number n+1.
*RST value
SCPI, Command
Types
Example:
–
Device-specific, no query.
SEGM:INS 1MHZ, 1.5MHZ, 111, -21DBM, 0.5S, 0, 10KHZ
Create a sweep segment with a sweep range between 1.0 MHz and 1.5 MHz.
SEGM2:ADD
Create a second sweep segment. The frequency range of the second segment
will be between 1.5 MHz and the maximum frequency of the analyzer.
[SENSe<Ch>:]SEGMent<Seg>:BWIDth[:RESolution] <numeric_value>
Defines the resolution bandwidth of the analyzer (Meas Bandwidth) in sweep segment no. <Seg>. At the
same time, the command activates separate bandwidth setting in all sweep segments
([SENSe<Ch>:]SEGMent<Seg>:BWIDth[:RESolution]:CONTrol ON).
<Ch>
Channel number.
<Seg>
Sweep segment number.
<numeric_value>
Internal source power.
Range [def. unit]
*RST value
1.0E-6 Hz to 5 MHz [Hz]. UP and DOWN increment/decrement the bandwidth
in 1-2-5 steps for each decade. The analyzer rounds up any entered value
between these steps and rounds down values exceeding the maximum
bandwidth.
10 kHz
SCPI, Command
Types
Device-specific, command or query
Example:
SEGM:ADD
Create a new sweep segment no. 1 in channel no. 1 using default settings and
thus –10 dBm internal source power.
SEGM:BWID 1 MHZ
Increase the resolution bandwidth to 1 MHz.
[SENSe<Ch>:]SEGMent<Seg>:BWIDth[:RESolution]:CONTrol <Boolean>
Qualifies whether or not the Meas Bandwidth can be set independently for each sweep segment.
<Ch>
Channel number.
Operating Manual 1303.6580.32-01
429
R&S® ZVL
Command Reference
[SENSe...]
<Seg>
Sweep segment number.
<Boolean>
ON: The bandwidth can be set independently for each sweep segment.
OFF: The bandwidth in all sweep segments is equal to the bandwidth for
unsegmented sweeps set via SENSe<Ch>:BWIDth[:RESolution].
OFF. The parameter is automatically switched to ON when a bandwidth is entered
using [SENSe<Ch>:]SEGMent<Seg>:BWIDth[:RESolution].
*RST value
Device-specific, command or query
SCPI,
Command
Types
Example:
SEGM:ADD
Create a new sweep segment no. 1 in channel no. 1 using default settings and thus
10 kHz measurement bandwidth.
SEGM:BWID 1 MHZ
Increase the resolution bandwidth to 1 MHz.
SEGM:BWID:CONT OFF
Couple the bandwidths in all segments and reset the bandwidth in segment no. 1 to
the initial value.
[SENSe<Ch>:]SEGMent:CLEar
Deletes
all
sweep
segments
in
[SENSe<Ch>:]SEGMent:DELet:ALL.
the
channel.
The
command
is
equivalent
to
[SENSe<Ch>:]SEGMent<Seg>:COUNt?
Returns the number of sweep segments in the channel including all segments that are switched off
([SENSe<Ch>:]SEGMent<Seg>[:STATe] OFF).
Channel number.
<Ch>
*RST value
SCPI, Command
Types
Example:
–
Device-specific, query only.
SEGM:ADD
Create a new sweep segment no. 1 in channel no. 1 using default
settings.
SEGM OFF
Disable the measurement in the created sweep segment.
SEGM:COUN?
Query the number of segments.
Operating Manual 1303.6580.32-01
430
R&S® ZVL
Command Reference
[SENSe...]
[SENSe<Ch>:]SEGMent<Seg>:DEFine <Start>,<Stop>,<Points>,<Power>,<Point
Delay>,<Unused>,<Meas. Bandwidth>[,<LO>]
Re-defines a sweep segment with specific channel settings (Insert New Segment). The segment replaces
an existing segment <Seg> in the segment list. The modified segment must not overlap with any of the
existing segments.
Entry of the first seven numeric parameters is mandatory; no default values are provided. All settings
except <LO> can be changed for existing segments using other commands of the
[SENSe<Ch>:]SEGMent<Seg>... subsystem.
Note: Use [SENSe<Ch>:]SEGMent<Seg>:Add to create a segment with default channel settings. Use
[SENSe<Ch>:]SEGMent<Seg>:INSert (no query) to insert a new segment into the current
segment list.
Channel number.
<Ch>
<Seg>
Sweep segment number. Segment numbers must be sequential. The specified
segment number must be smaller or equal to the number of existing segments plus
1.
If segment number <Seg> already exists, it is replaced by the new segment.
<Start>,
<Stop>
Start and stop frequency of the segment. See
[SENSe<Ch>:]SEGMent<Seg>:FREQuency:STARt and
[SENSe<Ch>:]SEGMent<Seg>:FREQuency:STOP.
A new segment must not overlap with any of the existing segments. Besides the
frequency range depends on the analyzer model. [Hz]
Range [def.
unit]
<Points>
Range [def.
unit]
<Power>
Range [def.
unit]
<Point
Delay>
Range [def.
unit]
Number of sweep points in the segment. See
[SENSe<Ch>:]SEGMent<Seg>:SWEep:POINts.
1 to 2147483647. [1] 1 is allowed if start and stop frequencies are equal.
Internal source power in the segment. See
[SENSe<Ch>:]SEGMent<Seg>:POWer.
–40 dBm to +10 dBm. The exact range depends on the analyzer model; refer to the
data sheet [dBm]. UP and DOWN increment/decrement the source power in 1-dB
steps.
Delay for each partial measurement in the segment. See
[SENSe<Ch>:]SEGMent<Seg>:SWEep:DWELl. In the setting
[SENSe<Ch>:]SEGMent<Seg>:INSert:SELect SWTime, this parameter is
replaced by <Time>.
0 s to 2.5E+003 s. [s] AUTO activates automatic sweep time setting in the segment,
which is equivalent to a meas. delay of 0 s.
Ignored parameter, should be set to the default value 0.
<Unused>
<Meas.
Bandwidth>
Range [def.
unit]
<LO>
Range [def.
unit]
SCPI,
Resolution bandwidth in the segment. See
[SENSe<Ch>:]SEGMent<Seg>:BWIDth[:RESolution].
1.0E-6 Hz to 5 MHz [Hz].
Position of the local oscillator frequency LO relative to the RF frequency (Spur
Avoid). In remote control this parameter must be set when a sweep segment is
created.
POSitive: LO > RF
Device-specific, with query (used to retrieve the channel settings for a particular
Operating Manual 1303.6580.32-01
431
R&S® ZVL
Command Reference
[SENSe...]
Command
Types
Example:
sweep segment).
SEGM:ADD
Create a new sweep segment no. 1 in channel no. 1 using default settings.
SEGM:DEF?
Query the channel settings for the new segment.
[SENSe<Ch>:]SEGMent<Seg>:DELete
Deletes
the
specified
(single)
sweep
segment
(Del.
Selected
[SENSe<Ch>:]SEGMent<Seg>:DELete:ALL deletes all segments in the channel.
<Ch>
Channel number.
<Seg>
Sweep segment number. If unspecified, the value is set to 1.
*RST value
SCPI, Command
Types
Example:
Segment).
–
Device-specific, no query.
SEGM:ADD
Create a new sweep segment no. 1 in channel no. 1 using default settings and
thus NORMal selectivity.
SEGM:DEL
Delete the created segment.
[SENSe<Ch>:]SEGMent:DELete:ALL
Deletes all sweep segments in the channel (Del. All Segments). [SENSe<Ch>:]SEGMent<Seg>:DELete
deletes a single segment.
Channel number.
<Ch>
*RST value
SCPI, Command
Types
Example:
–
Device-specific, no query.
SEGM:ADD
Create a new sweep segment no. 1 in channel no. 1 using default settings
and thus NORMal selectivity.
SEGM:ALL
Delete the created segment and all segments in the channel created before.
Operating Manual 1303.6580.32-01
432
R&S® ZVL
Command Reference
[SENSe...]
[SENSe<Ch>:]SEGMent<Seg>:FREQuency:CENTer?
Returns the center frequency of sweep segment no. <Seg>.
<Ch>
Channel number.
<Seg>
Sweep segment number.
Response
Range [def. unit]
*RST value
Center frequency of the sweep.
Depending on the instrument model [Hz].
–
SCPI, Command
Types
Example:
Device specific, query only.
SEGM:INS 1MHZ, 1.5MHZ, 111, -21DBM, 0.5S, 0, 10KHZ
Create a sweep segment with a sweep range between 1.0 MHz and 1.5
MHz.
SEGM:FREQ:CENT?
Query the center frequency of the created segment. The response is
1.2500000000E+006.
Note: The frequency range of the sweep segment can be changed via
[SENSe<Ch>:]SEGMent<Seg>:FREQuency:STARt and
[SENSe<Ch>:]SEGMent<Seg>:FREQuency:STOP.
[SENSe<Ch>:]SEGMent<Seg>:FREQuency:SPAN? <numeric_value>
Returns the width of the frequency range of sweep segment no. <Seg>.
<Ch>
Channel number.
<Seg>
Sweep segment number.
Response
Range [def. unit]
*RST value
Frequency span of the sweep.
Depending on the instrument model [Hz].
–
SCPI, Command
Types
Example:
Device specific, query only.
SEGM:INS 1MHZ, 1.5MHZ, 111, -21DBM, 0.5S, 0, 10KHZ
Create a sweep segment with a sweep range between 1.0 MHz and 1.5
MHz.
SEGM:FREQ:SPAN?
Query the span of
5.0000000000E+005.
the
created
segment.
The
response
is
Note: The frequency range of the sweep segment can be changed via
[SENSe<Ch>:]SEGMent<Seg>:FREQuency:STARt and
[SENSe<Ch>:]SEGMent<Seg>:FREQuency:STOP.
Operating Manual 1303.6580.32-01
433
R&S® ZVL
Command Reference
[SENSe...]
[SENSe<Ch>:]SEGMent<Seg>:FREQuency:STARt <numeric_value>
Defines the Start frequency of sweep segment no. <Seg>.
<Ch>
Channel number.
<Seg>
Sweep segment number.
<numeric_value>
Range [def. unit]
*RST value
Start frequency of the sweep.
Depending on the instrument model [Hz]. The increment is 0.1 kHz.
– (no sweep segment defined after reset)
SCPI, Command
Types
Example:
Device-specific, command or query
SEGM:INS 1MHZ, 1.5MHZ, 111, -21DBM, 0.5S, 0, 10KHZ
Create a sweep segment with a sweep range between 1.0 MHz and 1.5
MHz.
SEGM:FREQ:STAR?
Query the start frequency of the created segment. The response is
1.0000000000E+006.
Note: If the start frequency entered is greater than the current stop frequency
([SENSe<Ch>:]SEGMent<Seg>:FREQuency:STOP), the stop frequency is set to the start
frequency plus the minimum frequency span of 1 Hz.
[SENSe<Ch>:]SEGMent<Seg>:FREQuency:STOP <numeric_value>
Defines the Stop frequency of sweep segment no. <Seg>.
<Ch>
Channel number.
<Seg>
Sweep segment number.
<numeric_value>
Range [def. unit]
*RST value
Stop frequency of the sweep.
Depending on the instrument model [Hz]. The increment is 0.1 kHz.
– (no sweep segment defined after reset)
SCPI, Command
Types
Example:
Device-specific, command or query
SEGM:INS 1MHZ, 1.5MHZ, 111, -21DBM, 0.5S, 0, 10KHZ
Create a sweep segment with a sweep range between 1.0 MHz and 1.5
MHz.
SEGM:FREQ:STOP?
Query the stop frequency of the created segment. The response is
1.5000000000E+006.
Note: If the stop frequency entered is smaller than the current start frequency
([SENSe<Ch>:]SEGMent<Seg>:FREQuency:STARt), the start frequency is set to the stop
frequency minus the minimum frequency span
([SENSe<Ch>:]SEGMent<Seg>:FREQuency:SPAN).
Operating Manual 1303.6580.32-01
434
R&S® ZVL
Command Reference
[SENSe...]
[SENSe<Ch>:]SEGMent<Seg>:INSert <Start>,<Stop>,<Points>,<Power>,<Point
Delay>,<Unused>,<Meas. Bandwidth>
Inserts a new sweep segment with specific channel settings (Define Segments - Add). The new segment
must not overlap with any of the existing segments.
Entry of the first seven numeric parameters is mandatory; no default values are provided. All settings
except <LO> can be changed for existing segments using other commands of the
[SENSe<Ch>:]SEGMent<Seg>... subsystem.
Note: Use [SENSe<Ch>:]SEGMent<Seg>:Add to create a segment with default channel settings. Use
[SENSe<Ch>:]SEGMent<Seg>:DEFine to change or query all settings of an existing segment.
Channel number.
<Ch>
<Seg>
Sweep segment number. Segment numbers must be sequential. The specified
segment number must be smaller or equal to the number of existing segments plus 1.
Moreover, segment numbers must selected such that the corresponding frequency
ranges are in ascending order.
If one or more sweep segments with segment numbers <Seg> or larger exist in the
current channel, then all these existing segment numbers are incremented by 1 and
the new segment is inserted as segment no. <Seg>.
<Start>,
<Stop>
Start and stop frequency of the segment. See
[SENSe<Ch>:]SEGMent<Seg>:FREQuency:STARt and
[SENSe<Ch>:]SEGMent<Seg>:FREQuency:STOP.
A new segment must not overlap with any of the existing segments. Besides the
frequency range depends on the analyzer model. [Hz]
Range [def.
unit]
<Points>
Range [def.
unit]
<Power>
Range [def.
unit]
<Point
Delay>
Range [def.
unit]
Number of sweep points in the segment. See
[SENSe<Ch>:]SEGMent<Seg>:SWEep:POINts.
1 to 2147483647. [1] 1 is allowed if start and stop frequencies are equal.
Internal source power in the segment. See [SENSe<Ch>:]SEGMent<Seg>:POWer.
–40 dBm to +10 dBm. The exact range depends on the analyzer model; refer to the
data sheet [dBm]. UP and DOWN increment/decrement the source power in 1-dB
steps.
Delay for each partial measurement in the segment. See
[SENSe<Ch>:]SEGMent<Seg>:SWEep:DWELl. In the setting
[SENSe<Ch>:]SEGMent<Seg>:INSert:SELec SWTime, this parameter is
replaced by <Time>.
0 s to 2.5E+003 s. [s] AUTO activates automatic sweep time setting in the segment,
which is equivalent to a meas. delay of 0 s.
Ignored parameter, should be set to the default value 0.
<Unused>
<Meas.
Bandwidth>
Range [def.
unit]
SCPI,
Command
Types
Example:
Resolution bandwidth in the segment. See
[SENSe<Ch>:]SEGMent<Seg>:BWIDth[:RESolution].
1.0E-6 Hz to 5 MHz [Hz].
Device-specific, no query.
SEGM:INS 1MHZ, 1.5MHZ, 111, -21DBM, 0.5S, 0, 10KHZ
Create a sweep segment with a sweep range between 1.0 MHz and 1.5 MHz.
Operating Manual 1303.6580.32-01
435
R&S® ZVL
Command Reference
[SENSe...]
SEGM2:ADD
Create a second sweep segment. The frequency range of the second segment will be
between 1.5 MHz and the maximum frequency of the analyzer.
[SENSe<Ch>:]SEGMent<Seg>:INSert:SELect SWTime | DWELl
Defines whether the sweep time of a new segment, i.e. numeric parameter no. 5 of the command
[SENSe<Ch>:]SEGMent<Seg>:INSert, is entered as a segment sweep time or as a meas. delay.
<Ch>
Channel number.
<Seg>
Sweep segment number.
SWTime
Use segment sweep time.
DWELl
Use meas delay.
*RST value
SWTime
SCPI, Command
Types
Device-specific, command or query
Example:
SEGM:INS:SEL DWEL
Select the meas. delay to determine the sweep time in a new sweep segment.
SEGM:INS 1MHZ, 1.5MHZ, 111, -21DBM, 0.01S, 0, 10KHZ
Create a sweep segment with a sweep range between 1.0 MHz and 1.5 MHz
and a meas. delay of 10 ms..
SEGM:SWE:TIME?
Query the sweep time in the new segment.
[SENSe<Ch>:]SEGMent<Seg>:OVERlap <Boolean>
Queries whether the analyzer supports overlapping sweep segments.
<Ch>
Channel number.
<Seg>
Sweep segment number.
<Boolean>
ON | OFF: No effect.
*RST value
SCPI, Command
Types
OFF. If used as a query, the command returns the information that overlapping
sweep segments are not supported (OFF).
Device-specific, command (no effect) or query
Operating Manual 1303.6580.32-01
436
R&S® ZVL
Command Reference
[SENSe...]
[SENSe<Ch>:]SEGMent<Seg>:POWer[:LEVel] <numeric_value>
Defines the Power of the internal signal source in sweep segment no. <Seg>. At the same time, the
command
activates
separate
power
control
in
all
sweep
segments
([SENSe<Ch>:]SEGMent<Seg>:POWer[:Level]:CONTrol ON).
<Ch>
Channel number.
<Seg>
Sweep segment number.
<numeric_value>
Internal source power.
Range [def. unit]
*RST value
–40 dBm to +10 dBm. The exact range depends on the analyzer model;
refer to the data sheet [dBm].
–10 dBm.
SCPI, Command
Types
Device-specific, command or query
Example:
SEGM:ADD
Create a new sweep segment no. 1 in channel no. 1 using default settings
and thus –10 dBm internal source power.
SEGM:POW -20
Decrease the power to –20 dBm.
[SENSe<Ch>:]SEGMent<Seg>:POWer[:LEVel]:CONTrol <Boolean>
Qualifies whether or not the Power of the internal signal source can be set independently for each sweep
segment.
<Ch>
Channel number.
<Seg>
Sweep segment number.
<Boolean>
ON: The power can be set independently for each sweep segment.
OFF: The power in all sweep segments is equal to the internal source power for
unsegmented sweeps set via
SOURce<Ch>:POWer[:LEVel][:IMMediate][:AMPlitude].
OFF. The parameter is automatically switched to ON when a segment level is
entered using [SENSe<Ch>:]SEGMent<Seg>:POWer[:LEVel].
*RST value
SCPI,
Command
Types
Example:
Device-specific, command or query
SEGM:ADD
Create a new sweep segment no. 1 in channel no. 1 using default settings and thus –
10 dBm internal source power.
SEGM:POW -20
Operating Manual 1303.6580.32-01
437
R&S® ZVL
Command Reference
[SENSe...]
Decrease the power to –20 dBm.
SEGM:POW:CONT OFF
Couple the powers in all segments and reset the power in segment no. 1 to the initial
value.
[SENSe<Ch>:]SEGMent<Seg>[:STATe] <Boolean>
Activates or deactivates the sweep segment <Seg>. Sweep points belonging to inactive segments only
are not measured
<Ch>
Channel number.
<Seg>
Sweep segment number.
<Boolean>
ON | OFF - Activates or deactivates the measurement in sweep segment
<Seg>.
ON
*RST value
SCPI, Command
Types
Example:
Device-specific, command or query
SEGM:ADD
Create a new sweep segment no. 1 in channel no. 1 using default settings.
SEGM OFF
Disable the measurement in the created sweep segment.
[SENSe<Ch>:]SEGMent<Seg>:SWEep:POINts <numeric_value>
Defines the total number of measurement Points in sweep segment no. <Seg>.
<Ch>
Channel number.
<Seg>
Sweep segment number.
<numeric_value>
Number of points in the segment.
Range [def. unit]
*RST value
1 to 2147483647. [1] 1 is allowed if start and stop frequencies are equal.
51
SCPI, Command
Types
Device-specific, command or query
Example:
SEGM:ADD
Create a new sweep segment no. 1 in channel no. 1 using default settings
and thus 51 sweep points.
SEGM:SWE:POIN 401
Operating Manual 1303.6580.32-01
438
R&S® ZVL
Command Reference
[SENSe...]
Increase the number of points to 401.
[SENSe<Ch>:]SEGMent<Seg>:SWEep:TIME <numeric_value>
Sets the duration of the sweep in sweep segment no. <Seg> (Segment Sweep Time). At the same time,
the
command
activates
separate
sweep
time
setting
in
all
sweep
segments
([SENSe<Ch>:]SEGMent<Seg>:SWEep:TIME:CONTrol ON).
<Ch>
Channel number.
<Seg>
Sweep segment number.
<numeric_value>
Internal source power.
Range [def. unit]
*RST value
The minimum duration depends on the other channel settings, in particular on
the number of points ([SENSe<Ch>:]SEGMent<Seg>:SWEep:POINts), the IF
bandwidth (BWID) and the delay for each partial measurement
([SENSe<Ch>:]SEGMent<Seg>:SWEep:DWELl). The maximum is 1000 s. [s]
Changing the duration leaves the number of points unchanged but directly
affects the delay.
MIN, depending on the channel settings. This default value corresponds to
automatic sweep time setting in manual control.
SCPI, Command
Types
Device-specific, command or query
Example:
SEGM:ADD
Create a new sweep segment no. 1 in channel no. 1 using default settings and
thus –10 dBm internal source power.
SEGM:SWE:TIME 0.1
Increase the segment sweep time to 0.1 s.
[SENSe<Ch>:]SEGMent<Seg>:SWEep:TIME:CONTrol <Boolean>
Qualifies whether or not the Segment Sweep Time can be set independently for each sweep segment.
<Ch>
Channel number.
<Seg>
Sweep segment number.
<Boolean>
ON: The time can be set independently for each sweep segment.
OFF: The time in all sweep segments is equal to the sweep time for unsegmented
sweeps set via [SENSe<Ch>:]SWEep:TIME.
OFF. The parameter is automatically switched to ON when a segment sweep time is
entered using [SENSe<Ch>:]SEGMent<Seg>:SWEep:TIME or if the channel
settings in a sweep segment require a sweep time larger than the unsegmented
*RST value
Operating Manual 1303.6580.32-01
439
R&S® ZVL
Command Reference
[SENSe...]
sweep time.
SCPI,
Command
Types
Example:
Device-specific, command or query
SEGM:ADD
Create a new sweep segment no. 1 in channel no. 1 using default settings and thus –
10 dBm internal source power.
SEGM:SWE:TIME 0.1
Increase the segment sweep time to 0.1 s.
SEGM:SWE:TIME:CONT OFF
Couple the sweep times in all segments and reset the sweep time in segment no. 1
to the initial value.
[SENSe<Ch>:]SEGMent<Seg>:SWEep:DWELl <numeric_value>
Defines the delay time for each partial measurement in sweep segment no. <Seg> (Meas. Delay). If
coupling of the segments is switched on ([SENSe<Ch>:]SEGMent<Seg>:SWEep:DWELl:CONTrol ON)
the delay is valid for all sweep segments in the current channel.
<Ch>
Channel number.
<Seg>
Sweep segment number.
<numeric_value>
Range [def. unit]
Meas. delay before each partial measurement.
0 s to 2.5E+003 s. [s] Changing the delay leaves the number of points
unchanged but has an impact on the duration of the sweep
([SENSe<Ch>:]SEGMent<Seg>:SWEep:TIME).
0s
*RST value
SCPI, Command
Types
Device-specific, command or query. This default value corresponds to
automatic sweep time setting in manual control.
Example:
SEGM:ADD
Create a new sweep segment no. 1 in channel no. 1 using default settings.
SEGM:SWE:DWEL 1 MS
Set the meas. delay in segment no. 1 to 1 ms.
SEGM:DEF? Response: 300000,8000000000,51,-300,0.056559,0,10000,POS,NORM
Query the channel parameters for sweep segment 1. The response value for
the segment sweep time (olive) implicitly contains the defined meas. delay.
[SENSe<Ch>:]SEGMent<Seg>:SWEep:DWELl:CONTrol <Boolean>
Qualifies whether or not the Meas. Delay defined via [SENSe<Ch>:]SEGMent<Seg>:SWEep:DWELl can
be set independently for each sweep segment.
Operating Manual 1303.6580.32-01
440
R&S® ZVL
Command Reference
[SENSe...]
<Ch>
Channel number.
<Seg>
Sweep segment number.
<Boolean>
ON: The meas. delay can be set independently for each sweep segment.
OFF: The meas. delay in all sweep segments is equal to the Meas. Delay
measurements for unsegmented sweeps set via [SENSe<Ch>:]SWEep:DWELl.
OFF. The parameter is automatically switched to ON when a meas. delay time is
entered using [SENSe<Ch>:]SEGMent<Seg>:SWEep:DWELl.
*RST value
SCPI,
Command
Types
Example:
Device-specific, command or query.
SEGM:ADD
Create a new sweep segment no. 1 in channel no. 1 using default settings and thus
0 s meas. delay.
SEGM:SWE:DWELl 0.1
Increase the meas. delay to 0.1 s.
SEGM:SWE:DWELl:CONT OFF
Couple the meas. delay in all segments and reset the delay in segment no. 1 to the
initial value of 0 s.
[SENSe<Ch>:]SWEep
[SENSe<Ch>:]SWEep...
This subsystem provides general settings to control the sweep . Most of the settings are related to the
sweep time.
The [SENSe<Ch>:]SWEep... settings apply to non-segmented sweep types. Segmented
sweeps are selected via [SENSe<Ch>:]SWEep:TPYE SEGMent and configured in the
[SENSe<Ch>:]SEGMent<Seg>... subsystem.
[SENSe<Ch>:]SWEep:COUNt <No_of_Sweeps>
Defines the number of sweeps to be measured in single sweep mode (INITiate<Ch>:CONTinuous
OFF).
<Ch>
Channel number.
<No_of_Sweeps>
Range [def. unit]
*RST value
Number of consecutive sweeps to be measured.
1 to 999. [–]
1
SCPI, Command Types
Confirmed, command or query
Operating Manual 1303.6580.32-01
441
R&S® ZVL
Command Reference
[SENSe...]
Example:
See CALCulate<Chn>:DATA:NSWeep?.
[SENSe<Ch>:]SWEep:DWELl <delay>
Defines the Meas. Delay time for each partial measurement.
<Ch>
Channel number.
<delay>
Range [def. unit]
Meas. delay before each partial measurement.
0 s to 3.179551E+002 s. [s] Changing the delay leaves the number of points
unchanged but has an impact on the duration of the sweep.
0s
*RST value
SCPI, Command
Types
Example:
Confirmed, command or query
FUNC "XFR:POW:S12"
Activate a frequency sweep and select the S-parameter S12 as measured
parameter for channel and trace no. 1.
SWE:TIME?
Query total sweep time.
SWE:DWEL 1
Set a delay of 1 s for each partial measurement.
SWE:TIME?
Query total sweep time. The time is extended by the delay times the total
number of partial measurements per sweep.
[SENSe<Ch>:]SWEep:POINts <no_points>
Defines the total number of measurement points per sweep (Number of Points).
<Ch>
Channel number 1.
<no_points>
Range [def. unit]
*RST value
Number of points per sweep.
2 to 4001. [1]
201
SCPI, Command
Types
Example:
Confirmed, command or query
FUNC "XFR:POW:S12"
Activate a frequency sweep and select the S-parameter S12 as measured
parameter for channel and trace no. 1.
SWE:TIME?
Query total sweep time.
SWE:POIN 2010
Multiply the (default) number of points by 10.
SWE:TIME?
Operating Manual 1303.6580.32-01
442
R&S® ZVL
Command Reference
[SENSe...]
Query total sweep time again. The analyzer estimates a sweep time that is
also multiplied by 10.
[SENSe<Ch>:]SWEep:SPACing LINear | LOGarithmic
Defines the frequency vs. time characteristics of a frequency sweep (Lin Frequency or Log Frequency).
The command has no effect on segmented frequency sweeps.
Note: Use [SENSe<Ch>:]SWEep:TPYE to select sweep types other than Lin Frequency or Log
Frequency.
Channel number.
<Ch>
LINear
LOGarithmic
*RST value
SCPI, Command
Types
Example:
The stimulus frequency is swept in equidistant steps over the frequency range.
In a Cartesian diagram, the x-axis is a linear frequency axis.
The frequency is swept in equidistant steps on a logarithmic scale. In a
Cartesian diagram, the x-axis is a logarithmic frequency axis.
LINear
Confirmed, command or query
FUNC "XFR:POW:S12"
Activate a frequency sweep and select the S-parameter S12 as measured
parameter for channel and trace no. 1.
SWE:SPAC LOG
Change to sweep type Log Frequency.
[SENSe<Chn>:]SWEep:SRCPort 1 | 2
Selects a source port for the stimulus signal (Drive Port). The setting acts on the active trace.
If an S-parameter S<out><in> is measured, the second port number index <in> (input port of the DUT = drive
port of the analyzer) is set equal to the selected drive port: Drive port selection affects the measured
quantity.
<Chn>
Channel number used to identify the active trace. If unspecified the numeric
suffix is set to 1.
1 ...
Test port number of the analyzer, 1 to 2.
1 (test port 1)
*RST value
SCPI, Command
Types
Example:
Device-specific, with query.
CALC4:PAR:SDEF "Ch4Tr1", "A1"
Create channel 4 and a trace named Ch4Tr1 to measure the wave quantity a1.
The trace automatically becomes the active trace.
SENS4:SWE:SRCP 2
Select drive port 2 for the active trace.
Operating Manual 1303.6580.32-01
443
R&S® ZVL
Command Reference
[SENSe...]
[SENSe<Ch>:]SWEep:STEP <step_size>
Sets the distance between two consecutive sweep points.
This setting is valid for sweep types with equidistant sweep points only. It does not apply to
logarithmic and segmented sweeps.
<Ch>
Channel number.
<step_size>
Range [def.
unit]
Stimulus step size.
Depending on the other channel settings. The minimum step size is equal to the
sweep span divided by the maximum number of points minus one
([SENSe<Ch>:]SWEep:POINts), the maximum step size is equal to the sweep span
([SENSe<Ch>:]FREQuency:SPAN). See also description of manual control and
program example below. [–]
The default step size is equal to the default sweep span of the analyzer divided by
the default number of points minus one.
*RST value
SCPI,
Command
Types
Example:
Confirmed, with query.
*RST; SWE:STEP?
Query the default step size. For a 6 GHz analyzer, the response is 29998500.
29998500 Hz = (6 GHz – 300 kHz) / 200.
SWE:STEP UP
Increase the step size.
FREQ:STOP?; :SWE:POIN?
Query the stop frequency of the sweep and the number of points. Increasing the
step size has changed both values.
[SENSe<Ch>:]SWEep:TIME:AUTO <Boolean>
When enabled, the (minimum) sweep duration is calculated internally using the other channel settings and
zero delay ([SENSe<Ch>:]SWEep:DWELl).
<Ch>
Channel number.
<Boolean>
ON | OFF - Turns the automatic calculation of the sweep time on or off. OFF is also
set if the sweep duration or delay is set explicitly using [SENSe<Ch>:]SWEep:TIME
or [SENSe<Ch>:]SWEep:DWELl.
ON
*RST value
SCPI,
Command
Types
Example:
Confirmed, command or query
SWE:TIME 1
Set a total sweep time of 1 s.
SWE:TIME:AUTO?
A query returns the value 1.
Operating Manual 1303.6580.32-01
444
R&S® ZVL
Command Reference
[SENSe...]
[SENSe<Ch>:]SWEep:TYPE LINear | LOGarithmic | SEGMent
Selects the sweep type (frequency) and the position of the sweep points across the sweep range.
<Ch>
Channel number.
LINear
Lin. frequency sweep at constant source power
(SOURce<Ch>:POWer<Pt>[:LEVel][:IMMediate][:AMPlitude]). The
stimulus frequency ([SENSe<Ch>:]FREQuency:...) is swept in equidistant steps
over the frequency range. In a Cartesian diagram, the x-axis is a linear frequency
axis.
Log. frequency sweep. The frequency is swept in equidistant steps on a logarithmic
scale. In a Cartesian diagram, the x-axis is a logarithmic frequency axis.
Segmented frequency sweep. The sweep range is composed of several continuous
frequency ranges or single frequency points defined by means of the commands in
the [SENSe<Ch>:]SEGMent<Seg>... subsystem.
LINear
LOGarithmic
SEGMent
*RST value
SCPI,
Command
Types
Example:
Device-specific, command or query
FUNC "XFR:POW:S12"
Activate a frequency sweep and select the S-parameter S12 as measured parameter
for channel and trace no. 1.
SWE:TYPE LOG
Change to sweep type Log Frequency.
Operating Manual 1303.6580.32-01
445
R&S® ZVL
Command Reference
SOURce
SOURce
SOURce<Ch>:POWer...
This subsystem controls the power of the internal signal source and provides output port settings.
Note: The SOURce<Ch>:POWer... subsystem comprises port-specific and general settings. Port-specific
settings are valid for the port specified by the numeric suffix <Pt> (...:POWER<Pt>:...). General
settings are valid for all test ports of the analyzer; the port suffix is ignored. Refer to the description
of the individual commands for more information.
SOURce<Ch>:POWer<Pt>[:LEVel][:IMMediate][:AMPlitude] <numeric_value>
Defines the power of the internal signal source (channel power). The setting is valid for all sweep types.
<Ch>
Channel number.
<Pt>
Test port number of the analyzer. This suffix is ignored because the selected
channel power applies to all source ports used in the active channel.
<numeric_value>
Range [def. unit]
Internal source power.
–50 dBm to +0 dBm. The exact range for all analyzer models is quoted in the
data sheet [dBm]. UP and DOWN increment/decrement the source power in
0.1-dB steps.
0 dBm
*RST value
SCPI, Command
Types
Example:
Confirmed, command or query
FUNC "XFR:POW:RAT
B1, A2"
Activate a frequency sweep and select the ratio B1/A2 as measured
parameter for channel and trace no. 1.
SOUR:POW -6
Set the internal source power for channel 1 to -6 dBm.
Operating Manual 1303.6580.32-01
446
R&S® ZVL
Command Reference
STATus
STATus
STATus...
This subsystem controls the Status Reporting System. Note that *RST does not influence the status
registers.
STATus:PRESet
Configures the status reporting system such that device-dependent events are reported at a higher level.
The command affects only the transition filter registers, the ENABle registers, and queue enabling:
•
The ENABle parts of the STATus:OPERation and STATus:QUEStionable... registers are set to all
1's.
•
The PTRansition parts are set all 1's, the NTRansition parts are set to all 0's, so that only positive
transitions in the CONDition part are recognized.
The status reporting system is also affected by other commands, see Reset Values of the Status
Reporting System.
*RST value
–
SCPI, Command Types
Confirmed, no query
Example:
STAT:PRES
Preset the status registers.
STATus:QUEStionable:CONDition?
Returns the contents of the CONDition part of the QUEStionable register. Reading the CONDition
registers is nondestructive.
*RST value
–
SCPI, Command
Types
Example:
Confirmed, query only
STAT:QUES:COND?
Query the CONDition part of the QUEStionable register to check for
questionable instrument states.
STATus:QUEStionable:ENABle
Sets the enable mask which allows true conditions in the EVENt part of the QUEStionable register to be
reported in the summary bit. If a bit is 1 in the enable register and its associated event bit transitions to
true, a positive transition will occur in the summary bit (bit 3 of the STatus Byte).
Operating Manual 1303.6580.32-01
447
R&S® ZVL
Command Reference
STATus
0 to 65535 (decimal representation)
– (see also Reset Values of the Status Reporting System)
<NRf>
*RST value
SCPI, Command Types
Confirmed, command or query
Example:
STAT:QUES:ENABle 1536
Set bits no. 9 and 10 of the QUEStionable:ENABle register
STATus:QUEStionable[:EVENt]?
Returns the contents of the EVENt part of the QUEStionable register. Reading an EVENt register clears it.
*RST value
–
SCPI, Command
Types
Example:
Confirmed, query only
STAT:OPER?
Query the EVENt part of the OPERation register to check whether an event
has occurred since the last reading.
STATus:QUEStionable:NTRansition
Sets the negative transition filter. Setting a bit causes a 1 to 0 transition in the corresponding bit of the
associated condition register to cause a 1 to be written in the associated bit of the corresponding event
register.
<NRf>
*RST value
0 to 65535 (decimal representation)
– (see also Reset Values of the Status Reporting System)
SCPI, Command Types
Confirmed, command or query
Example:
STAT:QUES:NTR 1536
Set bits no. 9 and 10 of the QUEStionable:NTRansition register
STATus:QUEStionable:PTRansition
Sets the positive transition filter. Setting a bit causes a 0 to 1 transition in the corresponding bit of the
associated condition register to cause a 1 to be written in the associated bit of the corresponding event
register.
<NRf>
*RST value
0 to 65535 (decimal representation)
– (see also Reset Values of the Status Reporting System)
SCPI, Command Types
Confirmed, command or query
Example:
STAT:QUES:PTR 1536
Set bits no. 9 and 10 of the QUEStionable:PTRansition register
Operating Manual 1303.6580.32-01
448
R&S® ZVL
Command Reference
STATus
STATus:QUEStionable:LIMit<1|2>:CONDition?
Returns the contents of the CONDition part of the QUEStionable:LIMit<1|2> register. Reading the
CONDition registers is nondestructive.
*RST value
–
SCPI, Command
Types
Example:
Confirmed, query only
STAT:QUES:LIMit:COND?
Query the CONDition part of the QUEStionable:LIMit1 register to retrieve the
current status of the limit check.
STATus:QUEStionable:LIMit<1|2>:ENABle
Sets the enable mask which allows true conditions in the EVENt part of the QUEStionable:LIMit<1|2>
register to be reported in the summary bit. If a bit is 1 in the enable register and its associated event bit
transitions to true, a positive transition will occur in the summary bit (bit 10 of the QUEStionable register
for the LIMit1 register, bit 0 of the LIMit1 register for the LIMit2 register).
<NRf>
*RST value
0 to 65535 (decimal representation)
– (see also Reset Values of the status reporting system)
SCPI, Command Types
Confirmed, command or query
Example:
STAT:QUES:LIM2:ENAB 6
Set bits no. 1 and 2 of the QUEStionable:LIMit2:ENABle register
STATus:QUEStionable:LIMit<1|2>[:EVENt]?
Returns the contents of the EVENt part of the QUEStionable:LIMit<1|2> register. Reading an EVENt
register clears it.
*RST value
–
SCPI, Command
Types
Example:
Confirmed, query only
STAT:QUES:LIM1?
Query the EVENt part of the QUEStionable:LIMit1 register to check whether an
event has occurred since the last reading.
STATus:QUEStionable:LIMit<1|2>:NTRansition
Sets the negative transition filter. Setting a bit causes a 1 to 0 transition in the corresponding bit of the
Operating Manual 1303.6580.32-01
449
R&S® ZVL
Command Reference
STATus
associated condition register to cause a 1 to be written in the associated bit of the corresponding event
register.
0 to 65535 (decimal representation)
– (see also Reset Values of the Status Reporting System)
<NRf>
*RST value
SCPI, Command Types
Confirmed, command or query
Example:
STAT:QUES:LIM2:NTR 6
Set bits no. 1 and 2 of the QUEStionable:LIMit2:NTRansition register
STATus:QUEStionable:LIMit<1|2>:PTRansition
Sets the positive transition filter. Setting a bit causes a 0 to 1 transition in the corresponding bit of the
associated condition register to cause a 1 to be written in the associated bit of the corresponding event
register.
0 to 65535 (decimal representation)
– (see also Reset Values of the Status Reporting System)
<NRf>
*RST value
SCPI, Command Types
Confirmed, command or query
Example:
STAT:QUES:LIM2:PTR 6
Set bits no. 1 and 2 of the QUEStionable:LIMit2:PTRansition register
STATus:QUEue[:NEXT]?
Queries and at the same time deletes the oldest entry in the error queue. Operation is identical to that of
SYSTem:ERRor[:NEXT]?
The entry consists of an error number and a short description of the error. Positive error numbers are
instrument-dependent. Negative error numbers are reserved by the SCPI standard; see section Error
Messages.
*RST value
–
SCPI, Command
Types
Example:
Confirmed, query only
STAT:QUE?
Query the oldest entry in the error queue. 0,"No error" is returned if the error
queue is empty.
Operating Manual 1303.6580.32-01
450
R&S® ZVL
Command Reference
SYSTem
SYSTem
SYSTem...
This subsystem collects the functions that are not related to instrument performance, such as function for
general housekeeping and function related to global configurations.
SYSTem:COMMunicate:GPIB[:SELF]:ADDRess <address_no>
Sets the GPIB address of the analyzer.
<address_no>
Range [def. unit]
*RST value
GPIB address (integer number)
0 to 30 [–].
The GPIB address is factory-preset. *RST has no effect on the value.
SCPI, Command Types
Confirmed, command or query
Example:
SYST:COMM:GPIB:ADDR 10
Set the GPIB address to 10.
*RST; SYST:COMM:GPIB:ADDR?
After a reset, the address is maintained (the response is 10).
SYSTem:COMMunicate:GPIB[:SELF]:RTERminator LFEoi | EOI
Sets the receive terminator of the analyzer. The receive terminator indicates the end of a command or a
data block.
The receive terminator setting is relevant if block data is transferred to the analyzer (FORMat[:DATA]
REAL). In the default setting LFEOI, the analyzer recognizes an LF character sequence with or without the
EOI control bus message as a receive terminator. An accidental LF in a data block can be recognized as a
terminator and cause an interruption of the data transfer.
The EOI setting is especially important if commands are transferred in block data format, because it
ensures that the parser for command decoding is activated by the terminator only after the command has
been completely transferred. Readout of binary data does not require a change of the receive terminator.
LFEoi
LF character sequence with or without EOI recognized
EOI
EOI recognized only
*RST value
LFEoi.
SCPI, Command Types
Device-specific, command or query
Example:
SYST:COMM:GPIB:RTER EOI
Set the terminator to EOI.
Operating Manual 1303.6580.32-01
451
R&S® ZVL
Command Reference
SYSTem
SYSTem:DATA:SIZE ALL | AUTO
Defines the block size for the data transfer between the instrument hardware and the software. The block
size has an impact on the display of traces and on the readout of trace data using the commands of the
TRACe... or CALCulate<Chn>:DATA... subsystems.
Data transfer with full buffer size. The data for each sweep are transferred together
so that each displayed trace contains the data of exactly one sweep. The same is
true for queried trace data. The trace is displayed or updated at once, the sweep
progress is not visible on the screen.
ALL
To make sure that all queried trace points stem from the same sweep you can
also use single sweep mode (INITiate<Ch>:CONTinuous OFF) and the common
command *OPC?
Data transfer with an automatically determined block size. In general the data blocks
comprise only part of a trace, therefore the sweep progress is visible on the screen.
On the other hand the displayed trace can show the results of two consecutive
sweeps.
AUTO
*RST value
AUTO.
Device-specific, command or query
SCPI,
Command
Types
Example:
SYST:DATA:SIZE ALL
Select data transfer with full buffer size in order to view the trace data from a single
sweep..
SYSTem:DISPlay:COLor DBACkground | LBACkground | BWLStyles | BWSolid
Selects the color scheme for all diagram areas in the active setup.
DBACkground
LBACkground
BWLStyles
BWSolid
*RST value
SCPI, Command
Types
Example:
Dark background
Light background
Black and white line styles
Black and white solid
–
*RST does not affect the color settings; see also description of the Preset
command.
Device-specific, command or query
SYST:DISP:COL LBAC
Select a light background, e.g. to generate color hardcopies.
Operating Manual 1303.6580.32-01
452
R&S® ZVL
Command Reference
SYSTem
SYSTem:DISPlay:UPDate <Boolean> | ONCE
Switches the display on or off while the analyzer is in the remote state. The command has no effect while
the analyzer is in the Local operating state.
Switching off the display speeds up the measurement. This command may have an impact
on the update of trace and channel settings; see SYSTem:SETTings:UPDate.
<Boolean>
ONCE
*RST value
SCPI,
Command
Types
Example:
ON | OFF – Switch the display on or off. If the display is switched on, the analyzer
shows the diagrams and traces like in manual control.
Switch the display on and show the current trace. This parameter can be used for
occasional checks of the measurement results or settings. The measurement is
continued, however, the measurement results are not updated. Compared to the ON
setting, ONCE does not slow down the measurement speed.
OFF
Device-specific, command or query
SYST:DISP:UPD ON
Switch the display on to view the traces and diagrams.
SYSTem:ERRor[:NEXT]?
Queries and at the same time deletes the oldest entry in the error queue. Operation is identical to that of
STATus:QUEue[:NEXT]?
The entry consists of an error number and a short description of the error. Positive error numbers are
instrument-dependent. Negative error numbers are reserved by the SCPI standard; see section Error
Messages.
*RST value
–
SCPI, Command
Types
Example:
Confirmed, query only
SYST:ERR?
Query the oldest entry in the error queue. 0,"No error" is returned if the error
queue is empty.
SYSTem:ERRor:ALL?
Queries and at the same time deletes all entries in the error queue.
The entries consist of an error number and a short description of the error. Positive error numbers are
instrument-dependent. Negative error numbers are reserved by the SCPI standard; see section Error
Messages.
*RST value
–
SCPI, Command
Confirmed, command or query
Operating Manual 1303.6580.32-01
453
R&S® ZVL
Command Reference
SYSTem
Types
Example:
SYST:ERR:ALL?
Query all entries in the error queue. 0,"No error" is returned if the error
queue is empty.
SYSTem:ERRor:DISPlay <Boolean>
Switches the display of a tooltip for remote command errors on or off. The tooltip appears at the bottom of
the remote screen and of the manual screen; it is not displayed for SCPI errors no. –113, Undefined
header.
<Boolean>
*RST value
ON | OFF – Switch the tooltip on or off.
OFF
SCPI, Command Types
Device-specific, command or query
Example:
SYST:ERR:DISP ON
Switch the display of the tooltip for remote command errors on.
FREQ:STAR 1
SYSTem:FIRMware:UPDate '<file_name>'
Installs a firmware version stored in a NWA setup file (*.msi) on the analyzer. The installation is automatic
and does not require any further action to be taken.
'<file_name>'
*RST value
String variable for the name and directory of a NWA setup file (*.msi).
–
SCPI, Command
Types
Example:
Device-specific, no query
SYST:FIRM:UPD 'C:\Setup\ZVAB_01.10.msi’
Install the firmware version 01.10 from the setup file stored in the Setup
directoy of the analyzer's internal hard disk.
SYSTem:KLOCk <Boolean>
Locks or unlocks the local controls of the analyzer. This includes the front panel keys, the keyboard, or
other local interfaces.
<Boolean>
*RST value
ON | OFF – Lock or unlock the local keys.
OFF
SCPI, Command Types
Confirmed, command or query
Example:
SYST:KLOCk ON
Operating Manual 1303.6580.32-01
454
R&S® ZVL
Command Reference
SYSTem
Lock the local keys.
SYSTem:PASSword[:CENable] '<password>'
Sends a password to the analyzer enabling a class of service functions to function (Command
ENable). Service functions are activated with the commands of the DIAGnostic system and should be
used by a R&S service representative only. Refer to the service manual for more information.
Case-sensitive string variable. Sending an invalid password generates error 221, (settings conflict).
– (neither the password nor the protection of service functions is affected by
*RST)
'<password>'
*RST value
Confirmed, no query
SCPI, Command
Types
Example:
SYST:PASS "XXXX"
Enter password.
SYSTem:PRESet
Performs a factory preset of all instrument settings (i.e. all open setups) or of the active setup, depending
on the SYSTem:PRESet:SCOPe settings. The command is equivalent to *RST and to the action of the
PRESET key on the front panel.
If a user-defined preset is active (SYSTem:PRESet:USER[:STATe] ON), the PRESET key
initiates a user-defined preset, while SYSTem:PRESet and *RST still activate the factory
preset.
*RST value
–
SCPI, Command Types
Confirmed, no query
Example:
SYST:PRES:SCOP SING
Define the scope of a preset: the active setup is reset only.
SYST:PRES
Reset the parameters of the current setup.
SYSTem:PRESet:SCOPe ALL | SINGle
Specifies whether a preset (SYSTem:PRESet; *RST) affects the active setup only or all open setups.
ALL
SINGle
All open setups are deleted and the setup Set1 is created with default trace and
channel settings.
The settings of the active setup are reset; the name of the active setup and the
Operating Manual 1303.6580.32-01
455
R&S® ZVL
Command Reference
SYSTem
*RST value
SCPI, Command
Types
Example:
parameters of all other setups remain unchanged.
– (*RST does not affect the preset scope setting)
Device-specific, command or query
See SYSTem:PRESet
SYSTem:PRESet:USER[:STATe] <Boolean>
Selects a factory preset or a user-defined preset.
The user-defined preset can be initiated using System – Preset (manual control) or
MMEMory:LOAD:STATe. *RST and SYSTem:PRESet always initiate a factory preset.
<Boolean>
*RST value
SCPI, Command
Types
Example:
OFF - User-defined preset switched off (factory preset is used)
ON - User-defined preset switched on
– (*RST does not affect the preset state setting)
Device-specific, command or query
SYST:PRES:USER ON
Enable a user-defined preset.
SYST:PRES:USER:NAME 'C:\Rohde&Schwarz\Nwa\RecallSets\Setup_2.nwa'
Select a setup file for the user-defined preset.
Press
System
–
Preset
(manual
control)
MMEM:LOAD:STAT
'C:\Rohde&Schwarz\Nwa\RecallSets\Setup_2.nwa'
Carry out the use-defined preset.
or
use
1,
SYSTem:PRESet:USER:NAME '<Setup_file>'
Specifies the name of a setup file (.nwa) to be used for a user-defined preset.
'<Setup_file>'
*RST value
SCPI,
Command
Types
Example:
String parameter to specify the name and directory of the setup file to be loaded.
The default extension (manual control) for setup files is *.nwa, although other
extensions are allowed. If no path is specified the analyzer searches the default
directory (subdirectory ...RecallSets)
– (*RST does not affect the preset settings)
Device-specific, command or query
See SYSTem:PRESet:USER[:STATe]
Operating Manual 1303.6580.32-01
456
R&S® ZVL
Command Reference
SYSTem
SYSTem:SETTings:UPDate ONCE
Initiates an immediate update of the channel or trace settings.
The command has an effect if the analyzer operates in single sweep mode
(INITiate<Ch>:CONTinuous
OFF)
and
if
the
display
update
is
switched
off
(SYSTem:DISPlay:UPDate OFF). In this scenario, a change of the channel or trace settings is usually
not taken into account immediately. The analyzer waits until the end of the current sweep sequence and
changes all settings made during the last sweep period when the next single sweep sequence is initiated.
Several settings can be made en bloc, which generally saves time.
SYSTem:SETtings:UPDate ONCE causes the analyzer to apply the settings at once without waiting for
the end of the current single sweep sequence. The command has no effect in continuous sweep mode or
if the display update is switched on.
The settings are also updated when the continuous sweep mode is activated
(INITiate<Ch>:CONTinuous ON).
ONCE
*RST value
Causes an immediate update of the settings.
–
SCPI, Command Types
Confirmed, no query
Example:
INIT:CONT OFF
Activate single sweep mode.
SYST:SETT:UPD ONCE
Update the settings made during the current single sweep period.
SYSTem:SOUNd:ALARm[:STATe] <Boolean>
Switches alarm sounds on or off.
<Boolean>
*RST value
OFF - Alarm sounds switched off
ON - Alarm sounds switched on
ON
SCPI, Command Types
Device-specific, command or query.
Example:
SYST:SOUN:ALAR OFF; STAT OFF
Switch alarm and status sounds off.
SYSTem:SOUNd:STATus[:STATe] <Boolean>
Switches status sounds on or off.
<Boolean>
*RST value
SCPI, Command Types
OFF - Status sounds switched off
ON - Status sounds switched on
ON
Device-specific, command or query.
Operating Manual 1303.6580.32-01
457
R&S® ZVL
Command Reference
SYSTem
Example:
See SYSTem:SOUNd:ALARm[:STATe]
SYSTem:USER:DISPlay:TITLe '<title>'
Defines a title for the remote display.
'<title>'
*RST value
Title (string variable)
– (*RST does not affect the title)
SCPI, Command Types
Device-specific, command or query.
Example:
SYST:USER:DISP:TITL 'Remote test running'
Define a title for the remote display.
SYSTem:USER:KEY <ukey_no>[, '<ukey_name>']
Labels a user-defined key in the remote display. In the query form the command returns whether or not a
user-defined key was used.
<ukey_no>
Range [def. unit]
*RST value
Number of the user key
0 – Delete all user keys and restore the default keys (Go to Local, Display Off)
1 to 8 – user key numbers
0
'<ukey_name>'
*RST value
Label for user key no. 1 to 8 (string variable)
'' (empty string)
SCPI, Command
Types
Example:
Device-specific, command or query.
SYST:USER:KEY 1, 'User S11'
Define a user key no. 1 labeled S11. The user key is only labeled, no
functionality has been assigned yet.
SYST:USER:KEY:FUNC 1, 'S11'
Assign the functionality 'S11' (select S11 as a measured quantity for the active
trace) to the created user key.
SYST:USER:KEY?
The query returns 0,'', indicating that no user key has been pressed. If you
press the user softkey no. 1, the response is 1, 'User S11'.
CALC:PAR:MEAS? 'Trc1'
The query returns 'S11','', indicating that the measured quantity for trace 'Trc1'
has been changed.
SYST:USER:KEY 0
Delete the user key and restore the default keys..
Operating Manual 1303.6580.32-01
458
R&S® ZVL
Command Reference
TRACe
SYSTem:USER:KEY:FUNCtion <ukey_no>[, '<ukey_name>']
Labels the functionality of a function key to a user-defined key in the remote display.
You can use this command to execute part of your measurement task manually; see
Combining Manual and Remote Control.
<ukey_no>
Range [def. unit]
*RST value
Number of the user key
1 to 8 – user key numbers
– (the parameter is also needed in the query form)
'<ukey_name>'
*RST value
Name of a function key, e.g. 'S11', 'Start' etc. (string variable)
'' (empty string)
SCPI, Command Types
Device-specific, command or query.
Example:
See SYST:USER:KEY
SYSTem:VERSion?
Returns the SCPI version number to which the analyzer complies. The analyzer complies to the final SCPI
version 1999.0
*RST value
–
SCPI, Command Types
Confirmed, query only
Example:
SYST:VERS?
Query the SCPI version. The response is 1999.0.
TRACe
TRACe...
This subsystem handles active trace data and trace data stored in the analyzer's internal memory.
Trace data is transferred in either ASCII or block data (REAL) format, depending on the
FORMat[:DATA] setting. If the block data format is used, it is recommended to select EOI as
receive terminator (SYSTem:COMMunicate:GPIB[:SELF]:RTERminator EOI).
Reserved Trace Names
The commands in the TRACe... menu use the following ZVR-compatible parameters to specify traces:
Operating Manual 1303.6580.32-01
459
R&S® ZVL
Command Reference
TRACe
Parameter
Meaning
Used in
CH1DATA, CH2DATA,
CH3DATA, CH4DATA
Active data trace of channels 1 to 4
TRACe:COPY
TRACe[:DATA][:RESPonse][:ALL]?
TRACe[:DATA][:STIMulus][:ALL]?
CALCulate<Chn>:MATH[:EXPRession][:DEFine]
CH1MEM, CH2MEM,
CH3MEM, CH4MEM
Active memory trace associated to the
active data trace CH1DATA, CH2DATA,
CH3DATA, CH4DATA, respectively.
TRACe[:DATA][:RESPonse][:ALL]?
TRACe[:DATA][:STIMulus][:ALL]?
IMPLied
Active data trace, addressed with
<Chn>
CALCulate<Chn>:MATH[:EXPRession][:DEFine]
CHMem
Active memory trace assigned to the
IMPlied trace
CALCulate<Chn>:MATH[:EXPRession][:DEFine]
MDATA1, MDATA2,
MDATA3, MDATA4,
MDATA5, MDATA6,
MDATA7, MDATA8
Memory trace named Mem<n>[Trc<m>].
The trace name is unique because <n>
counts all data and memory traces in
the active setup.
TRACe:CLEar
TRACe:COPY
TRACe[:DATA][:RESPonse][:ALL]?
TRACe[:DATA][:STIMulus][:ALL]?
CALCulate<Chn>:MATH[:EXPRession][:DEFine]
TRACe:CLEar MDATA1 | MDATA2 | MDATA3 | MDATA4 | MDATA5 | MDATA6 |
MDATA7 | MDATA8
Deletes one of the memory traces Mem<n>[Trc<m>], where n = 1, ... 8.
Parameters
Range [def. unit]
*RST value
Identifier for the memory trace; see list of trace names. .
MDATA<n> where <n> = 1 to 8. [–]
–
SCPI, Command
Types
Example:
Device-specific, no query
SWE:POIN 20
Create a trace with 20 sweep points, making the created trace the active trace
of channel 1 (omitted optional mnemonic SENSe1).
TRAC:COPY "Mem_Pt20",CH1DATA
Copy the current state of the created trace to a memory trace named
"Mem_Pt20". The memory trace is not displayed.
DISP:WIND:TRAC2:FEED "MEM_PT20"
Display the created memory trace in the active diagram area (diagram area no.
1).
TRACe:COPY <memory_trc>,<data_trc>
Copies a data trace to a memory trace. The trace to be copied can be specified by two alternative
methods:
•
As the active data trace of channels 1 to 4 (CH1DATA, CH2DATA, CH3DATA, CH4DATA). If a
Operating Manual 1303.6580.32-01
460
R&S® ZVL
Command Reference
TRACe
mathematical trace is active, the associated data trace is copied.
•
As a trace with a name (string variable)
The created memory trace can be specified as follows:
•
As the memory trace named Mem<n>[Trc<m>], where n = 1, ... 8 and Trc<m> is the name of the
copied data trace (MDATA1, MDATA2, MDATA3, MDATA4, MDATA5, MDATA6, MDATA7,
MDATA8)
•
As a memory trace with an arbitrary name (string variable)
An existing memory trace with the same name is overwritten.
The copied trace is the data trace which is not modified by any mathematical operations. To
copy a mathematical trace to a memory trace, use TRACe:COPY:MATH. To copy the active
trace
to
the
memory
using
an
automatic
memory
trace
name,
use
CALCulate<Chn>:MATH:MEMorize.
<memory_trc>
Range [def. unit]
*RST value
<data_trc>
Range [def. unit]
*RST value
SCPI, Command
Types
Example:
Name of the memory trace.
<memory_trace> is either a string variable (enclosed in single or double quotes)
or one of the following reserved names (no string variables):
MDATA1 | MDATA2 | MDATA3 | MDATA4 | MDATA5 | MDATA6 |
MDATA7 | MDATA8 (only for memory traces Mem<n>[Trc<m>], where n = 1, ...
8; see list of trace names). [–]
–
Name of the data trace
<data_trace> is either a string variable (enclosed in single or double quotes) or
one of the following reserved names (no string variables):
CH1DATA | CH2DATA | CH3DATA | CH4DATA (only for the active data
trace in channels Ch1, Ch2, Ch3, Ch4; see list of trace names). [–]
–
Confirmed, no query
*RST; SWE:POIN 20
Create a trace with 20 sweep points, making the created trace the active trace
of channel 1 (omitted optional mnemonic SENSe1).
TRAC:COPY "Mem_Pt20",CH1DATA
Copy the current state of the created trace to a memory trace named
"Mem_Pt20". The memory trace is not displayed.
DISP:WIND:TRAC2:FEED "MEM_PT20"
Display the created memory trace in the active diagram area (diagram area no.
1).
TRACe:COPY:MATH <memory_trc>,<data_trc>
Copies a mathematical trace to a memory trace. The trace to be copied can be specified by two
alternative methods:
•
As the active mathematical trace of channels 1 to 4 (CH1DATA, CH2DATA, CH3DATA,
Operating Manual 1303.6580.32-01
461
R&S® ZVL
Command Reference
TRACe
CH4DATA)
•
As a trace with a name (string variable)
The created memory trace can be specified as follows:
•
As the memory trace named Mem<n>[Trc<m>], where n = 1, ... 8 and Trc<m> is the name of the
copied data trace (MDATA1, MDATA2, MDATA3, MDATA4, MDATA5, MDATA6, MDATA7,
MDATA8)
•
As a memory trace with an arbitrary name (string variable)
An existing memory trace with the same name is overwritten.
To copy a data trace which is not modified by any mathematical operations, use
TRACe:COPY.
<memory_trc>
Range [def. unit]
*RST value
<data_trc>
Range [def. unit]
*RST value
SCPI, Command
Types
Example:
Name of the memory trace.
<memory_trace> is either a string variable (enclosed in single or double quotes)
or one of the following reserved names (no string variables):
MDATA1 | MDATA2 | MDATA3 | MDATA4 | MDATA5 | MDATA6 |
MDATA7 | MDATA8 (only for memory traces Mem<n>[Trc<m>], where n = 1, ...
8; see list of trace names). [–]
–
Name of the data trace
<data_trace> is either a string variable (enclosed in single or double quotes) or
one of the following reserved names (no string variables):
CH1DATA | CH2DATA | CH3DATA | CH4DATA (only for the active data
trace in channels Ch1, Ch2, Ch3, Ch4; see list of trace names). [–]
–
Confirmed, no query
*RST; SWE:POIN 20
Create a trace with 20 sweep points, making the created trace the active trace
of channel 1 (omitted optional mnemonic SENSe1).
CALC:MATH:SDEF 'Trc1 / 2'; CALC:MATH:STAT ON
Define a mathematical trace, dividing the data trace by 2. Activate the
mathematical mode and display the mathematical trace instead of the data
trace.
TRAC:COPY:MATH 'Mem_Pt20',CH1DATA; CALC:MATH:STAT OFF
Copy the current state of the mathematical trace to a memory trace named
"Mem_Pt20". The memory trace is not displayed. Switch the display back to the
data trace.
DISP:WIND:TRAC2:FEED 'MEM_PT20'
Display the created memory trace together with the data trace.
Operating Manual 1303.6580.32-01
462
R&S® ZVL
Command Reference
TRACe
TRACe[:DATA][:RESPonse][:ALL]? CH1DATA | CH2DATA | CH3DATA | CH4DATA |
CH1MEM | CH2MEM | CH3MEM | CH4MEM | MDATA1 | MDATA2 | MDATA3 |
MDATA4 | MDATA5 | MDATA6 | MDATA7 | MDATA8
Returns the response values of the active data trace or memory trace (see trace names).
To read the response values of an arbitrary data or memory trace, use
CALCulate<Chn>:DATA? To read the response values of a trace acquired in single sweep
mode (INITiate<Ch>:CONTinuous OFF), use CALCulate<Chn>:DATA:NSWeep?
<Response>
Range [def.
unit]
*RST value
Response data of the selected trace, see list of trace names.
The data is transferred in the data format defined via FORMat[:DATA] and
FORMat:DEXPort:SOURce. The unit is the default unit of the measured
parameter; see CALCulate<Ch>:PARameter:SDEFine.
–
Device-specific, query only
SCPI,
Command
Types
Example:
SWE:POIN 20
Create a trace with 20 sweep points, making the created trace the active trace of
channel 1 (omitted optional mnemonic SENSe1).
CALC:FORM MLIN; :FORM ASCII; FORM:DEXP:SOUR FDAT
Select the trace data format: linear magnitude values, ASCII format and formatted
trace data (1 value per sweep point).
TRAC? CH1DATA
Query the 20 response values of the created trace according to the previous
format settings.
TRACe[:DATA]:STIMulus[:ALL]? CH1DATA | CH2DATA | CH3DATA | CH4DATA |
CH1MEM | CH2MEM | CH3MEM | CH4MEM | MDATA1 | MDATA2 | MDATA3 |
MDATA4 | MDATA5 | MDATA6 | MDATA7 | MDATA8
Returns the stimulus values of the active data trace or memory trace (see trace names).
To read the stimulus values
CALCulate<Chn>:DATA:STIMulus?
<Response>
Range [def. unit]
*RST value
SCPI, Command
Types
Example:
of
an
arbitrary
data
or
memory
trace,
use
Response data of the selected trace, see list of trace names.
The data is transferred in the data format defined via FORMat[:DATA]. The
numeric values are expressed in the default unit of the stimulus variable. [Hz,
dBm or s, depending on the sweep type]
–
Device-specific, query only
SWE:POIN 20
Operating Manual 1303.6580.32-01
463
R&S® ZVL
Command Reference
TRACe
Create a trace with 20 sweep points, making the created trace the active trace of
channel 1 (omitted optional mnemonic SENSe1).
TRAC:STIM? CH1DATA
Query the 20 stimulus values of the created trace. In the default format setting,
the data is returned as a comma-separated list of 10-digit ASCII values.
Operating Manual 1303.6580.32-01
464
R&S® ZVL
Programming Examples
Basic Tasks
8
Programming Examples..................................................................................... 466
Basic Tasks ......................................................................................................................................466
Typical Stages of a Remote Control Program ................................................................................466
Basic Instrument Settings.............................................................................................................466
Adjusting the Test Setup ..............................................................................................................467
Start of the Measurement and Command Synchronization .........................................................467
Retrieving Measurement Results .................................................................................................468
Handling of Channels, Traces and Diagram Areas.........................................................................469
Several Traces with Equal Channel Settings ...............................................................................469
Several Traces with Different Channel Settings...........................................................................474
Markers and Limit Lines... ............................................................................................................478
Condensed Programming Examples.............................................................................................483
Calibration .......................................................................................................................................483
Modeling a Max Hold Function........................................................................................................485
Retrieving the Results of Previous Sweeps ....................................................................................486
Operating Manual 1303.6580.32-01
465
R&S® ZVL
Programming Examples
Basic Tasks
8 Programming Examples
This chapter contains detailed program examples.
The syntax and use of all SCPI commands is described in the SCPI Reference chapter. For a general
introduction to remote control of the analyzer refer to chapter Remote Control. For an overview of special
remote control features of the network analyzers refer to section NWA Remote Control Features in
Chapter 5.
Basic Tasks
Typical Stages of a Remote Control Program
A typical remote control program comprises the following stages:
Very often, steps 3 and 4 (or steps 2 to 4) must be repeated several times.
All example programs in this section have been developed and tested by means of the GPIB
Explorer provided with the network analyzer. No extra programming environment is needed.
Basic Instrument Settings
Programming task: Adjust the basic network analyzer settings to your measurement tasks, optimizing
the instrument for fast measurements.
Considerations for high measurement speed
The measurement speed depends on the sweep time but also on an efficient preparation of the instrument
and on proper command synchronization. The following items should be kept in mind:
!
For maximum speed the basic channel settings should be set while the sweep is stopped and with
a minimum of sweep points. It is advisable to increase the number of points after all instrument
settings have been performed, and to initiate the sweep after the test setup has been completed.
!
Execution of the INITiate[:IMMediate] command is fastest in synchronized mode. Insertion
of fixed waiting periods into the command sequence is possible but generally less efficient.
!
The sweep time depends on several parameters discussed in section Optimizing the
Measurement Speed. In particular it is recommended to select the best set of sweep points, e.g.
using the segmented sweep.
// Reset the instrument, switch off the measurement (after one sweep),
// reduce the number of sweep points.
*RST
INITiate1:CONTinuous OFF
SENSe1:SWEep:POINts 2
//
Operating Manual 1303.6580.32-01
466
R&S® ZVL
Programming Examples
Basic Tasks
// Avoid a delay time between different partial measurements and before the start of the sweeps (is default
setting).
SENSe1:SWEep:TIME:AUTO ON
TRIGger1:SEQuence:SOURce IMMediate
//
// Select the widest bandwidth compatible with your measurement.
SENSe1:BANDwidth:RESolution 10
//
// Adjust your sweep points to your measurement task, e.g. using a segmented sweep.
SENSe1:SEGMent...
Adjusting the Test Setup
In general the preparatives described above can be used for a series of measurements. In-between the
measurements it is often necessary to change the test setup, e.g. in order to replace the DUT, change the
connected ports, connect external devices etc.
Start of the Measurement and Command Synchronization
Programming task: Start a measurement in single sweep mode. Wait until all single sweep data has
been acquired before you proceed to the next stage of the measurement.
INITiate<Ch>[:IMMediate] is used to start a single sweep or a group of single sweeps. This
command has been implemented for overlapped execution. The advantage of an overlapped
command is that they allow the program to do other tasks while being executed.
In the present example the sweep must be completed before measurement results can be
retrieved. To prevent wrong results (e.g. a mix-up of results from consecutive sweeps) the
controller must synchronize its operation to the execution of INITiate<Ch>[:IMMediate].
IEEE 488.2 defines three common commands (*WAI, *OPC?, *OPC) for synchronization.
//
// 1. Start single sweep, use *WAI
// *WAI is the easiest method of synchronization. It has no effect when sent after sequential commands.
// If *WAI follows INITiate<Ch>[:IMMediate] (overlapped command),
// the analyzer executes no further commands or queries until the sweep is terminated.
// *WAI does prevent the controller from sending other commands to the analyzer or other devices
// on the GPIB bus
INITiate1:SCOPe SINGle // Single sweep will be started in the referenced channel only
INITiate1:IMMediate; *WAI // Start single sweep in channel no. 1, wait until the end of the
sweep
<Continue program sequence>
//
Operating Manual 1303.6580.32-01
467
R&S® ZVL
Programming Examples
Basic Tasks
// 2. Start single sweep, use *OPC?
// If *OPC follows INITiate<Ch>[:IMMediate], it places a 1 into the output queue when the sweep is
terminated.
// An appropriate condition in the remote control program must cause the controller to wait until *OPC?
returns one.
// The controller is stopped from the moment when the condition is set.
INITiate1:IMMediate; *OPC? // Start single sweep in channel no. 1, indicate the end of the
sweep by a 1 in the output queue.
// So far the controller may still send messages to other devices on the GPIB bus.
<Condition OPC=1> // Stop the controller until *OPC? returns one (program syntax depends
on your programming environment).
<Continue program sequence>
//
// 3. Start single sweep, use *OPC
// If *OPC follows INITiate<Ch>[:IMMediate], it sets the OPC bit in the ESR after the sweep is
terminated.
// This event can be polled or used to trigger a service request of the analyzer.
// The advantage of *OPC synchronization is that both the controller and the analyzer can continue
// processing commands while the sweep is in progress.
*SRE 32 / Enable a service request for the ESR
*ESE 1 / Set event enable bit for operation complete bit
INITiate1::IMMediate; *OPC // Start single sweep in channel no. 1, set the OPC bit in the ESR
after the sweep is terminated.
// The controller may still send messages, the analyzer continues to parse and execute commands.
<Wait for service request> // Controller waits for service request from the analyzer (program
syntax depends on your programming environment).
<Continue program sequence>
Retrieving Measurement Results
Programming task: Read the results acquired in a single sweep.
//
// 1. Read single values (-> Markers)
// Markers are the most convenient tool for determining and retrieving single values on traces.
// The analyzer provides up to ten markers; see Markers and Limit Lines.
//
// 2. Read complete trace
// Select a trace format and read formatted trace data.
CALCulate1:FORMat MLINear / Calculate the linear magnitude of z
Operating Manual 1303.6580.32-01
468
R&S® ZVL
Programming Examples
Basic Tasks
CALCulate1:DATA? FDATa / Read the formatted trace data
//
Use CALCulate<Chn>:DATA:NSWeep to retrieve a particular trace within a group of
sweeps.
Handling of Channels, Traces and Diagram Areas
The following examples show you how to perform basic tasks related to channel and trace definition and
to the display of traces in diagram areas.
All example programs in this section have been developed and tested by means of the GPIB
Explorer provided with the network analyzer. No extra programming environment is needed.
Several Traces with Equal Channel Settings
Programming task: Create up to four different traces with equal channel settings, assign the four 2-port
standard S-parameters to the traces and display them in up to four diagram areas.
Important remote control features for this program example
The following command sequence illustrates the structure of the remote commands discussed in section
Basic Remote Control Concepts. In particular it shows that:
!
A trace can be created and handled without being displayed.
!
Traces are referenced by trace names. The active trace of a channel is often referenced by the
Operating Manual 1303.6580.32-01
469
R&S® ZVL
Programming Examples
Basic Tasks
channel suffix.
!
Diagram areas are referenced by a window suffix <Wnd>. An additional suffix <WndTr> in the
DISPlay:WINDow<Wnd>:TRACe<WndTr>... commands numbers the different traces in a
diagram area.
!
In remote control, it is possible to display the same trace in several diagram areas.
!
The analyzer provides several commands allowing a smooth transition between remote and
manual control.
//
// 1. One channel, two traces, one diagram area
// Reset the instrument, creating the default trace Trc1 in channel 1.
// The default measured quantity is the forward transmission S-parameter S21.
// The default format is dB Mag.
*RST
//
//
Create
a
second
trace
in
channel
// and display the new trace in the same diagram area.
1,
assign
the
format
Phase,
CALCulate1:PARameter:SDEFine 'Trc2', 'S21' // the trace becomes the active trace but is not
displayed
CALCulate1:FORMat PHASe // the trace is referenced by the channel suffix 1
DISPlay:WINDow1:TRACe2:FEED 'Trc2' // display the second trace, numbering it the second
trace in diagram area no. 1
//
//
Check the result on the local screen
// Go to local
SYSTem:DISPlay:UPDate ONCE
Operating Manual 1303.6580.32-01
470
R&S® ZVL
Programming Examples
Basic Tasks
//
//
// 2. One channel, two traces, two diagram areas
// Create a second diagram area, assign Trc2 to the new area, and remove it from the first area.
DISPlay:WINDow2:STATe ON
DISPlay:WINDow2:TRACe2:FEED 'Trc2' // Trc2 is now displayed in both diagram areas
DISPlay:WINDow1:TRACe2:DELete
//
//
Check the result on the local screen
// Go to local
SYSTem:DISPlay:UPDate ONCE
Operating Manual 1303.6580.32-01
471
R&S® ZVL
Programming Examples
Basic Tasks
//
//
// 3. One channel, four traces, four diagram areas
// Reset the instrument, add diagram areas no. 2, 3, 4.
*RST; :DISPlay:WINDow2:STATe ON
DISPlay:WINDow3:STATe ON
DISPlay:WINDow4:STATe ON
//
// Assign the reflection parameter S11 to the default trace.
:CALCulate1:PARameter:MEASure 'Trc1', 'S11'
//
// Assign the remaining S-parameters to new traces Trc2, Trc3, Tr4;
// select the Smith chart format for the reflection parameters.
CALCulate1:FORMat SMITh // Smith chart for the active trace Trc1
CALCulate1:PARameter:SDEFine 'Trc2', 'S21'
CALCulate1:PARameter:SDEFine 'Trc3', 'S12'
Operating Manual 1303.6580.32-01
472
R&S® ZVL
Programming Examples
Basic Tasks
CALCulate1:PARameter:SDEFine 'Trc4', 'S22'
CALCulate1:FORMat SMITh // Smith chart for the active trace Trc4, referenced by the channel
number
//
// Display the new traces in diagram areas no. 2 to 4.
DISPlay:WINDow2:TRACe2:FEED 'Trc2'
DISPlay:WINDow3:TRACe3:FEED 'Trc3'
DISPlay:WINDow4:TRACe4:FEED 'Trc4'
//
//
Check the result on the local screen
// Go to local
SYSTem:DISPlay:UPDate ONCE
//
//
Check the result in the trace manager
// The trace manager gives an overview of the current channel/trace configuration
DISPlay:MENU:KEY:EXECute 'Trace Manager'
Operating Manual 1303.6580.32-01
473
R&S® ZVL
Programming Examples
Basic Tasks
Several Traces with Different Channel Settings...
Programming task: Create three channels with 3, 1 and 2 traces, respectively, and display the traces in
two diagram areas.
Important remote control features for this program example
The following command sequence illustrates the structure of the remote commands discussed in section
Basic Remote Control Concepts. In particular it shows that:
!
Channels are always referenced by a channel suffix.
!
Traces are referenced by trace names. The active trace of a channel is often referenced by the
channel suffix.
Operating Manual 1303.6580.32-01
474
R&S® ZVL
Programming Examples
Basic Tasks
!
Diagram areas are referenced by a window suffix <Wnd>. An additional suffix <WndTr> in the
DISPlay:WINDow<Wnd>:TRACe<WndTr>... commands numbers the different traces in a
diagram area.
!
The analyzer provides several commands allowing a smooth transition between remote and
manual control.
//
// 1. Create all channels and traces
// Reset the instrument, creating the default trace Trc1 in channel 1.
// The default measured quantity is the forward transmission S-parameter S21.
// The default format is dB Mag.
*RST
//
// Create two more traces in channel 1, assigning a trace name and a measured quantity
// to each of them. Choose descriptive trace names (instead of the short default names used above).
CALCulate1:PARameter:SDEFine 'Impedance_trace', 'Z-S21' // the trace becomes the active trace
for channel 1 but is not displayed
CALCulate1:PARameter:SDEFine 'Admittance_trace', 'Y-S21' // the trace becomes the active trace
for channel 1
//
// Create channel 2 with one new trace, channel 3 with two new traces.
CALCulate2:PARameter:SDEFine 'Ratio_trace', 'B1/B2'
CALCulate3:PARameter:SDEFine 'Z_trace', 'Z21'
CALCulate3:PARameter:SDEFine 'Y_trace', 'Y21'
CALCulate3:PARameter:SELect 'Z_trace' // the trace created previously becomes the active
trace for channel 3
// So far, only the default trace is displayed.
//
//
Check the result in the trace manager
// The trace manager gives an overview of the current channel/trace configuration
DISPlay:MENU:KEY:EXECute 'Trace Manager'
Operating Manual 1303.6580.32-01
475
R&S® ZVL
Programming Examples
Basic Tasks
//
//
Check the result on the local screen
// Go to local
SYSTem:DISPlay:UPDate ONCE
//
//
Operating Manual 1303.6580.32-01
476
R&S® ZVL
Programming Examples
Basic Tasks
// 2. Create second diagram area and display traces
DISPlay:WINDow2:STATe ON
DISPlay:WINDow1:TRACe2:FEED 'Admittance_trace'
DISPlay:WINDow1:TRACe3:FEED 'Y_trace'
DISPlay:WINDow2:TRACe1:FEED 'Impedance_trace'
DISPlay:WINDow2:TRACe2:FEED 'Ratio_trace'
DISPlay:WINDow2:TRACe3:FEED 'Z_trace'
//
//
Check the result on the local screen
// Go to local
SYSTem:DISPlay:UPDate ONCE
//
//
// 3. Check and modify your configuration
// Query the traces in channel 1.
CALCulate1:PARameter:CATalog?
Operating Manual 1303.6580.32-01
477
R&S® ZVL
Programming Examples
Basic Tasks
// The response is 'Trc1,S21,Impedance_trace,Z-S21,Admittance_trace,Y-S21'
//
// Query the reference level for the 'Z_trace'.
// The trace is referenced by its number in diagram area no. 2.
DISPlay:WINDow2:TRACe3:Y:RLEVel?
//
// Change the display format for the 'Z_trace'. The trace is the active trace in channel 3,
// so it is referenced by the channel suffix 3.
CALCulate3:FORMat PHASe
Markers and Limit Lines...
Programming task: Display two traces in a single diagram ares, use markers to read results, and perform
a limit check.
Important remote control features for this program example
The following command sequence illustrates the structure of the remote commands discussed in section
Basic Remote Control Concepts. In particular it shows that:
!
Traces are referenced by trace names. The active trace of a channel is often referenced by the
channel suffix. This simplifies the program syntax, e.g. in the commands for marker settings and
for the limit check.
Operating Manual 1303.6580.32-01
478
R&S® ZVL
Programming Examples
Basic Tasks
!
Diagram areas are referenced by a window suffix <Wnd>. An additional suffix <WndTr> in the
DISPlay:WINDow<Wnd>:TRACe<WndTr>... commands numbers the different traces in a
diagram area.
!
The analyzer provides several commands allowing a smooth transition between remote and
manual control.
//
//
// 1. Create one channel, two traces, one diagram area
// Reset the instrument, creating the default trace Trc1 in channel 1.
// The default measured quantity is the forward transmission S-parameter S21.
// The default format is dB Mag.
*RST
//
//
Create
a
second
trace
in
channel
// and display the new trace in the same diagram area.
1,
assign
the
format
Phase,
CALCulate1:PARameter:SDEFine 'Trc2', 'S21' // the trace becomes the active trace but is not
displayed
CALCulate1:FORMat PHASe // the trace is referenced by the channel suffix 1
DISPlay:WINDow1:TRACe2:FEED 'Trc2' // display the second trace, numbering it the second
trace in diagram area no. 1
//
//
Check the result on the local screen
// Go to local
SYSTem:DISPlay:UPDate ONCE
Operating Manual 1303.6580.32-01
479
R&S® ZVL
Programming Examples
Basic Tasks
//
//
// 2. Marker settings
// Adjust the sweep range to consider an interesting segment of the trace and re-scale the diagram.
SENSe1:FREQuency:STARt 4.5 GHz; STOP 5.5 GHz
DISPlay:WINDow1:TRACe1:Y:SCALe:AUTO ONCE / in the autoscale command the trace is
referenced by its number in the diagram
//
// Select trace Trc1 as the active trace of the channel, define a reference marker and a delta marker.
// In the marker commands the active trace is referenced by the channel suffix.
CALCulate1:PARameter:SELect 'Trc1'
CALCulate1:MARKer1:STATe ON // the marker is set to the center of the sweep range
CALCulate1:MARKer1:DELTa:STATe ON // this command also creates the reference marker
CALCulate1:MARKer1:REFerence:X 4.5 GHz
of the sweep range
// set the reference marker to the beginning
//
// Use the delta marker to search for the minimum of the trace and query the result.
Operating Manual 1303.6580.32-01
480
R&S® ZVL
Programming Examples
Basic Tasks
CALCulate1:MARKer1:FUNCtion:EXECute MIN; RES? // the query returns the stimulus and the
response value at the marker position
//
//
Check the result on the local screen
// Go to local
SYSTem:DISPlay:UPDate ONCE
//
Use the CALCulate<Chn>:DATA... commands to retrieve the complete trace; see
Retrieving Measurement Results.
//
//
// 2. Limit lines and limit check
// Remove all markers and define a limit line for the active trace.
CALCulate1:MARKer1:AOFF
CALCulate1:LIMit:DATA 1, 4500000000, 5500000000, -5, -5 // define an upper limit line across the
Operating Manual 1303.6580.32-01
481
R&S® ZVL
Programming Examples
Basic Tasks
entire sweep range
CALCulate1:LIMit:DATA 2, 4500000000, 5000000000, -10, -15
CALCulate1:LIMit:DATA 2, 5000000000, 5500000000, -15, -10 // define two segments for the lower
limit line
//
// Display the limit line and perform the limit check.
CALCulate1:LIMit:DISPlay:STATe ON
CALCulate1:LIMit:STATe ON; FAIL? / if the trace is failed; the response is 1.
//
//
Check the result on the local screen
// Go to local
SYSTem:DISPlay:UPDate ONCE
//
//
Check the result in the Define Limit Line dialog
// The Define Limit Line dialog gives an overview of the limit line segments of the active trace.
Operating Manual 1303.6580.32-01
482
R&S® ZVL
Programming Examples
Condensed Programming Examples
DISPlay:MENU:KEY:EXECute 'Define Limit Line'
Condensed Programming Examples
Calibration
The following example shows you how to perform a multiport calibration of the analyzer.
// Reset the analyzer
*RST
//
// Set cal kit as active kit for N50
:SENSE:CORRECTION:CKIT:N50:SELECT 'N 50 Ohm Ideal Kit'
//
// Select connectors for the ports
:SENSE1:CORRECTION:COLLECT:CONNECTION1 N50MALE
:SENSE1:CORRECTION:COLLECT:CONNECTION2 N50MALE
//
// Don't save the cal standard measurements with apply cal, i.e. with the commands
// :SENSE1:CORRECTION:COLLECT:SAVE or
// :SENSe1:CORRection:COLLect:SAVE:SELected
// Instead, use the global, channel-independent setting:
:SENSe:CORRection:COLLect:ACQuire:RSAVe:DEFault OFF
//
//
// Full one port = OSM
// Select cal procedure
:SENSe1:CORRection:COLLect:METHod:DEFine
'Test SFK OSM 1', FOPORT, 1
//
Operating Manual 1303.6580.32-01
483
R&S® ZVL
Programming Examples
Condensed Programming Examples
// Measure Standards
:SENSe1:CORRection:COLLect:ACQuire:SELected OPEN, 1
:SENSe1:CORRection:COLLect:ACQuire:SELected SHORT, 1
:SENSe1:CORRection:COLLect:ACQuire:SELected MATCH, 1
//
// Apply cal
:SENSe1:CORRection:COLLect:SAVE:SELected
//
//
// 2 port TOSM
// Select cal procedure
:SENSe1:CORRection:COLLect:METHod:DEFine
'Test SFK TOSM 12', TOSM, 1, 2
//
// Measure Standards
:SENSe1:CORRection:COLLect:ACQuire:SELected THROUGH, 1, 2
:SENSe1:CORRection:COLLect:ACQuire:SELected OPEN, 1
:SENSe1:CORRection:COLLect:ACQuire:SELected SHORT, 1
:SENSe1:CORRection:COLLect:ACQuire:SELected MATCH, 1
:SENSe1:CORRection:COLLect:ACQuire:SELected OPEN, 2
:SENSe1:CORRection:COLLect:ACQuire:SELected SHORT, 2
:SENSe1:CORRection:COLLect:ACQuire:SELected MATCH, 2
//
// Apply calibration
:SENSe1:CORRection:COLLect:SAVE:SELected
//
// Save / load cal files
// Save calibration in calibration file pool in directory
// C:\Rohde&Schwarz\Nwa\Calibration\Data
// the file name in the commands must not contain the path !
:MMEMORY:STORE:CORRection 1, 'OSM1 TOSM12.cal'
//
// load cal file from calibration file pool
:MMEMORY:LOAD:CORRection 1, 'OSM1 TOSM12.cal'
Operating Manual 1303.6580.32-01
484
R&S® ZVL
Programming Examples
Condensed Programming Examples
Modeling a Max Hold Function
The following example shows you how to emulate a max hold function.
// Reset the analyzer
*RST
:DISPlay:WINDow1:TITLe:DATA 'Max Hold Function Emulation'
// Create a trace with the last extremum as memory trace.
:TRACe:COPY 'LastExtr', 'Trc1'
// Display this last extremum trace.
// Because it's a memory trace it must be displayed in the same diagram as the mother trace.
:DISPlay:WINDow1:TRACe2:FEED 'LastExtr'
:CALCulate1:MATH:SDEFine 'Max (Data, Mem)'
:CALCulate1:MATH:STATe ON
// Single sweep mode
:INITIATE:CONTINUOUS OFF
// Do a single sweep and update trace with the current extremum.
// This is the last extremum for the next sweep
:INITIATE:IMMEDIATE; *WAI
:TRACe:COPY:MATH 'LastExtr', 'Trc1'
// Loop over these 2 commands
:INITIATE:IMMEDIATE; *WAI
:TRACe:COPY:MATH 'LastExtr', 'Trc1'
:INITIATE:IMMEDIATE; *WAI
:TRACe:COPY:MATH 'LastExtr', 'Trc1'
// ..............
// Continous sweep mode
:INITIATE:CONTINUOUS ON
//
Operating Manual 1303.6580.32-01
485
R&S® ZVL
Programming Examples
Condensed Programming Examples
Retrieving the Results of Previous Sweeps
The command CALCulate<Ch>:DATA:NSWeep? SDATa, <Trace_Hist_Count> retrieves the results
of any sweep within a previously defined single sweep group. This means that, in single sweep mode, you
can first measure a specified number of sweeps (SENSe<Ch>:SWEep:COUNt <sweeps>) and then read
any of the data traces acquired.
This feature has no equivalent in manual control where always the last data trace is displayed.
// Reset the analyzer
*RST
:SYSTEM:DISPLAY:UPDATE ON
// Create a second channel with a second trace.
:CALCULATE2:PARAMETER:SDEFINE "Trc2","S11"
:CALCULATE2:PARAMETER:SELECT "Trc2"
:DISPLAY:WINDOW2:STATE ON
:DISPLAY:WINDOW2:TRACE1:FEED 'Trc2'
// Select active trace for the created channel 2. Adjust the number of sweep points.
:CALCULATE2:PARAMETER:SELECT "Trc2"
:SENSE1:SWEEP:POINTS 3
:SENSE2:SWEEP:POINTS 4
// Set sweep count for the channels
// (3 traces per single sweep in channel 1, 4 traces in channel 2)
:SENSE1:SWEEP:COUNT 3
:SENSE2:SWEEP:COUNT 4
// State that INITIATE<Ch>:IMMEDIATE will start a single sweep for the
// referenced channel <Ch> only, not for all channels
:INITIATE:IMMEDIATE:SCOPE SINGLE
// Select single sweep mode and measure a single sweep group for channels no. 1 and 2
:INITIATE:IMMEDIATE:SCOPE SINGLE
:INITIATE1:IMMEDIATE; *WAI
:INITIATE2:IMMEDIATE; *WAI
// Read trace data (without history, i.e. the last trace acquired in each channel)
:CALCULATE1:DATA? SDATA
Operating Manual 1303.6580.32-01
486
R&S® ZVL
Programming Examples
Condensed Programming Examples
:CALCULATE2:DATA? SDATA
// Read last and previous trace data in channel 1 and 2
:CALCULATE1:DATA:NSWEEP? SDATA, 1
// last trace data
:CALCULATE1:DATA:NSWEEP? SDATA, 3
// previous trace data
:CALCULATE2:DATA:NSWEEP? SDATA, 1
// last trace data
:CALCULATE2:DATA:NSWEEP? SDATA, 4
// previous trace data
Operating Manual 1303.6580.32-01
487
R&S® ZVL
HW Interfaces
Front Panel Connectors
9
HW Interfaces...................................................................................................... 491
Front Panel Connectors ..................................................................................................................491
Test Ports ........................................................................................................................................491
USB Connectors .............................................................................................................................491
PROBE POWER .............................................................................................................................492
Rear Panel Connectors ...................................................................................................................492
LAN .................................................................................................................................................492
EXT TRIGGER ................................................................................................................................492
EXT REF .........................................................................................................................................493
POWER SENSOR (Option R&S FSL–B5, Additional Interfaces) ...................................................493
NOISE SOURCE CONTROL (Option R&S FSL–B5, Additional Interfaces) ..................................493
IF/VIDEO OUT (Option R&S FSL–B5, Additional Interfaces).........................................................494
AUX PORT (Option R&S FSL–B5, Additional Interfaces) ..............................................................494
GPIB Interface (Option R&S FSL–B10) ..........................................................................................495
DC Power Supply (Option R&S FSL-B30) ......................................................................................495
Battery Pack (Option R&S FSL-B31) ..............................................................................................496
IEC/IEEE Bus Interface...................................................................................................................496
Interface Functions .......................................................................................................................498
Interface Messages ......................................................................................................................498
Instrument Messages ...................................................................................................................499
VXI-11 Interface ..............................................................................................................................499
VXI-11 Interface Messages ..........................................................................................................500
RSIB Interface Functions ................................................................................................................501
Variables ibsta, iberr, ibcntl ..........................................................................................................501
Error variable iberr........................................................................................................................502
Count variable - ibcntl...................................................................................................................502
Overview of Interface Functions ...................................................................................................502
Description of Interface Functions...................................................................................................503
RSDLLibfind() ...............................................................................................................................503
RSDLLibwrt...................................................................................................................................503
Operating Manual 1303.6580.32-01
489
R&S® ZVL
HW Interfaces
Front Panel Connectors
RSDLLilwrt....................................................................................................................................503
RSDLLibwrtf..................................................................................................................................504
RSDLLibrd()..................................................................................................................................504
RSDLLilrd .....................................................................................................................................505
RSDLLibrdf().................................................................................................................................505
RSDLLibtmo .................................................................................................................................505
RSDLLibsre ..................................................................................................................................506
RSDLLibloc...................................................................................................................................506
RSDLLibeot ..................................................................................................................................507
RSDLLibrsp ..................................................................................................................................507
RSDLLibclr....................................................................................................................................507
RSDLLibonl...................................................................................................................................508
RSDLLTestSRQ ...........................................................................................................................508
RSDLLWaitSrq .............................................................................................................................508
RSDLLSwapBytes ........................................................................................................................509
Operating Manual 1303.6580.32-01
490
R&S® ZVL
HW Interfaces
Front Panel Connectors
9 HW Interfaces
This chapter provides a detailed description of the hardware interfaces and connectors of the instrument.
For a graphical overview of the front panel and rear panel connectors and their use refer to chapter
Preparing for Use.
Front Panel Connectors
Test Ports
N-connectors labelled PORT 1 and PORT 2/ RF INPUT. The test ports serve as outputs for the RF
stimulus signal and as inputs for the measured RF signals from the DUT (response signals).
•
With a single test port, it is possible to generate a stimulus signal and measure the response
signal in reflection.
•
With 2 test ports, it is possible to perform full two-port measurements; see S-Parameters section
in Chapter 3.
•
The two network analyzer ports are equivalent. If the Spectrum Analysis option (R&S ZVL-K1) is
active, test port PORT 2 serves as an AC-coupled input for the analyzed RF signal; PORT 1 is not
used.
Attention!
The maximum input levels at all test ports according to the front
panel labeling or the data sheet must not be exceeded.
In addition, the maximum input voltages of the other input
connectors at the front and rear panel must not be exceeded.
USB Connectors
Two single Universal Serial Bus connectors of type A (master USB), used to connect a keyboard
(recommended: PSL–Z2, order number 1157.6870.03), mouse (recommended: PSL–Z10, order number
1157.7060.03) or other pointing devices, a printer or an external storage device (USB stick, CD-ROM
drive etc.).
Operating Manual 1303.6580.32-01
491
R&S® ZVL
HW Interfaces
Rear Panel Connectors
Using an adapter cable (R&S NRP–Z4), a power sensor can be connected, as an alternative to the power
sensor connector on the rear panel that is only available with option Additional Interfaces, R&S FSL–B5.
For maintaining the EMI conformity of the R&S ZVL only appropriate USB accessories may
be used.
Passive connecting USB cables should not exceed 4 m in length. Use the original USB
connecting cable or another high–quality cable. The maximum current per USB port is 500
mA.
PROBE POWER
Connector for supply voltages of +15 V to –12 V and ground for active probes and preamplifiers. A
maximum current of 140 mA is available. This connector is suitable as power supply for high-impedance
probes from Agilent.
Rear Panel Connectors
LAN
8-pin connector RJ-45, used to connect the analyzer to a Local Area Network (LAN); see Remote Control
in a LAN. The pin assignment of the RF-45 connector supports category 5 UTP/STP (Unshielded/Shielded
Twisted Pair) cables.
EXT TRIGGER
BNC female connector, used as an input for external TTL trigger signals. Input levels <0.7 V are
interpreted as logic low; input levels >1.4 V as logic high. The typical input impedance is 10 kΩ.
Operating Manual 1303.6580.32-01
492
R&S® ZVL
HW Interfaces
Rear Panel Connectors
EXT REF
BNC female connector, used as an input or output for the 10 MHz reference clock signal.
The function of the 10 MHz REF connector depends on the Int. Reference or Ext. Reference setting in the
SETUP menu:
•
If Int. Reference is active, 10 MHz REF is used as an output connector for the 10 MHz internal
reference clock signal of the analyzer. This configuration requires the OCXO option (R&S FSL–
B4, OCXO Reference Frequency).
•
If Ext. Reference is active, 10 MHz REF is used as an input connector for an external 10 MHz
reference clock signal. The external reference signal must meet the specifications of the data
sheet. The internal reference signal is synchronized to the external signal.
The AC power switch also interrupts the power supply of the OCXO. When you switch the
instrument back on, be sure to comply with the extended warm–up phase specified in the
data sheet.
POWER SENSOR (Option R&S FSL–B5, Additional Interfaces)
LEMOSA female connector, used for connecting power sensors of the R&S NRP–Zxy family. With an
adapter cable R&S NRP–Z4, the USB port on the front panel can be used for this purpose.
NOISE SOURCE CONTROL (Option R&S FSL–B5, Additional
Interfaces)
BNC female connector, provides the supply voltage for an external noise source, e.g. to measure the
noise figure and gain of amplifiers and frequency converting DUTs.
Conventional noise sources require a voltage of +28 V in order to be switched on and 0 V to be switched
off. The output supports a maximum load of 100 mA.
Operating Manual 1303.6580.32-01
493
R&S® ZVL
HW Interfaces
Rear Panel Connectors
IF/VIDEO OUT (Option R&S FSL–B5, Additional Interfaces)
BNC female connector, used as an intermediate frequency (IF) output of approximately 20 MHz or as a
video output at the selected video and resolution bandwidth (with spectrum analyzer option R&S ZVL-K1).
This connector cannot be used simultaneously with the AF output connector on the front
panel unless it is configured as a video output.
AUX PORT (Option R&S FSL–B5, Additional Interfaces)
9-pole SUB–D male connector, provides output signals for controlling external devices. The voltage levels
are of TTL type (max. 5 V). The pin assignment is shown below.
Pin No.
Name
Input (I) or
Output (O)
or
Bidirectional
(B)
Voltage Range
Function
1
SUPPLY
O
+ 5 V / max. 250 mA
Supply voltage for
external circuits
2 to 7
I/O
–
Reserved for future use
8
GND
–
Ground
9
READY FOR
TRIGGER
O
0V
Signal indicating that
the instrument is ready
to receive trigger signal.
Attention!
Watch the pin assignment carefully. A short-circuit may damage the
instrument.
Operating Manual 1303.6580.32-01
494
R&S® ZVL
HW Interfaces
Rear Panel Connectors
GPIB Interface (Option R&S FSL–B10)
GPIB interface in compliance with IEEE488 and SCPI. A computer for remote control can be connected
via this interface. To set up the connection, a shielded cable is recommended. See GPIB Bus Interface
above in this chapter.
DC Power Supply (Option R&S FSL-B30)
A DC power supply can be connected alternatively to the AC power supply; see DC Power Supply and
Battery in chapter 1. The connector is supplied with the other accessories of the option and is connected
according to the following diagram:
Pin No.
Input (I) or
Output (O)
or
Bidirectional
(B)
Voltage Range
Function
1
I
+11 V to +28 V
7 A to 2.7 A
Positive voltage
2
–
–
Ground
3
–
–
Not used
Caution!
DC
power
supply
The power supply (SELV) that is used must fulfill the requirements
for reinforced/double insulation for main supply circuits in
accordance to DIN/EN/IEC 61010 (UL 61010B–1, CSA C22.2 No.
1010.1) or DIN/EN/IEC 60950 (UL 1950, CSA C22.2 No. 950). It is
recommended to fuse the DC power supply according to the table
below. Before switching on the instrument check the connection for
correct polarity.
Operating Manual 1303.6580.32-01
495
R&S® ZVL
HW Interfaces
Rear Panel Connectors
In continuous operation the actual breaking current can differ from the rated breaking current. For fuse
selection take the characteristics of the fuse into account.
Input Voltage
Max. Current or Power
11 V to 12.5 V
125 VA
12.5 V to 18.7 V
10 A
18.7 V to 28 V
200 VA
The instrument is switched on or off using the standby key on the front panel; see sections Power Supply
Options and DC Power Supply and Battery in chapter 1.
Battery Pack (Option R&S FSL-B31)
The battery pack can be used alternatively as power supply. If the battery runs low during operation, a
message is displayed. In this case, use another power supply or switch off the instrument. For an
overview on available power supplies refer to section Power Supply Options in chapter 1.The power
supply can be changed during operation.
The instrument is switched on or off using the ON/STANDBY function key on the front panel. For details
refer to section DC Power Supply and Battery in chapter 1.
The battery pack can be reloaded via the AC or DC power supply. For details on charging refer to section
Charging the Battery in chapter 1.
If the battery is not to be used for a longer time, it is recommended to remove it and store it
separately.
IEC/IEEE Bus Interface
The standard instrument is equipped with a GPIB bus (IEC/IEEE bus) connection. The two interface
connectors labeled IEC BUS and IEC SYSTEM BUS are located on the rear panel of the instrument.
•
The IEC BUS connector is intended for remote control of the analyzer from a controller.
•
The IEC SYSTEM BUS can be used to control further devices from the analyzer.
Always use a shielded cable to connect the GPIB bus interfaces.
Characteristics of the interface
•
8-it parallel data transfer
•
Bidirectional data transfer
•
Three-line handshake
•
High data transfer rate of max. 1 MByte/s
•
Up to 15 devices can be connected
•
Maximum length of the connecting cables 15 m. The length of a
single connecting cable should not exceed 2 m, if many devices are
used, it should not exceed 1 m.
Operating Manual 1303.6580.32-01
496
R&S® ZVL
HW Interfaces
Rear Panel Connectors
•
Wired OR if several instruments are connected in parallel
Pin assignment
Bus lines
1. Data bus with 8 lines D0 to D7The transmission is bit-parallel and
byte-serial in the ASCII/ISO code. D0 is the least significant bit, D7
the most significant bit.
2. Control bus with five lines
IFC (Interface Clear):active LOW resets the interfaces of the
instruments connected to the default setting.
ATN (Attention):active LOW signals the transmission of interface
messages, inactive HIGH signals the transmission of device
messages.
SRQ (Service Request):active LOW enables the connected device to
send a service request to the controller.
REN (Remote Enable):active LOW permits switchover to remote
control.
EOI (End or Identify):has two functions in connection with ATN:
ATN=HIGH active LOW marks the end of data transmission.
ATN=LOW active LOW triggers a parallel poll.
3.Handshake bus with three lines
DAV (Data Valid):active LOW signals a valid data byte on the data
bus.
NRFD (Not Ready For Data):active LOW signals that one of the
connected devices is not ready for data transfer.
NDAC (Not Data Accepted):active LOW signals that the instrument
connected is accepting the data on the data bus.
The analyzer provides the following functions to communicate via GPIB bus:
•
Interface functions
•
Interface messages
Operating Manual 1303.6580.32-01
497
R&S® ZVL
HW Interfaces
Rear Panel Connectors
•
Instrument messages
Interface Functions
Instruments which can be controlled via GPIB bus can be equipped with different interface functions. The
interface function for the network analyzer are listed in the following table.
Control character
Interface function
SH1
Handshake source function (source handshake), full capability
AH1
Handshake sink function (acceptor handshake), full capability
L4
Listener function, full capability, de-addressed by MTA.
T6
Talker function, full capability, ability to respond to serial poll, deaddressed by MLA
SR1
Service request function (Service Request), full capability
PP1
Parallel poll function, full capability
RL1
Remote/Local switch over function, full capability
DC1
Reset function (Device Clear), full capability
DT1
Trigger function (Device Trigger), full capability
Interface Messages
Interface messages are transmitted to the instrument on the data lines, with the attention line being active
(LOW). They serve to communicate between controller and instrument.
Universal Commands
Universal commands are encoded in the range 10 through 1F hex. They are effective for all instruments
connected to the bus without pervious addressing.
Command
QuickBASIC
command
Effect on the instrument
DCL
(Device Clear)
IBCMD (controller%,
CHR$(20))
Aborts the processing of the commands just received and sets the
command processing software to a defined initial state. Does not
change the instrument settings.
IFC
(Interface Clear)
IBSIC (controller%)
Resets the interfaces to the default setting.
LLO
(Local Lockout)
IBCMD (controller%,
CHR$(17))
The LOC/IEC ADDR key is disabled.
SPE
(Serial Poll
Enable)
IBCMD (controller%,
CHR$(24))
Ready for serial poll.
SPD
(Serial Poll
Disable)
IBCMD (controller%,
CHR$(25))
End of serial poll.
PPU
(Parallel Poll
Unconfigure)
IBCMD
(controller%,
CHR$(21))
End of the parallel-poll state.
Addressed Commands
Addressed commands are encoded in the range 00 through 0F hex. They are only effective for
instruments addressed as listeners.
Operating Manual 1303.6580.32-01
498
R&S® ZVL
HW Interfaces
Rear Panel Connectors
Command
QuickBASIC
command
Effect on the instrument
GET
(Group
Execute
Trigger)
IBTRG (device%)
Triggers a previously active device function (e.g. a sweep). The effect
of the command is the same as with that of a pulse at the external
trigger signal input.
GTL
(Go to Local)
IBLOC (device%)
Transition to the "Local" state (manual control).
PPC
(Parallel Poll
Configure)
IBPPC (device%,
data%)
Configures the instrument for parallel poll. Additionally, the QuickBASIC
command executes PPE/PPD.
SDC
(Selected
Device Clear)
IBCLR (device%)
Aborts the processing of the commands just received and sets the
command processing software to a defined initial state. Does not
change the instrument setting.
Instrument Messages
Instrument messages (commands) are transferred on the data lines of the GPIB bus while the ATN line is
not active. ASCII code is used.
Structure and syntax of the instrument messages are described the SCPI Reference chapter. The chapter
also provides a detailed description of all messages implemented by the analyzers.
VXI-11 Interface
The VXI–11 standard is based on the RPC protocol which in turn relies on TCP/IP as the
network/transport layer. The TCP/IP network protocol and the associated network services are preconfigured. TCP/IP ensures connection–oriented communication, where the order of the exchanged
messages is adhered to and interrupted links are identified. With this protocol, messages cannot be lost.
Remote control of an instrument via a network is based on standardized protocols which follow the OSI
reference model (see Fig. below).
Based on TCP/UDP, messages between the controller and the instrument are exchanged via open
network computing (ONC) – remote procedure calls (RPC). With XDR (VXI–11), legal RPC messages are
known as VXI–11 standard. Based on this standard, messages are exchanged between the controller and
the instrument. The messages are identical with SCPI commands. They can be organized in four groups:
Operating Manual 1303.6580.32-01
499
R&S® ZVL
HW Interfaces
Rear Panel Connectors
•
Program messages (control command to the instrument)
•
Response messages (values returned by the instrument)
•
Service request (spontaneous queries of the instrument)
•
Low–level control messages (interface messages)
A VXI–11 link between a controller and an instrument uses three channels: core, abort and interrupt
channel. Instrument control is mainly performed on the core channel (program, response and low–level
control messages). The abort channel is used for immediate abort of the core channel; the interrupt
channel transmits spontaneous service requests of the instrument. Link setup itself is very complex. For
more details refer to the VXI–11 specification.
The number of controllers that can address an instrument is practically unlimited in the network. In the
instrument, the individual controllers are clearly distinguished. This distinction continues up to the
application level in the controller, i.e. two applications on a computer are identified by the instrument as
two different controllers.
The controllers can lock and unlock the instrument for exclusive access. This regulates access to the
instrument of several controllers.
VXI-11 Interface Messages
On the Ethernet link, the interface messages are called low–level control messages. These messages can
be used to emulate interface messages of the IEC/IEEE bus.
Command
Effect on the instrument
&ABO
(Abort)
Aborts processing of the commands just received.
&DCL
(Device Clear)
Aborts processing of the commands just received and sets the
command processing software to a defined initial state. Does not
change the instrument setting.
Operating Manual 1303.6580.32-01
500
R&S® ZVL
HW Interfaces
Rear Panel Connectors
>L
(Go to Local)
Transition to the "Local" state (manual control).
>R
(Go to
Remote)
Transition to the "Remote" state (remote control).
&GET
(Group
Execute
Trigger)
Triggers a previously active device function (e.g. a sweep). The effect
of the command is the same as with that of a pulse at the external
trigger signal input.
&LLO
(Local
Lockout)
Disables switchover from remote control to manual control by means
of the front panel keys.
&POL
(Serial Poll)
Starts a serial poll.
&NREN
(Not Remote
Enable)
Enables switchover from remote control to manual control by means of
the front panel keys.
RSIB Interface Functions
This section lists all functions of the DLL "RSIB.DLL" or "RSIB32.DLL" or "librsib.so", which
allow to produce control applications.
•
Variables
•
Interface Functions
Variables ibsta, iberr, ibcntl
Same as with the National Instruments interface, successful execution of a command can be checked by
means of the variables ibsta, iberr and ibcntl. To this end, references to the three variables are
transferred to all RSIB functions. In addition, the status word ibsta is returned as a function value by all
functions.
Status word ibsta
All functions send back a status word that provides information on the status of the RSIB interface. The
following bits are defined:
Bit name
Bit
Hex code
Description
ERR
15
8000
This bit is set if an error occurs during a function call. If this bit is set,
iberr contains an error code which specifies the error.
TIMO
14
4000
This bit is set if a timeout occurs during a function call. A timeout may
occur in the following situations:
- while waiting for an SRQ with the function RSDLLWaitSrq().
- if no acknowledgment is received for data sent to an instrument with
RSDLLibwrt() or RSDLLilwrt().
- if no response from server to a data request with function
RSDLLibrd() or RSDLLilrd().
CMPL
8
0100
Operating Manual 1303.6580.32-01
This bit is set if the reply of the IEC/IEEE-bus parser is completely read.
If a reply of the parser is read with the function RSDLLilrd() and the
buffer length is not sufficient, the bit is cleared.
501
R&S® ZVL
HW Interfaces
Rear Panel Connectors
Error variable iberr
If the ERR bit (8000h) is set in the status word, iberr contains an error code that specifies the error. The
RSIB has error codes of its own independent of the National Instrument interface.
Error
Error
code
Description
IBERR_DEVICE_REGISTER
1
RSIB.DLL cannot register any new device.
IBERR_CONNECT
2
Link to the device has failed.
IBERR_NO_DEVICE
3
An interface function was called with an invalid device handle.
IBERR_MEM
4
No free memory available.
IBERR_TIMEOUT
5
Timeout has occurred.
IBERR_BUSY
6
The RSIB interface is blocked by a function not yet completed.
Windows is not blocked, for example, by function RSDLLibrd() if
data is still to be transmitted in response to this function. In this
case a new call is possible. Further calls are however rejected by
RSIB.DLL with error code IBERR_BUSY.
IBERR_FILE
7
Error in reading from or writing to a file.
IBERR_SEMA
8
Error upon creating or assigning a semaphore (only under Unix)
Count variable - ibcntl
The variable ibcntl is updated with the number of bytes transmitted on every read and write function call.
Overview of Interface Functions
The library functions are adapted to the interface functions of National Instruments for GPIB programming.
The functions supported by the libraries are listed in the following table.
Function
Description
RSDLLibfind()
Provides a handle for access to a device.
RSDLLibwrt()
Sends a zero-terminated string to a device.
RSDLLilwrt()
Sends a certain number of bytes to a device.
RSDLLibwrtf()
Sends the contents of a file to a device.
RSDLLibrd()
Reads data from a device into a string.
RSDLLilrd()
Reads a certain number of bytes from a device.
RSDLLibrdf()
Reads data from a device into a file.
RSDLLibtmo()
Sets timeout for RSIB functions
RSDLLibsre()
Switches a device into the local or remote state
RSDLLibloc()
Temporarily switches a device into the local state
RSDLLibeot()
Enables/disables the END message for write operations.
RSDLLibrsp()
Performs a serial poll and provides the status byte.
RSDLLibclr
Sends the command SDC (Device Clear) to the instrument.
RSDLLibonl()
Sets the device On/Offlline.
RSDLLTestSrq()
Checks whether a device has generated an SRQ.
RSDLLWaitSrq()
Waits until a device generates an SRQ.
Operating Manual 1303.6580.32-01
502
R&S® ZVL
HW Interfaces
Rear Panel Connectors
RSDLLSwapBytes
Swaps the byte sequence for binary numeric display (only required for non-Intel
platforms)
Description of Interface Functions
RSDLLibfind()
The function provides a handle for access to the device with the name udName.
VB format:
Integer
Function RSDLLibfind (ByVal udName$, ibsta%, iberr%, ibcntl&) As
C-format:
short WINAPI RSDLLibfind( char far *udName, short far *ibsta,
short far *iberr, unsigned long far *ibcntl)
C format (Unix): short RSDLLibfind( char *udName, short *ibsta, short *iberr,
unsigned long *ibcntl)
IP address of device
Parameter:
udName
Example:
ud = RSDLLibfind ("89.10.38.97", ibsta, iberr, ibcntl)
The function must be called prior to all other functions of the interface.
As return value, the function provides a handle that must be indicated in all functions for access to the
device. If the device with the name udName is not found, the handle has a negative value.
RSDLLibwrt
This function sends data to the device with the handle ud.
VB format:
Function RSDLLibwrt (ByVal ud%, ByVal Wrt$, ibsta%, iberr%,
ibcntl&) As Integer
C format:
short WINAPI RSDLLibwrt( short ud, char far *Wrt, short far
*ibsta, short far *iberr, unsigned long far *ibcntl )
C format (Unix): short RSDLLibwrt( short ud, char *Wrt, short *ibsta, short
*iberr, unsigned long *ibcntl )
Parameter:
ud
Wrt
Example:
Device handle
String sent to the device.
RSDLLibwrt(ud, "SENS:FREQ:STAR?", ibsta, iberr, ibcntl)
This function allows to send setting and query commands to the measuring instruments. Whether the data
is interpreted as a complete command can be set using the function RSDLLibeot().
RSDLLilwrt
This function sends Cnt bytes to a device with the handle ud.
VB format:
Function RSDLLilwrt (ByVal ud%, ByVal Wrt$, ByVal Cnt&, ibsta%,
iberr%, ibcntl&) As Integer
Operating Manual 1303.6580.32-01
503
R&S® ZVL
HW Interfaces
Rear Panel Connectors
C format:
short
WINAPI RSDLLilwrt(
short
ud,
char
far
*Wrt,
unsigned long Cnt, short far *ibsta, short far *iberr, unsigned long far
*ibcntl)
C format (Unix): short RSDLLilwrt( short ud, char *Wrt, unsigned long Cnt, short
*ibsta, short *iberr, unsigned long *ibcntl)
Parameter:
Example:
Device handle
ud
Wrt
String sent to the GPIB parser.
Cnt
Number of bytes sent to the device.
RSDLLilwrt (ud, '......', 100, ibsta, iberr, ibcntl)
Like RSDLLibwrt() this function sends data to a device. The only difference is that binary data can be
sent as well. The length of the data is not determined by a zero-terminated string, but by the indication of
Cnt bytes. If the data is to be terminated with EOS (0Ah), the EOS byte must be appended to the string.
RSDLLibwrtf
This function sends the contents of a file file$ to the device with the handle ud.
VB format:
Function RSDLLibwrtf (ByVal ud%, ByVal file$, ibsta%, iberr%,
ibcntl&) As Integer
C format:
short WINAPI RSDLLibwrt( short ud, char far *Wrt, short far
*ibsta, short far *iberr, unsigned long far *ibcntl )
C format (Unix): short RSDLLibwrt( short ud, char *Wrt, short *ibsta, short
*iberr, unsigned long *ibcntl )
Parameter:
Device handle
ud
File the contents of which are sent to the device.
file
Example:
RSDLLibwrtf(ud, "C:\db.sav", ibsta, iberr, ibcntl)
This function allows to send setting and query commands to the measuring instruments. Whether the data
is interpreted as complete command can be set using the function RSDLLibeot().
RSDLLibrd()
The function reads data from the device with the handle ud into the string Rd.
VB format:
Function
ibcntl&) As Integer
RSDLLibrd
(ByVal
ud%,
ByVal
Rd$,
ibsta%,
C format:
short WINAPI RSDLLibrd( short ud, char
*ibsta, short far *iberr, unsigned long far *ibcntl )
far
C format (Unix):
short RSDLLibrd(
*iberr, unsigned long *ibcntl )
short
Parameter:
ud
Rd
Example:
short
ud,
char
*Rd,
*Rd,
iberr%,
short
*ibsta,
far
short
Device handle
String into which the read data is copied.
RSDLLibrd (ud, Rd, ibsta, iberr, ibcntl)
This function fetches the responses of the GPIB parser to a query.
Operating Manual 1303.6580.32-01
504
R&S® ZVL
HW Interfaces
Rear Panel Connectors
In the case of Visual Basic programming, a string of sufficient length must be generated before. This can
be done during the definition of the string or using the command Space$().
Generation of a string of the length 100:
- Dim Rd as String * 100
- Dim Rd as String
Rd = Space$(100)
RSDLLilrd
This function reads Cnt bytes from the device with the handle ud.
VB format:
Function RSDLLilrd (ByVal ud%, ByVal Rd$, ByVal Cnt&, ibsta%,
iberr%, ibcntl&) As Integer
C format:
short WINAPI RSDLLilrd( short ud, char far *Rd, unsigned long
Cnt, short far *ibsta, short far *iberr, unsigned long far *ibcntl )
C format (Unix): short RSDLLilrd( short ud, char *Rd, unsigned long Cnt, short
*ibsta, short *iberr, unsigned long *ibcntl )
Parameter:
ud
cnt
string Rd.
Example:
Device handle
Maximum number of bytes copied from the DLL into the target
RSDLLilrd (ud, RD, 100, ibsta, iberr, ibcntl)
Like the function RSDLLibrd(), this function reads data from a device. The only difference is that in this
case the maximum number of bytes to be copied into the target string Rd can be indicated by means of
Cnt. This function prevents writing beyond the end of the string.
RSDLLibrdf()
Reads data from the device with the handle ud into the file file.
VB format:
Function RSDLLibrdf (ByVal ud%, ByVal file$, ibsta%, iberr%,
ibcntl&) As Integer
C format:
short WINAPI RSDLLibrd( short ud, char far *file, short far
*ibsta, short far *iberr, unsigned long far *ibcntl )
C format (Unix): short RSDLLibrd( short ud, char *file, short *ibsta, short
*iberr, unsigned long *ibcntl )
Parameter:
ud
file
Example:
Device handle
File into which the read data is written.
RSDLLibrdf (ud, "c:\db.sav", ibsta, iberr, ibcntl)
The file name may as well include a drive or path specification.
RSDLLibtmo
This function defines the timeout for a device. The default value for the timeout is set to 5 seconds.
Operating Manual 1303.6580.32-01
505
R&S® ZVL
HW Interfaces
Rear Panel Connectors
VB format:
Function RSDLLibtmo (ByVal ud%, ByVal tmo%, ibsta%, iberr%,
ibcntl&) As Integer
C format:
short WINAPI RSDLLibtmo( short ud, short tmo, short far *ibsta,
short far *iberr, unsigned long far *ibcntl )
C format (Unix): short RSDLLibtmo( short ud, short tmo, short *ibsta, short
*iberr, unsigned long *ibcntl )
Parameter:
Device handle
ud
Timeout in seconds
tmo
Example:
RSDLLibtmo (ud, 10, ibsta, iberr, ibcntl)
RSDLLibsre
This function sets the device to the 'LOCAL' or 'REMOTE' state.
VB format:
Function
ibcntl&) As Integer
RSDLLibsre
(ByVal
ud%,
ByVal
v%,
ibsta%,
iberr%,
C format:
short WINAPI RSDLLibsre( short ud, short v, short far *ibsta,
short far *iberr, unsigned long far *ibcntl)
C format (Unix):
short RSDLLibsre(
*iberr, unsigned long *ibcntl)
Parameter:
short
ud,
short
v,
short
*ibsta,
short
Device handle
ud
State of device
v
0 - local
1 - remote
Example:
RSDLLibsre (ud, 0, ibsta, iberr, ibcntl)
RSDLLibloc
This function temporarily switches the device to the 'LOCAL' state.
VB format:
Integer
Function RSDLLibloc (ByVal ud%, ibsta%, iberr%, ibcntl&) As
C format:
short WINAPI RSDLLibloc( short ud, short far *ibsta, short far
*iberr, unsigned long far *ibcntl)
C format (Unix):
short
unsigned long *ibcntl)
RSDLLibloc(
short
ud,
short
*ibsta,
short
*iberr,
Device handle
Parameter:
ud
Example:
RSDLLibloc (ud, ibsta, iberr, ibcntl)
After switchover to LOCAL state, the instrument can be manually operated via the GUI. On the next
access to the instrument by means of one of the functions of the library the instrument is switched again to
the REMOTE state.
Operating Manual 1303.6580.32-01
506
R&S® ZVL
HW Interfaces
Rear Panel Connectors
RSDLLibeot
This function enables or disables the END message after write operations.
VB format:
Function
ibcntl&) As Integer
RSDLLibeot
(ByVal
ud%,
ByVal
v%,
ibsta%,
iberr%,
C format:
short WINAPI RSDLLibsre( short ud, short v, short far *ibsta,
short far *iberr, unsigned long far *ibcntl)
C format (Unix):
short RSDLLibsre(
*iberr, unsigned long *ibcntl)
Parameter:
short
ud,
short
v,
short
*ibsta,
short
Device handle.
ud
0 - no END message
v
1 – send END message
Example:
RSDLLibeot (ud, 1, ibsta, iberr, ibcntl)
If the END message is disabled, the data of a command can be sent with several successive calls of write
functions. The END message must be enabled again before sending the last data block.
RSDLLibrsp
This function performs a serial poll and provides the status byte of the device.
VB format:
Integer
Function RSDLLibrsp(ByVal ud%, spr%, ibsta%, iberr%, ibcntl&) As
C format:
short WINAPI RSDLLibrsp( short ud, char far* spr, short far
*ibsta, short far *iberr, unsigned long far *ibcntl)
C format (Unix): short RSDLLibrsp( short ud, char *spr, short *ibsta, short
*iberr, unsigned long *ibcntl)
Parameter:
Device handle
ud
Pointer to status byte
spr
Example:
RSDLLibrsp(ud, spr, ibsta, iberr, ibcntl)
RSDLLibclr
Sends the command SDC (Device Clear) to the instrument.
VB format:
Integer
Function RSDLLibclr(ByVal ud%, spr%, ibsta%, iberr%, ibcntl&) As
C format:
short WINAPI RSDLLibclr( short ud, short far *ibsta, short far
*iberr, unsigned long far *ibcntl)
C format (Unix):
short
unsigned long *ibcntl)
RSDLLibclr(
short
ud,
short
short
*iberr,
Device handle
Parameter:
ud
Example:
RSDLLibclr(ud, ibsta, iberr, ibcntl)
Operating Manual 1303.6580.32-01
*ibsta,
507
R&S® ZVL
HW Interfaces
Rear Panel Connectors
RSDLLibonl
This function switches the device to 'online' or 'offline' mode. When it is switched to ‘offline’ mode, the
interface is released and the device handle becomes invalid. By calling RSDLLibfind again, the
communication is set up again.
VB format:
Function
ibcntl&) As Integer
RSDLLibonl
(ByVal
ud%,
ByVal
v%,
ibsta%,
iberr%,
C format:
short WINAPI RSDLLibonl( short ud, short v, short far *ibsta,
short far *iberr, unsigned long far *ibcntl)
C format:
short RSDLLibonl( short ud, short v, short *ibsta, short *iberr,
unsigned long *ibcntl)
Parameter:
Device handle
ud
Device state
v
0 - local
1 - remote
Example:
RSDLLibonl(ud, 0, ibsta, iberr, ibcntl)
RSDLLTestSRQ
This function checks the status of the SRQ bit.
VB format:
Function
ibcntl&) As Integer
RSDLLTestSrq
(ByVal
ud%,
Result%,
ibsta%,
iberr%,
C format:
short WINAPI RSDLLTestSrq( short ud, short far *result, short
far *ibsta, short far *iberr, unsigned long far *ibcntl)
C format (Unix): short RSDLLTestSrq( short ud, short *result, short *ibsta,
short *iberr, unsigned long *ibcntl)
Parameter:
Device handle
ud
result
Reference
the status of the SRQ bit.
returns
to
an
integer
value
in
which
the
library
0 - no SRQ
1 - SRQ active, device requests service
Example:
RSDLLTestSrq (ud, result%, ibsta, iberr, ibcntl)
This function corresponds to the function RSDLLWaitSrq. The only difference is that RSDLLTestSRQ
immediately returns the current status of the SRQ bit, whereas RSDLLWaitSrq waits for an SRQ to occur.
RSDLLWaitSrq
This function waits until the device triggers an SRQ with the handle ud.
VB format:
Function
ibcntl&) As Integer
C format:
RSDLLWaitSrq
(ByVal
ud%,
Result%,
ibsta%,
iberr%,
short WINAPI RSDLLWaitSrq( short ud, short far *result, short
Operating Manual 1303.6580.32-01
508
R&S® ZVL
HW Interfaces
far *ibsta, short far *iberr, unsigned long far *ibcntl)
C format (Unix): short RSDLLWaitSrq( short ud, short *result, short *ibsta,
short *iberr, unsigned long *ibcntl)
Parameter:
ud
Device handle
result
Reference to an integer value in which the library returns the
status of the SRQ bit.
0 - No SRQ has occurred during the timeout
1 - SRQ has occurred during the timeout
Beispiel:
RSDLLWaitSrq( ud, result, ibsta, iberr, ibcntl );
The function waits until one of the following two events occurs.
The measuring instrument triggers an SRQ
No SRQ occurs during the timeout defined with RSDLLibtmo()
RSDLLSwapBytes
This function changes the display of binary numbers on non-Intel platforms.
VB format:
Not provided at present since it is required only on non-Intel platforms.
C format:
void WINAPI RSDLLSwapBytes( void far *pArray, const long size,
const long count)
C format (Unix):
count)
Parameter:
Example:
void RSDLLSwapBytes( void *pArray, const long size, const long
pArray
Array in which modifications are made
size
Size of a single element in pArray
count
Number of elements in pArray
RSDLLSwapBytes( Buffer, sizeof(float), ibcntl/sizeof(float))
This function swaps the display of various elements from Big Endian to Little Endian and vice versa. It is
expected that a coherent storage area of elements of the same file type (size byte) is transferred to
pArray. This function has no effect on Intel platforms.
Different types of processor architecture store data in different byte sequences. For example, Intel
processors store data in the reverse order of Motorola processors. Comparison of byte sequences:
Byte sequence
Big Endian
Little Endian
Use in
Motorola processors,
network standard
Intel processors
Operating Manual 1303.6580.32-01
Display in memory
Most significant byte at
least significant address
Least significant byte at
least significant address
Description
The most significant byte is at the left
end of the word.
The most significant byte is at the right
end of the word.
509
R&S® ZVL
Index
Index
*.msi .................................................................................. 37
Calibration Manager ........................................................ 202
*CLS ................................................................................ 281
Cartesian diagrams ......................................................... 163
[SENSe<Ch>
Center...................................................................... 184, 423
]AVERage ................................................................. 398
Channel
]FREQuency ............................................................. 423
data flow ..................................................................... 60
]SWEep
menu ......................................................................... 184
POINts.................................................................... 441
programming examples ............................................ 469
2-port ............................................................................... 158
Sweep ............................................................... 217, 228
2-port S-parameters ........................................................ 158
Channel ............................................................................. 58
a1 .................................................................................... 158
Channel ........................................................................... 184
a2 .................................................................................... 158
Channel ........................................................................... 217
AC power........................................................................... 21
Channel ........................................................................... 228
Add Channel.................................................................... 230
Channel Cal .................................................................... 202
Add Diag. Area ................................................................ 230
Channel Manager............................................................ 230
Add Diag. Area + Trace................................................... 230
Circuit Model ................................................................... 212
Add Standard .................................................................. 212
Close ............................................................................... 105
ATN ................................................................................. 496
Command
Attention .......................................................................... 496
common ............................................................ 260, 293
Average Factor................................................................ 398
device-specific .......................................................... 260
Average On ..................................................... 217, 228, 398
stucture and syntax................................................... 260
b1 .................................................................................... 158
CONDition ....................................................................... 272
b2 .................................................................................... 158
Continuous Sweep .................................................. 217, 228
Bandfilter
Control bus ...................................................................... 496
search ....................................................................... 141
Control lines (GPIB bus) ................................................. 496
Bandfilter ......................................................................... 141
Control menu................................................................... 105
Bandpass Search Ref to Marker ..................................... 141
Coupled Markers ............................................................. 314
Bandpass Search Ref to Max.......................................... 141
Crosstalk ................................................................. 217, 228
Bandstop Search Ref to Marker ...................................... 141
Data bus (GPIB) .............................................................. 496
Bandstop Search Ref to Min ........................................... 141
Data entry
Bandwidth........................................................................ 185
keys............................................................................. 15
Basic Concepts ................................................................. 57
Data entry.......................................................................... 49
Block data format ............................................................ 263
Data Flow
Boolean parameter.......................................................... 263
S-parameters .............................................................. 60
Buffered Sweep............................................................... 486
wave quantities ........................................................... 60
Cal pool ........................................................................... 202
Data Flow .......................................................................... 60
Calibration
Data processing ................................................................ 60
guided ....................................................................... 191
Data trace........................................................................ 113
measurement examples.............................................. 98
Data Valid........................................................................ 496
program example ...................................................... 483
DAV ................................................................................. 496
wizard........................................................................ 191
DCL,SDC......................................................................... 281
Calibration ....................................................................... 483
Decouple ......................................................................... 230
Calibration kit................................................................... 204
DEFault ........................................................................... 263
Operating Manual 1303.6580.32-01
511
R&S® ZVL
Index
Define Segments..................................................... 221, 428
IEC SYSTEM BUS .......................................................... 496
Delete Channel................................................................ 230
IEC/IEEE Bus Interface ................................................... 496
Delete Segment............................................................... 221
Iecwin32.exe ................................................................... 253
Delta Mode ...................................................................... 314
IEEE 488.2 ...................................................................... 272
Diagram area
IFC................................................................................... 496
programming examples ............................................ 469
Impedance ........................................................................ 86
Diagram area............................................................... 58, 66
Import/Export Data .......................................................... 127
Diagrams
INFintiy ............................................................................ 263
Scaling ........................................................................ 51
Instrument Messages ...................................................... 496
Diagrams ........................................................................... 76
Instrument Setup ............................................................... 21
Dialogs (general description)............................................. 74
Instrument-control commands......................................... 260
Discrete Mode ................................................................. 314
Interface Clear................................................................. 496
Dispersion ....................................................................... 197
IP address
Display............................................................................... 12
assign.......................................................................... 33
DISPlay ........................................................................... 345
IST flag ............................................................................ 272
DOWN ............................................................................. 263
Keyboard
ENABle............................................................................ 272
EOI .................................................................................. 496
on-screen .................................................................... 49
Keys
Error queue ..................................................................... 272
data entry .................................................................... 15
ESE ................................................................................. 272
navigation ................................................................... 14
ESR ................................................................................. 272
on/standby .................................................................. 16
Examples
rotary knob .................................................................. 16
Reflection measurement ............................................. 40
setup ........................................................................... 12
Excursion......................................................................... 314
standby ....................................................................... 16
External Accessories......................................................... 30
Keys .................................................................................. 11
File menu......................................................................... 107
Keyword (SCPI command).............................................. 260
Firmware update ............................................................... 37
K-factor............................................................................ 162
Fixed Marker ................................................................... 314
LAN
Format ..................................................................... 163, 298
Frequency
remote control ............................................................. 33
Limit line
sweep........................................................................ 218
programming examples .............................................. 58
Frequency ......................................................................... 97
Limit line .......................................................................... 175
Front panel ........................................................................ 11
Limit line .......................................................................... 299
Front Panel Keys
Lin. Frequency .......................................................... 96, 441
control the GUI............................................................ 47
Linear 2-port
GPIB Address.................................................................. 253
stability ...................................................................... 162
GPIB bus interface .......................................................... 496
Linear 2-port .................................................................... 162
GPIB Explorer ................................................................. 253
Local Max ........................................................................ 314
Guided calibration ........................................................... 191
Local Min ......................................................................... 314
Handshake bus ............................................................... 496
Log. Frequency ......................................................... 96, 441
Help menu ....................................................................... 248
Lower limit ....................................................................... 175
Ibcntl................................................................................ 501
Maintenance...................................................................... 28
Iberr ................................................................................. 501
Marker
Ibsta................................................................................. 501
format........................................................................ 314
IEC BUS .......................................................................... 496
menu ................................................................. 150, 314
Operating Manual 1303.6580.32-01
512
R&S® ZVL
Index
programming examples .............................................. 58
Number of Points .................................... 217, 225, 228, 441
properties .................................................................. 314
NWA application................................................................ 29
switch on ................................................................... 314
Offset............................................................................... 197
Marker ............................................................................. 150
OPERation register ......................................................... 272
Marker Funct ................................................................... 135
Parameter selection ........................................................ 426
Mathematical trace .......................................................... 113
Peak Search.................................................................... 314
Max Freq ......................................................................... 212
Points
Max Search ..................................................................... 314
Define Segments ...................................................... 221
Maximize ......................................................................... 105
Number ..................................................................... 225
MAXimum........................................................................ 263
Points .............................................................................. 225
Meas Delay ..................................................................... 221
Power
MEAS key........................................................................ 158
Define Segments ...................................................... 221
Meas. Bandwidth............................................................. 399
PPE ................................................................................. 272
Meas. Delay .................................................................... 441
Preset .............................................................................. 281
Measure
Program example
S-parameters ............................................................ 158
calibration ................................................................. 483
Measure .......................................................................... 158
Program example ............................................................ 483
Measurement Speed
PTR ................................................................................. 272
Optimizing ................................................................... 97
Query............................................................................... 260
Measurement Speed ......................................................... 97
QUEStionable register .................................................... 272
Memory trace .................................................................. 113
Rear panel......................................................................... 19
Min Freq .......................................................................... 212
Ref. Position .................................................................... 345
Min Search ...................................................................... 314
Ref. Value ....................................................................... 345
Minimize .......................................................................... 105
Reference marker ........................................................... 314
MINimum ......................................................................... 263
Reference oscillator ........................................................ 427
Modify Standard .............................................................. 212
Reflection measurement
More Markers .................................................................. 314
Move................................................................................ 105
Example ...................................................................... 40
Remote Control
mu1-factor ....................................................................... 162
basic concepts .......................................................... 265
mu2-factor ....................................................................... 162
combine with manual control .................................... 257
NAN (not a number) ........................................................ 263
REN................................................................................. 496
Navigation keys ................................................................. 14
Replacing
Navigation tools (screen)................................................... 62
AC Fuse Board ........................................................... 21
NDAC .............................................................................. 496
Fuses .......................................................................... 21
New (setup) ..................................................................... 107
Reset Offsets .................................................................. 197
New Channel................................................................... 230
Reset Values
Next Channel................................................................... 230
Status Reporting System .......................................... 281
NINF (negative infinity).................................................... 263
Reset Values ................................................................... 253
No Cal ............................................................................. 202
Resolution bandwidth ...................................................... 399
Normal............................................................................. 158
Response (to queries) ..................................................... 260
NRFD .............................................................................. 496
Restore............................................................................ 105
NT named pipe................................................................ 253
Restrict Port Assignment................................................. 212
NT pipe A/B ..................................................................... 253
Rotary knob ....................................................................... 16
NTR ................................................................................. 272
RPC protocol ................................................................... 499
NTRansition..................................................................... 272
RSDLLibloc ..................................................................... 501
Operating Manual 1303.6580.32-01
513
R&S® ZVL
Index
RSDLLibonl ..................................................................... 501
meaning .............................................................. 85, 158
RSDLLibrd....................................................................... 501
measuring ................................................................. 158
RSDLLibrdf...................................................................... 501
multiport .................................................................... 158
RSDLLibrsp ..................................................................... 501
S-Params. From .............................................................. 212
RSDLLibsre ..................................................................... 501
SRE ................................................................................. 272
RSDLLibtmo .................................................................... 501
SRQ......................................................................... 272, 496
RSDLLibwrt ..................................................................... 501
Stability factors ................................................................ 162
RSDLLibwrtf .................................................................... 501
Standby
RSDLLilrd ........................................................................ 501
key .............................................................................. 16
RSDLLilwrt ...................................................................... 501
Standby ............................................................................. 16
RSDLLSwapBytes........................................................... 501
Start
RSDLLTestSRQ .............................................................. 501
Define Segments ...................................................... 221
RSDLLWaitSrq ................................................................ 501
Start......................................................................... 147, 184
RSIB address .................................................................. 253
Start................................................................................. 423
RSIB interface functions.................................................. 501
Start Cal .......................................................................... 189
S11/S12/S21/S22............................................................ 158
Startup procedure ............................................................. 29
Save As ........................................................................... 107
STatus Byte..................................................................... 272
Scale Div ......................................................................... 345
Status Registers .............................................................. 272
Scaling diagrams............................................................... 51
Status reporting system
Scc/SCD/Sdc/Sdd/Sds/Ssc/Ssd/Sss............................... 158
Reset Values ............................................................ 281
SCPI command structure ................................................ 260
STB ................................................................................. 272
SCPI commands ............................................................. 260
Stimulus
SCPI compatibility ........................................................... 253
SCPI Status Register
Structure ................................................................... 272
Define Segments ...................................................... 221
Stimulus................................................................... 175, 184
Stop
SCPI Status Register ...................................................... 272
Define Segments ...................................................... 221
Screen saver ..................................................................... 12
Stop ......................................................................... 147, 184
Search ..................................................................... 137, 314
Stop ................................................................................. 423
Search Range ................................................................. 314
String ............................................................................... 263
Segmented Frequency ..............................96, 217, 221, 228
Sweep History ................................................................. 486
Selectivity
SWEEP key............................................................. 217, 228
Define Segments ...................................................... 221
Sweep Time .............................................................. 97, 441
Service Request Enable.................................................. 272
Sweep Type ............................................................ 218, 426
Setup file ........................................................................... 37
SWR ................................................................................ 163
Setup keys......................................................................... 12
Syntax elements (SCPI, overview).................................. 263
Shut down ......................................................................... 29
System Configuration...................................................... 245
Single .............................................................................. 227
Target Search ................................................................. 314
Single Sweep .......................................................... 217, 228
Target Value.................................................................... 314
Size ................................................................................. 105
TCP/IP
Socket interface............................................................... 253
for VXI-11.................................................................. 499
Source Port ..................................................................... 441
Text parameter ................................................................ 263
Source Power.......................................................... 185, 218
Threshold ........................................................................ 314
Span ........................................................................ 184, 423
Trace
S-parameters
data flow...................................................................... 60
Operating Manual 1303.6580.32-01
data ........................................................................... 113
data flow ..................................................................... 60
514
R&S® ZVL
Index
mathematical............................................................. 113
Upper limit ....................................................................... 175
memory ..................................................................... 113
VXI-11
programming examples ............................................ 469
interface .................................................................... 499
Trace ................................................................................. 58
Windows XP ...................................................................... 36
Trace Funct ..................................................................... 113
Y-parameter ...................................................................... 87
Trace Statistics................................................................ 121
Zoom ............................................................................... 171
Tracking................................................................... 141, 314
Z-parameter............................................................... 86, 160
UP ................................................................................... 263
Operating Manual 1303.6580.32-01
515