1
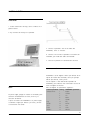
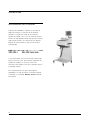
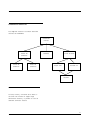
Software version
2.xx
HAMILTON MEDICAL AG
Product Management
Via Nova
CH-7403 Rhäzüns
Phone +41 81 660 60 10
Fax
+41 81 660 60 20
Order-Nr. 610 562/04
©
November '98
3
Authorized representative according to Medical
Device Directive:
HAMILTON DEUTSCHLAND GmbH
Postfach 110565
D-64220 Darmstadt
Germany
4
TABLE OF CONTENTS
TABLE OF CONTENTS ............................................................................... 5
IMPORTANT INFORMATION ................................................................... 6
WARNINGS .............................................................................................................................. 6
CAUTIONS ............................................................................................................................... 6
NOTES ..................................................................................................................................... 6
WARRANTY ............................................................................................... 7
LIMITED WARRANTY ................................................................................................................. 7
USER/OWNER RESPONSIBILITY .................................................................................................. 8
INSTALLATION INSTRUCTION ................................................................. 9
HARDWARE ............................................................................................................................. 9
NOTE ....................................................................................................................................... 9
SETTING THE INTERFACE .......................................................................................................... 9
OPERATING INSTRUCTION .................................................................... 10
NAVIGATING .......................................................................................................................... 10
SCREEN DIAGRAM ................................................................................................................. 11
NOTE ..................................................................................................................................... 11
USER’S INTRODUCTION ......................................................................... 12
THE MONITOR SCREEN ........................................................................................................... 12
THE WAVEFORM SCREEN ....................................................................................................... 13
REAL TIME ............................................................................................................................. 13
PRESSURE WAVEFORMS ......................................................................................................... 16
X-Y PLOTS ............................................................................................................................ 17
FLOW-VOLUME LOOP ............................................................................................................ 17
PRESSURE-VOLUME CURVE .................................................................................................... 18
CLINICAL APPLICATIONS ....................................................................... 19
VOLUME LOSS ...................................................................................................................... 19
SECRETIONS .......................................................................................................................... 19
AUTOPEEP ............................................................................................................................. 20
BRONCHODILATOR THERAPY .................................................................................................. 21
DYS-SYNCHRONY .................................................................................................................. 22
COMPLIANCE ........................................................................................................................ 23
PCV ....................................................................................................................................... 24
SCREEN OPTIONS AND CONFIGURATIONS .......................................... 26
OVERLAP ............................................................................................................................... 26
FREEZE PLOT .......................................................................................................................... 26
BUFFER .................................................................................................................................. 27
NOTE ..................................................................................................................................... 27
TECHNICAL DETAILS............................................................................... 28
SCHEMATIC DIAGRAMS ......................................................................................................... 28
TECHNICAL SPECIFICATIONS .................................................................................................. 28
ORDERING SPARE PARTS ........................................................................................................ 28
SERVICE ................................................................................................................................. 28
NOTES ...................................................................................................... 30
MANUAL DEL OPERADOR ........................................................... 31
5
IMPORTANT INFORMATION
LEONARDO S displays the ventilation parameters
and graphs received from the AMADEUS ventilator.
LEONARDO S is not a life supporting device.
The AMADEUS ventilator is intended for use by
properly trained personnel under the direct
supervision of licensed medical physicians only. In the
USA, federal law restricts this device to sale by or on
the order of a physician.
WARNINGS
If the patient ventilation screen fails any of the tests
described in this manual it must be removed from
service. DO NOT return the unit to service until all
repairs have been completed and all Functional Tests
are acceptable.
DO NOT use the LEONARDO S patient ventilation
screen in conjunction with anaesthetics or in an
explosive atmosphere.
DO NOT connect or disconnect the LEONARDO S to
the AMADEUS ventilator while the ventilator is
connected to a patient.
LEONARDO S patient ventilation screen. The screen
must be located a sufficient distance from
transmitting devices to avoid electromagnetic
interferences causing interruption.
CAUTIONS
DO NOT attempt to sterilize the LEONARDO S
patient ventilation screen.
NOTES
Pressures are indicated on the LEONARDO S patient
ventilation screen in cmH2O. The pressure unit
millibar (mbar) is used by some institutions instead of
cm H2O. Since 1 mbar equals 1.016 cmH2O they may
be used interchangeably at the pressures normally
used on patients.
1 hPa = 1 mbar ~ 1 cmH2O
DO NOT attempt service procedures. Service may
only be performed by HAMILTON MEDICAL
authorized personnel. Only original manufacturer or
manufacturer recommended parts and accessories
should be used.
Any attempts to modify the hardware or software of
this device without the express written approval of
HAMILTON MEDICAL will void all warranties and
liabilities.
The LEONARDO S ventilation screen is in
compliance with the IEC 601-1-2 regarding EMC.
DO NOT use cellular phones or other active
transmitting devices in the immediate vicinity of the
6
This sign on the LEONARDO S patient ventilation
screen means that there is more
information concerning that
operational feature in this Manual.
The original LEONARDO S patient
ventilation screen shipping container
must be retained to prevent damage if the instrument
ever needs to be shipped. If this carton has been
misplaced, contact your official HAMILTON MEDICAL
distributor for a replacement.
Follow all local, state and federal regulations with
respect to environmental protection when disposing
the electronic device or parts of it.
WARRANTY
LIMITED WARRANTY
Furthermore, in no event shall HAMILTON MEDICAL
be liable for incidental or consequential damages,
either direct or contingent.
HAMILTON MEDICAL warrants each PRODUCT sold
by it to be free from defects in material and
workmanship for a period of one year from the date
of delivery ex works when operated properly under
conditions of normal use for which the product is
intended.
Disposable items are not covered under this warranty.
This Limited Warranty shall be void and not apply:
Disposable items are single or limited use products
normally required for proper operation of PRODUCT.
If any defect in a PRODUCT sold occurs during the
warranty period, HAMILTON MEDICAL, at its option,
will repair or replace the defective PRODUCT or the
respective part of it unless agreed to in writing by
HAMILTON MEDICAL or unless specific laws in
certain countries foresee an extended product
liability.
THIS WARRANTY DESCRIBED IN THIS AGREEMENT
IS IN LIEU OF ANY AND ALL OTHER WARRANTIES.
THE PARTiES AGREE THAT THE IMPLIED
WARRANTIES OF MERCHANTABILITY AND FITNESS
FOR A PARTICULAR PURPOSE AND ALL OTHER
WARRANTIES, EXPRESS OR IMPLIED, ARE
EXCLUDED FROM THIS AGREEMENT.
EXCEPT AS STATED ABOVE, HAMILTON MEDICAL
SHALL NOT BE LIABLE FOR ANY DAMAGES, CLAIMS
OR LIABILITIES INCLUDING, BUT NOT LIMITED TO,
PERSONAL BODILY INJURY, OR INCIDENTAL,
CONSEQUENTIAL, OR SPECIAL DAMAGES.
HAMILTON MEDICAL shall have no obligations or
liabilities in connection with the PRODUCT other than
as provided herein, including without limitation any
and all obligations and/or liabilities for alleged
negligence, or for strict liability.
a. If the PRODUCT has not been installed and
connected in accordance with the instructions
furnished by HAMILTON MEDICAL;
b. If no evidence is present that the occurrence of
damage/repair is within the certified warranty period;
c. If the serial number has been altered, effaced or
removed and there is no bill of sale or evidence to
verify the PRODUCT‘s purchase date; or
d. To defects arising from misuse, negligence or
accidents, or from repair, adjustment, modification or
replacement made outside HAMILTON MEDICAL‘s
factories or other than an authorized service centre or
authorized service representative.
e. To product that has been mechanically or
electronically altered without specific written
authorization from HAMILTON MEDICAL.
Replacements and/or repairs furnished under this
Limited Warranty do not carry a new warranty, but
carry only the unexpired portion of the original
Limited Warranty.
The terms of this Limited Warranty may not be varied
by any person, whether or not purporting to represent
or act on behalf of HAMILTON MEDICAL.
To obtain service under this Limited Warranty,
claimant must promptly notify the nature of the
problem and the serial number and date of purchase
of the PRODUCT. If HAMILTON MEDICAL determines
that the repair is required under this Limited
Warranty, the defective PRODUCT or respective part
must be returned to HAMILTON MEDICAL‘s factory
or authorized service centre. Item(s) must be properly
packaged, insured and shipped to HAMILTON
MEDICAL, postage/freight paid by claimant.
7
USER/OWNER RESPONSIBILITY
The HAMILTON MEDICAL PRODUCTS are designated
to function as described in the Operator’s Manual.
The user(s) of this equipment should not use parts
that have failed, exhibit excessive wear, are
contaminated, or otherwise ineffective. The
PRODUCTS should not be modified.
The user/owner of these PRODUCTS shall have the
sole responsibility and liability for any injury to
persons or damage to property (including the
PRODUCT) resulting from:
a. Operation not in accordance with the supplied
operating instructions;
b. Maintenance not in accordance with authorized
maintenance/operating instructions;
c. Maintenance by anyone other than a factory
authorized service representative;
d. Modification of the equipment or accessories;
e. Use of damaged, unauthorized, or unapproved
components and accessories.
8
INSTALLATION INSTRUCTION
HARDWARE
1. Install the mounting arm as shown on the drawing
beside.
2. Tighten mounting arm to the screen.
3. Plug screen on either side of the AMADEUS as
shown.
4. Connect the RS 232 of the screen with the
ventilator interface by the delivered cable.
5. Connect screen to main.
SETTING THE INTERFACE
LEONARDO S will take some default settings from
the ventilator interface card, i.e. default language,
date and time.
Please see AMADEUS operator’s manual chapter 11
for instructions how to set the interface.
Following parameters should be set:
Interface parameter Setting
Ventilator ID No.
NOTE
1
English
2
German
3
n.n.
4
Italian
5
Spanish
xx
Day
Month
xx
Month
Year
xx
Year
Day
Switch on the ventilator first to transfer date, time
and language setting immediately.
Switching on LEONARDO S first will result in English
as default and delayed transfer of date and time.
LEONARDOS parameter
Hours
xx
Hours
Minutes
xx
Minutes
9
OPERATING INSTRUCTION
NAVIGATING
LEONARDO is constructed in a very fluid manner.
Changing from one screen to another is
accomplished with the keyboard function keys, F1
through F8. The menu at the bottom of each screen
defines the options controlled by each function key.
The numbers within each menu block refer to the
corresponding keyboard function key.
If you've selected the wrong function key, press the
Esc key (top left on the computer keyboard). The Esc
key cancels keyboard selections or changes the
current screen to the previous screen.
In most areas of the LEONARDO program, the
function key F7 will return the display to the start, the
Monitor Screen.
10
SCREEN DIAGRAM
The diagram is showing the basic structure of the
LEONARDO software.
Monitor screen
Utility
Plot Trends
Trend curves
Trend data
Waveform screen
Real Time
X-Y plot
Buffer
NOTE
All data date, time andbuffers are only stored as
long as the screen is connected to the main and
will be lost with power loss.
11
USER’S INTRODUCTION
Mechanical ventilation involves the flow of gas in
response to altering pressure in order to effect a
change in lung volume. Monitoring flow, pressure
and volume enhances the ability of the clinician to
optimize ventilatory support.
LEONARDO monitors and displays flow, pressure and
volume delivered by the Hamilton Medical VEOLAR
and AMADEUS series ventilators. The display may be
customized based on the clinician's needs and
preferences. The clinician can display all waveforms
simultaneously or choose to isolate on a single
breath.
The monitored data is digitally saved and archived
under the patient's name. It may be retrieved and
reviewed at any time in the future.
THE MONITOR SCREEN
LEONARDO displays the Monitor Screen at
the initiation of the program. The Monitor
Screen digitally displays patient data as well as
alarm and ventilation parameter settings.
Control Settings
indicate the position
of the ventilator
control knobs. These
are the patient's set
ventilation
parameters.
Alarm Settings
show the
position of the
alarm control
knobs.
This pocket guide is intended to introduce the
clinician to respiratory mechanics monitoring,
including the graphical display of flow, pressure and
volume waveforms.
Active alarms
will be
displayed in
this box.
Monitored Parameters
displays and
continuously updates
monitored and
calculated data.
Use the keyboard function keys F1 through F8 to
activate the menu options.
12
THE WAVEFORM SCREEN
REAL TIME
LEONARDO uses the Waveform Screen to graph
flow, pressure and volume. Real Time refers to a
parameter plotted against time. X-Y Plot refers to a
parameter plotted against a different parameter.
Pressing F6 START from the Monitor Screen selects
the following waveform option screen.
The Waveform screen displays tidal volumes,
flowrates and pressures. Real time refers to the
graphic display as the breath occurs. For example, as
the flow sensor measures volume entering the
patient's airway, LEONARDO graphs the volume
tracing simultaneously.
Real Time
Select the desired
parameter with the
F1-F4 Menu keys.
Pressing the key once
selects the parameter,
press again to cancel
the selection
Selected parameters to
be plotted will be
displayed in the
adjacent box and
highlighted in the
menu.
X-Y Plot
The selected
parameter(s) are
graphed in real time.
Timing notches are
placed at 1 second
increments.
The versatility of the LEONARDO program allows the
operator to customize the screen to individual needs.
Volume, flow and pressure may be viewed
simultaneously, individually or in combination.
Additionally, time sweeps, etc., can be configured to
the user's needs.
Press F6 START to go to the Waveform Screen.
13
The Waveform Screen provides the clinician with a
great deal of information.
Ventilator and spontaneous respiratory rates, peak
flow rates, inspiratory and expiratory times, peak
pressures, I:E ratios, the presence of autoPEEP,
imposed work of breathing, bronchodilator response
and pulmonary mechanics can all be extrapolated
from LEONARDO waveform screens.
Inspiratory Expiratory
Time
Time
Inhaled Tidal
Volume
Peak Flow
Rate
Peak airway
pressure
AUTOSCALE is used to configure the displayed
graphs. When selected, AUTOSCALE will scale each
parameter tracing so it incorporates 80% of the
available vertical block space.
MONITOR is used to return to the Monitor Screen.
Exhaled Tidal
Volume
Flow Pattern
AutoPEEP
detection
Spontaneous
efforts
PEEP
LEONARDO allows the clinician to view real time
waveforms individually or in combination.
The waveform display screen contains the parameters
which are selected for viewing.
CHANGE PARAM. is used to select volume, flow or
pressure tracings.
CHANGE SCALE is used to configure the viewing
screen.
BUFFER OPERAT. is a screen save operation. It allows
the user to save or delete waveform screens.
OVERLAP is used to superimpose tracings atop one
another.
FREEZE PLOT is used to freeze a complete screen.
This gives the user the ability to obtain specific digital
readings of the displayed parameter(s).
14
Volume is highlighted by pressing the F1 key. Pressing
the F1 key a second time will clear the Volume
selection. Similarly, Flow (F2), Pressure (F3) or Opt
Pres (F4) are selected and cleared in the same
manner.
Once the desired parameters have been selected,
press F6 START to proceed to the Waveform Screen.
LEONARDO graphs the volume measured by the flow
sensor. This provides the clinician with precise volume
measurements entering and exiting the patient's
airway. Figure 1 shows a volume tracing of a
mandatory ventilator breath. There are no
spontaneous breaths present. Figure 2 shows
spontaneous breaths interspersed with mandatory
SIMV breaths.
Figure 1
Figure 3 illustrates a typical Flow waveform of a
mandatory ventilator breath. Inspiratory and
expiratory flow are separated horizontally.
The shape of the inspiratory flow waveform is a
function of the set ventilator flow pattern or by the
patient's spontaneous breathing pattern. Figures 3
and 4 illustrate mandatory ventilator breaths and
patient spontaneous breaths.
Figure 3
Insp. Flow
Peak Flow
Exp Flow
Figure 2
Spontaneous
Volumes
Set Ventilator
Volumes
Figure 4
Ventilator breath
Spont. breaths
12
15
PRESSURE WAVEFORMS
The shape of a pressure waveform varies with
ventilator/patient characteristics. The set flow pattern,
peak flow rate, patient circuit, artificial airway and
impedance characteristics of the patient's airway all
contribute to the shape of a pressure waveform.
Figure 5 illustrates how varied flow patterns alter the
shape of the pressure trace.
Figure 6 is a pressure waveform of a mandatory
ventilator breath. The peak pressure was 25 cm H2O
and the PEEP level was 6 cm H2O. Figure 7 illustrates
spontaneous breaths interspersed with SIMV breaths.
Figure 7
Ventilator
Spont.
Trigger efforts
Square
Accelerating
Decelerating
Sine
Flow Pattern
Pressure
Trace
Figures 6 and 7 are LEONARDO pressure tracings of
ventilator and spontaneous breaths.
Figure 6
Peak pressure
PEEP
16
X-Y PLOTS
X-Y Plots graph parameter against parameter. This
differs from Real Time graphs which plot parameter(s)
on the vertical axis and time on the horizontal axis.
X-Y Plots can be Flow-Volume, Pressure-Volume or
Flow-Pressure tracings.
Figures 8 and 9 are X-Y Plots of flow and volume,
Flow-Volume Loops. Flow is on the vertical axis and
volume is on the horizontal axis. Movement of the
tracing on a vertical plane (up or down) records
inspiratory and expiratory flow. Horizontal movement
(side to side) traces inhaled and exhaled volumes.
Flow-Volume loops are useful in determining the
efficacy of bronchodilator therapy.
FLOW-VOLUME LOOP
Figure 8
Inspiration
Exhalation
Figure 8 is a Flow-Volume loop of a volume limited
ventilator breath. The shape of the flow tracing
indicates the set ventilator flow pattern is a square
wave and the tidal volume 600 ml. The peak flow
rate is 35 lpm.
Figure 9
Inspiratory
Flow
Expiratory
Flow
Inspiratory
Volume
Expiratory
Volume
Figure 9 is a Flow-Volume loop of an unsupported
spontaneous breath. Note the shape of the inspiratory
flow pattern is somewhat sinusoidal. The peak flow
rate occurs slightly before mid-inspiration which is
typical of a spontaneous breath through an artificial
airway.
17
PRESSURE-VOLUME CURVE
Mandatory ventilator breath
Figure 11
Pressure-Volume curves illustrate the relationship
between the delivered tidal volume and the related
pressure changes. LEONARDO traces the tidal volume
and airway pressure during inspiration and
exhalation. The relationship of pressure to volume
reflects compliance, resistance and imposed work of
breathing. Figure 10 illustrates a typical mandatory
ventilator breath.
Exhalation
Inspiration
Figure 10
Tidal Volume
Peak Pressure
Spontaneous breath
Start
Inspiration
Exhalation
Mandatory ventilator breaths produce a tracing which
begins with positive pressure. Positive pressure
creates a counterclockwise rotation (Figure 11).
Figure 12 illustrates the clockwise rotation of negative
pressure created by a patient's
spontaneous breath.
18
CLINICAL APPLICATIONS
VOLUME LOSS
SECRETIONS
LEONARDO uses the flow sensor for its volume
monitoring. Therefore, volume lost distal to the
patient's artificial airway is easily detected and
quantified.
Secretions may produce a sawtooth effect on the
expiratory trace of a flow-volume loop.
Figure 13 depicts volume lost due to a persistent cuff
leak, bronchopulmonary fistulae, etc. The inhaled
tidal volume is 700 ml. The exhaled volume plateaus
at 200 ml, which means
Figure 14 depicts a flow-volume loop with a
pronounced sawtooth pattern during exhalation.
Jubran, Tobin et al reported the presence of a
Figure 14
Figure 13
that 700 ml entered the patient's airway but only 500
ml returned. Volume lost due to the cuff leak was 200
ml.
Note the only parameter selected for display was
volume. LEONARDO allows the user to adapt the
screen to the clinical importance of each patient
situation.
sawtooth pattern strongly suggested the likelihood of
endobronchial secretions while the absence of the
sawtooth pattern indicated secretions were unlikely to
be present.
The ability to use graphic waveforms to predict when
suctioning is required may reduce the frequency of
tracheal suctioning and its associated hazards.
19
AUTOPEEP
Figure 16
Detecting autoPEEP is simplified with the use of
LEONARDO.
AutoPEEP is the presence of inadvertent positive
pressure within the lung at the end of exhalation.
Graphically, autoPEEP manifests itself by the presence
of flow at the end of an expiratory phase.
Figure 15 shows no autoPEEP as illustrated by the
expiratory flow returning to zero during the expiratory
cycle.
Figure 15
Expiratory flow does not return to zero
Spontaneous breathing may make detecting
autoPEEP difficult due to the patient's breathing
pattern. Figure 17 illustrates a spontaneously
breathing patient. The expiratory flow tracing doesn't
completely return to zero flow at end exhalation. This
is a common presentation during spontaneous
breathing and may not indicate the presence of
autoPEEP.
Figure 17
Expiratory flow returns to zero
Conversely, the expiratory flow in Figure 16 does not
return to zero prior to the next inspiratory cycle
indicating the presence of autoPEEP.
20
Spontaneously breathing patients with autoPEEP will
often forcibly reduce the autoPEEP by
"decompression". Decompression refers to the
patient exhaling more volume than inhaled.
Decompression is identified graphically by the volume
tracing periodically dropping below baseline.
Figure 18 illustrates a decompression breath by a
spontaneously breathing patient.
Figure 18
BRONCHODILATOR THERAPY
Flow-volume loops may be helpful gauging the
effects of bronchodilator therapy. Increased airway
diameter in response to bronchodilator therapy may
produce higher expiratory flow rates.
Figure 19 is a flow-volume loop depicting an
improved expiratory flow trace following
bronchodilator therapy.
Figure 19
Decompression
Breath 1
Breath 2
The regular appearance of lung decompression in a
spontaneously breathing patient suggests the
presence of autoPEEP. The addition of preset PEEP
may benefit the spontaneously breathing patient
where autoPEEP is suspected.
Using the OVERLAP function , two flow volume loops
are graphed on the same screen. Breath 1 shows a
peak expiratory flow rate of 60 lpm and a flat
expiratory flow loop indicating high resistance.
Breath 2 shows a peak expiratory flow of 80 lpm and
an expiratory flow loop indicating reduced resistance.
21
decelerating flow pattern will provide a 50% higher
peak flow rate compared to a square wave at the
same inspiratory time.
DYS-SYNCHRONY
Figure 21
Patient ventilator dys-synchrony occurs when the
ventilator fails to match the patient's spontaneous
breathing pattern.
Dys-synchrony may be due to excessive patient
ventilatory drive, autoPEEP or by an incorrectly set
ventilator. Patient ventilator dys-synchrony
increases the patient's work of breathing and can
lead to fatigue and failure to wean.
Figure 20 illustrates patient ventilator dyssynchrony due to an incorrectly set ventilator.
Figure 20
Ventilator Peak Flow
Patient Peak Flow
The patient's spontaneous peak flow rates exceed
the ventilator peak flow rates during the mandatory
ventilator breaths. The significant drop in pressure
(shaded areas) indicates an increase in the patient's
work of breathing.
Compare the spontaneous breaths to the mandatory
ventilator breaths. When the patient triggers the
SIMV breaths, the ventilator responds with a square
wave flow pattern at a preset flowrate of 40 lpm.
The patient is attempting to inhale at 60 - 70 lpm,
creating a large negative pressure deflection (shaded
areas) and excessive imposed work of breathing.
Figure 21 represents action taken to correct patient
ventilator dys-synchrony. The SIMV breaths were
reconfigured to a decelerating flow pattern. A
22
When the patient triggers the SIMV breaths, the
ventilator responds with the higher peak inspiratory
flow rate of the decelerating curve. The resulting
synchrony between the patient and the ventilator
reduces the imposed work of breathing.
COMPLIANCE
Figure 23
Pressure Volume curves depict the relationship
between generated pressure and delivered
volume. Compliance changes can be viewed with
pressure volume curves. Figure 22 is a pressure
volume curve of an SIMV breath.
Figure 22
Compliance changes during volume ventilation result
in a change in pressure. Compliance changes during
pressure ventilation result in a change in volume.
Figure 24 illustrates changes in volume produced by
changes in compliance.
Figure 24
Points ABC represent inspiration, points CDA
represent exhalation.
The slope AC represents total compliance.
An improvement in compliance would result in the
slope AC becoming more upright, while a decrease
in compliance, Figure 24, results in the flattening of
the AC slope.
Utilizing the compliance slope of pressure volume
curves can be an advantageous method of
determining "Best PEEP".
23
Figure 26
PCV
Decreased
Compliance
PCV is a pressure constant, volume variable mode of
ventilation. During PCV, inspiratory flow is
automatically regulated to maintain a constant
airway pressure. The tidal volume is variable and can
change dramatically with fluctuations in the patient's
lung compliance, airway resistance and with
ventilator circuit dynamics.
Increased
Compliance
Breath 3
Constant Pressure
Figure 25
Pressure Constant
Figure 25 graphically illustrates PCV. Pressure rises
rapidly at the initiation of inspiration and is
maintained at the preset level for the duration of
inspiratory cycle. Flow is continuously regulated by
the ventilator's computer to maintain the preset
pressure.
The initial peak flow is high to
rapidly
achieve the preset pressure,
flow is then regulated to
maintain the pressure for the
duration of inspiration.
Fluctuations in the patient's compliance will produce
tidal volume changes during PCV.
24
Figure 26 illustrates how compliance can increase
and decrease the delivered tidal volume during PCV.
A drop in compliance during the second breath
reduced the tidal volume. The flow tracing shows
flow returning to zero halfway through the inspiratory
cycle. The tidal volume was delivered during the first
half of the inspiratory cycle, the remaining half is
effectively a breath hold.
An increase in compliance produced a larger
delivered tidal volume during Breath #3. The flow
tracing doesn't quite return to zero at end
inspiration. Increasing inspiratory time will produce a
slightly larger tidal volume until pressure equilibration
occurs.
Adjusting the inspiratory time may also change the
delivered tidal volume during PCV. This occurrence
can be predicted by observing the flow tracing.
When pressure equilibration has occurred between
the ventilator and the patient's airway, inspiratory
flow will decelerate to zero and volume delivery will
cease. Increasing the inspiratory time when pressure
equilibration has been reached will not result in an
increased tidal volume.
Figure 27
Increasing Tidal Volume
Increasing Inspiratory Time
Conversely, if pressure equilibration has not occurred,
increasing or decreasing inspiratory time will result in
an increased or decreased tidal volume. Figure 27
illustrates how volume will change in response to
inspiratory time when pressure equilibration has not
occurred.
Pressure control ventilation can be an assist control
mode or an SIMV mode. PCV-CMV is an assist
control mode. Any spontaneous efforts by the patient
will trigger full, pressure controlled breaths at the
preset pressure and inspiratory time.
Figure 28
PCV-SIMV is an IMV mode of pressure ventilation. A
number of pressure controlled breaths are preset.
Between the pressure controlled breaths, the patient
may breathe spontaneously at volumes and
inspiratory times based on the patient's efforts.
Additionally, the spontaneous breaths may be
pressure supported. Figure 28 illustrates PCV-SIMV.
The spontaneous breaths are pressure supported at
10 cm H2O. Note the similarity in the decelerating
flow and the square pressure waveform between the
pressure controlled and the pressure supported
breaths.
25
SCREEN OPTIONS AND CONFIGURATIONS
OVERLAP
FREEZE PLOT
F4 OVERLAP. Superimposes tracings atop one
another. The standard (without OVERLAP highlighted)
LEONARDO graphic trace will erase any existing trace
as it sweeps across the screen. Selecting OVERLAP
will retain the current graphic trace and superimpose
the next trace above the existing trace. Figure 29
illustrates the OVERLAP function.
F5 FREEZE. Freezes the graphics screen and obtains
digital data on the displayed parameters.
When F5 FREEZE PLOT is pressed, the screen cursor
will continue until it completes its screen sweep.
When the cursor reaches the end of the screen, the
computer freezes the existing image and recalls a
moveable cursor as depicted in Figure 30.
Figure 29
Figure 30
Before and after bronchodilator flow-volume curves
were superimposed on one another. OVERLAP can
assist the clinician in establishing bronchodilator
therapy efficacy during mechanical ventilation.
The right and left keyboard arrows can maneuver the
cursor over the frozen image. Each parameter will
display a numeric box which will record the value
from wherever the cursor is placed.
F5 FREEZE PLOT. Freezes the viewing screen.
Freeze plot can be useful for quantitating autoPEEP
and pulmonary function maneuvers such as vital
capacity and inspiratory force.
26
BUFFER
BUFFER OPERAT. Allows the clinician to store and
retrieve graphic waveforms. Function key F3 of the
waveforms menu screen accesses the save and
retrieve options.
Pressing F3 BUFFER OPERAT. immediately freezes the
waveform screen and recalls the BUFFER OPERAT.
submenu.
To save the current screen, press F4, SAVE BUFFER. A
text block will appear asking for a name for the
saved screen. A name may be any combination of 8
numbers. To retrieve a saved waveform screen, press
function key F2, LOAD BUFFER. A text block identical
to the SAVE BUFFER text block will appear asking for
the identification of the saved screen. Type in the
name exactly as it appears in the block.
F5 DEL. BUFFER. Removes unwanted buffer files from
the memory. To retrieve a saved waveform screen,
press function key F2, LOAD BUFFER. A text block
identical to the SAVE BUFFER text block will
appear asking for the name of the saved screen.
Type in the name exactly as it appears in the block.
All stored data will be lost the moment the screen is
switched off.
NOTE
When a waveform screen has been saved,
LEONARDO saves all the volume, pressure and flow
data available. This allows LEONARDO to configure
any waveform screen with the saved data. For
example, if the waveform screen saved was a flowvolume curve, it can be retrieved as a flow-volume
curve, a pressure-volume curve, a real-time volume
tracing or as any waveform format. To retrieve a
buffer file in a specific waveform format, first
configure the screen to the desired waveform and
then use F2 LOAD BUFFER to retrieve the file.
27
TECHNICAL DETAILS
SCHEMATIC DIAGRAMS
Please send the screen to HAMILTON MEDICAL for
repair.
For any other cases these two diagrams shall be
helpful for diagnostics.
TECHNICAL SPECIFICATIONS
10.4’’ colour screen, 640 x 480 pixel
RS 232 C, galvanic isolated
U 100 - 240 VAC + 10%, 47 - 63 Hz
P 25 VA
W x D x H 350 x 120 x 250 mm
weight approx. 6 kg
Environmental conditions:
Operating
5 to 35°C, 10 to 90% r.H.
Transport and storage
-20 to 60°C, 10 to 90%
r.H.
ORDERING SPARE PARTS
Please provide us with serial number of screen ( SN)
and the detailed product code such as :
„SV-Kabel primär 32 12 427“.
SERVICE
Do not open the metal covers of the
screen. Running the instrument with
opened metal cover may cause
dangerous voltages.
Return it to HAMILTON MEDICAL for
repairs.
28
29
NOTES
30
ÍNDICE
ÍNDICE ......................................................................................................... 31
INFORMACIÓNIMPORTANTE .......................................................................... 32
ADVERTENCIAS ..................................................................................................................... 32
PRECAUCIONES .................................................................................................................... 32
NOTAS .................................................................................................................................. 32
GARANTÍA ................................................................................................... 33
GARANTÍA LIMITADA ............................................................................................................ 33
RESPONSABILIDAD DEL USUARIO O PROPIETARIO ................................................................. 34
INSTALACIÓN ............................................................................................... 35
HARDWARE ........................................................................................................................... 35
NOTA .................................................................................................................................... 35
CONFIGURACIÓN DE LA INTERFAZ ........................................................................................ 35
OPERACIÓN ................................................................................................. 36
DESPLAZAMIENTO POR LAS OPCIONES ................................................................................. 36
DIAGRAMA DE PANTALLAS ................................................................................................... 37
NOTA .................................................................................................................................... 37
INSTRUCCIONES PARAEL USUARIO .................................................................. 38
LA PANTALLA DE MONITOR ................................................................................................... 38
LA PANTALLA FORMA DE ONDA ........................................................................................... 39
TIEMPO REAL ........................................................................................................................ 39
FORMAS DE ONDA DE PRESIÓN ............................................................................................ 42
TRAZADOS X-Y .................................................................................................................... 43
BUCLE DE FLUJO Y VOLUMEN ............................................................................................... 43
CURVA DE PRESIÓN Y VOLUMEN .......................................................................................... 44
APLICACIONESCLÍNICAS ................................................................................ 45
PÉRDIDA DE VOLUMEN ......................................................................................................... 45
SECRECIONES ....................................................................................................................... 45
AUTOPEEP ............................................................................................................................. 46
TERAPIA DE DILATACIÓN BRONQUIAL ................................................................................... 47
FALTA DE SINCRONÍA ............................................................................................................ 48
COMPLIANCIA ...................................................................................................................... 49
PCV ....................................................................................................................................... 50
OPCIONES Y VALORES DE LA PANTALLA ........................................................... 52
OVERLAP (SUPERPOSICIÓN) ................................................................................................... 52
FREEZE PLOT (CONGELAR) ..................................................................................................... 52
BUFFER (HISTORIAL) ............................................................................................................... 53
NOTA .................................................................................................................................... 53
DETALLESTÉCNICOS ...................................................................................... 54
DIAGRAMAS DE CONEXIONES .............................................................................................. 54
ESPECIFICACIONES TÉCNICAS ............................................................................................... 54
PEDIDOS DE RECAMBIOS ...................................................................................................... 54
SERVICIO TÉCNICO ................................................................................................................ 54
NOTAS ......................................................................................................... 56
31
INFORMACIÓN IMPORTANTE
LEONARDO S no es un aparato de soporte vital.
LEONARDO S está destinado solamente para su uso
como complemento de los ventiladores AMADEUS.
El ventilador AMADEUS está destinado para su uso
por personal entrenado adecuadamente y bajo la
supervisión directa de médicos debidamente
acreditados. En los EE.UU., la normativa federal
limita la venta de este equipo sólo a médicos, o bajo
pedido de personal facultativo.
PRECAUCIONES
NO intente esterilizar la pantalla de ventilación de
pacientes LEONARDO S.
NOTAS
ADVERTENCIAS
Si la pantalla de ventilación de pacientes no supera
cualquiera de las pruebas descritas en este manual,
debe desconectar el equipo del paciente. NO vuelva
a utilizar el equipo hasta que se hayan realizado
todas las reparaciones y hasta que se superen todas
las pruebas funcionales.
NO utilice la pantalla de ventilación de pacientes
LEONARDO S junto con anestésicos ni en atmósferas
con riesgo de explosión.
NO conecte ni desconecte el LEONARDO S del
ventilador AMADEUS mientras el ventilador esté
conectado al paciente.
NO intente realizar operaciones de servicio técnico.
Sólo las personas autorizadas por HAMILTON
MEDICAL pueden hacer este tipo de operaciones.
Deben utilizarse sólo recambios originales del
fabricante o piezas recomendadas por el fabricante.
Cualquier intento de modificar el hardware o el
software de este dispositivo sin la autorización
expresa de HAMILTON MEDICAL anulará todas las
garantías y responsabilidades del fabricante.
NO utilice teléfonos móviles ni ningún otro dispositivo
de transmisión activa en las cercanías de la pantalla
de ventilación de pacientes LEONARDO S.
32
Las presiones de la pantalla de ventilación de
pacientes LEONARDO S se indican en cmH2O.
Algunas instituciones utilizan el milibar (mbar) en
lugar de cmH2O. Dado que 1 mbar equivale a 1,016
cmH2O, puede utilizar una unidad de medida u otra,
para controlar las presiones utilizadas con los
pacientes.
1 hPa = 1 mbar ~ 1 cmH2O
Este signo en la pantalla de
ventilación de pacientes LEONARDO
S significa que este manual contiene
más información acerca de la
función operativa correspondiente.
Debe conservar el embalaje original de envío de la
pantalla de ventilación de pacientes LEONARDO S,
para impedir posibles daños si necesita transportar de
nuevo el equipo. Si no encuentra el embalaje,
póngase en contacto con el distribuidor oficial de
HAMILTON MEDICAL para solicitar un nuevo
embalaje.
GARANTÍA
GARANTÍA LIMITADA
HAMILTON MEDICAL garantiza que cada
PRODUCTO comercializado está libre de defectos de
materiales y mano de obra durante un periodo de un
año a partir de la fecha de salida de nuestras
instalaciones, si el producto se utiliza correctamente y
bajo las condiciones de uso para las que está
diseñado el producto. Los elementos desechables no
están cubiertos por esta garantía.
Los elementos desechables son los elementos de un
solo uso o de un uso por tiempo limitado que se
requieren para un funcionamiento correcto del
PRODUCTO.
Si se detecta algún defecto en un PRODUCTO
durante el periodo de garantía, HAMILTON MEDICAL
reparará o sustituirá (en función de lo que considere
oportuno) el PRODUCTO o el elemento defectuoso, si
no se acuerda lo contrario por escrito con HAMILTON
MEDICAL y, en algunos países, si las leyes
correspondientes regulan una responsabilidad
ampliada sobre el producto.
LA GARANTÍA EXPRESADA EN ESTE ACUERDO
SUSTITUYE A CUALQUIER OTRA GARANTÍA.
AMBAS PARTES ACUERDAN QUE SE EXCLUYEN DE
ESTE ACUERDO LAS GARANTÍAS IMPLÍCITAS DE
COMERCIABILIDAD O IDONEIDAD PARA UN FIN
DETERMINADO, ADEMÁS DE TODAS LAS DEMAS
GARANTÍAS, YA SEAN EXPRESAS O IMPLÍCITAS.
EXCEPTO EN LOS CASOS INDICADOS
ANTERIORMENTE, HAMILTON MEDICAL NO SE
HACE RESPONSABLE DE LOS DAÑOS,
RECLAMACIONES O RESPONSABILIDADES,
INCLUIDOS, PERO NO DE FORMA EXCLUSIVA, LOS
DAÑOS PERSONALES O LOS DAÑOS
ACCIDENTALES, CONSECUENTES O ESPECIALES.
HAMILTON MEDICAL no tiene ninguna obligación ni
ninguna responsabilidad en relación con el producto
aparte de las indicadas en este acuerdo, incluida,
pero no de forma exclusiva, cualquier obligación o
responsabilidad relativa a negligencias denunciadas u
otras responsabilidades estrictas.
Adicionalmente, HAMILTON MEDICAL no será
responsable bajo ninguna circunstancia de los daños
accidentales o consecuentes, ya sean directos o
indirectos.
Esta Garantía Limitada quedará anulada y no se
aplicará en los casos siguientes:
a. Si el PRODUCTO no se instala o no se conecta
acorde con las instrucciones proporcionadas por
HAMILTON MEDICAL.
b. Si no hay ninguna evidencia de que el daño o la
reparación se producen dentro del periodo de garantía
certificado;
c. Si el número de serie se ha alterado, borrado o
retirado y si no hay ningún documento de compra o
ninguna evidencia que permita verificar la fecha de
compra del PRODUCTO; o
d. En caso de defectos que resulten de un uso
inadecuado, negligencia o accidentes durante el
manejo, o de la reparación, el ajuste, la modificación o
las sustituciones realizadas fuera de las instalaciones de
HAMILTON MEDICAL o no realizadas por un centro de
servicio o un representante de servicio autorizado.
e. Si el producto se ha alterado mecánica o
electrónicamente sin una autorización específica de
HAMILTON MEDICAL por escrito.
Las sustituciones y/o reparaciones cubiertas por esta
Garantía Limitada no conllevan una nueva garantía,
sino que quedan cubiertas sólo durante el tiempo
restante de la Garantía Limitada original.
Ninguna persona puede variar los términos de esta
Garantía Limitada, ni en representación de HAMILTON
MEDICAL ni actuando en nombre de HAMILTON
MEDICAL.
Para obtener el servicio técnico cubierto por esta
Garantía Limitada, el usuario debe notificar
33
inmediatamente la naturaleza del problema, además
del número de serie y la fecha de compra del
PRODUCTO. Si HAMILTON MEDICAL determina que
se requiere una reparación acorde con esta Garantía
Limitada, el PRODUCTO defectuoso, o la pieza
defectuosa, deben devolverse a las instalaciones de
HAMILTON MEDICAL o a un centro de servicio
técnico autorizado. Estos elementos deben embalarse
adecuadamente, asegurarse y enviarse a HAMILTON
MEDICAL, a portes pagados.
RESPONSABILIDAD DEL USUARIO O PROPIETARIO
Los PRODUCTOS HAMILTON MEDICAL se han
diseñado para su utilización de la forma indicada en
el Manual del operador. El usuario o los usuarios de
este equipo no deben utilizar piezas que presenten
fallos, que estén desgastadas en exceso, que estén
contaminadas o que presenten defectos de cualquier
otro tipo. Los PRODUCTOS no deben modificarse.
El usuario o propietario de estos PRODUCTOS es el
único responsable de los daños personales o daños
materiales (incluidos los del propio PRODUCTO) en
los casos siguientes:
a. Si se utiliza el PRODUCTO de una forma distinta a
la especificada en las instrucciones de utilización;
b. Si las operaciones de mantenimiento se realizan
de una forma distinta de la especificada en las
instrucciones de mantenimiento y utilización;
c. Si quien realiza las operaciones de mantenimiento
no es un representante de servicio técnico autorizado
por el fabricante
d. Si se modifica el equipo o cualquiera de sus
accesorios;
e. Si se utilizan componentes y accesorios dañados,
no autorizados o inadecuados.
34
INSTALACIÓN
HARDWARE
1. Instale el brazo de montaje, como se indica en el
gráfico lateral.
2. Fije el brazo de montaje a la pantalla.
3. Conecte la pantalla a uno de los lados del
AMADEUS, como se muestra.
4. Conecte el RS 232 de la pantalla a la interfaz del
ventilador, por medio del cable suministrado.
5. Conecte la pantalla a la alimentación eléctrica.
CONFIGURACIÓN DE LA INTERFAZ
NOTA
En primer lugar, ponga en marcha el ventilador, para
transferir inmediatamente la fecha, la hora y la
selección de idioma.
Si pone en marcha el LEONARDO S en primer lugar,
se utilizará el inglés por defecto y la fecha y la hora
se transferirán más tarde.
LEONARDO S toma algunos valores por defecto de la
tarjeta de interfaz del ventilador, como por ejemplo
idioma por defecto, fecha y hora.
Vea el capítulo 11 del Manual del operador de
AMADEUS, para obtener más información acerca de
cómo configurar la interfaz.
Debe configurar los parámetros siguientes:
Interface parameter Setting
LEONARDOS parameter
Ventilator ID No.
1
English
2
German
3
n.n.
4
Italian
5
Spanish
Day
xx
Day
Month
xx
Month
Year
xx
Year
Hours
xx
Hours
Minutes
xx
Minutes
35
OPERACIÓN
DESPLAZAMIENTO POR LAS OPCIONES
El diseño de LEONARDO responde al concepto de
fluidez de manejo. La selección de las distintas
pantallas se realiza por medio de las teclas de
función del teclado, de F1 a F8. El menú de la parte
inferior de cada pantalla indica qué opciones controla
cada tecla de función. Los números de los distintos
bloques de menús indican a qué tecla de función
corresponden.
Si ha seleccionado una tecla de función equivocada,
pulse la tecla Esc (en la parte superior izquierda del
teclado del equipo). La tecla Esc cancela las
selecciones del teclado o pasa de la pantalla actual a
la pantalla anterior.
En la mayor parte de las áreas del programa
LEONARDO, la tecla de función F7 permite regresar
al principio, a la pantalla Monitor Screen (Pantalla
de monitor).
36
DIAGRAMA DE PANTALLAS
Este diagrama muestra la estructura básica del
software de LEONARDO.
Pantalla de
monitor
Gráfico de
tendencia
Curvas de
tendencia
Utilidad
Datos de
tendencia
Forma de onda
Tiempo real
Trazado X-Y
Historial
NOTA
La fecha, la hora y el historial de los datos se
conservan sólo mientras el equipo tenga
alimentación eléctrica y se pierden en caso de
caída del suministro eléctrico.
37
INSTRUCCIONES PARA EL USUARIO
La ventilación mecánica implica un flujo de gases en
respuesta a las variaciones de presión, con el fin de
conseguir un cambio de volumen de los pulmones.
La monitorización del flujo, la presión y el volumen
permite al personal médico optimizar el soporte de
ventilación.
LEONARDO monitoriza y muestra el flujo, la presión y
el volumen que proporcionan los ventiladores
Hamilton Medical de las series VEOLAR y AMADEUS.
La visualización puede personalizarse en función de
las necesidades y preferencias del personal clínico,
para ver simultáneamente todas las formas de onda
o para aislar una respiración determinada.
Los datos monitorizados se registran de forma digital
y se almacenan con el nombre del paciente. Puede
leerlos y revisarlos en cualquier momento.
LA PANTALLA DE MONITOR
LEONARDO muestra la pantalla Monitor Screen
(Pantalla de monitor) al iniciarse el programa. La
pantalla Monitor Screen muestra de forma digital
los datos del paciente y los ajustes de parámetros de
las alarmas y la ventilación.
En Control Settings
(Ajustes de control)
se indica la posición
de los mandos de
control del
ventilador, con los
parámetros
seleccionados para
el paciente.
En Alarm
Settings (Ajustes
de alarmas) se
indica la
posición de los
mandos de
control de
alarmas.
Esta guía de bolsillo tiene como objetivo presentar al
personal médico los conceptos de la monitorización
asistida de respiración, incluida la visualización
gráfica de formas de onda de flujo, presión y
volumen.
Las alarmas
activas
aparecen
aquí.
En Monitored
Parameters
(Parámetros
monitorizados) se
muestran los valores y
cálculos actualizados
de la monitorización.
Utilice las teclas de función de F1 a F8 para activar
las opciones de menú.
38
LA PANTALLA FORMA DE ONDA
TIEMPO REAL
LEONARDO utiliza la pantalla Waveform Screen
(Forma de onda) para mostrar de forma gráfica el
flujo, la presión y el volumen. Real Time (Tiempo
real) se refiere a un parámetro trazado en función del
tiempo. X-Y Plot (Trazado X-Y) se refiere a un
parámetro trazado en función de otro parámetro.
Pulse F6 START en la pantalla Monitor Screen
(Pantalla de monitor) para seleccionar la pantalla de
forma de onda que desee.
La pantalla Waveform screen (Forma de onda)
muestra los volúmenes tidales, las frecuencias de
flujo y las presiones. Real time (Tiempo real) es la
visualización gráfica mientras tiene lugar la
respiración. Por ejemplo, cuando el sensor de flujo
mide el volumen que penetra en las vías
respiratorias, LEONARDO traza simultáneamente el
volumen.
Tiempo real
Seleccione el
parámetro deseado
con F1 a F4. Pulse la
tecla una vez para
seleccionar el
parámetro y otra vez
para cancelarlo.
Los parámetros
seleccionados se
indican en el cuadro
adyacente y se
resaltan en el menú.
Trazado X-Y
Los parámetros
seleccionados se
trazan en tiempo real.
Aparecen marcas de
temporización en
cada segundo.
La versatilidad del programa LEONARDO permite al
operador personalizar la pantalla acorde con sus
necesidades. El volumen, el flujo y la presión pueden
verse simultáneamente, de forma individual o de
forma combinada. Por otro lado, el usuario puede
configurar los barridos de tiempo que necesite.
Pulse F6 START para ir a la pantalla Waveform
Screen (Forma de onda).
39
La pantalla Waveform Screen (Forma de onda)
proporciona una gran cantidad de información al
personal médico.
De esta pantalla pueden extrapolarse las frecuencias
de ventilación y de respiración espontánea, la
frecuencia de flujo de pico, los tiempos de inspiración
y expiración, las presiones de pico, las relaciones I:E,
la presencia de AutoPEEP, el trabajo de respiración
impuesto, la respuesta ante broncodilatadores y la
mecánica pulmonar.
MONITOR se utiliza para regresar a la pantalla
Monitor Screen (Pantalla de monitor).
Tiempo
Tiempo
inspiración expiración
Vol.tidal
inhalado
Vol.tidal
exhalado
Frec. pico
flujo
Pico presión
v.resp.
AUTOSCALE (Escala automática) se utiliza para
configurar los gráficos mostrados. Si se selecciona, la
escala automática cambia la escala de todos los
parámetros controlados, para que ocupe el 80% del
espacio vertical disponible.
Patrón flujo
Detección
AutoPEEP
Esfuerzo
espontáneo
PEEP
LEONARDO permite al personal clínico ver formas de
onda en tiempo real, de forma independiente o
combinada.
La pantalla de formas de onda contiene los
parámetros seleccionados para su visualización.
CHANGE PARAM. (Cambiar parámetro) se utiliza
para seleccionar el control de volumen, de flujo o de
presión.
CHANGE SCALE (Cambiar escala) se utiliza para
configurar la pantalla de visualización.
BUFFER OPERAT. (Operación de historial) es una
función de guardado de pantallas. Permite guardar o
eliminar pantallas de forma de onda.
OVERLAP (Superponer) se utiliza para superponer
varios controles.
El volumen se resalta con la tecla F1. Si pulsa F1 de
nuevo, se anula la selección de volumen. Flow (Flujo
- F2), Pressure (Presión - F3) u Opt Pres (Presión
operat. - F4) se activan y desactivan del mismo
modo.
FREEZE PLOT (Congelar trazado) se utiliza para fijar
una pantalla completa, lo que permite obtener
lecturas concretas de los parámetros mostrados.
Después de seleccionar los parámetros que desee,
pulse F6 START para pasar a la pantalla Waveform
Screen.
40
LEONARDO traza en un gráfico el volumen medido
por el sensor de flujo. De esta forma, el personal
médico dispone de una medida exacta del volumen
que entra y sale de las vías respiratorias del paciente.
La Figura 1 muestra un gráfico de volumen de
respiración forzada. No se producen respiraciones
espontáneas. La Figura 2 muestra las respiraciones
espontáneas, junto con las respiraciones SIMV
obligatorias.
La Figura 3 muestra una forma de onda típica del
flujo de una respiración forzada por el ventilador. Los
flujos de inspiración y expiración aparecen separados
horizontalmente.
La forma de onda de flujo de inspiración es una
función del patrón de flujo forzado o del patrón de
respiración espontánea del paciente. Las figuras 3 y 4
muestran las respiraciones forzadas por el ventilador
y las espontáneas del paciente.
Figura 1
Figura 3
Flujo insp.
Pico de
flujo
Flujo exp.
Figura 2
Volúmenes
espontáneos
Vol. forzados
seleccionados
Figura 4
Resp. forzada
Resp. espontánea
12
41
FORMAS DE ONDA DE PRESIÓN
El aspecto de una forma de onda de presión varía en
función de las características del ventilador y del
paciente. Los ajustes de patrón de flujo, pico de
frecuencia de flujo y características del circuito del
paciente, las vías respiratorias artificiales y la
impedancia de las vías respiratorias del paciente
influyen en el aspecto de las formas de onda de
presión.
La Figura 6 es una forma de onda de presión de una
respiración forzada. El pico de presión fue de 25 cm
H2O y el nivel de PEEP fue de 6 cm H2O. La Figura 7
muestra las respiraciones espontáneas junto con las
respiraciones SIMV.
Figura 7
Forzada
La Figura 5 muestra cómo los distintos patrones de
flujo influyen en el aspecto del gráfico de presión.
Espont.
Esfuerzos de activador
Patrón
de flujo
Cuadrado
Aceleración
Deceleración
Gráfico
de presión
Las figuras 6 y 7 son gráficos de presión de
LEONARDO, para respiraciones forzadas y
espontáneas.
Figura 6
Pico de presión
PEEP
42
Sinusoidal
TRAZADOS X-Y
Los trazados X-Y representan un parámetro en
comparación con otro. Esto difiere de los gráficos de
tiempo real, que muestran los parámetros en el eje
vertical y el tiempo en el eje horizontal. Los trazados
X-Y posibles son los de flujo frente a volumen,
presión frente a volumen o flujo frente a presión.
Las figuras 8 y 9 son los trazados X-Y de flujo y
volumen, los bucles de flujo frente a volumen. El flujo
se representa en el eje vertical y el volumen se
representa en el eje horizontal. El movimiento del
valor en el eje vertical (hacia arriba o hacia abajo)
indica el flujo de inspiración y expiración. El
movimiento horizontal (de izquierda a derecha y
viceversa) indica los volúmenes inhalados o
exhalados. Los bucles de flujo frente a volumen
resultan útiles para determinar la eficacia de las
terapias de dilatación bronquial.
BUCLE DE FLUJO Y VOLUMEN
Figura 8
Inspiración
Exhalación
La Figura 8 muestra un bucle de flujo frente a
volumen, con una respiración forzada con límite de
volumen. La forma del trazado de flujo indica que el
patrón de flujo seleccionado en el ventilador es una
onda cuadrada y que el volumen tidal es de 600 ml.
La frecuencia de pico de flujo es de 35 lpm.
Figura 9
Flujo de
inspiración
Flujo de
expiración
Volumen de
inspiración
Volumen de
expiración
La Figura 9 es un bucle de flujo frente a volumen, de
una respiración espontánea y no asistida. Observe
que el patrón de flujo de inspiración es sinusoidal
hasta cierto punto. La frecuencia de pico de flujo se
produce un instante antes del punto medio de la
inspiración, lo que es habitual en las respiraciones
espontáneas a través de vías respiratorias artificiales.
43
CURVA DE PRESIÓN Y VOLUMEN
Las curvas de presión y volumen muestran la relación
existente entre el volumen tidal suministrado y los
cambios de presión correspondientes. LEONARDO
controla el volumen tidal y la presión de las vías
respiratorias durante la inspiración y la exhalación. La
relación entre la presión y el volumen refleja la
compliancia, la resistencia y el esfuerzo respiratorio
impuesto. La Figura 10 muestra una respiración
forzada típica.
Respiración forzada
Figura 11
Exhalación
Inspiración
Figure 10
Volumen tidal
Pico de presión
Inicio
Respiración espontánea
Inspiración
Exhalación
Con las respiraciones forzadas se realiza un control
que comienza con la presión positiva, que crea una
rotación en sentido antihorario (Figura 11).
La Figura 12 ilustra la rotación en sentido horario de
la presión negativa creada por la respiración
espontánea de un paciente.
44
APLICACIONES CLÍNICAS
PÉRDIDA DE VOLUMEN
SECRECIONES
LEONARDO utiliza el sensor de flujo para la
monitorización de volumen. Por lo tanto se detecta
rápida y fácilmente el volumen perdido en relación
con el de las vías respiratorias artificiales.
Las secreciones pueden dar lugar a un efecto de
diente de sierra en la representación de la expiración
de un bucle de flujo y volumen.
La Figura 13 muestra la pérdida de volumen causada
por una fuga persistente en alguna junta, fístula
broncopulmonar, etc. El volumen tidal inhalado es de
700 ml. La meseta de volumen exhalado es de 200
ml, lo que significa
La Figura 14 muestra un bucle de flujo y volumen que
presenta un pronunciado patrón de diente de sierra
durante la exhalación. Jubran, Tobin y otros
informaron de que la presencia de
Figura 14
Figura 13
que entraron 700 ml en las vías respiratorias del
paciente pero sólo salieron 500 ml. La pérdida de
volumen causada por problemas de estanqueidad fue
de 200 ml.
Recuerde que el único parámetro seleccionado para
su visualización fue el volumen. LEONARDO permite
al usuario adaptar la pantalla a la importancia clínica
de la situación de cada paciente.
un patrón de diente de sierra puede suponer la
existencia de secreciones endobronquiales, mientras
que la ausencia de un patrón de diente de sierra
indicaba la poca probabilidad de que existieran
secreciones.
La posibilidad de utilizar formas de onda para
predecir si se requiere una succión puede reducir la
frecuencia de las succiones traqueales y los riesgos
que conllevan.
45
AUTOPEEP
La detección de AutoPEEP se simplifica con ayuda de
LEONARDO.
Figura 16
El AutoPEEP es la presencia de una presión positiva
en los pulmones al final de la exhalación.
Gráficamente, el AutoPEEP se manifiesta por la
presencia de un flujo al final de la fase de expiración.
El flujo de expiración no vuelve a cero
La Figura 15 no muestra AutoPEEP alguno, como
indica el descenso hasta cero del flujo de expiración
durante el ciclo expiratorio.
Figura 15
El flujo de expiración desciende hasta
cero
Por el contrario, el flujo de la Figura 16 no regresa a
cero antes del siguiente ciclo de inspiración, lo que
indica la presencia de AutoPEEP.
46
La respiración espontánea puede dificultar la
detección del AutoPEEP, debido al propio patrón de
respiración del paciente. El flujo de expiración no
desciende completamente a cero al final de la
exhalación. Ésta es una situación habitual durante la
respiración espontánea y puede no indicar la
presencia de AutoPEEP.
Figura 17
Los pacientes que respiran de forma espontánea con
AutoPEEP suelen forzar la reducción del nivel de
AutoPEEP por "descompresión". Esto quiere decir
que el paciente exhala más volumen del que inhala.
La descompresión se representa gráficamente por
medio de un nivel de volumen que desciende por
debajo de la línea de base.
La Figura 18 muestra una respiración de
descompresión en un paciente que respira
espontáneamente.
TERAPIA DE DILATACIÓN BRONQUIAL
Los bucles de flujo frente a volumen pueden ayudar a
controlar los efectos de las terapias de dilatación
bronquial. El aumento de diámetro de las vías
respiratorias como resultado de la terapia puede
producir un nivel mayor de flujo expiratorio.
La Figura 19 es un bucle de flujo y volumen que
representa una mejora del flujo de expiración,
después de una terapia de dilatación bronquial.
Figura 18
Figura 19
Descompresión
Respiración 1
Respiración 2
La aparición periódica de descompresión pulmonar
en un paciente que respira espontáneamente puede
indicar la presencia de AutoPEEP. La utilización del
ajuste predefinido PEEP puede favorecer al paciente
que respira espontáneamente, en los casos en que se
sospecha la presencia de AutoPEEP.
Con ayuda de la función OVERLAP (Superposición),
se representan dos bucles de volumen en la misma
pantalla. La respiración 1 muestra un flujo máximo
de expiración de 60 lpm y un bucle plano de flujo de
expiración que indica un nivel alto de resistencia.
La respiración 2 muestra un pico de flujo de
expiración de 80 lpm y un bucle de flujo de
expiración que indica una disminución de la
resistencia.
47
FALTA DE SINCRONÍA
La falta de sincronía se produce cuando el ventilador
no puede sincronizarse con el patrón de respiración
espontánea del paciente.
La falta de sincronía puede deberse a un nivel
excesivo de ventilación asistida, AutoPEEP o un
ventilador ajustado incorrectamente. La falta de
sincronía entre el paciente y el ventilador aumenta el
esfuerzo respiratorio del paciente y puede producir
fatiga y dificultades para respirar sin la respiración
forzada.
La Figura 21 representa la acción que se realiza para
corregir la falta de sincronía entre el paciente y el
ventilador. Las respiraciones de tipo SIMV se
configuran de nuevo para utilizar un patrón de flujo
con deceleración, que proporciona un pico de flujo
un 50% mayor, en comparación con una forma de
onda cuadrada con la misma duración de inspiración.
Figura 21
La Figura 20 muestra la falta de sincronía entre el
paciente y el ventilador, debido a un ventilador
ajustado incorrectamente.
Figura 20
Pico de flujo de
ventilador
Pico de flujo de
paciente
Los picos de flujo de respiración espontánea del
paciente están por encima de los picos de flujo de las
respiraciones forzadas por el ventilador. La gran caída
de presión (áreas sombreadas) indican un aumento
en el esfuerzo respiratorio del paciente.
Compare las respiraciones espontáneas con las
respiraciones forzadas. Si el paciente inicia las
respiraciones de tipo SIMV, el ventilador responde
con un patrón cuadrado de forma de onda de flujo,
con un flujo predefinido de 40 lpm. El paciente
intenta inhalar a 60 - 70 lpm, lo que crea una gran
presión negativa (áreas sombreadas) y un excesivo
esfuerzo respiratorio impuesto.
48
Cuando el paciente inicia una respiración de tipo
SIMV, el ventilador responde con el pico máximo de
flujo de inspiración de la curva de deceleración. La
sincronía resultante entre el paciente y el ventilador
reduce el esfuerzo respiratorio impuesto.
COMPLIANCIA
Figura 23
Las curvas de presión frente a volumen representan
la relación entre la presión generada y el volumen
suministrado. Estas curvas permiten detectar los
cambios en la compliancia. La Figura 22 es una
curva de volumen en una respiración de tipo SIMV.
Figura 22
Los cambios de compliancia que se producen durante
la ventilación por volumen dan lugar a cambios de
presión. Los cambios de compliancia durante la
ventilación por presión dan lugar a cambios de
volumen. La Figura 24 representa los cambios de
volumen que se producen por cambios en la
compliancia.
Los puntos A, B y C representan la inspiración. Los
puntos C, D y A representan la exhalación.
Figura 24
La rampa de A a C representa la compliancia total.
Una mejora en la compliancia haría que la rampa de
A a C estuviera más inclinada, mientras que una
reducción de la compliancia, como en la Figura 24,
reduce la inclinación de esta rampa.
La utilización de la rampa de compliancia de las
curvas de volumen puede ser un método adecuado
para determinar el "Mejor valor de PEEP".
49
Figura 26
PCV
El modo PCV es un modo de ventilación de presión
constante y volumen variable. Durante el modo PCV,
el flujo de inspiración se regula automáticamente
para mantener una presión constante en las vías
respiratorias. El volumen tidal es variable y puede
cambiar enormemente con las fluctuaciones de
compliancia en los pulmones del paciente, la
resistencia de las vías respiratorias o la dinámica del
circuito del ventilador.
Figura 25
Presión constante
La Figura 25 muestra gráficamente el modo PCV. La
presión aumenta rápidamente al inicio de la
inspiración y se mantiene en el nivel predefinido
durante el ciclo inspiratorio. El ventilador regula
constantemente el flujo para mantener la presión
predefinida.
El pico de flujo inicial es alto, para
conseguir la presión predefinida.
Posteriormente, el flujo se regula
para mantener la presión durante
todo el tiempo de inspiración.
Las fluctuaciones de compliancia del paciente dan
lugar a cambios de volumen durante el modo PCV.
50
Reducción de
compliancia
Aumento de
compliancia
Respiración 3
Presión constante
La Figura 26 muestra la forma en que la compliancia
puede aumentar o reducir el volumen tidal
suministrado durante el modo PCV. Una reducción de
la compliancia durante la segunda respiración reduce
el volumen tidal. El control de flujo muestra el
descenso del flujo hasta cero en la mitad del ciclo de
inspiración. El volumen tidal se suministró durante la
primera mitad del ciclo de inspiración, mientras que
la otra mitad es una espera respiratoria.
Un aumento en la compliancia da lugar a un mayor
volumen tidal suministrado durante la respiración nº
3. El control de flujo no desciende hasta cero al final
de la inspiración. El aumento del tiempo de
inspiración da lugar a un volumen tidal ligeramente
mayor, hasta que se equilibra la presión.
El ajuste del tiempo de inspiración también puede
dar lugar a un cambio en el volumen tidal
suministrado durante el modo PCV. Estos casos
pueden predecirse observando el volumen medido
Tras equilibrar la presión entre el ventilador y las vías
respiratorias del paciente, el flujo de inspiración se
decelera hasta cero y se interrumpe el suministro de
volumen. El aumento del tiempo de inspiración tras
equilibrar la presión no da lugar a un volumen tidal
mayor.
Figura 27
Aumento de volumen tidal
La Figura 28 ilustra el modo PCV-SIMV. Las
respiraciones espontáneas tienen un soporte de
presión de 10 cm H2O. Observe el parecido entre el
flujo de deceleración y la forma de onda cuadrada de
la presión, entre las respiraciones con control de
presión y las de soporte de presión.
Aumento de tiempo de inspiración
Por el contrario, si no se ha equilibrado la presión, el
aumento o la disminución del tiempo de inspiración
da lugar al aumento o la reducción del volumen tidal.
La Figura 27 muestra cómo cambia el volumen en
respuesta al tiempo de inspiración, antes de que se
equilibre la presión.
La ventilación con control de presión puede ser un
modo de control asistido o un modo SIMV. El modo
PCV-CMV es un modo de control asistido. Los
esfuerzos espontáneos dan lugar a respiraciones
completas con control de presión, con presión y
tiempo de inspiración fijos.
Figura 28
El PCV-SIMV es un modo IMV de ventilación por
presión. Se predefine un número de respiraciones
controladas con presión. Entre las respiraciones
controladas con presión, el paciente puede respirar
espontáneamente con los volúmenes y tiempos de
inspiración adecuados. Además, las respiraciones
espontáneas pueden tener soporte de presión.
51
OPCIONES Y VALORES DE LA PANTALLA
OVERLAP (SUPERPOSICIÓN)
FREEZE PLOT (CONGELAR)
F4 OVERLAP. Superpone varios gráficos. Con la
representación gráfica estándar (sin resaltar
OVERLAP) LEONARDO, se borra el gráfico anterior a
medida que se trazan los valores en la pantalla.
Seleccione OVERLAP para conservar el gráfico actual
y superponer el siguiente rastreo sobre él. La Figura
29 muestra la función OVERLAP.
F5 FREEZE. Congela la imagen de la pantalla gráfica
y obtiene información digital de los parámetros
visualizados.
Cuando se pulsa F5 FREEZE PLOT, el cursor de la
pantalla continúa avanzando hasta que completa el
barrido de la pantalla. Cuando se alcanza el final de
la pantalla, el equipo congela la imagen y muestra el
cursor que aparece en la Figura 30.
Figura 29
Figura 30
En esta figura se superponen las curvas de flujo y
volumen anterior y posterior a una terapia de
dilatación bronquial. La función OVERLAP ayuda al
personal médico a definir una terapia dilatadora
eficaz, durante la ventilación asistida.
F5 FREEZE PLOT (congelar gráfico). Congela la
pantalla actual.
52
Las flechas hacia la derecha y hacia la izquierda
permiten desplazar el cursor sobre la imagen
congelada. Con cada parámetro se muestra un
cuadro numérico en el que se indica el valor que
corresponde a la posición del cursor.
Esta función puede ser útil para cuantificar el
AutoPEEP y otros parámetros pulmonares, como por
ejemplo la capacidad vital y la fuerza inspiratoria.
BUFFER (HISTORIAL)
La función BUFFER (Historial) permite al personal
médico almacenar y recuperar los gráficos de forma
de onda. Para utilizar las funciones de guardado y
recuperación, pulse la tecla F3 de la pantalla de
menú de formas de onda.
Cuando se pulsa F3 BUFFER OPERAT., la pantalla de
forma de onda se congela y aparece el submenú
BUFFER OPERAT.
Para guardar la pantalla actual, pulse F4, SAVE
BUFFER (Guardar historial). Aparece un bloque de
texto en el que se solicita un nombre para la pantalla
guardada. El nombre puede ser cualquier
combinación de ocho números. Para recuperar una
pantalla de forma de onda guardada, pulse la tecla
de función F2, LOAD BUFFER (Cargar historial).
Aparece un bloque de texto idéntico al de SAVE
BUFFER, en el que debe indicar el identificador de la
pantalla guardada. Escriba el nombre exactamente
como aparezca en el bloque de texto.
NOTA
Cuando se guarda una pantalla de forma de onda,
LEONARDO guarda todos los datos de volumen,
presión y flujo. Esto permite a LEONARDO generar
cualquier pantalla de forma de onda con los datos
guardados. Por ejemplo, si la forma de onda que
guardó era una curva de flujo y volumen, puede
mostrarse de nuevo como una curva de este tipo,
como una curva de presión y volumen, como un
gráfico de control de volumen en tiempo real o como
cualquier gráfico de forma de onda. Para mostrar el
archivo de historial con un formato de forma de onda
concreto, seleccione en la pantalla la forma de onda
que desee y utilice F2 LOAD BUFFER para recuperar
el archivo.
F5 DEL. BUFFER (Borrar historial). Elimina de la
memoria los historiales que ya no se necesitan. Para
recuperar una pantalla de forma de onda guardada
anteriormente, pulse la tecla de función F2, LOAD
BUFFER. Aparece un bloque de texto idéntico al de
SAVE BUFFER, en el que debe indicar el identificador
de la pantalla guardada. Escriba el nombre
exactamente como aparezca en el bloque de texto.
Toda la información almacenada se pierde al apagar
el equipo.
53
DETALLES TÉCNICOS
DIAGRAMAS DE CONEXIONES
Para reparaciones, envíe la pantalla a HAMILTON
MEDICAL.
En otros casos, estos diagramas puede servir de
ayuda para realizar diagnósticos.
ESPECIFICACIONES TÉCNICAS
Pantalla en color de 10,4 pulgadas y
640 x 480 píxeles
RS 232 C, apantallado
U 100 - 240 VAC + 10%, 47 - 63 Hz
P 25 VA
350 mm de ancho x 120 mm de profundidad x 250
mm de alto
Peso aproximado 6 kg
PEDIDOS DE RECAMBIOS
Indique el número de serie de la pantalla (SN) y el
código detallado del producto, como por ejemplo:
„SV-Kabel primär 32 12 427“.
SERVICIO TÉCNICO
No abra las cubiertas metálicas de la
pantalla. El uso del equipo sin sus
cubiertas metálicas puede provocar
descargas de alta tensión.
Para reparaciones, devuelva el
equipo a HAMILTON MEDICAL.
54
55
NOTAS
56
欢迎访问
我期待-呼吸机技术论坛
www.wqdai.com
经过半年的精心准备,我期待-呼吸机技术
论坛www.wqdai.com 正式开张了,本论坛为
广大网友提供危重症呼吸机的介绍及学习资料。
论坛设有泰科TYCO、德尔格draeger、伟亚
viasys、 纽邦Newport、 夏美顿hamilton、 西
门子siemens、 其它进口呼吸机、国产呼吸机、
学习资料、 等版块。欢迎广大网友访问“我期
待-呼吸机技术论坛”www.wqdai.com
站长:我期待