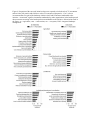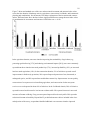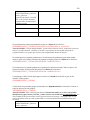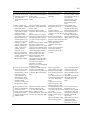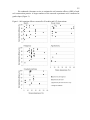
1
BUILDING A BRIDGE BETWEEN FOOD PRODUCTION AND CONSERVATION:
EXPERIENCES FROM LATIN AMERICA AND THE CARIBBEAN
A Dissertation
Presented in Partial Fulfillment of the Requirements for the
Degree of Doctorate of Philosophy
with a
Major in Natural Resources
in the
College of Graduate Studies
University of Idaho
by
Natalia Estrada-Carmona
May 2014
Major Professors: Alex Fremier, Ph.D. and Fabrice DeClerck, Ph.D.
11
AUTHORIZATION TO SUBMIT DISSERTATION
This dissertation of Natalia Estrada-Carmona, submitted for the degree of Doctorate of Philosophy
with a Major in Natural Resources and titled "Building a Bridge between Food Production and
Conservation: Experiences from Latin America and the Caribbean," has been reviewed in final form.
Permission, as indicated by the signatures and dates below, is now granted to submit final copies to the
College of Graduate Studies for approval.
Major professors:
Date:
- - - - - - - - , " " ° , __
,,<,
June 5th, 2014
Alex Frernier, Ph.D.
'-----··'-4~--Fabrice DeClerck, Ph.D.
Committee
Members:
Date:
Lee~~zbj
__
_
)L3 ·:
Date:
~
1
-
,
June 5th, 2014
June 6th, 2014
I
;_ \::;4.
'~~\<
Date:
Jan Boll, Ph.D.
Date:
,,,,-.<
Juan Robalino, Ph.D.
Department
Administrator:
~~EL0~
Lisette Waits, Ph.D.
~
Discipline's
College Dean:
Date:
Date:
Kurt Pregitzer, Ph.D.
Final Approval and Acceptance
~--
I--
Dean of the College
of Graduate Studies: -----1+-r---"
___________
Jie Chen, P .D.
Date:
June 5th, 2014
iii
ABSTRACT
Latin America and the Caribbean (LAC) region is a place where innovation to manage natural
resources is taking place. The region is and will keep contributing to the global food market. However,
this poses a threat to the biodiversity hotspots and the key ecosystem service they provide at local,
national and global scale. The Integrated landscape management (ILM) and the Ecosystem Services
(ES) approach are being widely used in the region to mediate between food production and
conservation. Still, we lack information in terms of how common is the ILM implemented as a
participatory and integrative strategy that engages local and regional stakeholders to promote
sustainable agricultural production, biodiversity conservation and improvement of community’s
livelihoods. In addition, we lack a quantified understanding of which practices guarantee ES
provisioning at the site level and how site level implementations across a watershed improve larger
scale services in agroecosystems.
To assess if ILM is a promising approach to mediate between food production and conservation we
surveyed 107 and interviewed 23 initiatives applying ILM in the region. We found that ILM is
improving natural resources management, engaging farmers, empowering local leaders and increasing
the ability of communities to self-organize while increasing their capacity to understand and
implement landscape management. The progress and success of these initiatives is highly dependent
on sufficient and sustainable sources of funding and support, on decreasing policies and laws that
hinder integrated landscape management and, on developing strategies to actively involve key
stakeholders, government and private sector entities.
We also assessed site level efforts (such as implementing soil conservation practices) on watershed
scale ES provisioning (such as reducing sediment yields in reservoirs for hydropower prodiction). We
used a coupled economic and soil loss model to evaluate multiple strategies for reducing soil loss and
compared these estimates to the costs of dredging three reservoirs in the upper and middle part of the
iv
Reventazon River, Costa Rica. Our results indicate that the cost of implementing ideal cropping
systems (combination of at least two or three soil conservation practices) is potentially similar or
cheaper than dredging, given our modeling assumptions. Our empirical-based and conservative
methodology can be adapted and modeled iteratively to improve PES spatial planning in
agroecosystems.
v
ACKNOWLEDGEMENTS
I am deeply grateful to my two major advisors, Dr. Alex Fremier and Dr. Fabrice DeClerck, who
constantly motivated and supported me during my academic formation. I really appreciate all the
support and guidance provided by my committee members, Dr. Lee Vierling, Dr. Jan Ball, and Dr.
Juan Robalino. I am also grateful to all my co-authors Dr. Celia Harvey, M.Sc. Abby Hart, Dr. Jeff
Milder and Dr. Elizabeth Harper for their support and enthusiasm. Both institutions, CATIE and
UIDAHO made this experience possible; I would like to express my gratitude particularly to Sanford
Eigenbrode, Lissette Waits, Nilsa A. Bosque-Perez and every person who make the join program
possible. Finally, this journey would not have been possible without the constant support from all my
friends and family.
Chapter 1: We thank all of the survey respondents for taking time to share their experiences with
integrated landscape management. Diana Vega and Camila Medeiros provided excellent research
assistance. We also thank Alexandra Judd of the Iberoamerican Model Forest Network for helping to
contact with ILI practitioners from Model Forests within LAC. We gratefully acknowledge financial
support from the Gordon and Betty Moore Foundation and the CGIAR Research Program on Water,
Land and Ecosystems.
Chapter 2: We thank the 75 integrated landscape management leaders and practitioners interviewed for
this study for taking the time to share their experiences and perspectives. Diana Vega and Camila
Medeiros provided excellent research assistance. We gratefully acknowledge financial support from
the Gordon and Betty Moore Foundation and the CGIAR Research Program on Water, Land and
Ecosystems. This study is a contribution of the Landscapes for People, Food and Nature Initiative
(http://landscapes.ecoagriculture.org).
vi
Chapter 3: We are very grateful to Dr. Mark Nearing and Dr. Mark Risse who provided us with the
original RUSLE dataset; and to Dr. Jan Boll for his valuable comments for improving the manuscript.
We thank the hydrology division of ICE (Instituto Costarricense de Electricidad) in Costa Rica for
providing measured sediment loads in eight basins of the Pacuare and Reventazón River. Funding for
our research is provided by multiple sources, including the College of Natural Resources at the
University of Idaho, Multifunctional Landscapes project at CATIE, the CGIAR Research Program on
Water Land and Ecosystems and the Student Grant Program of University of Idaho. This is a
contribution of the University of Idaho Forest, Wildlife and Range Experiment Station and the Idaho
Agricultural Experiment Station.
Chapter 4: We are very grateful to Jórge León and Juan Sebastián Lozano (affiliated to The Nature
Conservancy-Water Funds) for their support implementing RIOS. We also acknowledge Dr. Kelly
Wendland inputs at the initial stage of our research. Dr. Jan Boll and Juan Robalino provided us
valuable comments for improving the manuscript. Funding for our research is provided by the CGIAR
Research Program on Water Land and Ecosystems.
vii
TABLE OF CONTENTS
Authorization to Submit Dissertation ...................................................................................................... ii
Abstract ................................................................................................................................................... iii
Acknowledgements .................................................................................................................................. v
Table of Contents ................................................................................................................................... vii
List of Tables ........................................................................................................................................... x
List of Figures ......................................................................................................................................... xi
CHAPTER 1: INTEGRATED LANDSCAPE MANAGEMENT FOR AGRICULTURE, RURAL
LIVELIHOODS, AND ECOSYSTEM CONSERVATION: AN ASSESSMENT OF EXPERIENCE
FROM LATIN AMERICA AND THE CARIBBEAN ............................................................................ 1
1.
Abstract....................................................................................................................................... 1
2.
Introduction ................................................................................................................................ 2
3.
Methodology ............................................................................................................................... 6
4.
5.
6.
3.1.
Contacted initiatives........................................................................................................... 6
3.2.
The Survey ......................................................................................................................... 7
3.3.
Data analysis ...................................................................................................................... 8
Results ........................................................................................................................................ 9
4.1.
ILI locations and contexts .................................................................................................. 9
4.2.
Motivations ...................................................................................................................... 12
4.3.
Participants and stakeholders ........................................................................................... 14
4.4.
Investments, activities, and governance structures .......................................................... 15
4.5.
ILI outcomes .................................................................................................................... 16
4.6.
Most and least successful aspects .................................................................................... 19
4.7.
Relationships among ILI characteristics .......................................................................... 20
Discussion and Conclusions ..................................................................................................... 21
5.1.
ILIs as a vehicle for advancing landscape multifunctionality .......................................... 22
5.2.
The role of institutional development and multi-stakeholder processes .......................... 24
5.3.
Future research directions ................................................................................................ 26
References ................................................................................................................................ 29
CHAPTER 2: INTEGRATED LANDSCAPE MANAGEMENT IN ACTION: INSIGHTS FROM
TWENTY-THREE CASES IN LATIN AMERICA AND THE CARIBBEAN..................................... 33
1.
Abstract..................................................................................................................................... 33
2.
Introduction .............................................................................................................................. 35
3.
Methodology ............................................................................................................................. 38
viii
3.1.
4.
Analytical framework ...................................................................................................... 40
Results ...................................................................................................................................... 45
4.1.
Characterization of the landscape initiatives and their context ........................................ 45
4.2.
Evaluating four stages of the initiatives’ development .................................................... 49
4.3.
Key factors supporting or undermining effectiveness...................................................... 59
5.
Discussion and Conclusions ..................................................................................................... 64
6.
References ................................................................................................................................ 67
CHAPTER 3: GLOBAL SENSITIVITY ANALYSIS OF RUSLE ILLUSTRATES IMPORTANCE OF
COVER MANAGEMENT ACROSS ENVIRONMENTS IN PREDICTING SOIL EROSION RATES
............................................................................................................................................................... 69
1.
Abstract..................................................................................................................................... 69
2.
Introduction .............................................................................................................................. 70
3.
Data preparation and description .............................................................................................. 74
4.
3.1.
US dataset. ....................................................................................................................... 74
3.2.
Costa Rica dataset. ........................................................................................................... 77
3.3.
Theoretical dataset. .......................................................................................................... 79
3.4.
Unstructured datasets. ...................................................................................................... 80
Methods .................................................................................................................................... 80
4.1.
Statistical Analyses .......................................................................................................... 81
5.
Results ...................................................................................................................................... 83
6.
Discussion ................................................................................................................................. 88
6.1.
Model uncertainty under different environmental conditions .......................................... 88
6.2.
GSA versus LSA. ............................................................................................................. 89
6.3.
Management implications. ............................................................................................... 89
7.
Conclusion ................................................................................................................................ 90
8.
References ................................................................................................................................ 91
CHAPTER 4: PREVENTION IS BETTER THAN CURE: IMPLEMENTING SOIL
CONSERVATION PRACTICES MAY BE CHEAPER THAN DREDGING ...................................... 96
1.
Abstract..................................................................................................................................... 96
2.
Introduction .............................................................................................................................. 97
3.
Methodology ........................................................................................................................... 100
3.1.
Study area....................................................................................................................... 100
3.2.
Activities: Ideal cropping systems – coupled soil conservation practices ..................... 102
ix
3.3.
Tools: Integrated Valuation of Environmental Services and Tradeoffs (InVEST) and
Resources Investment Optimization System (RIOS) .................................................................. 107
4.
5.
3.4.
Targeting strategies ........................................................................................................ 110
3.5.
Budget allocation ........................................................................................................... 111
Results .................................................................................................................................... 113
4.1.
Universal Soil Loss Equation accuracy assessment ....................................................... 113
4.2.
Targeting strategies and budget allocation comparison ................................................. 115
4.3.
Benefit of implementing soil conservation practices (avoided cost) ............................. 117
Discussion ............................................................................................................................... 119
5.1.
Role of agroecosystems as ES providers ....................................................................... 119
5.2.
Targeting strategies ........................................................................................................ 120
6.
Conclusion .............................................................................................................................. 121
7.
References .............................................................................................................................. 123
Appendix A: Internet Search Terms (In English, Spanish and Portuguese) ....................128
Appendix B: Survey to Assess Integrated Landscape Management for Agriculture,
Rural Livelihoods, and Ecosystem Conservation in Latin America and the
Caribbean.........................................................................................................................130
Appendix C: Interview to Assess Integrated Landscape Management for Agriculture,
Rural Livelihoods, and Ecosystem Conservation in Latin America and the Caribbean ..149
Appendix D: Description of Each Factor And its Parameters, Including the
Maximum Values, Minimum Values and Equations Used to Create the Theoretical
Dataset. ...........................................................................................................................164
Appendix E Description of the Selected Soil Conservation Practices in Terms on the
Mechanism to Retain Soil, Pros and Cons, and Factors that Limit the Efficacy of the
Practices.
.........................................................................................................................................167
Appendix F: Establishment and Maintenance Cost for the Selected Soil
Conservation Practices. ...................................................................................................172
Appendix G: Results from the Literature Review to Estimate the Soil Retention
Efficacy of Each Soil Conservation Practice Modeled. ...................................................174
x
LIST OF TABLES
Chapter 1
Table 1. Summary descriptions of the 23 integrated landscape initiatives included in this study.
The first column indicates numbers by which the initiatives are referred in the narrative. ...........47
Chapter 3
Table 2. RUSLE factor description, units and reference. Each factor parameters used to construct
the theoretical dataset. ....................................................................................................................71
Table 3. Description of model efficiency measures and factor/parameter importance metrics for
both global and local sensitivities analysis. ...................................................................................82
Chapter 4
Table 4. Characteristics of the assessed dams in the Reventazon watershed. Assessment accuracy
based on the comparison between the reported sediment yield to each reservoirs and the
estimated exported sediment with InVEST. .................................................................................101
Table 5. Critical factors consider by RIOS to score each pixel’s potential effectiveness retaining
soil. ...............................................................................................................................................108
Table 6. Dams lifespan extension and avoided cost if ideal cropping systems (ICS) are
implemented using different targeting strategies at different budgets levels. .............................. 115
xi
LIST OF FIGURES
Chapter 1
Figure 1. Locations of the 104 surveyed integrated landscape initiatives across Latin America and
the Caribbean. ................................................................................................................................10
Figure 2. Percent relative and cumulative frequency of surveyed initiatives (n = 104) based on the
decade in which they began. Note that the surveyed sample included only initiatives that
were currently ongoing and had been active for at least two years at the time of the survey
(or, if less than two years old, were continuations of prior efforts in the same landscape)............12
Figure 3. Motivations for the creation of the surveyed ILIs (n = 104), as reported by initiative
leaders or participants. Panel a) indicates the number of initiatives that identified each given
motivation as “very important” or as “important” or “moderately important.” Abbreviations
in parentheses categorize these motivations into four thematic groups: agriculture (A),
conservation (C), livelihoods (L), and climate change (CC). Panel b) indicates the number
of initiatives for which the respondent selected at least one “very important” motivation in
each group. .....................................................................................................................................13
Figure 4 Number (a) and identity (b) of the sectors involved in the surveyed landscape initiatives. .....14
Figure 5. Proportion of initiatives that included at least one stakeholder group from each of the
stated categories, which are denoted as either internal to the landscape (i.e., local
individuals, organizations, or institutions) or external to the landscape (i.e., regional,
national, or international government entities, companies, or civil society groups). .....................15
Figure 6. Proportion of the surveyed initiatives that were reported to include each of 33
investments and activities (left panels) and to achieve each of 22 outcomes (right panels).
“Core” refers to investments that were part of the landscape initiative itself and to outcomes
attributable to the initiative. “Associated” signifies investments undertaken by other
organizations in the landscape and other outcomes occurring in the landscape but not
attributable to the initiative. Abbreviations used in the figure: ag. = agriculture; cons. =
conservation; eco. = ecosystem; ILM = integrated landscape management. .................................17
Figure 7. Mean and standard error of the core and associated investment and outcome index
values across the four domains of landscape activity (agriculture, conservation, livelihoods,
and institutional planning and coordination). See the narrative for further explanation of the
investment and outcome indices. Different letters above the bars indicate significant
differences among the mean index values for each domain for investments and outcomes
(LSD Fisher test, α = 0.05).............................................................................................................18
xii
Chapter 2
Figure 8. Visual depiction of the analytical framework described in the narrative. Landscape
initiatives may be seen as comprising four stages, with a logical though not inevitable
progression beginning with landscape identity (bottom loop) and advancing clockwise to
landscape institutions, landscape actions, and landscape results. This progression is
indicated by the prevailing clockwise direction of arrows, while lighter-colored grey arrows
indicate feedbacks and iterations that can occur within landscape initiatives. At each of the
four stages, numerous factors may either support (small clockwise arrows) or undermine
(small counterclockwise arrows) an initiative, potentially accelerating or impeding its
progression from one stage to the next, or even derailing an initiative entirely. Factor in the
center are present in all stages. .......................................................................................................44
Figure 9. Location of the 23 integrated landscape initiatives included in this study. .............................46
Chapter 3
Figure 10. Factor distribution and estimates for the US, CR and T (theoretical) datasets (Boxplot). Mean values are represented by the black squares. Different numbers of asterisk (*)
mean significant differences between mean values (Fisher LSD test, p-value<0.05). The
estimated (US, CR, and T) and Measured (USm) soil loss (A) across datasets at the bottom. ......76
Figure 11. Comparison of the average sediment load estimated and measured at the outlet in eight
basins of the Pacuare and Reventazón watersheds in Costa Rica. Underestimated sediment
loads in basins represented with a triangle are due to other erosive processes not captured by
RUSLE (i.e. gravel mining landslides). .........................................................................................79
Figure 12. Factor importance order for US, CR and T (theoretical) datasets for structured and
unstructured datasets at factor and parameter level (see Table 2 for factor and parameter
descriptions). Relative importance is the normalized factor node impurity metric obtained
from the Random Forest statistical procedure and indicates the relative importance of each
factor/parameter in influencing model predictions. .......................................................................84
Figure 13. Factor interactions for US, CR and T (theoretical) datasets obtained from the CART
analysis. Each dataset is represented as a tree, the left side of the tree represents factors
combinations and the right side represent the end of the tree with the averaged soil loss, the
percentage of data that follow each specific factor combination (or tree branch) and the
percentage of the total estimated soil loss. Factor interactions importance is from left to
right, and the value next to each factor is the factor threshold value at which the data are
split and combined with the next factor. ........................................................................................86
xiii
Figure 14. RUSLE efficiency and factor importance order for global and local sensitivity analyses
of the average and annual US datasets. Model efficiency corresponds to a pseudo R2 from
estimated and measured soil loss. Loss of efficiency value indicates the contribution of each
factor to model error. The negative value indicates a decrease in model predictability. ................87
Chapter 4
Figure 15. The left panel shows the location of the Upper – Middle Reventazon watershed and the
drainage area of the dams. The right panel shows the distribution of the targeted areas and
the level of agreement across the three targeting strategies: 1) RIOS, 2) RIOS&Legislation
and 3) RIOS&C-S. The level of agreement indicates which areas were targeted (or not) by
the strategies. For example, with a budget of $1.5 millions, ninenty four percent of the area
was excluded from all three targetting strategies to implement ideal croping systems and, all
the three strategies allocated the budget differently (3/3 – 0% of the agricultural land). ............102
Figure 16. Ideal cropping systems or activities implementation and maintenance cost per hectare
(I & M) estimated as the sum of each soil conservation practices implementation and
maintenance cost (¡Error! No se encuentra el origen de la referencia.). Soil retention
efficacy (SRE) estimated as the sum of the minimum reported efficacy for each soil
conservation practice. Legend of the soil conservation practices at the bottom: Hedgerow,
agroforestry, cover crops and mulching. ......................................................................................104
Figure 17. Covered area and retained soil by the implemented ideal cropping systems in each
drainage area (Angostura, Cachi and Birris) under three targeting strategies (RIOS, RIOS
constrained to areas in conflict with legislation and RIOS constrained to areas with erosive
crops on steep slopes) and at different budget levels. The percentage of the cover area
corresponds to the total area of each one of the drainage area of each dam. ............................... 114
Figure 18. Covered area and retained soil in the upper and middle part of the Reventazon
watershed by using three strategies to target ideal cropping systems (RIOS, RIOS
constrained to areas in conflict with legislation and RIOS constrained to areas with erosive
crops on steep slopes) at different budget levels. One-hundred percent of the area refers to
the 73,441ha in the watershed where ideal cropping systems can be implemented. ................... 114
Figure 19. Panel a) shows the avoided cost by the hydropower companies estimated as the cost of
removing the sediment retained up-stream by the cropping systems (black dots) at the
different budget levels and targeting strategies. The black line represents the implementation
cost of the cropping systems, below this line (gray area), the implementation and
maintenance cost of the ideal cropping systems is more expensive than the dredging cost of
xiv
the retained soil by the ideal cropping systems. Panel b) shows the extension of the dams’
life span across targeting strategies and budgets. ......................................................................... 118
1
CHAPTER 1: INTEGRATED LANDSCAPE MANAGEMENT FOR AGRICULTURE,
RURAL LIVELIHOODS, AND ECOSYSTEM CONSERVATION: AN ASSESSMENT OF
EXPERIENCE FROM LATIN AMERICA AND THE CARIBBEAN
Estrada-Carmona, N., Hart, A. K., DeClerck, F. a. J., Harvey, C. a., & Milder, J. C. (2014).
Integrated landscape management for agriculture, rural livelihoods, and ecosystem
conservation: An assessment of experience from Latin America and the Caribbean.
Landscape and Urban Planning, 129, 1–11. doi:10.1016/j.landurbplan.2014.05.001 [Open
access].
1. Abstract
Approaches to integrated landscape management are currently garnering new interest as scientists,
policymakers, and local stakeholders recognize the need to increase the multi-functionality of
agricultural landscapes for food production, livelihood improvement, and ecosystem conservation.
Such approaches have been attempted in many parts of Latin America and the Caribbean (LAC) but to
date there has been no systematic assessment of their characteristics, outcomes, and limitations. To fill
this gap, we surveyed participants and managers in integrated landscape initiatives throughout the
LAC region to characterize these initiatives’ contexts, motivations and objectives, stakeholders and
participants, activities and investments, outcomes, and major successes and shortcomings. Results
from 104 initiatives in 21 countries indicate that integrated landscape management is being applied
across the region to address a variety of challenges in diverse contexts, and that use of this approach is
expanding. Initiatives reported investing across four key “domains” of landscape multi-functionality:
agricultural production, ecosystem conservation, human livelihoods, and institutional planning and
coordination. Initiatives reported positive outcomes across all four domains, but particularly with
respect to institutional planning and coordination. Initiatives with larger numbers of objectives,
investments, and participating stakeholder groups all reported significantly higher numbers of positive
outcomes, suggesting significant value in the core precepts of the integrated landscape management
2
approach. Key challenges identified by survey respondents—including the long time horizon required
to achieve results at scale, unsupportive policy frameworks, and difficulty in engaging the private
sector and other important stakeholders—offer insights for improving the future effectiveness of
integrated landscape initiatives.
Key words: Latin America, landscape planning, multifunctional, agriculture, rural development,
biodiversity
2. Introduction
Recent years have witnessed a proliferation of research on the impacts, tradeoffs, and ramifications of
rural land-use management relative to the set of social and ecological goods and services that society
demands from landscapes, including food and fiber production, biodiversity conservation, ecosystem
service delivery, poverty alleviation, and economic development (Barrett, Travis, & Dasgupta, 2011;
Brussaard et al., 2010; Tscharntke et al., 2012). Much of this work has highlighted the scale and
severity of agricultural impacts on ecological systems, as well as the formidable challenge of
designing management approaches to meet escalating global demands for food production and
ecosystem services in the context of limited land and water resources, climate change, and widespread
ecosystem degradation (Ellis, Goldewijk, Siebert, Lightman, & Ramankutty, 2010; Foley et al., 2005).
A parallel stream of work has elaborated a variety of landscape analysis, planning and management
approaches to address some of these challenges (De Groot, Alkemade, Braat, Hein, & Willemen, 2010;
Nelson et al., 2009; O’Farrell & Anderson, 2010; Selman, 2009).
The increasingly contested nexus between agricultural production, biodiversity and ecosystem service
conservation, and economic development in rural landscapes is clearly evident in Latin America and
the Caribbean (LAC). This region contains eight of the world’s 34 biodiversity hotspots and provides
key ecosystem services at local, regional, and global scales (Myers, Mittermeier, Mittermeier, da
3
Fonseca, & Kent, 2000; Turner et al., 2012), but still contains high levels of rural poverty and
inequality in many areas (Berdegué et al., 2012). During the last 30 years, the LAC region has
accounted for the 35% of the growth in global food production (FAO, 2011). Looking ahead, as other
regions of the world became increasingly land and water constrained, or continued to experience low
productivity, the region’s role as a food exporter is likely to grow, with agricultural land projected to
increase 43% by 2050 (FAO, 2011). Historically, agricultural expansion in the LAC region has been
associated with the loss of high-biodiversity tropical ecosystems (Clark, Aide, & Riner, 2012), often in
a poorly regulated context where economic benefits associated with tropical deforestation accrued
inequitably and did little to alleviate poverty (Schatan, 2002).
These dynamics highlight the need for strategies that support the delivery of multiple benefits from
rural landscapes by increasing synergies and minimizing or mitigating tradeoffs among food
production, biodiversity conservation, ecosystem service provision, and poverty alleviation.
Approaches to “integrated landscape management” seek to do so by analyzing, implementing, and
evaluating land management decisions relative to multiple land scape objectives and stakeholder needs
(Sayer et al., 2013). This is achieved through landscape planning and design processes, improved
coordination among sectoral activities and investments, enhancement of human and institutional
capacities for decision support and negotiation, and supportive policies and incentives. Integrated
landscape management processes may support the alignment of agricultural production and ecosystem
conservation at a variety of scales, including both “land sharing” and “land sparing” approaches, as
dictated by local context (Cunningham et al., 2013). Integrated landscape management has been
practiced and studied under many names, including “whole landscape” management (DeFries &
Rosenzweig, 2010), “multifunctional agriculture” (Jordan & Warner, 2010), “ecoagriculture” (Scherr
& McNeely, 2008), “bioregional planning” (Brunckhorst, 2000), and “multifunctional landscapes”
(Fry, 2001; Naveh, 2001), to name a few. Such approaches have recently garnered new interest as
4
scientists, policymakers, and local stakeholders increasingly recognize both the need and the
possibility for more synergistic management of mosaic rural landscapes (LPFN, 2012).
The LAC region has a history of integrated landscape management efforts dating back at least three
decades. The region’s first formal landscape management paradigm was likely the UNESCO’s Man
and the Biosphere program (established in 1977), which sought to balance human needs and
ecological conservation through multi-objective management of critical landscapes. Beginning in the
mid-1990s, the “new rurality” (la nueva ruralidad) was proposed as a framework for participatory,
place-based economic development that linked agricultural production with rural poverty alleviation
(Echeverry-Perico & Ribero, 2002). More recently, the concept of rural territorial development
(desarrollo territorial rural) has been adopted in several LAC countries as a framework to support rural
economic development, improve the multifunctionality of rural regions, and foster constructive
interdependence between urban and rural populations (Bebbington, Abramovay, & Chiriboga, 2008;
Schejtman & Berdegué, 2008). This approach has been catalyzed, in different places, by governmentled efforts as well as by initiatives of rural communities and indigenous peoples.
Simultaneously, the biological corridor concept has been promoted—particularly in Mesoamerica—as
a way to increase conservation value and habitat connectivity while improving livelihoods in
fragmented landscapes that connect core nature reserves (Harvey et al., 2008; SINAC, 2008). More
broadly, conservation- friendly management of agricultural mosaics is now regarded as critical for
conserving the region’s biodiversity while furnishing key ecosystem services (DeClerck et al., 2010;
Perfecto, Vandermeer, & Wright, 2009). Various networks have emerged to support grassroots-led
integrated landscape management efforts, such as the Ibero-American Model Forest Network, which
was established in 2002 and now includes 27 “Model Forests” in 12 LAC countries, managed for
multifunctional outcomes through participatory processes (IMFN, 2013). Beyond these specific
paradigms for landscape and territorial management, other approaches such as community-based
5
natural resource management (Armitage, 2005) and the establishment of indigenous and community
conserved areas (Kothari, Corrigan, Jonas, Neumann, & Shrumm, 2012) have also been applied
widely throughout the LAC region and often share some if not all of the characteristics of integrated
landscape management.
But despite the growing practice of and interest in integrated landscape approaches in the LAC region,
to date there has been little formal effort to characterize these approaches and their role in helping to
address conservation, food production, and rural development challenges. Such work is urgently
needed to take stock of the diverse forms, experiences, and results of integrated landscape approaches
and to use this information to guide the design and implementation of new and ongoing efforts to
reconcile agricultural production, economic development and biodiversity conservation. The purpose
of this study is to begin to fill this critical need by conducting a systematic characterization of
integrated landscape approaches in the LAC region. Specifically, the study seeks to document the
location and context, motivations and impetus, participants and stakeholders, investments and
governance structures, outcomes, and most and least successful aspects of integrated landscape
approaches in the region, as identified by individuals involved in landscape approaches. Results of the
study can help inform recommendations about where and when integrated landscape management may
be an appropriate strategy and how landscape management efforts can be designed or conducted to
address common challenges and barriers.
As integrated landscape management can take many forms—both explicit and nebulous—in the
interest of clearly bounding the purview of this study, we focus our assessment on discernible
“integrated landscape initiatives” (ILIs), which we define as projects, programs, platforms, initiatives,
or sets of activities that: (1) explicitly seek to simultaneously improve food production, biodiversity or
ecosystem conservation, and rural livelihoods; (2) work at a landscape scale and include deliberate
planning, policy, management, or support activities at this scale; (3) involve inter-sectoral coordination
6
or alignment of activities, policies, or investments at the level of ministries, local government entities,
farmer and community organizations, NGOs, donors, and/or the private sector; and (4) are highly
participatory, supporting adaptive, collaborative management within a social learning framework
(Milder, Hart, Dobie, Minai, & Zaleski, 2014). Within these broad parameters, ILIs can take a
diversity of forms, including efforts initiated and carried out by grassroots actors and local
organizations as well as those catalyzed or substantially supported by external donors, governmental
bodies, regional initiatives, private companies, or civil society organizations.
We address seven key questions with respect to ILIs in the LAC region: (1) where and in what
contexts are initiatives taking place? (2) What are the motivations behind these initiatives, and what
challenges and problems do they seek to address? (3) Who is designing and implementing these
initiatives, and how are stakeholders involved? (4) What investments, activities, and governance
structures are included in the initiatives? (5) What positive outcomes have practitioners and
stakeholders reported? (6) What were key successes and failures associated with these initiatives? (7)
Which aspects of initiatives’ design, structure, and stakeholder participation most strongly predict
levels and types of reported outcomes?
3. Methodology
3.1. Contacted initiatives
We developed and administered a structured survey tool for ILI practitioners and local leaders to
characterize a sample of initiatives throughout Latin America (including Mexico, Central America, and
South America) as well as the major Spanish-speaking Caribbean jurisdictions of Puerto Rico, Cuba,
and the Dominican Republic. We began by searching broadly for potential initiatives by performing
online keyword searches, including in project databases and websites of conservation and rural
development organizations operating in the LAC region (for a list of search terms, see Appendix A).
We identified additional initiatives through the networks of experts and organizations participating in
7
the Landscapes for People, Food and Nature Initiative (LFPN, http://landscapes.ecoagriculture.org).
Finally, we asked all persons contacted to identify any other initiatives of which they were aware. We
screened the initiatives identified to select only those that were currently ongoing and had been active
for at least two years at the time of the survey (or, if less than two years old, were continuations of
prior efforts in the same landscape).
This process yielded a total of 382 initiatives that appeared to meet the above-stated ILI definition and
criteria for duration and active status. These candidate initiatives included grassroots- led efforts as
well as projects or programs initiated by groups external to the landscape, such as state or national
government, civil society, or research organizations. For each initiative, we contacted and sent the
survey to one practitioner or leader (e.g., a community leader, local or international NGO
representative, or government official) who we expected to be deeply familiar with the initiative and
its components. Of the survey respondents, 84% identified themselves as the coordinator, manager, or
executive leader (e.g., director) of their respective ILI. The remaining 16% identified themselves as
technical specialists involved in the initiative. The plurality of respondents (44%) was affiliated with
local organizations (i.e., within the subject landscape), while others were affiliated with national (30%)
or international (26%) government, non-profit, or research institutions.
3.2. The Survey
The survey questionnaire included a combination of closed-and open-ended questions oriented around
our seven research questions to solicit information on the initiatives’ location and context,
motivations and impetus, participants and stakeholders, investments and governance structures,
outcomes, and most and least successful aspects. The questions related to investments and outcomes
were designed to gather information on four key activity domains: agriculture, conservation,
livelihoods, and institutional planning and coordination (hereafter referred to as the four “domains”).
To report investments and outcomes, respondents selected from a pre-defined set of options that were
8
chosen to include common types of investments and outcomes in each of the four domains;
respondents could also write in additional responses beyond these pre-defined choices. We asked
respondents to differentiate between investments and outcomes included in or attributable to the
initiative itself (“core” investments and outcomes) and those that were initiated or realized as a result
of other activities or organizations present in the landscape (“associated” investments and outcomes).
Prior to distributing the survey widely, we conducted a pilot test with practitioners from 15 initiatives
and revised the survey as needed. The final survey included 45 questions and took about 40 min. to
complete (for a copy of the survey, see Appendix B).
We used the online service, Survey Monkey, to administer the survey, which we made available in
Spanish, Portuguese and English. We first contacted the selected representative of each initiative by
email or telephone to request his or her participation. Representatives who did not respond to the
survey after the first contact received a follow up email or telephone call. The survey had a response
rate of 45% (173 out of 382). We screened the survey responses for completeness and for concurrence
with our definition of ILIs. A total of 104 initiatives met these criteria and were included in subsequent
analyses (for more information on the 104 initiatives, see
https://mapsengine.google.com/map/edit?mid=zNfW1TNgZ8uI.kThRrJOI88sY)
3.3. Data analysis
We treated responses to the closed-ended questions as ordinal or binary variables, depending on the
question. For instance, respondents reported on motivations according to their perceived level of
importance (ordinal variable with four possible levels), while participation of each stakeholder group
in the design and/or implementation of an initiative was reported as either present or absent (binary).
We developed a set of indices to quantify the relative number of investments and outcomes in each
domain, as well as the relative balance across all four domains. The “investment index” was calculated
as the ratio of reported investments in each domain to the total number of possible investments (i.e.,
9
the total number of pre-defined choices offered on the questionnaire) in that domain. We normalized
the ratio for each domain to a 25-point scale and summed these scores to derive an overall investment
index, with possible scores ranging from 0 to 100. We calculated an “outcome index” in the same way.
Although these indices do not necessarily reflect all core or associated investments and outcomes in a
landscape, nor the magnitude of such investments and outcomes, they are useful for understanding the
relative focus and breadth of each initiative across the four domains, as well as level of the “intersectorality” of the initiatives.
We analyzed the raw survey data and the derived indices to assess the distribution of each variable as
well as the associations among the variables and trends among the initiatives. We used analysis of
variance and Pearson’s product-moment correlation analysis performed on the indices and other
continuous variables to understand the relationship between investments and outcomes in general, and
to compare investments and outcomes across the four domains. We used contingency table analyses to
compare categorical variables with the index scores, which we transformed into high, medium, and
low categories. For the open-ended questions on most and least successful aspects of the initiatives,
we manually compiled responses to identify recurring themes, highlight illustrative examples, and
clarify the significance of responses from the closed-ended questions.
4. Results
4.1. ILI locations and contexts
The 104 initiatives represented 21 countries, with the greatest numbers of initiatives in Brazil (13%),
Guatemala (12%), Mexico (10%), Ecuador (9%), and Costa Rica (9%) (Figure 1). Survey response
rates were not significantly different from country to country (X2 test, p = 0.29) and follow-up
interviews with non-respondents did not suggest other forms of self-selection bias that might have
skewed the sample population ways unrepresentative of the full set of candidate initiatives. The main
reasons that non-respondents elected not to participate were: (1) lack of interest, (2) the project or
10
initiative had finished, (3) the contacted person no longer worked with the initiative and had lost
contact with it, or (4) the respondent indicated that the initiative or project was not actually an ILI.
Twenty-nine percent of the initiatives were started prior to 2000, 62% began between 2000 and 2009,
and 9% began in 2010 or later (Figure 2). Several of the initiatives were associated with specific
landscape management approaches such as biosphere reserves (17%), Model Forests (9%), and
biological corridors (6%). Forty three percent had evolved from shorter-term projects into long- term
or permanent initiatives. A majority of the initiatives (72%) reported that they used adaptive
management. Eighty-eight percent included a monitoring and evaluation component, but only 60%
had conducted a baseline assessment as part of monitoring and evaluation.
Figure 1. Locations of the 104 surveyed integrated landscape initiatives across Latin America and the
Caribbean.
11
12
Figure 2. Percent relative and cumulative frequency of surveyed initiatives (n = 104) based on the
decade in which they began. Note that the surveyed sample included only initiatives that were
currently ongoing and had been active for at least two years at the time of the survey (or, if less than
two years old, were continuations of prior efforts in the same landscape).
As expected, the initiatives generally took place in mosaic landscapes with multiple land uses. On
average, these landscapes had a mean of five major land uses (SE = 0.2) that each occupied ≥5% of
the landscape area and six (SE = 0.2) minor land uses that each occupied <5% of the landscape area.
The most frequently cited major land uses were managed pastures with livestock (59%), tropical wet
forest (50%), annual grain crops (45%) and montane forest (39%). Villages, towns or cities were
present in 93% of the landscapes and considered a major land use in 32%. Industrial or mining areas
were present in 43% of the landscapes and considered a major land use in 34%. The most common
minor land uses across the surveyed landscapes were annual horticultural crops (65%), forest
plantations (59%), and annual grain crops (45%).
4.2. Motivations
Stakeholders were motivated to establish and participate in ILIs both to address current and pending
threats and to collaborate around identified opportunities. Respondents identified a mean of six (SE =
0.3) “very important” objectives, four (SE = 0.3) “important” objectives, and two (SE = 0.2)
“moderately important” objectives per initiative. Conservation-related motivations were, on average,
13
twice as likely to be considered very important as those related to agricultural production, livelihood
improvement, or climate change concerns (Figure 3). Ninety-three initiatives reported at least one
conservation-related objective as very important. Conserving biodiversity and reducing natural
resource degradation were the most frequently identified as very important, by 78% and 73% of
initiatives, respectively. In addition to the 15 choices of potential motivations listed in the
questionnaire, respondents wrote in additional motivations including the strengthening social
networks, preserving local culture and traditions, creating new incentives for conservation, and
reaching new markets (local, national or international) for organic and sustainably produced
agricultural products.
Figure 3. Motivations for the creation of the surveyed ILIs (n = 104), as reported by initiative leaders
or participants. Panel a) indicates the number of initiatives that identified each given motivation as
“very important” or as “important” or “moderately important.” Abbreviations in parentheses
categorize these motivations into four thematic groups: agriculture (A), conservation (C), livelihoods
(L), and climate change (CC). Panel b) indicates the number of initiatives for which the respondent
selected at least one “very important” motivation in each group.
14
4.3. Participants and stakeholders
Most of the initiatives engaged multiple sectors in landscape management, with respondents reporting
a mean of four (SE = 0.2) sectors involved in each initiative (Figure 4). However, 8% reported the
involvement of only one sector. The most commonly involved sector (in 89% of initiatives) was
“natural resources, conservation and environment” (characterized in the survey as a single sector).
This was closely followed by the agriculture sector (75% of initiatives). The forestry, tourism, and
education sectors were also each involved in more than 40% of surveyed initiatives (Figure 4).
Figure 4 Number (a) and identity (b) of the sectors involved in the surveyed landscape initiatives.
Respondents reported a mean of 11 (SE = 0.4) different stakeholder groups, out of 21 pre-defined
questionnaire choices, participating in the design and/or implementation of each initiative. The most
frequently involved groups were farmer or producer organizations (in 86% of initiatives), local
government leaders (82%), and local non-governmental organizations (NGOs) (78%). At least one
international organization (e.g., international conservation or agricultural NGOs, foreign universities
or research organizations, and foreign donors) was involved in 87% of initiatives. Stakeholder groups
less commonly reported included private sector interests including local agribusiness (22%), logging
and forest industries (20%), landless people (18%), foreign agribusiness (7%), and mining and
extraction industries (7%). On average, the number of participating stakeholder groups internal to the
15
landscape was reported to be greater than the number of participating external stakeholder groups
(paired t-test, p < 0.001), and in each category government stakeholders were the most commonly
represented (Figure 5). An average of only three stakeholders groups per initiative participated in both
the design and the implementation of the initiative, suggesting that different stakeholders played
different roles in the initiative, and that there may have been limited continuity from design to
implementation.
Figure 5. Proportion of initiatives that included at least one stakeholder group from each of the stated
categories, which are denoted as either internal to the landscape (i.e., local individuals, organizations,
or institutions) or external to the landscape (i.e., regional, national, or international government
entities, companies, or civil society groups).
4.4. Investments, activities, and governance structures
The majority of initiatives (75%) reported core investments in all four domains. The investment index
for institutional planning and coordination was significantly higher than that for the other three
domains (ANOVA, F3 = 3.978, p = 0.008). This domain also included the two most frequently
reported investments: strengthening capacity for conducting integrated management (71% of
initiatives) and providing technical assistance for integrated landscape management (68% of
initiatives). All but one of the activities in this domain was reported by more than half of respondents.
Investments least commonly reported were those associated with conventional crop intensification
16
(6%) and irrigation (15%), and those associated with poverty alleviation efforts focused on hunger,
malnutrition, and human health (each reported in about 30% of initiatives) (Figure 6).
On average, respondents reported a significantly higher number of core investments (those considered
part of the initiative; mean core investment index = 50, SE = 2.1) than associated investments (those
undertaken by others in the landscape; mean associated investment index = 22, SE = 1.6) (paired t-test,
p < 0.001). However, we were unable to confirm the degree to which this result may reflect perception
bias (i.e., seeing the landscape through the lens of the initiative), or respondents’ incomplete
knowledge of other landscape investments. The two domains with the lowest proportion of core
investments—agriculture and livelihoods—were reported to have the highest proportion of associated
investments (Figure 7).
4.5. ILI outcomes
Overall, initiatives were generally reported to have the largest relative number of core outcomes in the
domains where they made the largest relative number of investments. The outcome index for the
institutional planning and coordination domain was significantly higher than that of any other domain
(ANOVA, F3 = 15.23, p < 0.001) (Figure 7). For instance, 80% of initiatives reported achieving
improved coordination among stakeholders, 72% reported that local communities gained capacity to
manage their natural resources, 65% reported that local communities became more empowered to
participate in decision-making, and 64% reported that traditional knowledge about agriculture and
natural resources had been preserved or used. Planning and coordination was the only domain in
which all possible outcomes given as choices on the questionnaire were reported by more than half of
the surveyed initiatives (Figure 6).
17
Figure 6. Proportion of the surveyed initiatives that were reported to include each of 33 investments
and activities (left panels) and to achieve each of 22 outcomes (right panels). “Core” refers to
investments that were part of the landscape initiative itself and to outcomes attributable to the
initiative. “Associated” signifies investments undertaken by other organizations in the landscape and
other outcomes occurring in the landscape but not attributable to the initiative. Abbreviations used in
the figure: ag. = agriculture; cons. = conservation; eco. = ecosystem; ILM = integrated landscape
management.
18
Figure 7. Mean and standard error of the core and associated investment and outcome index values
across the four domains of landscape activity (agriculture, conservation, livelihoods, and institutional
planning and coordination). See the narrative for further explanation of the investment and outcome
indices. Different letters above the bars indicate significant differences among the mean index values
for each domain for investments and outcomes (LSD Fisher test, α = 0.05).
In the agriculture domain, outcomes related to improving the sustainability of agriculture (e.g.,
protecting agrobiodiversity [57%] and reducing environmental impacts [54%]) were more commonly
reported than those related to increased productivity (37%), increased profitability (36%), or increased
land area under agriculture (14%). In the conservation domain, 63% of initiatives reported overall
improvements in biodiversity protection; 50% reported improved protection of rare, threatened, or
endangered species; and 48% reported increased habitat connectivity. Improvements in water quality,
conservation of ecosystem services benefitting agriculture, and conservation of other ecosystem
services were each reported in about 40% of initiatives. In the livelihoods domain, 50% of initiatives
reported increased cash income for low-income residents while 54% reported increases in non-cash
measures of human wellbeing. Forty percent reported improved food security while 28% reported a
reduction in human vulnerability. Beyond the 22 pre-defined outcome choices included in the closeended portion of the survey, respondents identified additional core outcomes related to improved
19
perception and valuation of natural resources, improved infrastructure, and empowerment of local
stakeholders.
Overall, respondents reported relatively few associated outcomes (i.e., outcomes resulting from
activities outside the scope of the landscape initiative). To the extent that such outcomes were
reported, they tended to be concentrated in areas that were less commonly foci of the initiatives
themselves, such as agricultural expansion and increased access to health services (Figure. 6). When
interpreting results on ILI outcomes, it is important to recall that this information is based on
respondent self-reporting. The evidential basis for such self-reports undoubtedly varies in quality and
rigor, and in some cases may be based primarily on perception.
4.6. Most and least successful aspects
We asked respondents to indicate what they saw to be the most and least successful aspects of their
landscape initiative. Responses tended to emphasize the human and institutional aspects of landscape
management. Among the most successful aspects, 31% of respondents reported increased capacity for
understanding and implementing integrated landscape management. Thirty percent reported
improvements in natural resource management through the formation of new protected areas,
improved agroforestry and forestry management, and the protection of threatened species. Improved
agricultural and agroforestry practices were mentioned by 26% of respondents, many of whom noted
that these improvements resulted from strong farmer engagement, farmer-to-farmer communication,
strengthening of farmer organizations, and engagement of farmers in participatory research at pilot
sites where the benefits of environmentally friendly practices could be directly observed. Other
important successes included the empowerment of local leaders (mentioned by 19% of respondents)
and the ability of communities to self-organize for change (18% of respondents).
20
Thirty eight respondents recognized integrated landscape management to be a long-term endeavor
requiring constant support (e.g., human, monetary, technological, and infrastructural), which they
noted was difficult to maintain. The least successful aspects of the ILIs (often stated by respondents in
the form of key challenges) were commonly associated with limitations in stakeholder participation
(34% of respondents) and funding (20% of respondents). Fourteen percent of respondents reported
poor integration, inconsistency or counterproductive laws or policies as a major challenge to meeting
their initiative’s objectives. Although local, sub-national and national government agencies were
frequently involved in the initiatives as stakeholders, several respondents indicated that support from
government entities was shallow and insufficient (14% of respondents). Finally, respondents reported
difficulties establishing value chains for sustainable agriculture or non-timber forest products (10% of
respondents) and getting the private sector involved (8% of respondents).
4.7. Relationships among ILI characteristics
Overall, initiatives that respondents characterized as more “multi-objective” (i.e., those reporting more
motivations as “very important”) had both higher investment index (r = 0.4, p < 0.001) and higher
outcome index (r = 0.4, p < 0.001) scores. In other words, initiatives with a greater number and
diversity of objectives also reported higher numbers of investments and outcomes across all domains
than those with lower numbers of objectives. Investment index scores and outcome index scores were
also positively and significantly correlated (r = 0.59, p < 0.001).
Duration of the initiatives was positively correlated with total outcome index scores (r = 0.3, p <
0.003) and more strongly correlated with outcome index scores in the conservation domain (r = 0.4, p
< 0.001), suggesting that more outcomes might be progressively achieved over time, especially in the
conservation domain. Initiative duration was also positively correlated with the number of sectors
involved (r = 0.3, p = 0.005).
21
The number of stakeholder groups involved in the initiatives was positively correlated with both
investment index (r = 0.5, p < 0.001) and outcome index (r = 0.2, p = 0.024). The number of sectors
involved in the ILIs was also positively correlated with investment index and outcome index scores (r
= 0.4, p < 0.001 and r = 0.3, p = 0.005, respectively). Higher outcome index scores were associated
with the participation of women’s groups (X2 = 0.023) and local farmer’s organizations (X2= 0.028) but
not with other specific segments of local communities such as indigenous people or landless people.
The participation of the private sector—the least frequently involved set of stakeholder groups—was
not significantly associated with higher outcome index scores. Other investments in institutional
planning and coordination that we expected might support positive outcomes—including the
strengthening of existing landscape coordination bodies, creation of new landscape coordination
bodies, and efforts to mediate conflict among stakeholders—were not associated with higher outcome
index scores.
5. Discussion and Conclusions
This study provides the first broad characterization of integrated landscape management in the LAC
region and, as such, is informative for understanding the current state of this field, the challenges and
potential benefits of applying such an approach, and the needs for additional research. The size and
diversity of the survey sample suggests that integrated landscape management is being applied across
the region to address a variety of challenges in a wide range of contexts. Furthermore, data on the
starting date of the surveyed initiatives (Figure 2) suggests that uptake of integrated landscape
approaches within the LAC region has accelerated in the past decade. This trend is consistent with
recent shifts in parts of the region from early territorial development paradigms focused on economic
and social priorities (Bebbington et al., 2008; Schejtman & Berdegué, 2008) to current approaches that
integrate conservation strategies with economic and human development plans (ERAS, 2008; SECAC,
22
2012). The proliferation of ILIs may also reflect the evolving interests and priorities of international
donors and NGOs, who were present as stakeholders in 87% of the surveyed initiatives.
Because it was designed as a foundational region-wide characterization of ILIs, this study prioritized
breadth and data comparability over in-depth analysis of individual ILIs. This design presents a few
caveats for interpretation of the results. First, reliance on the Internet and practitioner networks to
identify initiatives may bias the sample toward those that have published information or are associated
with external organizations, and may underrepresent grassroots-led initiatives that lack these features.
Second, all data are based on self-reporting by initiative participants. Thus, the accuracy of any factual
information reported may be limited by the respondent’s knowledge, while results related to more
subjective themes (e.g., ILI motivations and stakeholder participation) may reflect respondents’
deliberate or unintentional bias. Third, results are based on the perspectives of only one representative
of each ILI, who may not be aware of all aspects of the initiative, or who may be inclined to portray
the initiative in a positive (or negative) light. Fourth, results related to investments and outcomes
identify only whether or not a particular activity or outcome occurred, not the level of effort or
resources allocated to each investment or the magnitude and reach of each outcome. Finally, reported
outcomes may not have been evaluated relative to a baseline or counterfactual scenario; thus, reporting
of an outcome signifies that change occurred in the landscape, but not necessarily that this change was
mainly attributable to the initiative. Despite these caveats, the results provide a rich portrait of the
practice of integrated landscape management in the LAC region.
5.1. ILIs as a vehicle for advancing landscape multifunctionality
At the most general level, the results suggest that ILIs are not only pursuing landscape
multifunctionality (as indicated by diverse objectives and investments spanning several sectors) and
but also achieving it to some degree (as indicated by outcomes in at least three of the four domains for
23
most initiatives). Furthermore, the data support the hypothesis that landscape initiatives that pursue a
wider range of objectives and invest across several domains yield a broader range of reported
outcomes than those that focus on fewer objectives. This finding suggests that deliberate efforts to
pursue landscape multifunctionality in the LAC region are bearing fruit, at least in the eyes of
initiative participants. What the data do not reveal is whether these initiatives are achieving landscape
multifunctionality in a way that is simply additive (i.e., by amalgamating multiple investments under a
single umbrella), or whether the initiative is serving to coordinate and integrate investments in a way
that generates new synergies that multiply benefits on the ground.
To gain additional insight into the ability of ILIs to catalyze new synergies for landscape
multifunctionality, it is instructive to compare the motivations and roles of the agriculture sector in the
surveyed ILIs to those of the conservation sector. Conservation motivations were the most commonly
cited “very important” drivers of ILIs, while motivations related to increased food production and crop
and livestock productivity lagging behind in overall frequency and reported importance. The
implication is that, in at least a subset of the initiatives, stakeholders that have conservation objectives
foremost in mind are choosing to invest more broadly across multiple domains. This pattern may
reflect the recent shift of major conservation organizations toward prioritizing conservation strategies
that also support economic development and human wellbeing (Doak, Bakker, Goldstein, & Hale,
2013). In the wake of disappointing experience with integrated conservation and development projects
in the 1990s, conservationists have now adopted new ways of integrating conservation and human
development, including payments for ecosystem services and ILIs (Balvanera et al., 2012; Milder,
Buck, DeClerck, & Scherr, 2012). Concurrently, research has elucidated the conservation value of—
and conservation friendly management options for—Neotropical production landscapes to protect
native species, habitat corridors, and ecosystem services in fragmented regions (e.g., DeClerck et al.,
2010; Harvey et al., 2008; Porter-Bolland et al., 2012). These factors appear to create a comfortable fit
24
for conservation stakeholders to participate in multi-objective projects that include potentially
conservation-friendly economic activities such as diversified agriculture, agroforestry, and ecotourism.
Similarly, ILI participation from the agriculture sector generally emphasized agroecological
approaches (Altieri, 1995) that conserve and use agricultural biodiversity, and foster local ecosystem
functions (e.g., soil fertility, water conservation, and pest control), to support productivity. On the
other hand, investments in conventional crop intensification and irrigation—core components of Green
Revolution agriculture—were rarely reported to be part of the ILIs. Relatedly, small-scale farmers and
producer groups, who are most likely to apply agroecological practices (Altieri & Toledo, 2011), were
much more commonly involved as ILI stakeholders than agribusiness. These results suggest that many
ILIs are focusing on the alignment among ecologically-based agriculture, resource- based livelihoods,
and ecosystem conservation. While far from easy, such alignment in some sense represents the “lowhanging fruit” of integrated landscape management. More challenging—and apparently less
common—is to pursue alignment among large-scale agriculture, other commercial interests,
ecosystem conservation, and local livelihoods. Whereas conservation stakeholders apparently already
have strong incentives to work across sectors to protect the environment and manage common-pool
resources, this is less true of the full range of stakeholders principally interested in maximizing
agricultural yields and economic returns, for whom it will be critical to identify the right incentives
and entry points for constructive participation in ILIs.
5.2. The role of institutional development and multi-stakeholder processes
At its core, integrated landscape management is composed of human and institutional processes and
systems for governing rural landscapes. Consistent with this observation, institutional planning and
coordination emerged as the most important of the four domains for both ILI investments and
outcomes—suggesting that many initiatives consider such functions to be a critical foundation for
multi-stakeholder landscape governance. As highlighted by the open-ended responses on the most and
25
least successful aspects of ILIs, many respondents considered improved stakeholder coordination and
human and institutional capacity for multi-objective planning and decision-making to be successes in
their own right.
However, these human and institutional outcomes can take years to achieve and there is no guarantee
that they will ultimately translate into greater multifunctionality on the ground. Indeed, compared to
landscape planning and coordination outcomes, tangible outcomes in the agriculture, conservation, and
livelihood domains were each reported in a smaller percentage of initiatives (although most initiatives
registered at least a few outcomes in each domain). These results imply that the road from institutional
investments to on-the-ground results at a landscape scale may be a long one. Accordingly, the
governments, donors, and community stakeholders who invest or participate in such efforts should
understand the need for ongoing support (in the form of funding, technical backstopping, and/or other
human resources) that allows for flexible and non-linear adaptive management approaches. Similarly,
monitoring programs and indicators for ILIs should track both “slow” and “fast” variables related to
each of the four domains to assess not only biophysical and socioeconomic results at each stage of an
initiative, but also the human and institutional capacities that may support long-term sustainable
management and enable appropriate responses to future challenges (Walker, Carpenter, Rockstrom,
Crépin, & Peterson, 2012).
The results also suggest that ILIs can provide a constructive platform to convene stakeholders in a way
that brings a broad set of perspectives and interests to address landscape management challenges. The
surveyed initiatives were reported to involve a large number and diversity of stakeholders in design
and implementation, including both internal stakeholders from the landscape itself and external
stakeholders from the public, private, and civil society sectors. This finding suggests that most ILIs
cannot be considered as strictly bottom-up or top-down efforts, but, rather, commonly
26
involve an interplay between both sets of stakeholders in which stakeholders roles may shift over time.
Prior research has indicated that multi-objective land and resource governance may promote the
engagement of diverse stakeholders at multiple scales by raising questions or framing challenges that
cannot be addressed through the expertise or perspective of any one group (Berkes, 2009; Southern,
Lovett, O’Riordan, & Watkinson, 2011) and facilitating relationships that foster engagement (Höppner,
Frick, & Buchecker, 2007). This dynamic appeared to be at play in many of the surveyed ILIs, where
the set of participating stakeholders extended far beyond the convening body. Nonetheless, the
frequent absence of commercial interests, as well as the superficial nature of government participation
in some cases, raises concern that powerful stakeholders are not being fully incorporated into ILIs.
Efforts of political and economic elites to circumvent participatory and democratic governance
processes are common and well-documented (e.g., Cornwall, 2008; Platteau & Abraham, 2002), and
should be recognized as a particular challenge for ILIs given the emphasis that they place on fostering
multi-stakeholder processes that are both technically sound and politically legitimate.
5.3. Future research directions
As noted above, this study provides a foundational characterization of the practice of integrated
landscape management in the LAC region, but was not designed to independently evaluate or attribute
the impacts of ILIs in quantitative terms. Further research is therefore warranted to deepen the
understanding of landscape approaches and their relative effectiveness. We suggest that such work be
conducted at two levels: 1) in-depth case studies of individual ILIs, and 2) comparative studies and
meta-analyses of larger sets of initiatives.
At the level of individual ILIs, rigorous evidence of effectiveness will require systematically collecting
quantitative data on ecological, social, economic, and agricultural outcomes of ILIs and evaluating the
relationships among these outcomes to document the degree to which the desired synergies and
complementarities are being achieved. Such research must be designed to disentangle the multiple
27
interacting consequences of a landscape management initiative from exogenous factors and change
trajectories not attributable to the initiative. Landscape management interventions are not necessarily
amenable to experimental approaches, but counterfactual scenarios can nevertheless be established or
modeled to infer the net effects of landscape initiatives. In addition to quantitative outcome
monitoring, qualitative methods will be important for understanding the perspectives and roles of
different stakeholders in each landscape and for delving more deeply into the institutional and policy
factors that support or undermine effective integrated landscape management.
While case studies can be informative and provide rigorous evidence about ILIs in specific contexts,
policy recommendations and investment decisions related to integrated landscape management may be
better informed if they are based on evidence from a range of contexts. For this reason, comparative
studies and meta-analyses should also be considered as a critical part of the research agenda on ILIs.
At present, such analyses are probably not possible, as there has been little or no comparability in
monitoring approaches or research methods that have sought to document and quantify ILIs outcomes.
However, as the practice of integrated landscape management expands over time, meta-analyses may
become more feasible if a major portion of ILIs conduct credible monitoring, and particularly if such
monitoring adheres to some basic common parameters to facilitate data comparability. Several
frameworks for multi-scalar, multifunctional, long term monitoring of agricultural landscapes have
recently been proposed (e.g., Sachs et al., 2010; Vital Signs, 2013), and could serve as useful starting
points to improve the comparability of data on ILIs to support future meta-analyses.
Taken together, research on integrated landscape management at these two levels will assist ILI
practitioners, investors, and policymakers in conducting and supporting more effective landscape
approaches by: 1) clarifying the causal relationships between ILI investments and outcomes under
different institutional and landscape configurations; 2) highlighting mechanisms, tools, methodologies,
approaches or strategies that tend to support better outcomes across multiple domains of
28
multifunctionality; 3) suggesting how policy frameworks can more effectively support ILIs and
landscape multifunctionality; and 4) identifying feasible and efficient strategies for supporting
landscape initiatives such that they can sustain themselves indefinitely.
29
6. References
Altieri, M. A. (1995). Agroecology: The science of sustainable agriculture (2nd ed.). Boulder, CO:
Westview Press.
Altieri, M. A., & Toledo, V. M. (2011). The agroecological revolution in Latin America: Rescuing
nature, ensuring food sovereignty and empowering peasants. Journal of Peasant Studies, 38, 587–
612. http://dx.doi.org/10.1080/03066150.2011.582947
Armitage, D. (2005). Adaptive capacity and community-based natural resource management.
Environmental Management, 35, 703–715. http://dx.doi.org/10.1007/ s00267-004-0076-z
Balvanera, P., Uriarte, M., Almeida-Le˜ nero, L., Altesor, A., DeClerck, F., Gardner, T.,
et al. (2012). Ecosystem services research in Latin America: The state of the art. Ecosystem Services,
2, 56–70. http://dx.doi.org/10.1016/j.ecoser.2012.09.006
Barrett, C. B., Travis, A. J., & Dasgupta, P. (2011). On biodiversity conservation and poverty traps.
Proceedings of the National Academy of Sciences of the United States of America, 108, 13907–
13912. http://dx.doi.org/10.1073/pnas.1011521108
Bebbington, A., Abramovay, R., & Chiriboga, M. (2008). Social movements and the dynamics of rural
territorial development in Latin America. World Development, 36, 2874–2887.
http://dx.doi.org/10.1016/j.worlddev.2007.11.017
Berdegué, P. J. A., Bebbington, A., Escobal, J., Favareto, A., Fernández, M. I., Ospina, P., et al. (2012).
Territorios en movimiento dinámicas territoriales rurales en América Latina (Territories in
movement rural territorial dynamics in Latin America) (Working Paper 110). Santiago, Chile:
Programa Dinámicas Territoriales Rurales - Rimisp. http://www.rimisp.org/wp-content/files mf/
1366233526N1102012TerritoriosenMovimientoBerdegueBebbingtonEscobal Favaretoetal.pdf
Berkes, F. (2009). Evolution of co-management: Role of knowledge generation, bridging organizations
and social learning. Journal of Environmental Management, 90, 1692–1702.
http://dx.doi.org/10.1016/j.jenvman.2008.12.001
Brunckhorst, D. J. (2000). Bioregional planning: Resource management beyond the new millennium.
London: Routledge.
Brussaard, L., Caron, P., Campbell, B., Lipper, L., Mainka, S., Rabbinge, R., et al. (2010). Reconciling
biodiversity conservation and food security: Scientific challenges for a new agriculture. Current
Opinion in Environmental Sustainability, 2(1–2), 34–42.
http://dx.doi.org/10.1016/j.cosust.2010.03.007
Clark, M. L., Aide, T. M., & Riner, G. (2012). Land change for all municipalities in Latin America and
the Caribbean assessed from 250-m MODIS imagery (2001–2010). Remote Sensing of
Environment, 126, 84–103. http://dx.doi.org/10.1016/ j.rse.2012.08.013
Cornwall, A. (2008). Unpacking ‘participation’: Models, meanings and practices. Community
Development Journal, 43, 269–283. http://dx.doi.org/10.1093/ cdj/bsn010 Cunningham, S. A.,
Attwood, S. J., Bawa, K. S., Benton, T. G., Broadhurst, L. M., Didham, R. K., et al. (2013). To
close the yield-gap while saving biodiversity will require multiple locally relevant strategies.
30
Agriculture, Ecosystems & Environment, 173, 20–27.
http://dx.doi.org/10.1016/j.agee.2013.04.007
DeClerck, F. A. J., Chazdon, R., Holl, K. D., Milder, J. C., Finegan, B., Martinez-Salinas, A., et al.
(2010). Biodiversity conservation in human-modified landscapes of Mesoamerica: Past, present
and future. Biological Conservation, 143(10), 2301–2313.
http://dx.doi.org/10.1016/j.biocon.2010.03.026
De Groot, R. S., Alkemade, R., Braat, L., Hein, L., & Willemen, L. (2010). Challenges in integrating
the concept of ecosystem services and values in landscape planning, management and decision
making. Ecological Complexity, 7, 260–272. http://dx.doi.org/10.1016/j.ecocom.2009.10.006
DeFries, R., & Rosenzweig, C. (2010). Toward a whole-landscape approach for sustainable land use in
the tropics. Proceedings of the National Academy of Sciences of the United States of America,
107, 19627–19632. http://dx.doi.org/10.1073/pnas.1011163107
Doak, D. F., Bakker, V. J., Goldstein, B. E., & Hale, B. (2013). What is the future of conservation?
Trends in Ecology & Evolution, 29, 77–81. http://dx.doi.org/10.1016/j.tree.2013.10.013
Echeverry-Perico, R., & Ribero, M. P. (2002). Nueva ruralidad: Visión del territorio en América
Latina y el Caribe (New rurality: Vision of the territory in Latin America and the Caribbean).
Inter-American Institute for Cooperation on Agriculture - IICA.
http://repiica.iica.int/docs/B0536e/B0536e.pdf
Ellis, E. C., Goldewijk, K. K., Siebert, S., Lightman, D., & Ramankutty, N. (2010). Anthropogenic
transformation of the biomes, 1700 to 2000. Global Ecology and Biogeography, 19, 589–606.
http://dx.doi.org/10.1111/j.1466-8238.2010.00540.x
ERAS. (2008). Estratégia regional agroambiental y de salud de Centroamérica: 2009–2024 (Central
American agro-environmental and health regional strategy:
2009–2024). http://www.ruta.org/documentos no indexados/ERAS/ ERAS-21-MAYO-FINAL.pdf
FAO (Food and Agriculture Organization of the United Nations). (2011). Looking ahead in world food
and agriculture: Perspectives to 2050. Rome, Italy: Food and Agriculture Organization of the
United Nations-FAO. http://www.fao.org/docrep/014/i2280e/i2280e.pdf
Foley, J. A., Defries, R., Asner, G. P., Barford, C., Bonan, G., Carpenter, S. R., et al. (2005). Global
consequences of land use. Science, 309, 570–574. http://dx.doi.org/10.1126/science.1111772
Fry, G. L. A. (2001). Multifunctional landscapes-towards transdisciplinary research. Landscape and
Urban Planning, 57, 159–168. http://dx.doi.org/ 10.1016/S0169-2046(01)00201-8
Harvey, C. A., Komar, O., Chazdon, R., Ferguson, B. G., Finegan, B., Griffith, D. M., et al. (2008).
Integrating agricultural landscapes with biodiversity conservation in the Mesoamerican hotspot.
Conservation Biology: The Journal of the Society for Conservation Biology, 22(1), 8–15.
http://dx.doi.org/10.1111/j.1523-1739.2007.00863.x
Höppner, C., Frick, J., & Buchecker, M. (2007). Assessing psycho-social effects of participatory
landscape planning. Landscape and Urban Planning, 83, 196–207.
http://dx.doi.org/10.1016/j.landurbplan.2007.04.005
31
IMFN (Ibero-American Model Forest Network). (2013). IMFN website. http://www.imfn.net/iberoamerican-model-forest-network
Jordan, N., & Warner, K. D. (2010). Enhancing the multifunctionality of US agriculture. BioScience,
60, 60–66. http://dx.doi.org/10.1525/bio.2009.60.1.10
Kothari, A., Corrigan, C., Jonas, H., Neumann, A., & Shrumm, H. (Eds.). (2012). Recognising and
supporting territories and areas conserved by Indigenous Peoples and Local Communities: Global
overview and national case studies (Technical series no. 64, p. 160). Montreal, Canada: Secretariat
of the Convention on Biological Diversity, ICCA Consortium, Kalpavriksh, and Natural Justice.
http://www.cbd.int/doc/publications/cbd-ts-64-en.pdf
LPFN (Landscapes for People, Food and Nature Initiative). (2012). Landscapes for people, food and
nature (LPFN): The vision, the evidence and next steps. Washington, DC, USA: EcoAgriculture
Partners. http://landscapes.ecoagriculture.org/ documents/files/landscapes for people food and
nature.pdf
Milder, J. C., Buck, L. E., DeClerck, F. A. J., & Scherr, S. J. (2012). Landscape approaches to
achieving food production, natural resource conservation, and the millennium development goals.
In J. C. Ingram, F. A. J. DeClerck, & C. Rumbaitis del Rio (Eds.), Integrating ecology and poverty
reduction (pp. 77–108). New York, NY: Springer.
Milder, J. C., Hart, A. K., Dobie, P., Minai, J., & Zaleski, C. (2014). Integrated landscape initiatives for
African agriculture, development, and conservation: A region-wide assessment. World
Development, 68, 68–80. http://dx.doi.org/ 10.1016/j.worlddev.2013.07.006
Myers, N., Mittermeier, R. A., Mittermeier, C. G., da Fonseca, G. A., & Kent, J. (2000). Biodiversity
hotspots for conservation priorities. Nature, 403, 853–858. http://dx.doi.org/10.1038/35002501
Naveh, Z. (2001). Ten major premises for a holistic conception of multifunctional landscapes.
Landscape and Urban Planning, 57, 269–284. http://dx.doi.org/10.1016/S0169-2046(01)00209-2
Nelson, E., Mendoza, G., Regetz, J., Polasky, S., Tallis, H., Cameron, D. R., et al. (2009). Modeling
multiple ecosystem services, biodiversity conservation, commodity production, and tradeoffs at
landscape scales. Frontiers in Ecology and the Environment, 7(1), 4–11.
http://dx.doi.org/10.1890/080023
O’Farrell, P. J., & Anderson, P. M. (2010). Sustainable multifunctional landscapes: A review to
implementation. Current Opinion in Environmental Sustainability, 2, 59–65.
http://dx.doi.org/10.1016/j.cosust.2010.02.005
Perfecto, I., Vandermeer, J. H., & Wright, A. (2009). Nature’s matrix:Linking agriculture, conservation
and food sovereignty. London: Earthscan.
Platteau, J. P., & Abraham, A. (2002). Participatory development in the presence of endogenous
community imperfections. The Journal of Development Studies, 39, 104–136.
http://dx.doi.org/10.1080/00220380412331322771 Porter-Bolland, L., Ellis, E. A., Guariguata, M.
R., Ruiz-Mallén, I., Negrete- Yankelevich, S., & Reyes-García, V. (2012). Community managed
forest and forest protected areas: An assessment of their conservation effectiveness across the
tropics. Forest Ecology and Management, 268, 6–17.
http://dx.doi.org/10.1016/j.foreco.2011.05.034
32
Sachs, J., Remans, R., Smukler, S., Winowiecki, L. A., Andelman, S. J., Cassman, K. G., et al. (2010).
Monitoring the world’s agriculture. Nature, 466(July), 558–560.
Sayer, J., Sunderland, T., Ghazoul, J., Pfund, J.-L., Sheil, D., Meijaard, E., et al. (2013). Ten principles
for a landscape approach to reconciling agriculture, conservation, and other competing land uses.
Proceedings of the National Academy of Sciences of the United States of America, 110(21), 8349–
8356. http://dx.doi.org/ 10.1073/pnas.1210595110
Schatan, C. (2002). World environmental organization: A Latin American perspective. The World
Economy, 25, 673–684. http://dx.doi.org/10. 1111/1467-9701.00456
Schejtman, A., & Berdegué, J. (2008). Towards a territorial approach for rural development
(Discussion Paper no. 17). Manchester, UK: Research Programme Consortium for Improving
Institutions for Pro-Poor Growth. http://www.ippg.org.uk/papers/dp17.pdf
Scherr, S. J., & McNeely, J. A. (2008). Biodiversity conservation and agricultural sustainability:
Towards a new paradigm of “ecoagriculture” landscapes. Philosophical Transactions of the Royal
Society of London. Series B, Biological Sciences, 363, 477–494.
http://dx.doi.org/10.1098/rstb.2007.2165
SECAC (Secretariat of the Central American Agricultural Council). (2012). ECADERT: A strategy for
the sustainable development of our rural areas 2010–2030. San José, Costa Rica: Inter-American
Institute for Cooperation on Agriculture. http://www.territorioscentroamericanos.org/ecadert/
Documentos%20recientes%20ECADERT/ECADERT%20Educational%20version
%20in%20English.pdf
Selman, P. (2009). Planning for landscape multifunctionality. Sustainability: Science, Practice, &
Policy, 5, 45–52. http://scholar.google.co.cr/archives/ vol5iss2/communityessay.pselman.html
SINAC (Sistema Nacional de Áreas de Conservación). (2008). Guía práctica para el dise˜
no, oficialización y consolidación de corredores biológicos en Costa Rica
(Practical guide to desing, regulate and consolidatate biological corridors in Costa Rica). San José,
Costa Rica: Sistema Nacional de Áreas de Conservación – SINAC.
https://www.sinac.go.cr/corredoresbiologicos/documentacion/guia oficializacion.pdf
Southern, A., Lovett, A., O’Riordan, T., & Watkinson, A. (2011). Sustainable landscape governance:
Lessons from a catchment based study in whole landscape design. Landscape and Urban Planning,
101, 179–189. http://dx.doi.org/ 10.1016/j.landurbplan.2011.02.010
Tscharntke, T., Clough, Y., Wanger, T. C., Jackson, L., Motzke, I., Perfecto, I., et al. (2012). Global
food security, biodiversity conservation and the future of agricultural intensification. Biological
Conservation, 151(1), 53–59. http://dx.doi.org/10. 1016/j.biocon.2012.01.068
Turner, W. R., Brandon, K., Brooks, T. M., Gascon, C., Gibbs, H. K., Lawrence, S., et al. (2012).
Global Biodiversity Conservation and the Alleviation of Poverty. BioScience, 62(1), 85–92.
http://dx.doi.org/10.1525/bio.2012.62.1.13
Vital Signs. (2013). Vital Signs website. www.vitalsigns.org Walker, B. H., Carpenter, S. R.,
Rockstrom, J., Crépin, A.-S., & Peterson, G. D. (2012). Drivers, “Slow” Variables, “Fast”
Variables, Shocks, and Resilience. Ecology and Society, 17(3), 1–4. http://dx.doi.org/10.5751/ES05063-170330
33
CHAPTER 2: INTEGRATED LANDSCAPE MANAGEMENT IN ACTION: INSIGHTS
FROM TWENTY-THREE CASES IN LATIN AMERICA AND THE CARIBBEAN
Jeffrey C. Milder, Natalia Estrada-Carmona, Abigail K. Hart, Celia A. Harvey, and Fabrice A.J.
DeClerck
1. Abstract
Integrated landscape approaches are being widely used across Latin America and the Caribbean (LAC)
to manage multi-functional landscapes for their potential to mediate between food production and
conservation, while improving livelihoods and governance at a landscape scale. An initial survey of
104 initiatives across LAC has described the contexts, motivations, activities, participants and
outcomes, however there is still poor understanding of the particular historical, social and economic
forces that drive integrated landscape initiative (ILI) formation, the roles of pre-existing and newly
established organizations in ILIs, the impact specific policies and financial mechanisms in sustaining
them, and their perceived effectiveness in relation to stated objectives. To fill this gap, we interviewed
75 leaders and key stakeholders in a subset of 23 of the 104 surveyed initiatives, systematically
selected for geographic diversity, range of management systems and range of investments and
outcomes. We use an analytical framework developed from the survey and interview data to describe
pathways for ILI development, as well as some potential pitfalls. Although we found a logical
progression from establishing a landscape identity to perceiving outcomes at the landscape scale, in
reality the levels of engagement are not always pursued or achieved sequentially. Results indicate that
the creation or strengthening of the landscape identity occurs due to the conjunction of several factors
such as land use change or response to crisis. We found that although local organizations play an
important role in leading initiatives and providing continuity of management with a landscape,
international or national organizations also offer key support through funding, technology and
research. Activities are most often oriented toward building human capital and creating participatory
34
management plans, however they also include activities related to conservation and sustainable
agriculture in targeted areas. ILIs report their greatest effectiveness as building human capital and
establishing more effective mechanisms for governance. Policy mechanisms were found to be
supportive in some cases and prohibitive in others. In some cases, policies granting legal status to
initiatives were instrumental in ILI formation, in others, policies created perverse incentives, limiting
ILI effectiveness. Financial support for ILIs was often fragmented and intermittent throughout levels
of development. While long term funding was helpful in supporting ILI activities and establishing
coordinating organizations, many ILIs established organizations and achieved outcomes through
widespread volunteerism. Other limitations that ILIs face are a lack of law enforcement, low levels of
governmental support, and intermittent participation or absence of key stakeholders. These 23 in depth
cases enrich our understanding of ILI characteristics, and present a framework for looking at the
patterns of their development, the roles of policy and finance mechanisms in the development process,
and potential pathways that lead to landscape scale outcomes.
Keywords: landscape, conservation, agriculture, rural development, governance, Latin
America
35
2. Introduction
In recent years, there has been a surge of interest in integrated landscape management approaches to
address complex challenges in rural landscapes where multiple stakeholders are pursuing potentially
competing interests related to food production, social and economic development, and ecosystem
conservation (Milder et al., 2012; Sayer et al., 2013; Scherr et al., 2012; Scherr and McNeely, 2008).
Landscape approaches are now being applied to address a wide range of linked challenges including
biodiversity conservation in human-modified landscapes (Perfecto et al. 2009), conservation and
management of ecosystem services (Tscharntke et al. 2005), terrestrial climate change mitigation and
REDD+ (reduce emissions from deforestation and forest degradation) (Harvey et al. 2013), food
security, disaster risk reduction, and eco-certification (Ghazoul et al. 2009), among others. Integrated
landscape approaches have also attracted considerable interest among the international donor and
policy communities, exemplified recently by the convening of a two day “Global Landscapes Forum”
at the UN Framework on Climate Change Convention’s 2013 Conference of Parties to address all
issues related to land use and climate change in an integrated manner.
But although there is now considerable interest in landscape approaches, very little detailed
information exists on how these initiatives function in practice and what factors influence their
outcomes and effectiveness. Recent literature on integrated landscape approaches has tended to focus
on its potential benefits and limitations (Sayer, 2009; Scherr and McNeely, 2008) or to offer guiding
principles for implementing such approaches (Frost et al., 2006; Sayer et al., 2013). To date, however,
empirical studies of landscape initiatives have tended to be anecdotal or case-specific in nature and
therefore unable to elucidate common themes, mechanisms, or challenges. Additionally, case studies
and characterizations of landscape initiatives have not necessarily been detailed or thematically
comprehensive enough to clarify the political, social and economic contexts in which these initiatives
take place, or the effectiveness of management strategies intended to deliver and measure outcomes
across multiple objectives.
36
Given these existing limitations in the knowledge base, more robust evidence is urgently needed to
provide empirically-rooted guidance for the growing set of rural communities, governments, civil
society organizations, policy makers, and donors that seek to apply integrated landscape approaches.
In this study, we conduct an empirical assessment of the practice of integrated landscape management
in Latin America and the Caribbean (LAC) to help address these critical gaps. The resulting evidence
can inform the design of future investments in landscape approaches (e.g., donor-funded programs)
and identify important lessons that may assist the communities and multi-stakeholders group that are
attempting to navigate the complex terrain of integrated, multi-functional landscape management.
The terms “landscape approach” and “integrated landscape management” have been used to refer to
many different types of activities that vary widely in their scale and focus (Scherr & Shames 2012). To
bound this investigation, therefore, we focus on discrete “integrated landscape initiatives” (hereafter
referred as “landscape initiatives” or simply “initiatives”), which we define as projects, programs,
platforms, or sets of activities that: 1) explicitly seek to improve food production, biodiversity or
ecosystem conservation, and rural livelihoods; 2) work at a landscape scale and include deliberate
planning, policy, management, or support activities at this scale; 3) involve inter-sectoral coordination
or alignment of activities, policies, or investments at the level of ministries, local government, farmer
and community organizations, civil society groups, donors, and/or the private sector; and 4) are highly
participatory, supporting adaptive, collaborative management within a social learning framework
(Milder et al., 2014).
In a companion study (Estrada-Carmona et al., in review), we provided an initial characterization of
104 landscape initiatives in the Latin America and the Caribbean (LAC) region, including the context,
objectives, participants, component activities and investments, outcomes, and key successes and
failures of such initiatives. This study revealed that such initiatives are relatively common across the
LAC region. Although many of the individual landscape initiatives were initiated or supported by
37
externally-supported projects or programs, the region has developed its own capacities and paradigms
for conducting integrated landscape management, and most of the initiatives involved significant
participation and support from local and national governmental bodies. Consistent with the definition
of landscape initiatives presented above, the LAC initiatives were clearly multi-stakeholder efforts,
involving an average of more than 11 stakeholder groups per case. In addition, the initiatives took a
strongly “multi-functional” approach to landscape management, each pursuing an average of more
than nine specific objectives, spanning at least three of four main areas (hereafter referred to as
“domains”) of landscape multi-functionality: food production, ecosystem conservation, rural
livelihoods, and institutional planning and management (Estrada-Carmona et al., in review). However,
the initiatives were reported to have the highest levels of investment in, and positive outcomes related
to, institutional planning and coordination. This finding suggests that institutional strengthening is
often considered as a critical foundation for multi-functional landscape management, but that it is
often too early to say whether such foundations will translate into the delivery of sustainable benefits
for food production, ecosystem conservation, and livelihoods improvement.
To deepen empirical understanding of landscape initiatives, the present study investigates in greater
detail a representative subset of 23 of the 104 initiatives included in the companion analysis. To do so,
the study moves beyond existing conceptual and anecdotal perspectives on landscape management to
provide a more systematic and nuanced characterization of why landscape approaches are being used,
what types of institutions and governing mechanisms are being put into place to implement them, how
effectively these structures function to implement landscape activities, and to what degree landscapelevel benefits are being delivered. This information is critical for understanding how stakeholder
groups can more effectively navigate the complex terrain of landscape management and what
governments, civil society organizations, and donors might do to support landscape approaches more
effectively in the future.
38
We address three research questions. First, to what extent do initiatives contribute to or engage in each
of four elements of integrated landscape management—namely, landscape identity, landscape
institutions, landscape action, and landscape results—as defined by an analytical framework we
elaborate below. Second, which internal and external factors have been most important in supporting
or undermining initiatives’ effectiveness relative to their stated objectives? And, third, in light of
experience of these 23 initiatives, what appear to be promising levers by which governments, donors,
and civil society might improve the enabling environment to support effective landscape initiatives
where stakeholders choose to pursue them?
3. Methodology
This study and the earlier companion study described above (Estrada-Carmona et al., in review) were
designed as complementary research activities to review and analyze experience with landscape
initiatives in the LAC region. The pair of studies follows a mixed methods sequential explanatory
design to conduct systematic analysis of quantitative and qualitative data (Ivankova et al., 2006). The
earlier study used an online survey of leaders and managers of landscape initiatives to characterize and
quantify initiative objectives, participating stakeholders and sectors, investments, and outcomes of a
relatively large sample of initiatives (Estrada-Carmona et al., in review). Data from the survey
responses informed the design of a semi-structured interview template to guide the present study,
which was based on in-depth interviews with representatives of multiple stakeholder groups per
initiative. This method enabled us to collect information and document insights from multiple
perspectives on each landscape initiative, and to triangulate among potentially divergent views. Data
from both phases of research (i.e., the online survey and the semi-structured interviews) were used to
address the four research questions relative to the analytical framework elaborated below.
Of the 104 initiatives analyzed in the Estrada-Carmona et al. study, we selected a subset of 42 as
candidates for more in-depth study according to three criteria: 1) overall geographic representation
relative to the full set of 104 initiatives; 2) representation of a range of different development or land
39
management paradigms present in the LAC region (e.g., Model Forests, biological corridors, and
Biosphere Reserves); and 3) focus on initiatives that registered high levels of “multi-functionality” as
indicated by investments and/or outcomes spanning the four domains of agriculture, ecosystem
conservation, livelihood development, and institutional strengthening. For each of the 42 candidate
initiatives, we first contacted the representative who completed the online survey and invited him or
her to participate in a one-hour interview. During this initial interview, we requested contact
information for at least three additional stakeholders who possessed deep knowledge of the initiative
and the landscape, and who could, collectively, accurately represent the agricultural, rural
development, and ecosystem conservation efforts in the landscape. We then contacted each of these
stakeholders to request the opportunity to conduct a semi-structured interview. Of the 42 candidate
initiatives, there were 23 for which we were able to interview the survey respondent and at least one
other landscape stakeholder. We analyzed only this subset of 23 initiatives for which we were able to
collect sufficient data.
Interviews followed a semi-structured template that included a core set of 15 mostly open-ended
questions posed to all interviewees, and additional questions posed to those with the greatest expertise
and familiarity with particular aspects of each initiative or landscape. To address the research
questions, we posed interview questions related to seven different themes: 1) characterization of the
landscape’s economic, ecological, political and historical context; 2) motivations, objectives, and core
activities of the initiative; 3) modes of participation by key stakeholder groups internal and external to
the landscape; 4) the role, establishment and evolution of the local institutions supporting integrated
landscape management; 5) policy context, barriers, and any efforts at policy reform included within
the initiative; 6) initiative results and effectiveness; and 7) additional reflections and lessons learned.
(For a copy of the interview template, please see the Supplemental Information.) We pilot-tested the
interview template on two initiatives and subsequently refined it based on these tests, prior to full-
40
scale implementation. For the 23 initiatives included in the study, we conducted a total 75 interviews,
in Spanish and Portuguese, from June to August 2012.
We analyzed the interviews at two levels. First, we compared interview responses within each
initiative to corroborate survey results and assess the level of agreement in interviewees’ perceptions
regarding the initiative’s context, main characteristics, and effectiveness. This analysis was particularly
important for assessing whether there was a common landscape identity, shared objectives across
sectors and scales, and consistent perceptions of the distribution of benefits and costs among
stakeholder groups. In cases of contradictory answers among respondents, we made note of the areas
of contradiction, while also identifying, for the purpose of longitudinal analysis, the most common
answer (or, in the case of a tie, the answer provided by the respondent who also participated in the
online survey). We then analyzed responses for each initiative as a collective whole to understand, as
completely as possible, the initiative’s context, characteristics, outcomes, successes, and limitations.
Second, we analyzed the full set of 23 initiatives to discern patterns, commonalities, differences, and
recurring trends or lessons learned. Results pertaining to factual characteristics of the full set of
initiatives are reported as basic descriptive statistics. Based on the analytical framework, we also
evaluated the degree to which the initiatives displayed clear and common understandings of landscape
identity, developed effective landscape institutions, implemented activities in support of landscape
management objectives, and achieved equitably distributed landscape-level results. Finally, we used
tallies to summarize additional interviewee observations and themes related to successes, failures,
lessons learned, and key aspects of the enabling environment reported to affect each initiative.
3.1. Analytical framework
To structure the data analysis, we developed an analytical framework defining the major elements and
stages of a landscape initiative (Figure 8). The framework incorporates evidence on key dimensions of
41
landscape approaches from the companion study (Estrada-Carmona et al., in review) and is informed
by relevant literature on natural resource management and polycentric governance. Specifically, the
frameworks construes mosaic landscapes as complex social-ecological systems in which human
behavior and decision-making shape, and are shaped by, land use patterns and functions—all within
the context of dynamically changing ecosystems, climate, markets, and external policies.
Landscape initiatives may be seen as including four critical elements: 1) formation of a shared
landscape identity accepted by a range of stakeholders, 2) establishment or strengthening of
institutions to plan or coordinate activities at landscape scale, 3) implementation of activities and
investments to improve landscape performance, and 4) delivery of outcomes at a landscape scale. As
indicated in Figure 8, these elements may be conceptualized as a series of four stages that succeed one
another in logical progression. In reality, though, the stages are not always pursued or achieved
sequentially. Activities in the early stages of identity formation and institutional establishment are
neither a prerequisite for nor a guarantee of landscape scale activity or outcomes: an initiative may
derail at any stage for a variety of reasons, or, conversely, top-down processes may contribute to
landscape activities or outcomes even when not predicated on a shared landscape identity or landscape
institutions (Figure 8). Additionally, the process of landscape management is often iterative and
adaptive, as local institutions and even the identity of the landscape itself evolve alongside
management efforts.
The first element involves formulating a landscape identity that is generally shared among a range of
stakeholders. By this, we mean not only the cultural-spatial landscape identity that people attribute to a
place based on its spatial layout, human geography, ecology, and history (Stobbelarr & Pedroli 2011)
but also a “functional” landscape identity by which the landscape is construed as a cohesive
management unit for addressing specific conflicts, challenges, or opportunities. In the latter instance,
the landscape provides an appropriate scale and context in which to understand and address specific
42
management needs. Landscape identity may emerge more or less spontaneously through stakeholders’
common experience and understanding, or it may be forged or solidified through interactive, multistakeholder processes such as participatory mapping or rural appraisal exercises.
The second stage entails establishing or strengthening institutions and formal or informal governing
bodies to lead or facilitate integrated landscape management. As highlighted elsewhere, the process of
alignment or adapting these existing systems to address cross-sector landscape-scale challenges is one
that has been characterized—using terms such as “muddling through” and “bricolage”—as complex,
messy, and often ad-hoc (Sayer 2009, Cleaver 2002). Functions of landscape institutions: to coordinate
actions across scales (local to national) and sectors, manage complex negotiation processes among
stakeholders with divergent interests. repurposing or re Institutions for landscape management would
be expected often to have much in common with—if not be identical to—institutions for multi-scale
governance of natural resources. As such, they should be equipped to guide the management of socioecological systems, particularly where these systems have fuzzy boundaries or cross jurisdictional
boundaries, where they contain common pool resources that are susceptible to the “tragedy of the
commons”, or where they are expected to provide flows of benefit to numerous stakeholders with
differing and potentially conflicting needs. However, institutions for integrated landscape management
may sometimes place a stronger emphasis on economic development and social welfare than those
oriented more narrowly toward natural resource management. Specific functions of “landscape
institutions” may include fostering dialogue, negotiation, and planning processes to define a shared
vision for the landscape; coordinating activities and investments of different actors in the landscape;
governing rights and regulations related to land and natural resources; monitoring landscape condition
and initiative outcomes; and advocating for supportive policies, market incentives, and investments
from external actors.
43
The third stage involves the implementation of activities to improve landscape management,
particularly through efforts that enhance synergies or negotiate tradeoffs among food production,
ecosystem conservation, and rural livelihoods. Such activities and investments would typically
include: 1) management actions explicitly occurring at the landscape scale, such as landscape-level
zoning regulations, watershed management efforts, or regional infrastructure or value chain
investments; 2) management actions occurring at smaller scales, but with a deliberate aim of
contributing to landscape-level outcomes, such as conservation-friendly farming practices; and 3)
implementation of, or advocacy for, policies and incentives (e.g., local, provincial, or national) that
support the aims of landscape stakeholders. As indicated in Figure 8, within the logical sequencing of
landscape initiatives, landscape action often flows from multi-stakeholder mandates and planning
processes embedded in earlier steps. But landscape action can also flow from top-down processes that
bypass these steps.
The fourth and final stage—landscape-scale results—refers to the achievement of specific outcomes,
impacts, or benefits related to characteristics or functions that are mediated at a landscape level. For
instance, the conservation of wide-ranging species, improvements in downstream water quality in a
major catchment, or the establishment of robust post-harvest value chains beyond a local market may
all be examples of “landscape results” predicated on coordinated activities and management practices
in several different parts of the landscape. Where a landscape initiative has been effective, such
outcomes will be closely related to stakeholders’ original objectives for landscape multi-functionality,
and benefits should be equitably distributed among stakeholders.
Overall, the framework defines an idealized notion of landscape initiatives as comprising four
logically sequential stages (the main circle in (Figure 8), while also representing a range of variations
from this model (arrows into and out of the main circle) that are likely to occur sometimes in practice.
Taken together, the model provides a framing hypothesis about how landscape initiatives progress and
44
deliver results. We use the lens of this hypothesis to evaluate the 23 landscape initiative included in
this study.
Figure 8. Visual depiction of the analytical framework described in the narrative. Landscape initiatives
may be seen as comprising four stages, with a logical though not inevitable progression beginning
with landscape identity (bottom loop) and advancing clockwise to landscape institutions, landscape
actions, and landscape results. This progression is indicated by the prevailing clockwise direction of
arrows, while lighter-colored grey arrows indicate feedbacks and iterations that can occur within
landscape initiatives. At each of the four stages, numerous factors may either support (small clockwise
arrows) or undermine (small counterclockwise arrows) an initiative, potentially accelerating or
impeding its progression from one stage to the next, or even derailing an initiative entirely. Factor in
the center are present in all stages.
45
4. Results
We present the results in three sub-sections. First, we briefly characterize the 23 landscape initiatives
and their context. Next, we present results related to the first two of our three research questions: 1)
analysis of landscape identity, landscape institutions, landscape action, and landscape results according
to the analytical framework; and 2) assessment of key factors that supported or undermined the
effectiveness of the initiatives. Insights related to the third research question (policy implications) are
provided in the Discussion section.
4.1. Characterization of the landscape initiatives and their context
The 23 initiatives represent 13 countries: five in Central America, six in South America, plus Cuba and
the Dominican Republic in the Caribbean (Figure 9). Initiatives tend to take place in mosaic
landscapes with diversified economies including food production for subsistence and local use as well
as export. Agriculture was identified as an important economic activity in almost all of the landscapes,
while forestry and/or tourism were also prevalent in the majority of cases. Extractive industries were
an important part of the economy in about half of the cases. Almost three-fourths of the landscapes
produced a major export crop, such as coffee, soy, pineapple, avocado, or tobacco. In addition, nearly
all of the landscapes produced a variety of crops for subsistence and local sale, including basic grains,
vegetables, potato, and others. The landscapes tended to include a mixture of land ownership and land
tenure arrangements, with all 23 containing land owned and managed by individual private owners
and the large majority also containing public or state lands (21 initiatives) and communal lands (15
initiatives). Seven of the landscapes included private land owned by large companies. Landscapes size
ranged from approximately 10 to 550,000 square kilometers, with populations ranging from
approximately 400 to 535,000 inhabitants. For additional descriptive information about the 23
landscapes and corresponding initiatives, please see Table 1and APPENDIX C.
46
Figure 9. Location of the 23 integrated landscape initiatives included in this study.
47
Table 1. Summary descriptions of the 23 integrated landscape initiatives included in this study. The
first column indicates numbers by which the initiatives are referred in the narrative.
# Initiative name Country Description
1 Grasslands
Argentina Focuses on creating alliances between farmers and other stakeholders to
Alliance
manage grasslands and remaining forests for agricultural production
(predominantly soy and livestock) as well as biodiversity across more than
500,000 km2 of northwestern Argentina
2 State
Brazil
Aims to mitigate wetland drainage due to agriculture and infrastructure
environmental
changes through participatory management and socioeconomic development in
protection area of
137 km2 of the Rio Gravatai basin in Southeastern Brazil
the Banhado
Grande
3 Río Sucio
Colombia Promotes agroecology-based farming to improve local livelihoods, natural
Indigenous and
resource conservation and food security with smallholder farmers, especially
Farmers
by slowing the conversion of farms to full sun coffee across 430 km2 of
producers
Colombia’s western mountain range
association ASPROINCA
4 Integrated
Brazil
Links stakeholders engaged in agriculture and mining to improve integrated
territorial
territorial management of approximately 40 km2 of the Ribeirão do Boi
management of
watershed to reduce natural resource degradation and poverty through
the Ribeirão do
production diversification and value chain development
Boi
5 Araucarias del Chile
Uses the Model Forest framework to co-manage 600 km2 in south-central
Alto Malleco
Chile for livestock, fodder, and pine forests, and to protect the native Araucaria
Model Forest
species and preserve the local culture
6 Chiquitano
Bolivia
Aims to bring together livestock and grain farmers with forest managers and
Model Forest
conservationists under the Model Forest framework to protect the largest
remaining patch of tropical dry forest, covering 200,000 km 2 of eastern Bolivia
7 Sabana Yegua Dominican Engages farmers and other stakeholders in watershed management in the
Model Forest
Republic Dominican Republic’s Sebana Yegua region to reduce natural resource
degradation, poverty and erosion, and to safeguard downstream water supplies
8 Serranía de los Colombia Works with a network of rural producers and artisans to reduce resource
Paraguas-Parque
degradation, address social conflict, and implement agroecological farming
Natural Nacional
practices that maintain key ecosystem services in the Serranía de los Paraguas
Tatamá Micro– Parque Nacional Tatamá
Corridor
9 San Juan La
Costa Rica Preserves remnant forests and promotes landscape connectivity over nearly
Selva Biological
2,500 km2 of eastern Costa Rica to safeguard habitat for key species alongside
Corridor
sustainable economic development to support livelihoods of local communities
10 Volcánica
Costa Rica Promotes sustainable agricultural practices in coffee, sugarcane, livestock and
Central
horticulture for economic development and engages local communities in
Talamanca
tourism and conservation incentives for re-establishing connectivity among
Biological
protected areas over 1,140 km2 in the highly fragmented Talamanca region
Corridor
11 State
Brazil
Supports local participation in sustainable and diversified economic
environmental
development, particularly related to coffee, fruit and timber production
protection area
systems, to reduce watershed degradation, biodiversity loss and deforestation
“Santo Antônio”
over nearly 6,000 km2 of Brazil’s Atlantic coast.
12 Communication Brazil
Connects stakeholders interested in agroecological production practices for oil
strategies and
palm, grain and vegetable production, particularly through the development of
technology
a regional value chain and market for organic products, as well as technology
transfer for
transfer through a nationally supported program on more than 25,000 km2
market
development
48
# Initiative name Country
13 Sierra Gorda
Mexico
Biosphere
Reserve
Description
Promotes integration of resource conservation and sustainable agricultural
practices to reverse soil degradation, protect traditional seeds, improve
communities’ livelihoods and food security, and reduce migration in
approximately 384 km2 in the eastern branch of the Sierra Madre mountains
Nicaragua Strengthens indigenous and farmer communities to use an integrated approach
to managing indigenous territorial lands, while decreasing poverty levels and
increasing employment opportunities in fragile ecosystems in 8,500 km2 of
Nicaragua’s northern and southern autonomous regions
14 Integrated
ecosystem
management in
indigenous
communities
15 Sertao Veredas- Brazil
Peruaçu mosaic
16 Jujuy Model
Forest
Argentina
17 Watersheds
Conservation
Project
Panama
18 Tacaná Project II Guatemala
19 Buenavista
Biosphere
Reserve
Cuba
20 Río Plátano
Biosphere
Reserve
Honduras
21 Routes of the
South
Venezuela
22 Scolel Té
Mexico
23 Costero del Sur
Biosphere
Reserve
Argentina
Integrates protected area management with the promotion of sustainable
agricultural practices, community-based tourism and non-timber forest product
extraction to protect biodiversity, preserve local culture and halt agricultural
expansion over 18,000 km2 of the Brazilian cerrado
Aligns stakeholders under an integrated watershed management framework to
protect remaining cloud forests; promote sustainable production of tobacco,
sugarcane, fruit and basic grains; encourage resource conservation activities;
and provide community education over 1,500 km2 of Jujuy province in
northwestern Argentina
Strengthens watershed governance to address water use conflicts and stop
deforestation by fostering environmental education programs, supporting local
economic development and promoting sustainable agricultural practices for
cocoa, plantain, root crops and basic grains on nearly 15,000 km2 across
Panama
Strengthens watershed governance by improving coordination and capacity of
local stakeholders to implement integrated watershed management, decrease
land degradation, and reduce poverty over 2,600 km2 of watersheds around the
Tacaná volcano in western Guatemala
Promotes diversified and sustainable production practices that decrease soil
degradation and overexploitation of forests to protect key terrestrial and marine
ecosystem goods and services that contribute to communities’ well-being and
livelihood opportunities over 700 km2 of Cuba’s northern coast
Engages indigenous communities in management of the larger Rio Plátano
landscape in Honduras to protect the area’s natural resources by reducing
deforestation, promoting sustainable agricultural practices to improve food
security and slow agricultural expansion, and conducting supportive research
activities
Improves and diversifies local economic opportunities primarily through
developing a network of eco-tourism businesses and promoting sustainable
agricultural practices for coffee, vegetable, grain and livestock production in
5,600 km2 of the tropical Andes in southern Venezuela
Promotes sustainable agriculture and forest conservation on small farms and
communal lands to reduce poverty and improve community livelihoods,
primarily through participation in carbon payments for climate change
mitigation related to forest restoration in a small (10 km2) landscape in
Chiapas, Mexico
Fosters community involvement in protecting the unique biodiversity of the
Rio de la Plata estuary as well as the area’s traditional cultural and agricultural
practices through economic development activities, research and education on
250 km2 of Argentina’s Atlantic coast
49
4.2. Evaluating four stages of the initiatives’ development
To move beyond the basic descriptors presented above, here we evaluate the development of the 23
initiatives and their corresponding landscapes at the four stages defined in the analytical framework: 1)
landscape identity, 2) landscape institutions, 3) landscape actions and 4) landscape results (Figure 8).
4.2.1. Landscape identity
As noted above, in the context of landscape initiatives we construe landscape identity to refer not only
to stakeholders’ understanding of a landscape’s geographic boundaries and characteristics but also its
history, context, and key challenges to be addressed. Overall, respondents from twenty of the 23
landscapes appeared to share a common landscape identity based on at least one of these factors, but
only in nine landscapes were there largely concurring views on all such factors. In discussing the
landscape’s geography and context (interview questions 2.4, 2.5, and 3.1), respondents frequently
referred to landscape scale dynamics and interdependencies (e.g., among stakeholder groups or
portions of an ecosystem or watershed) as driving key local needs and challenges. But in no more than
half the cases did stakeholders appear to share a common understanding of the landscape’s physical
boundaries. Where there was a commonly held geographic landscape identity, this was frequently
linked to watershed or ecosystem boundaries around which the initiative had been developed in the
first place.
In contrast to geographical notions of the landscape, historical context and a common understanding of
key local challenges and needs tended to be stronger sources of shared landscape identity. In many
cases, respondents shared a conception of the landscape as being fundamentally defined by
combinations of events over the past few decades. These typically included some combination of
major land use changes (e.g., deforestation, agricultural expansion, major changes in cropping
patterns), land degradation (e.g., severe erosion, drought), natural disasters (e.g., floods, hurricanes),
infrastructure development, major demographic shifts (such as colonization), and major military or
50
political events (e.g., violent conflict, regime change, land redistribution). For the most part, these
defining changes were presented in a negative light, although some positive changes were identified,
including better transport infrastructure, land tenure regularization, and other policy reforms.
Similarly, shared landscape identity was evidenced by concordant understandings of landscape
challenges and priorities. Not surprisingly, many of these related to recent shaping events, and
included strong foci on improved natural resource management, watershed protection, forest
conservation and restoration, and more ecologically compatible farming systems (e.g., agroecology).
Poverty alleviation and economic diversification emerged as important landscape needs in about onethird of the cases. Needs for more participatory management approaches, improved alignment among
sectors and stakeholders, or landscape or territorial level planning were mentioned in more than half
the cases. Overall, we found considerable evidence of shared landscape identity but this identity was
generally more strongly related to understandings of the landscape as a functional entity or
management unit than as a geographic entity.
4.2.2. Landscape institutions
Institutional structures for convening and supporting landscape initiatives were quite diverse, spanning
continua from more participatory to less so, and from well-orchestrated multistakeholder platforms to
looser agglomerations of activities and decision-making authorities. Below we describe the role and
structure of landscape institutions relative to the initiatives’ genesis, decision-making systems, and
coordination and support for implementation.
4.2.3. Genesis
Initiatives arrive at integrated landscape management through a variety of pathways. Ten of the
initiatives were created out of an existing project or through the leadership of external actors with
51
priorities for the landscape. In some cases, they were national or regional actors tapping into available
funding to work with communities in landscapes of interest to them (e.g., the multiple Biosphere
Reserves, initiatives 13, 19, 20, 23). In other cases, the development of the initiative was prompted by
an international actor with interest in engaging in a particular landscape (e.g., initiatives 14 & 22).
Only three of the initiatives developed from purely local, grassroots efforts (initiatives 3, 7 and 8).
However, five of the ten initiatives that developed out of a network of actors were led by a consortium
of local stakeholder groups (e.g., initiative 10), while the other five developed out of networked actors
were led by a variety of local and external actors, often with distinct roles in the initiatives. In some
cases the networks were characterized by loose, informal collaboration (e.g., initiative 9) while in
others, collaboration was highly structured (e.g., initiative 18). In seventeen cases, one actor facilitated
the formation and development of the initiative. These actors were most commonly a local or national
level NGO, but also occasionally a government actor or a new group formed specifically to facilitate
the initiative.
4.2.4. Leadership/decision-making structures
The management committee is comprised by different stakeholders and its main roles are to define
priorities, design and implement the management plan, define strategies to fundraise resources for
activities implementation, monitor initiative progress, find allies inside/outside the landscape,
strengthen and support local and community based organizations, conflict resolution or mediation and
define stakeholders and organizations roles for the landscape functioning. Seventeen initiatives
supported the establishment of a management committee explicitly to coordinate or facilitate
integrated landscape management (i.e. communitarian base organization, management committee, or
directory). The management committee tends to work at smaller and more manageable territorial units
such as basin like in Tacaná II (initiative 18), subcorridor like in Costa Rican biological corridors; or
municipalities (initiative 6). The smaller units are articulated across the landscape to reach initiative
52
goals, however, it facilitates the planning of each unit according to its own social-environmental
context.
4.2.5. Capacity and implementation structures
Initiative leaders are in charge of guaranteeing initiatives functioning by articulating the diverse
stakeholders and coordinating the management committee, fundraising, planning, communicating and
coordinating logistics. Local organizations with an active and longtime presence in the area play a key
role leading the initiative (i.e. Mopawi or Grupo Ecológico Sierra Gorda), often in alliance with
governmental sectors such as protected areas (Grupo Ecológico Sierra Gorda). Local and national
governmental sectors and offices can also highly support and lead the initiatives as is in Buenavista
Biosphere Reserve (initiative 19). Scientific and environmental organizations (CCT, CATIE) have
been also leading and supporting biological corridors formation and establishment in Costa Rica. And,
other types of initiative leaders are communitarian-based organizations (Serraniagua, ASPROINCA,
CORNASAM), private non-profit foundation (Ándes Tropicales, Funatura, BioAtlantica) and
international organizations supporting bottom-up governance process (UICN). Initiatives with the
same management scheme, for example model forest, also present different institutions structures
where the initiative leader is a local organizations (FCBC, Surfuturo) or the management committee
(directory) itself legally conformed as a civil association (Initiatives 5 and 16). We found that rather
than the type of the initiative leader (i.e. research center, local organizations), the strength and
leadership of the initiative leader is what determines initiative progress. Initiatives with a weak leader
or heavily based on voluntarism work face strong limitations (i.e. Volcánica Central – Talamanca
Biological Corridor; initiative 10).
Sometimes the initiative leader and the management committee are two separate organizations, for
example, the Scientific Tropical Center is currently leading the San Juan la Selva Biological Corridor
(initiative 9), but the corridor has its multi-stakeholder and participatory management committee.
53
Also, in some cases the organizational leader and the management committee is the same and fulfill
both institutions’ functions, as in Model Forest Araucarias del Alto Malleco (initiative 5). The
management committee may be founded via voluntarism (initiative 10), governmental support
(initiative 19), combined international and local funding or by a mixture of all.
ILIs often require new local actors to develop new capacities and functions to support multistakeholder, multi-objective management. In many of the cases, a combination of international
organizations, national and state governmental agencies, or national NGOs help develop the capacities
of an existing actor to coordinate and facilitate the ILI’s activities. In the majority of cases, NGOs are
most frequently supported to play these new roles (e.g., initiatives 2, 3, and 4, to name a few),
although in a few cases local governments (e.g., initiative 23 and initiative 12) were also supported for
taking on new responsibilities and functions associated with ILI activities. International conservation,
development and research organizations, as well as universities or governmental aid agencies were the
most common supporters investing in building the capacity of local actors. Even in the case of
initiatives with strong local leadership, international networks such as the Biosphere Reserve Network
or International Model Forest Network provided sources of funding, legal recognition, technical
resources for design and implementation of ILI activities, and networks for knowledge exchange.
In 12 of the 23 cases, management committees or advisory boards were formed to guide the initiatives’
activities. These committees brought together new sets of stakeholders for collaborative management.
In a subset of those 12 cases, a new organization was formed to facilitate the ILI. The most common
purpose these ILIs mentioned for forming a new organization to manage the ILI was the need for a
neutral body for seeking and managing funding for the initiative, rather than designating an existing
institution with an established agenda and mission those particular functions. In the cases studied, the
new organizations always took the form of a non-governmental, non-profit institution or cooperative
institution. In addition to management committees, facilitating or leading organizations played
54
important roles organizing stakeholders, leading funding proposals, hiring staff to support ILI
management activities, or more generally maintaining the momentum of collaboration and activities.
Of the 12 ILIs with management committees, 10 of these also had facilitating organizations, some of
which were the newly formed organizations mentioned above. Seven of the cases without management
committees also had facilitating organizations to guide activities, four of which were NGOs, one led
by a government program, and the remaining two which were led by hybrid organizations.
4.2.6. Roles of other organizations and stakeholders
In addition to the capacity development, management and facilitating roles already mentioned,
participating stakeholder groups played a variety of other roles in the initiatives. Local communities –
particularly associations of producers, indigenous groups, women and youth – were reported as the
most influential stakeholders in elucidating the needs, concerns, goals, commitments and expectations
during the different stages of the initiatives. They were also key actors during the implementation
stage through participation in and management of pilot programs or farmer to farmer education (e.g.,
Initiatives 3, 12, 13 and 22). Although private companies had the lowest participation, they played key
roles in funding, training, value chain development, sustainable production and technical support (e.g.,
initiative 4).
Although government agencies were very frequently involved in the 23 cases, particularly at the local
level, seven initiatives mentioned that the participation of government was weak or absent during the
design of the initiative. At times, government bodies were present in the management committees or
decision making bodies but didn’t engage to the extent desired by other stakeholder groups. However,
government participation was linked with establishing the legitimacy of the ILIS and supporting them
through law enforcement, legal recognition and technical assistance, in addition to their
aforementioned roles in capacity development and facilitation.
55
International organizations provided a range of functions and, in contrast to government groups, were
often involved in the design of initiatives. They play key roles in channeling funds, providing technical
support, support knowledge exchange, and developing methodological approaches. Initiatives link to
international networks (e.g., Biosphere Reserves or Model Forests) or regional management schemes
(e.g., biological corridors), indicated that they had better support in establishing guidelines and
standards, learning from similar examples, creating seed fund programs and gaining legal support
from the government.
Successful collaboration between stakeholder groups was most often described as ongoing
participation and engagement in the initiatives activities – which they considered a sign that the
initiatives’ activities were perceived as legitimate and added significant value to stakeholders existing
activities in the landscape. Initiatives also defined success in terms of the diversity of participating
stakeholders, the initiatives’ ability to resolve conflicts internally, and the emergence of new
collaborations as a result of the initiative. Although these were the measures of success mentioned by
the initiatives, not all felt that they had achieved high levels of success. Only half reported high or very
high levels of success. At least five of those reported ongoing improvement of stakeholder
collaboration. Another ten initiatives reported moderate or mixed success, achieving some aspects of
stakeholder collaboration (e.g., ongoing participation), but falling short of other aspects (e.g.,
collective decision-making or engaging key stakeholder groups). Of the remaining initiatives, only one
reported low levels of success and another reported to still be in the initial stages of establishing
collaborative activities.
4.2.7. Landscape action
Respondents across initiatives were consistent in terms of the higher investments on activities related
to strengthening governance by creating institutional planning (all) and elaborating a participatory
management plan (16 initiatives), and empowering local communities by strengthening human capital
56
(all). Investments on activities related to sustainable agriculture practices (23initiatives), natural
resources conservation (22initiatives), and sustainable economic development either via value chain
development (14 initiatives) or sustainable tourism (9 initiatives) were also consider as part of the top
four or five key activities among initiatives.
High poverty levels, high dependence to natural resources, high vulnerability to extreme events, and
high stakeholders de-articulation were shared characteristics of local inhabitants across landscapes
according to respondents. The threat to an ecosystem and its services was also a commonalty across
initiatives; but the importance and the need of protecting those ecosystems was often highlighted due
to a research or scientific project that provided key information.
Degree to which Initiatives activities on communities’ governance and empowerment tend to be
targeted to cover the whole landscape, however, other activities tend to be targeted or localized in
strategic areas to overcome landscape limitations. Initiatives leaders and/or management committee
worked at landscape scale strengthening initiative governance by reaching and getting all landscape
stakeholders actively involved while reinforcing landscape identity; as respondents mentioned this is a
continuous process at both temporal and spatial scales. Investments on human capital were directed to
both, local communities and landscape initiative stakeholders. This investment included diverse
activities such as formal (incorporated at the local schools and universities level) and informal efforts
(training, seminars, workshops, field practice), and covered different subjects, from natural resources
management, organic production, sustainable agriculture practices, agro and eco-tourism, cooperatives
and association, project design and management, post harvesting production and monetary resources
management.
Specific activities: Investments on promoting sustainable practices were often planned at smaller
spatial units such as demonstrative units/villages or pilot farms (i.e. Initiatives 3, 12, 13 and 22), and
57
often depended on the availability of funding. These spatial units also helped to work at manageable
scales, while facilitating training, learning process, adopting sustainable agriculture practices and often
used as an example of the initiative goals. From these spatial units, initiatives extend their action area
based on community request or funding. Conservation actions were at both, farm and landscape scale.
At farm scale, initiates worked with farmers to help and promoted the protection and establishment of
private protected areas (i.e. Initiative 8 and 22). At landscape scale, key species (i.e. Initiative 9),
remnant forest patches or ecosystems were identified and legally protected (i.e. Initiative 8 and 19).
Also management plans for existent protected areas (i.e initiative 22) and connectivity between
protected areas (i.e initiative 10 and 11) were created and planned at landscape scale. Scenic beauty
and touristic potential was also planned at landscape scale as a strategy for sustainable development
and conservation (i.e. Initiative 21). Activities that supported a sustainable economic development
(value chain and tourism) were targeted to work with local farmers associations and cooperatives to
facilitate funds/inputs to farmers (i.e. micro loans, seeds) (initiatives 4 and 21), improve practices
(initiative 12), research to produce high quality products (agriculture and NTFPs) (initiative 5), access
to local markets (initiatives 3 and 8), and even work with the consumers (Initiative 1).
4.2.8. Landscape-scale results
To assess landscape scale results, respondents evaluated the effectiveness of the initiative
accomplishing each one of the four or five main objectives of the initiative, altogether with the used
criteria to evaluate them. We asked respondents to evaluate the effectiveness by giving a score as
follows, one - two (no effective), three (poorly effective), four (moderately effective), five (effective)
and six-seven (very effective). The used criteria's by respondents to assess effectiveness (assign the
score values) were often related to monitoring strategies (i.e. land use change, species monitoring,
water quality, soil quality), respondent perception, social changes (i.e. farmers- promoters,
cooperatives formed, active civil participation, greater concern for natural resources conservation), and
specific initiative products (i.e. web page, elaborated plans, protected areas, products in the market).
58
The most often mentioned objectives were related to sustainable economic development (21
initiatives), conservation (19 initiatives), governance (18 initiatives), local communities’
empowerment (15 initiatives) and sustainable agriculture (12 initiatives). Interestingly, although not all
the initiatives considered local empowerment and sustainable agriculture as a main objective, all
initiatives invested on training (building human capital) and promoting agrobiodiversity-sustainable
practices. Initiatives are effective (in average) achieving sustainable economic development,
conservation and local communities’ empowerment objectives. While initiatives are moderately
effective achieving governance and sustainable agriculture production objectives. Respondents also
highlighted across initiatives that despite the achieved outcomes, there is still much work to do due to
the landscapes and population size, landscape conflicts, initiative ambitions, and the complexity of
participatory and adaptive management approaches.
Outcomes in communities’ economic development were related to new markets for farmer products (8
and 14), more empowered and engaged families (initiative 3), more profitable agriculture (initiative
13), better infrastructure (initiative 7) and new productive cooperatives or associations that are
successfully functioning (initiatives 3, 11, 14 and 21). However, communities economic development
outcomes were limited due to population size (large), social conditions, and time (outcomes are
perceive in the middle-long term). Outcomes in conservation were related to positive changes on
ecosystems functions and health (initiative 2), improvements on biodiversity connectivity (initiative
19), and restoration and protection of natural resources (initiative 9); however, conservation outcomes
were limited due to landscape size, persistent deforestation (external/internal pressures), land
degradation, and the fact that conservation is a slow process with low outcomes in short term (i.e.
reforestation, ecosystems restoration). Outcomes in governance and more specifically in institutional
planning were mostly associated to the creation of the inter-sectoral management committee, the
management plan elaboration, stronger and empower local organizations; however, institutional
59
planning outcomes were limited due to poor incidence in policy, intermittent participation of several
stakeholders and conflicts of interest between stakeholders.
Local communities empowerment particularly through training and human capital formation was an
outcome that respondents identify have a positive effect on initiative effectiveness. Despite initiatives
highly invested in this aspect, there was also a common agreement on the need of investing more on
human capital formation and thinking about this objective as a constant process. The main limitations
for human capital formation were related to landscape and population size, stakeholders lack of
interest, implementation cost (limited funds) and social conditions in terms of institutions, education
and poverty levels (Figure 8). And finally, outcomes on sustainable agriculture practices were related
to an implementation of sustainable practices by local farmers (initiative 3, 13, 22), implementation of
new sustainable activities (initiative 19), better infrastructure (i.e. biogas waste management)
(initiative 10). Limitations were related to climate conditions, land tenure (i.e micro farms <0.5 ha; or
lack of property rights), social conditions, landscape size and population density.
4.3. Key factors supporting or undermining effectiveness
Across initiatives, there exist well defined factors that can undermine or support the initiatives
maturation. Initiatives maturation process includes passing through each one of the initiatives stages
several times until reaching a self-sustainable phase with a high incidence in the whole landscape area
and with a high inclusion and involvement of all the landscape population and stakeholders. The
undermining or supporting factors of the maturation process are present in each one of the stages
either decreasing or increasing the time it will take to an initiative to make "loop" in each stage. These
factors have also a cumulative effect through stages making initiatives fail or be successful (Figure 8).
60
4.3.1. Laws and policies
Initiatives leaders used and were beneficiated from existent national legislation to create the initiative
per se (creating landscape identity stage), to foment social organizations (establishing institutions
stage), to guarantee law enforcement in the landscapes and to get access to incentives or benefits for
conservation or sustainable production (implementing stage). The existence of legislation that
recognize and regulate alternative landscape management and conservation units in mosaic landscapes
such as biological corridors, environmental protected areas or mosaics, were mentioned as useful for
initiative creation and for a stronger legal-governmental support (mentioned by one or more initiative
from Costa Rica and Brazil). During the establishment and strengthening of the institutions that lead
the initiative, one of the most challenging aspects is low coordination across sectors and the
intermittent participation from governmental offices. One of the most often mentioned cases (but not
limited to) of low coordination among sectors was between agriculture and environmental sectors. For
example, at national level the agriculture sector promotes and invest on expanding and establishing
conventional agriculture and monocultures without considering the social (migration and emigration)
and environmental impacts (deforestation, loss of biodiversity, soil degradation) (Mentioned by some
of the initiatives in Honduras, Colombia, Venezuela, Mexico and Bolivia). Respondents highlighted
that this implies a disadvantage to initiatives who are trying to convince farmers to establish more
sustainable practices and to protect natural resources, particularly because there exist financial technical support and subsidies from the government to establish conventional agriculture. According
to respondents experiences, the policies for conventional agriculture modernization and expansion, and
mining usually generate inconsistencies with forest, soil, water and environmental legislation.
Initiatives can find in pre-existent legislation opportunities to regulate land use, establish protected
areas, and channelize funds to farmers through mechanism such as payments for ecosystem services
(Costa Rica and Guatemala), important legislation for implementing actions to improve landscape
management. However, low or lack of legislation enforcement and generalized legislation (not
61
differentiated by farmer’s typology) were also mentioned by respondents as policies or factors that
undermined or limited initiatives effectiveness during the implementation and other stages. In most of
the cases, the existence of a legislation or regulation was something positive; however, the low level of
enforcement forced initiatives to heavily invest on enforcing the law. Low or null land tenure rights or
titling was also mentioned as a constrain for farmers inclusion and investments at farm scale, mainly
because the uncertainty for farmers to invest in those lands is high and because some incentives
(payment for ecosystem services) or programs require land tenure rights or title (mentioned by one or
more initiative from Mexico, Guatemala).
After 11 years in average of initiatives work (deliver results stage), initiatives still have null or low
power to influence legislation (local/national). Initiatives are investing on creating a long term
management plan at landscape scale (16 initiatives); however, plans are fairly being incorporated or
recognized by local/regional/national government offices. This poor recognition generates a friction
between government and initiatives. Initiatives identified that empowered communities and leaders are
using legislation as a tool for change.
4.3.2. Funding
The sources of funding for initiatives are diverse and vary through time. Across initiatives, the most
common sources of funding were from external sources (18 initiatives), government (16 initiatives),
voluntary work (13 initiatives) and local association or organization (10 initiatives). Respondents
indicated that the initiatives efforts are oriented to reach a self-sustainable stage through voluntarism
but also through local associations or organizations contributions. Nonetheless, initiatives are still
highly dependent from external sources which are time-limited and products oriented, constraining
initiatives need for funding: start-up, operational, implementation and consolidation funds. Initiatives
tend to get start-up and operational funds through external sources and voluntarism. Some initiatives
leaders fundraise funds from different sources; however, it was often mentioned the need to develop
62
and improve fundraise skills. Voluntarism work importantly contributes to the landscape logistics;
however, initiatives heavily based on voluntarism make progress at slower pace. Funds from local
stakeholders, associations or organization are used to support the institutions functioning and the
implementation of activities.
4.3.3. Stakeholders interest / participation
All bottom-up initiatives reported to be inclusiveness and open to the different landscape stakeholders
to guarantee participatory processes at the different stages. Top-down initiatives, may limit the
participatory process during the design of the initiative to avoid false expectation, however, after some
actions and results are implemented and delivered respectively, initiatives start creating identity and
establishing institutions that lead the initiative in a inclusive and open process (Figure 8 & Figure 9;
initiatives 18, 21). In average, twenty initiatives included marginalized groups and small producers
during the design and the implementation stage, but large landowners actively participated in only
seven landscapes. Despite the wide and open invitation to participate, seventeen initiatives agreed on
the need to actively involved national government, municipal or local governments, agro-industry,
mining and local community. Although local and national governments were stakeholders often
involved, respondents highlighted the critical need of a permanent and active participation and
coordinated development of efforts between the government and the initiatives through time. Agroindustry and mining are important stakeholders and initiatives allies, since usually have economical
resources, and occupy large areas. These stakeholders affects initiative objectives either positively
(funding, enforcing the law, research, technical support) (i.e initiative 2), or negatively (apathy,
environmental impacts, conflicts), however, their active involvement and participation in the initiatives
is still low. Finally, although it was recognized the active participation of local communities it is still
needed a more and active participation. This is one of the challenging aspects of working at large areas
and with large populations. Developing strategies or incentives that promotes a higher and active
participation of different stakeholders is strategic and a challenge.
63
4.3.4. Social conditions
High levels of poverty, illiteracy, culture diversity, communities’ apathy, social conflicts among others,
are factors that add to the initiative extra-challenges. To overcome these challenges, initiatives highly
invest on human capital during the different stages (all initiatives), work at smaller scales to plan
according to each unit context (microwatershed, subcorridor, municipality) and use pilot or
demonstrative units to increase communities sensitivity and sympathy.
4.3.5. Landscape size and population density
Respondents identified that the landscape as a cohesive management unit, offers a natural delimitation
and identification of threats (and its sources), challenges, potentialities and constrains, including
stakeholders roles and responsibilities. However, working at landscape scale poses challenges. Seventy
one percent of the responses to the question about the limitations of working at landscape scale were
related to both logistics and stakeholders actively involvement and articulation. Logistics represent
challenges in terms of cost (e.g. transportation, material, and infrastructure), technical support (e.g.
training, human capital, equipment) and communication (e.g., cell phone / internet coverage, poor
roads, dissemination strategies). Stakeholders involvement is even more complex when initiatives are
trans-boundaries (country, state, county), since policy, stakeholders interest and social conditions
varies across regions or conservation units (mentioned by some of the initiatives in Guatemala,
Argentina, Bolivia, Brazil, Chile, Colombia , Honduras, Mexico and Venezuela). Landscape scale
challenges are exacerbated due to the difficulty of guaranteeing permanent and constants starting and
operational funds (15% responses) and due to the lack of permanent support from governmental
organizations or entities, all across the landscape and through time (13% responses). The larger the
landscape the larger the challenges at the different stages. Smaller landscapes may have still important
challenges during landscape identity and establishment of institution stages due to social conditions
and stakeholder interest, however, it may facilitate implementing and delivering outcomes stages.
64
5. Discussion and Conclusions
This article presents results from among the first longitudinal studies—based on a common
methodology, analytical framework, and representative region-wide sample—to evaluate how
landscape initiatives are functioning and the types of successes, challenges, and limitations they are
experiencing. Given the inherent challenges of aligning action in rural landscapes across scales,
sectors, and stakeholders, it is logical to expect that landscape approaches would rarely be pursued
when simpler options were likely to suffice. In fact, we did find that the initiatives generally had
strong motivations related to addressing challenges that stakeholders felt could not be resolved in other
ways. In the majority of the cases, these challenges centered around a natural resource management
issue (e.g., watershed management, wildlife habitat connectivity, or disaster risk reduction) combined
with alleviating rural poverty, building agricultural value chains, reconciling past conflicts, and
building more effective governance structures. Our results related to initiative motivations, contexts,
and stakeholder participation suggest integrated landscape management to be, fundamentally, a
problem-solving approach driven by context-specific demand—not merely a new conceptual paradigm
or development model that is being applied in a top-down way.
However, the strong sense of purpose driving many of the ILIs was not always matched by a similarly
comprehensive or far-reaching set actions or results. Specifically, most of the ILIs had registered
significant progress and alignment of stakeholders relative to the first two levels of landscape
engagement (landscape identity and landscape institutions), but not always relative to the third and
fourth levels (landscape action and landscape results). Initiatives progress is not linear but cyclic, since
each one of the stages is constantly "visited" facing new or the same challenges/factors; factors such as
policy context, funding, social conditions, stakeholders interest, landscape size and population may
either undermine or support initiatives at each stage. This result does afford a degree of optimism in
the sense that ILIs appear to be putting into place the social and governance structures that are
typically needed to undergird participatory, evidence-based approaches to addressing complex land-
65
and resource-based challenges. The lack of far-reaching sets of actions and outcomes across most of
the cases may also reflect the long duration needed for such engagement to come to fruition—at least
at scales readily recognizable as “landscape.” In short, our research finds integrated landscape
management approaches to be necessary (relative to the scope of problems faced by rural landscape
stakeholders) and promising (in terms of activity at the first two levels of landscape engagement), yet
not fully mature in many instances.
This characterization depicts ILIs to be most suitable as an approach for long-term investment in rural
prosperity and sustainability—that is, not only solving difficult current problems but also heading off
emerging problems such as climate change, natural disaster risk, and livelihood vulnerability due to
reduced economic diversification. To capitalize on this promise of long-term sustainability, of course,
requires long-term commitment to an initiative. The life cycle of initiatives offer an opportunity to
better understand the different challenges that initiatives face through time and the need for long term
support and commitment. For example, now it is clear that initiatives require specific funding at each
stage (starting, operational, implementation, consolidation). Also, the review indicate that financial
resources not always come from external donors, local stakeholders and organizations are also more
actively funding initiatives as an strategy to reach a self-sustainable stage. We found little evidence of
private investment in support of initiatives or their component objectives, and suggest this to be a
critical gap and opportunity for future efforts to leverage such investment. This initiatives requires
long-term commitment. In the interviews, we found that an important nexus of such commitment was
frequently local volunteers and professionals, acting in their capacity as community members, farmer
or women’s group leaders, local NGO members, or others. In the interviews, we found that an
important nexus of such commitment was frequently local volunteers and professionals, acting in their
capacity as community members, farmer or women’s group leaders, local NGO members, or others.
Not surprisingly, financial resources also identified as a critical need, but these need not always come
from external donors: some of the more successful ILIs were engaged in allocating and programming
66
the use of public-sector funds flowing from governmental line ministries to support ILI objectives at a
local level. We found little evidence of private investment in support of ILIs or their component
objectives, and suggest this to be a critical gap and opportunity for future efforts to leverage such
investment.
The practice of conservation and rural development in past decades is replete with projects and
programs established to solve imminent, pressing problems within a short time frame. These “band
aid” approaches—whether designed to prevent human starvation, aid in disaster recovery, or save a
species at the brink of extinction—are typically carried out at high cost and frequently fail, or do not
even attempt, to address underlying causes. The need for, and importance of, such work will never
cease. Yet a complementary set of strategies, addressing problems at a larger scale, across longer time
spans, and hopefully in a more durable way, is needed to manage for the escalating societal demands,
challenges, conflicts, and resource constraints that increasingly characterize rural landscapes. ILIs
present one such approach to holistic, forward-looking management of rural regions. While the model
is still nascent in many ways, promising indications identified in this study suggest that with greater
policy support, capacity building, and sharing of lessons and best practices, ILIs could merit adoption,
and provide important benefits, at a much wider scale.
67
6. References
Andersson, K. P., & Ostrom, E. (2008). Analyzing decentralized resource regimes from a polycentric
perspective. Policy Sciences, 41(1), 71-93.
Cartin, M., Welling, R., Córdoba, R., Rivera, O., Rosal, C., & Arrevillaga, F. (2012). Tacaná
watersheds, Guatemala and Mexico: transboundary water governance and implementation of
IWRM through local community action. Retrieved from http://data.iucn.org/dbtwwpd/edocs/2012-011.pdf
Estrada-Carmona, N., A.K. Hart, F.A.J. DeClerck, C.A. Harvey, and J.C. Milder. In review. Integrated
landscape management for agriculture, rural livelihoods, and ecosystem conservation: an
assessment of experience from Latin America and the Caribbean. Landscape and Urban
Planning.
Frost, P., Campbell, B.M., Medina, G., Usongo, L. (2006) Landscape-scale approaches for integrated
natural resource management in tropical forest landscapes. Ecology and Society 11, 30; (12p.)
[online] URL: http://www.ecologyandsociety.org/vol11/iss32/art30/.
Ghazoul, J., Garcia, C., & Kushalappa, C. G. (2009). Landscape labelling: A concept for nextgeneration payment for ecosystem service schemes. Forest Ecology and Management, 258,
1889–1895.
Ivankova, N.V., J.W. Creswell, and S.L. Stick. 2006. Using mixed-methods sequential explanatory
design: from theory to practice. Field Methods 18: 3-20.
LPFN [Landscapes for People, Food and Nature initiative]. 2012. Landscapes for people, food and
nature: the vision, the evidence and next steps. EcoAgriculture Partners, Washington, DC.
Online: http://landscapes.ecoagriculture.org/documents/files/
landscapes_for_people_food_and_nature.pdf (accessed 20 November 2012)
Milder, J.C., L.E. Buck, F.A. DeClerck, and S.J. Scherr. 2012. Landscape approaches to achieving
food production, conservation, and the Millennium Development Goals. Pages 11-108 in F.A.
DeClerck, J.C. Ingram, and C. Rumbaitis del Rio, editors. Integrating Ecology and Poverty
Reduction. Springer, New York.
Milder, J.C., Hart, A.K., Dobie, P., Minai, J., Zaleski, C. (2014) Integrated Landscape Initiatives for
African Agriculture, Development, and Conservation: A Region-Wide Assessment. World
Development 54, 68-80.
Sayer, J. (2009) Reconciling Conservation and Development: Are Landscapes the Answer? Biotropica
41, 649-652.
Sayer, J., Sunderland, T., Ghazoul, J., Pfund, J.-L., Sheil, D., Meijaard, E., Venter, M., Boedhihartono,
A.K., Day, M., Garcia, C., van Oosten, C., Buck, L.E. 2013. Ten principles for a landscape
approach to reconciling agriculture, conservation, and other competing land uses. Proceedings
of the National Academy of Sciences 110, 8349-8356.
Scherr, S.J., McNeely, J.A. (2008) Biodiversity conservation and agricultural sustainability: towards a
new paradigm of ‘ecoagriculture’ landscapes. Philosophical Transactions of the Royal Society
B: Biological Sciences 363, 477-494.
68
Scherr, S., Milder, J., Buck, L., (2012) Landscapes for people, food and nature: the vision, the
evidence and next steps. Landscapes for People, Food and Nature Initiative, Washington, DC.
Schwilch, G., Bachmann, F., Valente, S., Coelho, C., Moreira, J., Laouina, A., Chaker, M., Aderghal,
M., Santos, P., & Reed, M. S. (2012). A structured multi-stakeholder learning process for
Sustainable Land Management. Journal of Environmental Management, 107(30), 52-63.
Stobbelaar, D. J., & Pedroli, B. (2011). Perspectives on Landscape Identity: A Conceptual Challenge.
Landscape Research, 36(3), 321–339.
Tscharntke, T., Klein, A. M., Kruess, A., Steffan-Dewenter, I., & Thies, C. (2005). Landscape
perspectives on agricultural intensification and biodiversity-ecosystem service management.
Ecology Letters 8, 857–874.
69
CHAPTER 3: GLOBAL SENSITIVITY ANALYSIS OF RUSLE ILLUSTRATES
IMPORTANCE OF COVER MANAGEMENT ACROSS ENVIRONMENTS IN PREDICTING
SOIL EROSION RATES
Natalia Carmona-Estrada, Elizabeth Harper, Fabrice DeClerck, Alexander K. Fremier. In revision.
Geomorphology
1. Abstract
Soil loss remains a critical issue for sustained agricultural production and reduction of downstream
environmental impacts. Modeling soil loss at watershed scales helps researchers and decision makers
quantify the impact of policy and land use decisions. The Revised Universal Soil Loss Equation
(RUSLE) is a common empirical model used for quantifying soil loss. This model is widely applied
across spatial extents and environmental conditions despite a lack of site-specific data for many
regions. To better understand the consequences of the broad applications of RUSLE and to provide
recommendations for prioritization of site specific data collection, we performed a global sensitivity
analysis (GSA) on three dissimilar factor estimate datasets, covering varying scales (plot and
watershed) and environmental conditions (temperate and tropical). The GSA technique allowed us to
rank factor importance in estimating erosion rates and identify important factor interactions controlling
soil loss across environmental conditions. We also compared the robustness of both global and local
sensitivity analyses in assessing factor contributions to model uncertainty. Using a non-parametric
approach (Random Forest and Classification and Regression Trees), we found that the greatest soil
loss comes from small proportions of the watersheds and is largely determined by the interaction of
cover management with slope steepness in steep areas, and with soil erodibility in level areas. Results
highlight the importance of cover management in soil loss predictions regardless of environmental
condition and model parameterization. Our findings reinforce that conservation practices should be
targeted at specific locations of high erosion by adjusting cover management, specifically root density
70
and surface cover. In addition, we argue that a global sensitivity approach is more robust than the local
sensitivity analysis because higher order interactions among factors are quantitatively considered.
2. Introduction
Soil loss poses threats to biodiversity with significant on- and off-site impacts, including impacts to
water quality, reservoir capacity, and food production (Pimentel et al., 1995; Bilotta et al., 2012).
Decision makers and land managers require efficient scientifically defensible findings to prioritize
implementation of soil conservation programs. Empirical and physical-based models are commonly
used to quantify the mechanisms and patterns of soil loss across scales, environmental context, and
land use. Model parameterization is a key step in representing inherent environmental variability
(Box-Fayos et al., 2006), in particular, it is necessary to identify the factors and parameter estimates
that produce the most uncertainty in model predictions for different environmental conditions and
scales of data resolution.
Empirically and physically based models are commonly used to predict watershed scale soil loss from
a range of systems (WEPP -Flanagan and Nearing 1995; RUSLE - Renard et al., 1997; EUROSEM Morgan et al., 1998). One of the most commonly applied models is the Universal Soil Loss Equation
(USLE) and its revised version RUSLE (Wischmeier & Smith, 1978; Renard, et al., 1997,Table 2).
These empirical models are used to predict soil loss over large scales, particularly in data poor
locations (Mueller et al., 2005; Bewket & Tefari 2009). Although physical-based models more
precisely represent the forces control soil loss, empirical models remain widely used due to the lack of
available data to parameterize more physical-based models (Gaffer et al., 2008; Bewket & Teferi,
2009).
The Universal Soil Loss Equation (USLE) was formulated from more than 10,000 plot years of basic
runoff and soil loss data measurements on agricultural lands during 50 years in the United States
71
(Wischmeier & Smith, 1978). In the 1990s, the USLE equation was revised and improved to be
applicable across a wider range of environmental conditions and crops (Renard et al., 1997). Both
equations estimate long-term average annual soil loss (A) per unit of area (A =R·S·L·C·K·P). Factor
estimation for both models is relatively straightforward at different scales, and includes topography (L
and S factor), soil erodibility (K factor), cover management (C factor), support practices (P factor), and
rainfall- runoff erosivity (R factor) (Renard et al., 1997; Bryan, 2000, Table 2). Two main limitations
of empirical models are: 1) soil loss is a stochastic process with greater variability for soil losses of
lower magnitudes (Nearing et al., 1999; Nearing, 2000), and 2) processes that drive soil loss vary with
spatial scale (plot and watershed) and location (Lal, 2001).
Table 2. RUSLE factor description, units and reference. Each factor parameters used to construct the
theoretical dataset.
Factor (description)
Independent parameters
Source
Long term average soil loss - A (t∙ha-1∙yr-1)
Renard et al.,
A= C∙K∙L∙S∙R∙P
1997
C: cover-management: Crop type and
Sp: Percentage of land area covered by
Yoder et al.,
management practices such as the impacts surface cover; Bur: Mass density of live
1997
of previous cropping and management, the and dead roots found in the upper inch of
protection offered to the soil surface by
soil (lb∙acre-1∙in-1); b: effectiveness of
vegetative canopy, erosion reduction due to surface cover; Bus: mass density of
surface cover, and surface roughness
incorporated surface residue in the upper
(Dimensionless, but less erosive crops or inch of soil (lb∙acre-1∙in-1); Cf: surface soil
land cover have smaller values)
consolidation factor; Ru: surface
roughness; H: Canopy height (ft); Ru:
Surface roughness; Fc: Fraction of land
surface covered by canopy (%); Cur:
Impacts of the subsurface residues
(acre∙in∙lb-1)
K: Soil erodibility: Soil profile reaction to s: Soil Structure; p: Soil Permeability;
Romkens et
hydrologic processes (e.g. raindrop impact, OM: Organic matter (%); M: (%Silt
al., 1997
surface flow, roughness (topographic or
+%Very fine sand)(100-%Clay)
induced), and rain water infiltration). K is
affected by physical, chemical and
mineralogical soil properties and their
interactions and is calculated as an average
annual value (ton∙ha∙h∙ha-1∙MJ-1∙mm-1)
LS: Topography: Slope length (L) which is Ɵ: slope angle (degrees); λ: Slope length
McCool et
the horizontal distance from the starting
(ft)
al., 1997
point of the overland flow until deposition
or channel formation and slope steepness
(S), the slope gradient effect on soil erosion
72
Factor (description)
(Dimensionless)
R: rainfall- runoff erosivity: The effect of
raindrop impact and rate of runoff
associated with rain of moderately sized
storms with occasional large storms.
(MJ∙mm∙ha-1∙h-1∙y-1).
P: Support practice The runoff reduction
rate by implementing practices such as
contouring, strip-cropping, terracing and
sub-surface drainage (Dimensionless)
Independent parameters
Source
j: No events per year; I: Erosive rain
Intensity (in∙hr-1)
Renard et al.,
1997
Foster et al.,
1997
RUSLE has been applied at different scales, both, in the US where the data were originally collected
(Renard & Ferreira, 1993; Gardiner & Meyer, 2001; Gaffer et al., 2008) and elsewhere, including
regions with differing environmental conditions (Biesemans et al., 2000; Lu et al., 2004; Bewket &
Teferi, 2009; Falk et al., 2009). Likewise, the purposes of applying RUSLE have been diverse. For
example, to assess past, present and projected soil loss at a global scale (Yang et al., 2003), soil loss
risk (Lu et al., 2004; Schuler & Sattler, 2010), policy effect on soil loss (Schuler & Sattler, 2010), soil
management (Wang et al., 2007), conservation priority or policy design (Burke & Sugg, 2006), and
more recently, ecosystem service provisioning (Nelson et al., 2009).
Reviews of USLE and RUSLE have demonstrated its capacity to accurately predict on-site soil loss at
the plot and the watershed scale. At the plot scale, both equations predicted measured soil loss
accurately (coefficient of correlation R2>0.75, Nash Sutcliffe model efficiencies > 0.72), but both
models tend to over predict and have lower accuracy for lower measures of soil loss (<10 ton ha-1 y-1)
(Nearing et al, 1999; Tiwari et al., 2000). At watershed scales, assessments of transported eroded
sediment and measured sediment loads at the basin outlets demonstrated that RUSLE can be used to
estimate soil loss in South East Asia (R2>0.72) (Ranzi et al., 2012) and in Kenya (R2= 0.80) (Mutua et
el., 2006).
73
Assessments of the individual importance of each factor in model uncertainty at the plot scale found
that the cover-management factor (C factor) was the most important in determining soil loss under
different agriculture systems, with the second most important factor being topography (Risse et al.,
1993; Benkobi et al., 1994; Ferreira et al., 1995). At the watershed scale, discrepancies exist regarding
which factor produces the most model uncertainty, with some studies highlighting the topographic
factor (Biesemans et al., 2000), the slope steepness (Falk et al., 2009), and rainfall-runoff erosivity
(Zhang et al., 2013). In all cases, local sensitivity analyses (LSA) were applied to understand model
uncertainty.
LSA is a common statistical method to assess uncertainty or importance of individual factor impact on
model predictions (e.g. Renard and Ferreira 1993; Risse et al., 1993; Ferreira et al., 1995). However,
LSA is limited in that it does not assess factor interactions as it estimates the contribution of each
factor to model predictions by varying each one of the factors at a time while holding other factors
constant (Saltelli et al., 1999). LSA is a constructive analysis, but it does not capture the potential
interactions among factors (Wagner 1995; Harper et al., 2011). Global sensitivity analysis (GSA) is a
more robust approach because it considers higher order interactions among factors or parameters to
assess model uncertainty and to estimate factors of importance (Harper et al., 2011). GSA varies all
factors simultaneously to sum all factor uncertainty and evaluate the combined impact of each factor
on the model prediction (Wagner, 1995). For the RUSLE, despite the wide application and accuracy
assessments, a GSA has not been completed. Results from a GSA (described in section 3.1) will
further help focus model parameterization when the model is applied to new environmental contexts.
The overall goal of this study was to understand factor contributions to uncertainty in RUSLE
predictions over a range of factor and parameter estimate conditions. To do this, we selected two
datasets with factor estimations covering different scale of source data and environmental conditions.
We also created a randomized synthetic dataset with the widest possible range of factor and parameter
74
estimates from the original values used to created RUSLE to test overall model sensitivity. Since the
goal of our analysis was not to predict soil loss nor compare soil loss predictions across datasets, we
did not select comparable datasets (e.g. same location, different source data, or vice versa) nor validate
model predictions against observed data. We reviewed model accuracy assessments and
parameterization methods from the literature, but do not perform an accuracy assessment with our
dataset as model accuracy does not directly impact our goal of confirming whether factor or parameter
estimation influences model sensitivity. The results of this study provide a description of model
sensitivity within and amongst factor estimates across different environmental conditions and can be
used to focus parameterization efforts for future applications of RUSLE. The results are particularly
important in data-poor areas where parameterization of physically-based models is limited.
3. Data preparation and description
In order to understand RUSLE sensitivity to parameterization, we conducted a GSA on two datasets
parameterized at different scales (plot versus watershed), using different methods (ground collected
data versus geographic systems proxies -GIS) and covering different environmental conditions
(agriculture in level versus mountainous regions). We also created a synthetic dataset with the widest
range of factor and parameter estimates. We performed a GSA of RUSLE on three datasets with
different factor estimates to: 1) rank factor importance in predicting soil loss, 2) identify specific factor
interactions predicting greater and lower soil losses, and 3) compare differences between LSA and
GSA in assessing factor importance. These datasets represent the original data used to calibrate the
model and environmental conditions where RUSLE is actively being applied.
3.1. US dataset.
The purpose of the US dataset is to understand how RUSLE behaves when applied at the plot level
where the model was originally calibrated. The US dataset comprises 1,704 plot years of data from
natural runoff in 198 plots at 21 sites, with annual measurements of soil loss and estimates of each
75
RUSLE factor (C, R, LS, P, K) also used and analyzed by Rapp (1994) and Tiwari et al., (2000).
Because this dataset provides estimates for the L and S factors combined (LS), we used equations from
McCool et al. (1997) to estimate the L and S factors separately. The US dataset was primarily collected
and measured prior to 1960 and therefore it does not represent modern agricultural practices or
instrumentation to measure each factor (Risse et al., 1993). Tiwari et al. (2000) estimated a Nash and
Sutcliffe model efficiency of R2=0.72 (i.e. accuracy in predicting measured soil loss).
The range of the estimates for the L and S factors in the US dataset was relatively narrow because data
were obtained from agricultural erosion plots where 80% of the data had a slope length (L factor)
lower than 25 m and 70% of the plots had a slope steepness (S factor) lower than 10° (Figure 10). The
cover management factor (C factor) included values for 21 crops, mostly annual crops with large
average C values (erosive crops). This dataset covers a wide range for the rainfall, runoff erosivity
factor (R factor) and soil erodibility (K factor) (Figure 10).
76
Figure 10. Factor distribution and estimates for the US, CR and T (theoretical) datasets (Box-plot).
Mean values are represented by the black squares. Different numbers of asterisk (*) mean significant
differences between mean values (Fisher LSD test, p-value<0.05). The estimated (US, CR, and T) and
Measured (USm) soil loss (A) across datasets at the bottom.
77
The annual measurements of both soil loss and RUSLE factor estimates were averaged per plot to
perform the GSA. We used averaged values since the RUSLE is better at predicting long-term average
values than annual values or isolated events (Wischmeier & Smith, 1978; Renard et al., 1997). We
tested differences in the annual and averaged values to assess the effect that sampling variability
(among plots, sites and within plots) of both soil loss and RUSLE factors have on the sensitivity
analysis results from the GSA and LSA.
3.2. Costa Rica dataset.
The purpose of this dataset is to understand how RUSLE behaves when applied to conditions outside
the data range of the original dataset. We estimated RUSLE factors for a set of watersheds in Costa
Rica (CR) using a widely applied methodology for estimating potential soil loss at a watershed scale
(Yang, et al., 2003; Hoyos, 2005). We performed our analysis in the uppermost portions of the Pacuare
(area 64,919 ha) and the Reventazon (area 175,915 ha) watersheds located on the Caribbean side of
CR’s central mountain range. The L and S factors were estimated from a digital elevation model with
10 meter resolution and with the ArcInfoTM Arc Macro Language program developed by Van Remortel
et al. (2004). The C values for local crops were collected from previous studies in the region (GómezDelgado, 2002; Marchamalo-Sacristian, 2004), whereas the land uses were defined by a 1996 LandSat
image classification (Pedroni, 2003). The K values were obtained from FAO surveys at a national level
and soil type classification at a scale of 1:200,000 (FAO, 1989). The R factor was estimated using the
total storm energy (E) and a maximum 30 minute intensity (I30) for each erosive storm (i.e. storms
with total accumulated rainfall greater than 13 mm and separated by at least 6 hours) for 148 station
years of measurements in 54 meteorological stations of the Costa Rican Institute of Electricity– (ICE;
Gómez-Delgado, 2002). The P factor was assumed to be 1.0 because no detailed information about the
support practices in the watersheds exists.
78
The CR dataset comprised an area of 240,834 ha with 2,675,934 pixels so it was necessary to subsample to generate factor estimates. We randomly sampled the CR dataset with 30,000 pixels to
overcome computer and program limitations. The sampled dataset was not statistically different from
the complete CR dataset (we tested each factors using T test, p-value>0.05). In contrast to the US
study site, the CR site includes a topographically complex terrain with long, steep slopes and elevation
ranges from 70 to 3,470 meters above sea level. This region is characterized by intense rainfall events
and high mean annual precipitation (3,251 mm yr-1) (Waylen et al., 1995). The C factor range and
estimates in the CR dataset are smaller than the US dataset (Figure 10). The C factor range in the CR
dataset is low because 52% of the area is covered by forest (low erosive land cover), while the other
34% is covered by perennial crops such as coffee (18%), pastures with trees (13%) and bi-annual
sugarcane (3%) (low/medium erosive land cover), and annual or ornamental crops (high erosive land
cover).
To estimate errors in model prediction we performed a correlation analysis between measured and
estimated sediment loads in eight stations in the Pacuare and Reventazon watersheds. We used the tool
N-SPECT to estimate sediment loads at each stations (Eslinger et al., 2005). We used the average
sediment loads measured by ICE during 1996 for the eight available stations in the studied watersheds.
Before the correlation analysis, we excluded two basins with high gravel mining and frequent
landslides, erosion factors not accounted in RUSLE which leaded to underestimation of sediment
loads (Figure 11). The correlation coefficient between measured and estimated sediment loads for the
remaining six basins was R2=0.4. Importantly, however, given that our analysis focused on model
sensitivity and not accuracy, we consider this level of correlation between predicted and observed
sufficient to continue the analysis.
79
Figure 11. Comparison of the average sediment load estimated and measured at the outlet in eight
basins of the Pacuare and Reventazón watersheds in Costa Rica. Underestimated sediment loads in
basins represented with a triangle are due to other erosive processes not captured by RUSLE (i.e.
gravel mining landslides).
3.3. Theoretical dataset.
The purpose of the theoretical dataset is to evaluate model uncertainty given the large possible range
of factor and parameter estimates. We used the reported maximum and minimum values for each
parameter and estimated each RUSLE factor according to the equations from the Agriculture
Handbooks 537 and 703 (Wischmeier & Smith 1978; Renard et al., 1997 respectively; APPENDIX D).
The ranges of the parameters in this dataset are based on maximum and minimum values
corresponding to a physical process or plot measurements (Supplementary material I). This is the only
dataset that provided us with information at the parameter level (Table 2, APPENDIX D). Here,
parameters were used to estimate each one of the six factors of the RUSLE and can be a fixed number
or a range of values that are independent of one another (APPENDIX D).
We created a script in Matlab to create 30,000 Monte Carlo simulations of randomly chosen parameter
estimates (Sobol' 2001). Each parameter set was created by randomly drawing from a uniform
distribution within the documented parameter ranges, and each factor value was estimated using the
80
reported equations (Renard et al. 1997, Supplementary material I). Random interactions between
parameters were constrained (when required) to represent real interactions; for example, to estimate
the K factor the percentage of clay, silt and sand must sum to one hundred. We used the 30,000 Monte
Carlo simulations at factor (six factors) and at parameter level (18 independent parameters, Table 2
and APPENDIX B) in the GSA. This randomization process breaks potential correlations between
parameters and factors, but does not impact the GSA results (Harper et al. 2011).
3.4. Unstructured datasets.
The aim of the unstructured datasets was to validate the theoretical dataset and assess how correlations
among factors affect GSA outcomes. In both the US and CR datasets, factors were cross-correlated
(e.g. greater rainfall- runoff erosivity at greater altitude and slope steepness in CR), but factors in the
theoretical dataset were uncorrelated since we know the maximum and the minimum values but not
how the factors cross-correlate. To assess the effect of factor correlations on GSA results, and assess
the validity of the results from the theoretical dataset, we disaggregated cross-correlations in the US
and CR datasets by randomly selecting (with replacement) new estimates from the original datasets.
Unstructured datasets had the same sample size as their corresponding structured datasets but the
factor estimate combinations were different. We compared GSA outcomes from the structured and
unstructured datasets.
4. Methods
We conducted three statistical analyses. First, we tested if there were significant differences in factor
distribution and factor mean values across datasets. Second, we performed a GSA on the US, CR and
theoretical dataset to assess factor importance and factor interactions determining soil loss. We also
performed the GSA on the unstructured US and CR datasets to assess the effect of potential crosscorrelation among factors and validate the results from the Theoretical dataset. And finally, we
performed a LSA on the US dataset to compare the LSA and GSA statistical methods.
81
4.1. Statistical Analyses
Analysis of variance and mean value comparisons among datasets: We tested differences between
factor estimates and estimated soil loss across the three datasets. We tested factor estimate
distributions using an ANOVA using a significance value of p <0.001.We tested factor mean value
differences using Fisher’s Least Significant Difference – LSD. All analyses were performed in the R
statistics software (R core team, 2012).
Global sensitivity analyses: We used the GSA approach designed by Harper et al. (2011). This GSA
approach uses Random Forest (RF) to rank factor and parameter importance and Classification and
Regression Tree (CART) to analyze and visualize the complex relationships among model factors.
Random Forest is an improved version of CART, since it is a forest (a collection of trees) where each
tree is created by bootstrap sampling and where the factor and parameter at each node of the tree is
randomly selected (Cutler et al., 2007). For each tree, 30% of the data (called the out of bag - OOB
data) are randomly sampled and used to estimate model efficiency by cross validating results with the
other 70% of the data (Cutler et al., 2007). Model efficiency is estimated as one minus the ratio
between the mean squared error (MSE) and the variance of the response variable (Pang et al., 2006)
(Table 3). We used the R package randomForest 4.6-2 to estimate model efficiency (Breiman & Cutler,
2011).
The contribution of each factor to model predictability can be assessed by two metrics from RF. The
first metric, the lost efficiency metric, estimates factor importance by calculating the changes of the
mean squared error when each factor is randomly permutated. The second metric, the node impurity
metric, measures changes in the residual sum of squared errors by splitting the factor at each node of
the tree (Breiman & Cutler 2012). Node impurity values for each factor were normalized by the sum
of the total node impurity and estimated the relative importance of each factor (Table 3). R package
randomForest 4.6-2 was used to estimate both factor importance metrics (Breiman & Cutler, 2012). To
82
visualize the higher order interactions between factors, we applied a CART analysis on each dataset.
With CART we were able to identify the specific factor combinations that generated lower and greater
estimates of soil loss (R package rpart 3.1-50; Therneau & Atkinson, 2010).
Table 3. Description of model efficiency measures and factor/parameter importance metrics for both
global and local sensitivities analysis.
Metric
LSA
GSA
𝑛
2
1 𝑛
(𝑀
−
𝐸
)
2
Model efficiency
𝑖
𝑖
𝑖=1
𝑀𝑆𝐸
𝑖=1 (𝐸𝑖 − 𝑀𝑖 )
𝑅2 = 1 −
×
100
𝑛
2
2
(i: 1...n
𝑅
=
1
−
=
1
−
× 100
𝑛
2
1 𝑛
𝑉𝑎𝑟 𝑀
𝑖=1 𝑀𝑖 − 𝑀𝑎𝑣 𝑔
𝑀
−
𝑀
factors/parameters; 2
𝑎𝑣𝑔
𝑛 𝑖=1 𝑖
R = 1: perfect model;
Mi: measured value 2
Pang
et
al.
(2006)
R = 0: model results are not
of the ith
better than the mean;
observation; Ei:
R2= -1: model predictions worse
estimated value for
than using the mean (Risse et al.,
the ith observation,
1993)
Mavg: measured
average value)
Lost efficiency
Estimates the difference between Estimates each tree mean squared error
metric
the original model efficiency (R2)(MSE) between the OOB data and 70% of data
and a new model efficiency
the left after randomly permutating each factor
estimated after replacing a factor value at a time. MSEs are averaged over all
values by its mean value
trees and normalized by the standard deviation
of the differences (Breiman & Cuttler., 2012)
Node impurity
NA
Is the decrease on the residual sum of squared
metric
errors (RSS) after splitting on a factor. RSS
values are averaged over all tress. Each factor’s
relative importance was standardized by
dividing it by the total RSS.
Comparison of LSA and GSA: For the LSA, we used the methodology proposed by Risse et al. (1993).
LSA consists of estimating the Nash and Sutcliffe (1970) statistic. We compared both model
efficiencies (pseudo R2) estimated from the RF and LSA (Table 3). The LSA assesses the approximate
contribution of each factor to the model predictability by estimating the loss of model efficiency. The
loss of model efficiency value is estimated as the difference between the Nash - Sutcliffe statistic using
all original factor values and the estimated Nash - Sutcliffe statistic after one factor’s values are
replaced by the factor’s mean value; this process is repeated for each factor (Risse et al., 1993). We
compared the loss of model efficiency values from LSA and RF. The US dataset is the only dataset
83
with predicted and measured soil loss; and therefore, is the only dataset that provided information
about model efficiency and the loss of efficiency metric.
5. Results
Global sensitivity analyses across all the datasets showed that the RUSLE predictions are most
sensitive to the cover management factor (C factor) regardless of factor and parameter estimation
(Figure 10and Figure 12). In most datasets, the relative importance of the C factor was twice as high as
the second most important factor in each dataset (Figure 12). This result was consistent despite
significant differences among factor estimates across datasets (Fisher LSD test, p-value <0.05) for all
factors with the exception of slope length (S factor) in the US and theoretical datasets (Figure 10). We
also found that estimated soil loss with the CR dataset was significantly greater than with other
datasets (Fisher LSD test, p-value <0.05); yet, the US and theoretical estimated soil losses were not
significantly different from each other (Figure 10). These consistent results across datasets indicate
that the sensitivity of RUSLE model predictions is produced from the formulation (equations) of soil
loss processes, with less uncertainty coming from variability in the parameter estimates. At the
parameter level, root mass density (Bur) and percent surface cover (Sp) were found to be the most
important parameters from the C factor driving uncertainty in model predictions (Table 2, Figure 12).
84
Figure 12. Factor importance order for US, CR and T (theoretical) datasets for structured and
unstructured datasets at factor and parameter level (see Table 2 for factor and parameter descriptions).
Relative importance is the normalized factor node impurity metric obtained from the Random Forest
statistical procedure and indicates the relative importance of each factor/parameter in influencing
model predictions.
Factor estimation procedures (ground collected data versus GIS proxies) or factor range estimates in
each dataset (mountainous, high rainfall versus plains, less rainfall) may cause differences in the less
important factors (Figure 10 and Figure 11). After the C factor, no clear pattern of factor importance
emerged other than soil erodibility (K factor) being ranked in the three last positions across all
85
analyses (Figure 12). L and S factors are the second and third most sensitive factors (respectively) in
the CR dataset (Figure 12) despite the greater rainfall-runoff erosivity (R factor) estimates (Figure 10).
Results between structured and unstructured data were consistent (Figure 12), implying that
correlations among factors have a weak or null effect on model factor importance.
Higher order factor interactions, illustrated by the CART analysis, indicated that the interaction
between the C and K factors was the most important in determining greater magnitudes of soil loss,
despite the low K factor order for the US dataset (Figure 12 and Figure 13, US). Here, crops with
mean C values above 0.31 (rye, potatoes, fallow or cotton) lost soil at a mean rate between 19 and 102
t·ha-1·yr-1, depending on soil type (Figure 13, US). This is contrasted with the CR dataset where the
greater C and slope steepness (S factor) estimates indicate greater erosive loss (Figure 13, CR). Annual
crops or bare soil with a mean C value above 0.4, produced erosion rates between 50-237 t·ha-1·yr-1
when located on slopes below 13°, however, perennial crops (i.e. coffee) with C value above 0.07 can
be also highly erosive when located on slopes above 13° (Figure 13, CR). The theoretical dataset
behaves similar to the CR dataset, where the interaction between C and S determined greater soil loss.
The C factor threshold that defined low and medium soil loss was similar C~0.08 - 0.07 for the
theoretical (within original equation factor estimates) and CR datasets (outside original equation factor
estimates) (Figure 13, CR and T).
86
Figure 13. Factor interactions for US, CR and T (theoretical) datasets obtained from the CART
analysis. Each dataset is represented as a tree, the left side of the tree represents factors combinations
and the right side represent the end of the tree with the averaged soil loss, the percentage of data that
follow each specific factor combination (or tree branch) and the percentage of the total estimated soil
loss. Factor interactions importance is from left to right, and the value next to each factor is the factor
threshold value at which the data are split and combined with the next factor.
Magnitudes of soil loss across datasets follow a similar pattern despite the different factor and
parameter estimates. The CART analysis shows that greater magnitudes of soil loss come from a
limited proportion of the area and from a limited combination of factors (Figure 10 and Figure 12). For
example, soil loss estimated above 20 t·ha-1·yr-1 comes from 36% of the US parcels, 34% of the CR
87
pixels and 36% of the theoretical runs, but account for 75%, 83% and 91% of the total estimated soil
loss respectively (Figure 13).
The GSA and LSA similarly explained average plot-level soil loss in the US study site (LSA 73% and
GSA 75%, Figure 14). However, the GSA explained more of the measured annual plot-level soil loss
(82%) than the LSA (58%) (Figure 14). Both LSA and GSA indicated that the C factor is the most
important factor determining soil loss when averaged plot-level data are used. The LSA results were
highly affected by the difference in data variability between the averaged versus annual plot data, since
the order of the three most important factors was different (Figure 14). The LSA and GSA on averaged
plot-level data distinctly disagreed on the role of the support practice (P factor). The GSA ranked this
factor as more important than slope length (L factor), a factor with narrower range of estimates (Figure
10and Figure 13).
Figure 14. RUSLE efficiency and factor importance order for global and local sensitivity analyses of
the average and annual US datasets. Model efficiency corresponds to a pseudo R2 from estimated and
measured soil loss. Loss of efficiency value indicates the contribution of each factor to model error.
The negative value indicates a decrease in model predictability.
88
6. Discussion
Our results indicate that cover management is the most important factor driving soil loss in RUSLE,
across both the scale of data resolution and environmental context. In other words, the C factor
produces the greatest degree of variation in model predictions. This illustrates the need to focus on C
factor estimation over other factors to improve the accuracy of model predictions. In addition, this
result suggests that the C factor in RUSLE could be further improved to reduce uncertainty in model
predictions. This is not surprising considering the complex processes in which vegetation influences
soil loss (Schwilch, Hessel, & Verzandvoort,2012). The results also underline the importance of
understanding the complex interactions among vegetation, topography and soil type in determining
soil loss and the high spatial variability in soil loss rates.
6.1. Model uncertainty under different environmental conditions
Our modeling efforts illustrate the importance of C factor estimation because across datasets the C
factor is the main contributor to model uncertainty regardless of factor parameterization. For example,
the CR dataset had four factor estimate ranges outside the theoretical estimates (K, R, L, S factors), yet
still the C factor was the most important factor controlling soil loss. For this reason, we suggest that
applications pay close attention to C factor parameterization regardless of the method used or the scale
of the data source. Other factor contributions to model uncertainty were dataset or context dependent.
Level landscapes require more accurate parameterization of the C and K factors, whereas estimation of
the C and the S factors require greater focus on steeper landscapes. This particular result differs
compared to other studies at the watershed scale. Zhang et al. (2013) highlighted the importance of the
R factor in mountainous areas, while Falk et al. (2010) highlighted the S factor in flatter areas in
contributing to model uncertainty. These differences are potentially explained by the higher order
interactions considered when a GSA approach is used.
89
Our discussion here is not intended to support or refute the application of RUSLE outside the original
factor and parameter estimates. We understand that RUSLE’s wide use and acceptance for
management (Eslinger et al., 2012) is due to its relatively easy calibration and lack of data
requirements compared to more mechanistic models (Mueller et al., 2005; Bewket & Tefari, 2009). We
do suggest, however, that parameter estimation of the C factor should be a main focus during model
calibration and continued improvement of the RUSLE. We also recommend the implementation of the
GSA approach in improving model parameterization by assessing factor importance, including
interactions.
6.2. GSA versus LSA.
We show that a GSA approach provides a more detailed analysis of model uncertainty than LSA. GSA
is not highly affected by data variability, and factor interactions are explicitly considered and visible.
Assessing data that are naturally highly variable in space and time such as soil loss (Nearing et al.,
1999), with statistical methods sensitive to data variability may lead to inaccurate results. Finally,
consistent results obtained in the GSA were due to the method’s capacity to capture a broader range of
model sensitivities and interactions among model factors and parameters (Wagner, 1995). Both of
these are key characteristics to understand better and parameterize empirical models (Harper et al.
2011).
6.3. Management implications.
Our GSA results further underline two key points in soil loss management across environments. The
cover management factor is the most important factor in RUSLE and much of the soil loss occurs in a
limited area of the watershed. These findings are important because cover management is the only
factor that can be easily manipulated to reduce soil loss from agricultural lands (Shi et al., 2012) and
reduce sediment accumulation in downstream reservoirs (Estrada-Carmona and DeClerck, 2011). The
consistency across databases on most of the soil loss coming from a small portion of the landscape,
90
reinforces the need to implement targeted soil conservation interventions where the location and the
rate of soil control can be assessed to improve ecosystem service-based interventions (Fremier et al.,
2013).
Finally, the creation of a theoretical dataset might help to provide information about the most
important factor interactions, and even information at the parameter level, particularly in those areas
with poor or no site specific data. This will help to provide insights on the most important parameters
to guide management changes. For example, our results from the theoretical dataset indicate that the
mass density of live and dead roots found in the upper centimeters of soil and the percentage of land
area with surface cover as the most important parameters in determining soil loss. Multiple studies
report similar findings where an increase of the root density and surface cover were demonstrated to
be particularly efficient in controlling soil loss (Linse et al., 2001; Gyssels et al., 2005; De Baets et al.,
2006).
7. Conclusion
We assessed RUSLE behavior and factor contributions to model uncertainty under different
environmental conditions and compared global and local sensitivity analyses. The GSA approach is an
informative procedure for identifying sources of model uncertainty, mainly because it captures
interactions amongst factors and it is little affected by data variability. The application of a GSA before
final model parameterization will help constrain model uncertainty and focus resources and efforts on
parameterizing the most important factors. Our datasets from different environmental conditions
indicate that the cover management factor is the most important factor in RUSLE and much of the soil
loss occurs on a limited area of the watershed. However, the importance of other RUSLE factors varies
across environmental contexts.
91
8. References
Benkobi, L., Trlica, M.J., Smith, J.L., 1994. Evaluation of a Refined Surface Cover Subfactor for Use
in RUSLE. Journal of Range Management 47 (1), 74-78.
Bewket, W., Teferi, E., 2009. Assessment of soil erosion hazard and prioritization for treatment at the
watershed level: case study in the Chemoga Watershed, Blue Nile Basin, Ethiopia. Land
Degradation & Development 20, 609–622.
Biesemans, J., Van Meirvenne, M., Gabriels, D., 2000. Extending the RUSLE with the Monte Carlo
error propagation technique to predict long-term average off-site sediment accumulation. Journal
of Soil and Water Conservation 55 (1), 35-42.
Bilotta, G.S., Grove, M., Mudd, S.M., 2012. Assessing the significance of soil erosion. Transactions of
the Institute of British Geographers 37, 342–345.
Boix-Fayos, C., Martínez-Mena, M., Arnau-Rosalén, E., Calvo-Cases, A., Castillo, V., Albaladejo, J.,
2006. Measuring soil erosion by field plots: Understanding the sources of variation. Earth-Science
Reviews 78, 267–285.
Breiman, T., Cutler, A., 2012. Package “ randomForest ”, p. 29 (http://cran.rproject.org/web/packages/randomForest/randomForest.pdf).
Bryan, R.B., 2000. Soil erodibility and processes of water erosion on hillslope. Geomorphology 32,
385–415.
Burke, L., Sugg, Z., 2006. Hydrologic Modeling of Watersheds Discharging Adjacent to the
Mesoamerican Reef, Development. World Resources Institute (WRI), p.40
(http://eprints.eriub.org/24/1/MAR_Hydrologic_Model_Results_-_English.pdf).
Cutler, D.R., Edwards, T.C., Beard, K.H., Cutler, A., Hess, K.T., Gibson, J., Lawler, J.J., 2007.
Random forests for classification in ecology. Ecology 88(11), 2783–2792.
De Baets, S., Poesen, J., Gyssels, G., Knapen, A., 2006. Effects of grass roots on the erodibility of
topsoils during concentrated flow. Geomorphology 76, 54–67.
Eslinger, D. L., Carter, H. J., Dempsey, E., VanderWilt, M., Wilson, B., Meredith, A. 2005. The
Nonpoint Source Pollution and Erosion Comparison Tool (NSPECT). Systems Research.
Charleston, South Carolina: NOAA Coastal Services Center, p. 42
(http://www.csc.noaa.gov/digitalcoast/tools/opennspect).
Estrada-Carmona, N., Declerck, F., 2012. Payment for Ecosystem Services for Energy , Biodiversity
Conservation , and Poverty Reduction in Costa Rica. In: J.C. Ingram, F. Declerck, and C.
Rumbaitis-del Rio, (Eds.), Integrating Ecology and Poverty Reduction: The Application of
Ecology in Development Solutions. Springer, New York, pp. 191–210.
Falk, M.G., Denham, R.J., Mengersen, K.L., 2009. Estimating Uncertainty in the Revised Universal
Soil Loss Equation via Bayesian Melding. Journal of Agricultural, Biological, and Environmental
Statistics 15(1), 20–37.
92
FAO. 1989. Evaluación de los estados de la erosión hídrica de los suelos en Costa Rica (Assessment of
soil erosion by water in Costa Rica). Informe técnico Nº2. Programa de cooperación FAO/Italia.
Roma.
Ferreira, V.A., Weesies, G.A., Yoder, D.C., Foster, G. R., Renard, K.G., 1995. The site and condition
specific nature of sensitivity analysis (RUSLE). Journal of Soil and Water Conservation 50(5),
493.
Flanagan, D.C., Nearing, M.A., 1995. USDA-Water Erosion Prediction project: Hillslope profile and
watershed model documentation. NSERL Report no. 10, USDA-ARS National Soil Erosion
Research Laboratory. West Lafayette, IN 47097- 1196
(http://www.ars.usda.gov/Research/docs.htm?docid=18073).
Fremier, A.K., DeClerck F.A.J., Bosque-Pérez, N.A., Estrada-Carmona, N, Hill, R, Joyal, T,
Keesecker, , L., Klos, P.Z. , Martínez-Salinas, A., Niemeyer, R., Sanfiorenzo, A. , Welsh, K., and
Wulfhorst, J.D. 2013. Understanding spatiotemporal lags in ecosystem services to improve
incentives. BioScience 63(6): 472-482.
Gaffer, R.L., Flanagan, D.C., Denight, M.L., Engel, B. A., 2008. Geographical information system
erosion assessment at a military training site. Journal of Soil and Water Conservation 63(1), 1–10.
Gardiner, E.P., Meyer, J.L., 2001. Sensitivity of RUSLE to data resolution: modeling sediment
delivery in the upper little Tennessee river basin. In: Hatcher, K.J. (Ed.), Water Resources
Conference. Institute of Ecology. University of Georgia, Georgia, pp. 561–565.
Gómez Delgado, F., 2002. Evaluación de la erosión potencial y producción de sedimentos en tres
cuencas de Costa Rica (Assessment of the potential erosion and sediment production in three
Costa Rican watersheds). Engineer Degree, Costa Rican University, Costa Rica.
Gyssels, G., Poesen, J., Bochet, E., Li, Y., 2005. Impact of plant roots on the resistance of soils to
erosion by water: a review. Progress in Physical Geography 29(2), 189–217.
Harper, E.B., Stella, J.C., Fremier, A.K., 2011. Global sensitivity analysis for complex ecological
models: A case study of riparian cottonwood population dynamics. Ecological Applications 21(4),
1225–1240.
Hoyos, N., 2005. Spatial modeling of soil erosion potential in a tropical watershed of the Colombian
Andes. Catena 63, 85 – 108.
Lal, R., 2001. Soil degradation by erosion. Land Degradation & Development 12(6), 519–539.
Linse, S.J., Mergen, D.E., Smith, J.L., Trlica, M.J., 2001. Upland Erosion under a Simulated Most
Damaging Storm. Journal of Range Management 54(4), 356.
Lu, D., Li, G., Valladares, G.S., Batistella, M., 2004. Mapping soil erosion risk in Rondônia, Brazilian
Amazonia: using RUSLE, remote sensing and GIS. Land Degradation & Development 15(5),
499–512.
Marchamalo Sacristian, M., 2004. Ordenación del territorio para la producción de servicios
ambientales hídricos . Aplicación a la cuenca del Río Birrís ( Costa Rica ) (Land planning for the
93
provisioning of hydrological environmental services: An application in the Birrís River, Costa
Rica). PhD Dissertation. Escuela Técnica Superior de Ingenieros de Montes, Spain.
McCool, D.K., Foster, G.R., Yoder, D.C., 1997. Slope length and steepness factor (LS). In: K.G.
Renard, G.R. Foster, G.A. Weesies, D.K. McCool, and D.C. Yoder, Predicting soil erosion by
water: a guide to conservation planning with the Revised Universal Soil Loss Equation (RUSLE).
U. S. Department of Agriculture, Agriculture Handbook No. 703. Washington, D.C., pp. 404.
Morgan, R.P.C., Quinton, J., Smith, R.E., Govers, G., Poesen, J.W.A., Auerswald, K., Chisci, G., Torri,
D., Styczen, M.E., 1998. The European Soil Erosion Model (EUROSEM): A dynamic approach
for predicting sediment transport from fields and small catchments. Earth Surface Processes and
Landforms 23, 527–544.
Mueller, T.G., Cetin, H., Fleming, R.A., Dillon, C.R., Karathanasis, A.D., Shearer, S.A., 2005. Erosion
probability maps : Calibrating precision agriculture data with soil surveys using logistic
regression. Journal of Soil and Water Conservation 60(6), 462-468.
Mutua, B.M., Klik, A., Loiskandl, W., 2006. Modeling soil erosion and sediment yield at a catchment
scale: the case of Masinga catchment, Kenya. Land Degradation & Development 17, 557–570.
Nash, J.E., Sutcliffe, J.V., 1970. River flow forecasting through conceptual models part I — A
discussion of principles. Journal of Hydrology 10, 282-290.
Nearing, M.A., Govers, G., Norton, L.D., 1999. Variability in Soil Erosion Data from Replicated Plots.
Soil Science Society of America Journal 63, 1829–1835.
Nearing, M.A., Romkens, M.J.M., Norton, L.D., Stott, D.E., Rhoton, F.E., Laflen, J.M., Flanagan,
D.C., Alonso, C. V, Binger, R.L., Dabney, S.M., Doering, O.C., Huang, C.H., Mcgregor, C.,
Simon, A., 2000. Measurements and Models of Soil Loss Rates of Soil Loss. Science New Series
290(5495), 1300–1301.
Nelson, E., Mendoza, G., Regetz, J., Polasky, S., Tallis, H., Cameron, Dr., Chan, K.M., Daily, G.C.,
Goldstein, J., Kareiva, P.M., Lonsdorf, E., Naidoo, R., Ricketts, T.H., Shaw, M.R., 2009. Modeling
multiple ecosystem services, biodiversity conservation, commodity production, and tradeoffs at
landscape scales. Frontiers in Ecology and the Environment 7(1), 4–11.
Pang, H., Lin, A., Holford, M., Enerson, B.E., Lu, B., Lawton, M.P., Floyd, E., Zhao, H., 2006.
Pathway analysis using random forests classification and regression. Bioinformatics (Oxford,
England) 22(16), 2028–36.
Pedroni, L., 2003. Improved classification of Landsat Thematic Mapper data using modified prior
probabilities in large and complex landscapes. International Journal of Remote Sensing 24(1), 91–
113.
Pelacani, S., Märker, M., Rodolfi, G., 2008. Simulation of soil erosion and deposition in a changing
land use: A modeling approach to implement the support practice factor. Geomorphology 99, 329–
340.
Pimentel, D., Harvey, C., Resosudarmo, P., Sinclair, K., Kurz, D., McNair, M., Crist, S., Shpritz, L.,
Fitton, L., Saffouri, R., Blair, R., 1995. Environmental and economic costs of soil erosion and
conservation benefits. Science 267, 1117–23.
94
R Core Team, 2012. R: A language and environment for statistical computing. R Foundation for
Statistical Computing, Vienna, Austria. ISBN 3-900051-07-0 (http://www.R-project.org/).
Ranzi, R., Le, T.H., Rulli, M.C., 2012. A RUSLE approach to model suspended sediment load in the
Lo river (Vietnam): Effects of reservoirs and land use changes. Journal of Hydrology 422-423, 17–
29.
Rapp, J.F. 1994. Error assessment of the Revised Universal Soil Loss Equation using natural runoff
plot data. M.S. Thesis. School of Renewable Natural Resources, Univ. of Arizona, Tucson, AZ.
Renard, K.G., Ferreira, V.A., 1993. RUSLE Model description and database sensitivity. Journal of
environmental quality 22(3), 458–466.
Renard, K.G., Foster, G.R., Weesies, G.A., McCool, D.K., Yoder, D.C., 1997. Predicting soil erosion
by water: a guide to conservation planning with the Revised Universal Soil Loss Equation
(RUSLE) U. S. Department of Agriculture, Agriculture Handbook No. 703. Washington, D.C., pp.
404.
Risse, L.M., Nearing, M.A., Nicks, A.D., Laflen, J.M., 1993. Error assessment in the Universal Soil
Loss Equation. Soil Science Society of America Journal 57(3), 825–833.
Saltelli, A., Tarantola, S., Chan, K., 1999. A Quantitative Model-Independent Method for Global
Model Sensitivity Analysis of Model Output. Technometrics 41(1), 39–56.
Schuler, J., Sattler, C., 2010. The estimation of agricultural policy effects on soil erosion—An
application for the bio-economic model MODAM. Land Use Policy 27, 61–69.
Schwilch, G., Hessel, R., & Verzandvoort, S. (Eds.). (2012). Desire for Greener Land. Options for
sustainable land management in drylands. Bern, Switzerland adn Wageningen, The Netherlands:
SRIC - World Soil Information and CTA - Technical Centre for Agricultural and Rural
Cooperation. Retrieved from
https://www.wocat.net/fileadmin/user_upload/documents/Books/DESIRE_BOOK_low_resolution.
pdf
Shi, Z.H., Ai, L., Fang, N.F., Zhu, H.D., 2012. Modeling the impacts of integrated small watershed
management on soil erosion and sediment delivery: A case study in the Three Gorges Area, China.
Journal of Hydrology 438-439, 156–167.
Sobol′, I., 2001. Global sensitivity indices for nonlinear mathematical models and their Monte Carlo
estimates. Mathematics and Computers in Simulation 55, 271–280.
Therneau, T.M., Atkinson, B., 2011. Package “ rpart ” Source (http://cran.rproject.org/web/packages/rpart/rpart.pdf).
Tiwari, A.K., Risse, L.M., Nearing, M.A., 2000. Evaluation of WEPP and its comparison with USLE
and RUSLE. American Society of Agricultural Engineers 43(5), 1129–1135.
Van Remortel, R., Maichle, R.W., Hickey, R.J., Remortel, R.D. Van, 2004. Computing the LS factor
for the Revised Universal Soil Loss Equation through array-based slope processing of digital
elevation data using a C ++ executable. Computers & Geosciences 30, 1043–1053.
95
Wagner, H.M., 1995. Global sensitivity analysis. Operations research 43(6), 948–969.
Wang, G., Gertner, G., Anderson, A.B., Howard, H., Gebhart, D., Althoff, D., Davis, T., Woodford, P.,
2007. Spatial variability and temporal dynamics analysis of soil erosion due to military land use
activities : uncertainty and implications for land management. Land Degradation & Development
18, 519–542.
Waylen, P.R., Quesada, M.E., Caviedes, C.N., 1996. Temporal and Spatial Variability of Annual
Precipitation in Costa Rica and the Southern Oscillation. International Journal of Climatology 16,
173–193.
Wischmeier, W.H., Smith, D.D., 1978. Predicting rainfall erosion losses a guide to conservation
planning. U. S. Department of Agriculture, Agriculture Handbook No. 537, pp. 69.
Yang, D., Kanae, S., Oki, T., Koike, T., Musiake, K., 2003. Global potential soil erosion with reference
to land use and climate changes. Hydrological Processes 17, 2913–2928.
Zhang, R., Liu, X., Heathman, G.C., Yao, X., Hu, X., Zhang, G., 2013. Assessment of soil erosion
sensitivity and analysis of sensitivity factors in the Tongbai–Dabie mountainous area of China.
Catena 101, 92–98.
96
CHAPTER 4: PREVENTION IS BETTER THAN CURE: IMPLEMENTING SOIL
CONSERVATION PRACTICES MAY BE CHEAPER THAN DREDGING
Natalia Estrada-Carmona, Fabrice DeClerck, Alexande K. Fremier
1. Abstract
Assessing changes in the provisioning of ecosystem services (ES) due to changes in agroecosystem
management will better inform Costa Rican PES escheme. This scheme is recognizing the role of
agroecosystem as ES providers, still an assessment of the provisioning of ES by implementing ideal
cropping systems (combination of at least two or three soil conservation practices) rather than only
spread trees is missing. One of the most critical ES provided in agroecosystems is soil retention, this
ES have on-site benefits for the farmer and off-site benefits for downstream consumers such as
hydropower companies. We estimated changes on soil retention ES by implementing ideal cropping
systems in three of the most important basins for hydropower and agricultural production in the
Upper-Middle Reventazon watershed in Costa Rica. We tested three targeting strategies, four budgets
allocations and compared the avoided cost of dredging the retained soil with current dredging cost. We
quantified the provision of the soil retention ES using the Integrated Valuation of Environmental
Services (InVEST). We used the Tradeoffs and the Resources Investment Optimization System (RIOS)
to test our three targeting strategies: (1) RIOS default optimization, (2) RIOS constrained to current
land uses in conflict with soil legislation and (3) RIOS constrained to erosive crops and crops on steep
slopes. The tested budget included the lowest budget allocated in the watershed for soil conservation
programs in the past up to the maximum amount it will be requiered to implement ideal cropping
systems across all the agricultural land. Our results indicate that targeting efforts on erosive crops or
crops on steep slopes will likely provide the highest cost-effectiveness investment scenario, or in other
words, the highest soil retention per dollar spent. Under this particular targeting strategy, investments
in ideal cropping systems may be more cost effective than dredging sediment from the downstream
97
reservoirs, given our modeling assumptions. Our modeling strategy, offers a conservative and simple
but robust first approximation to a methodology that can be adapted and modeled iteratively to assess
ES provisioning due to changes in agroecosystems management.
2. Introduction
Agroecosystems production and sustainability along with forest conservation should be top priorities
for Costa Rica (Hall et al., 2000). Approximately 35% of Costa Rica land for food production has poor
management practices (Vignola et al., 2010; CADETI, 2004). Poor management practices impacts the
national economy with an estimated reduction of 7.7% of the agriculture gross domestic product due
to soil erosion and nutrient depletion (MINAE 2002). Costa Rica consumes 4-8 times more fertilizers,
particularly nitrogen and potash, than the average Latin America country (FAO, 2013). High amounts
of fertilizers are required to compensate for the high erosion rates that probably are exceeding soil
formation rates in most of the agricultural land (Rubin & Hyman, 2000). In addition to the loss of crop
productivity from soil loss, the transport and accumulation of sediment has further economic
implication for downstream reservoirs for hydropower (Vignola et al., 2008). Hydropower is the main
source of energy in Costa Rica, constantly challenged by the high sediment loads and pollution into
upstream reservoirs (Haun et al., 2013; Brandt & Swenning, 1999). Besides, high sediment loads
reduce the life span of dams by rapid infilling (Haun et al., 2013). Pollution (source and non-source)
from agriculture production affects water quality, riparian habitats and aquatic communities
(Echeverría-Sáenz et al., 2012).
Efforts to protect soil (and the services it provides) are weaker than the efforts to protect forest cover
(and the services it provides) in Costa Rica. Forest cover area in Costa Rica is slightly increasing
(FAO, 2013) while soil is being depleted (MINAE 2002). The increase of forest cover is due to a
combination of factors such as the creation and enforcement of the Forestry Law 7575 in 1997 which
forbids deforestation while promotes incentive-based conservation via payment for environmental
98
services (PES) schemes; besides other external factors such as the increase of ecotourism and the
reduction of cattle ranch profitability (Robalino & Pfaff, 2013). The Soil Law 7779 created in 1998
has a poor enforcement that has led to poor conditions, law inconsistencies and constrained budgets
that weakened agricultural extension offices, key organizations transmitting information, technology
and sustainable soil conservation practices (Vignola et al., 2013; Vignola et al., 2010). Hydropower
companies, an industry highly dependent and affected by water quality, has been also promoting
environmental education (Blackman & Woodward, 2010), supporting soil conservation management
(Vignola et al., 2012) and supporting watershed management plans (PREVEDA, 2008) to increase soil
retention at the source. Also, major voluntary or non-voluntary (tax payments) investments to fund the
PES scheme comes from hydropower companies to improve the provision of hydrological services
and extend the life span of the dams: but most importantly to improve their relationship with local
stakeholders (Blackman & Woodward, 2010).
Payment for ecosystem services (PES) scheme goals is to increase national forest cover to generate
multiple ecosystem services (ES), such as hydrological services (particularly water quality), scenic
beauty, carbon sequestration, and biodiversity (Pagiola, 2008). The PES scheme provides funds for
forest protection, forest management, reforestation, and, recently, agroforestry. The recognition of
agroforestry (only trees within agricultural land) in the Costa Rican PES scheme was an important step
towards recognizing the role agroecosystems as ES providers. The total land area covered with PES
for agroforestry has increased from 2% in 2003 to 12% in 2011 (FONAFIFO, 2014). Despite this
increase, we still lack a quantified understanding of which practices guarantee ES provisioning at the
site level and how site level implementations across a watershed improve larger scale services in
agroecosystems, such as soil retention. Design efficacy and site prioritization of agroforestry practices
becomes key component in designing PES programs that get what they pay for.
To curb soil loss from agroecosystems, many conservation practices (not only spread trees as current
PES scheme) have proven to increase farm productivity while improving soil retention and water
99
quality (Dogliotti et al., 2013; Lenka et al., 2012; WOCAT, 2012; Cocchi & Bravo-Ureta, 2007;
Alegre, & Rat, 1996). In Honduras, ground-cover technologies such as crop-mulch/residue
management, green manure and conservation tillage led to an increase of farm income up to 20%
(Cocchi & Bravo-Ureta, 2007). While in Chile, multi-year planning and farm redesign halved soil
erosion rates (Dogliotti et al., 2013). Past experiences studying a PES scheme on degraded pastures in
Costa Rica, Nicaragua and Colombia, indicated that implementing both, high density of trees and
shrubs, improved rangeland productivity, biodiversity, carbon sequestration and water quality (Pagiola
et al., 2005; Garbach et al., 2012). However, potential negative effects such as competition for
nutrients and light, increase of diseases and seedlings suppression should also considered in full costbenefit analyses (Alegre, & Rat, 1996). Vegetative conservation practices offer diverse ES and are as
effective as physical or structural practices (particularly retaining soil) but are more cost-effective and
more flexible (Bravo-Ureta et al., 2006; Maetens et al., 2012).
Farmer’s voluntary implementation of conservation practices is limited by short-term needs, lack of
information and lack of resources (Vignola et al., 2010). In addition, masking factors such as external
inputs, soil deposition, deep soils and everyday contact also limits voluntary implementation (Lal,
2001, Vignola et al., 2012). However, a recent research in one of the most erosive and hydrological
important watershed in Costa Rica indicated that farmers (ES providers) and hydropower companies
(ES consumers) agreed on the need to change existent conditions in terms of land use and management
towards a more sustainable (Vignola et al., 2008). Local stakeholders highlighted that efforts to
promote the desired change should be targeted to high priority areas (Vignola et al., 2012).
To define which targeting strategy will be the most cost-effective, we used a coupled economic and
soil loss model to evaluate multiple strategies for reducing soil loss and compared these estimates to
the costs of dredging three reservoirs in the upper and middle part of the Reventazon River, Costa
Rica. We estimated the effect of implementing soil conservation practices as a strategy to provide the
ES soil retention under three targeting strategies and three budget levels. We were particularly
100
interested on two key questions. First, which targeting strategies, investment distribution and budget is
the most effective to provide the ES soil retention? Second, at which point investments to provide the
ES soil retention are cheaper than the cost dredging? To answer both questions, we conducted a
literature review to select the most suitable practices according to the agroecological and productive
conditions of the study area. We also conducted a meta-analysis to estimate the efficacy of each
practice retaining soil. The Integrated Valuation of Environmental Services and Tradeoffs (InVEST)
help us to estimate soil retention under current and the different targeting strategies at the watershed
scale. And, we used the Resources Investment Optimization System (RIOS) tool to test three targeting
strategies. Though excluded from our analysis all the transaction costs associated with
implementation, we focused on establishment and maintenance cost of the soil conservation practices.
3. Methodology
3.1. Study area
The upper and middle part of the Reventazon watershed has an area of 139,644 ha and generates
approximately 38% of the national energy, 25% of the consumed water in San José and 11% of the
agricultural products for exportation (ProDUS, 2011). Our analysis covers the drainage area of three of
the most important dams within the Reventazon: Cachi, Angostura and Birris (Table 4; Figure 15). In
2000, the government created legislation (Law Nº 8023, 2000) to regulate and promote the sustainable
management of the watershed due to its importance to the national economy. The upper and middle
part of the watershed developed a management plan to improve local capacity, risk management,
environmental education and soil conservation particularly on highly erosive basins (PREVEDA,
2008). These efforts to reduce soil loss have had only marginal impacts and the watershed still has
high level of erosion and pollution (PREVEDA, 2008).
101
Table 4. Characteristics of the assessed dams in the Reventazon watershed. Assessment accuracy based
on the comparison between the reported sediment yield to each reservoirs and the estimated exported
sediment with InVEST.
Starting Current Capacity Removal Sediment yield InVEST
Accuracy Assessment
production
cost
Exported Sediment ReportedEstimated
(projected)
Sediment delivery ratio Soil loss Soil loss
year
MW
millions∙m3$millions∙y- $millions∙y-1 $millions∙yt∙ha-1
t∙ha-1
Dam/
1
1
Reservoir
Cachi/
1966 100 (160)
48*
1,1
3.5
0.32
26***
14
ICE
Birris/
1990 4.3(13.6)
0.2
0.6
0.28
42***
42
JACEC
Angostura/ 2000
177
10.7**
1,5**
5.5
0.27
26****
26
ICE
Total
>2-4
2.8
JASEC: Junta Administrativa del Servicio Eléctrico Municipal de Cartago
ICE: Instituto Costarricense de Electricidad
*The original volume is 54Mm3, however, the latest estimation in 1993 indicated a volume loss of 11% of the
original volume (Jiménez-Ramírez and Rodríguez-Mesa, 1992)
**The original volume is 11Mm3, however, after two years of functioning the dam lost 2.5% of the original
volume (Jiménez-Ramírez and Rodríguez-Mesa, 1992)
***Marchamalo (2004); Abreu (1994)
**** Vignola et al., (2010)
The Reventazon watershed is located on the Caribbean side of the Costa Rica mountain range (Figure
15), with annual precipitations ranging from 1,551 to 6,303 mm∙y-1 with an average of 2,955 mm∙y-1.
The watershed is characterized by steep slopes in the upper and middle part of the watershed of
altitudes ranging from 449 to 3,475 m.a.s.l and with an average slope of 21° (slope 37.5%). The
watershed is largely covered with forest (51% of the total area), perennial crops (25%), pasture (16%)
and semi-perennial and annual crops (5%). Coffee and sugarcane are the dominant perennial and semiperennial crops. Forest cover has been constant through time the Reventazon watershed, but pastures,
urban and sugarcane areas are increasing by replacing coffee and shrubland areas (Brenes, 2009).
102
Figure 15. The left panel shows the location of the Upper – Middle Reventazon watershed and the
drainage area of the dams. The right panel shows the distribution of the targeted areas and the level of
agreement across the three targeting strategies: 1) RIOS, 2) RIOS&Legislation and 3) RIOS&C-S. The
level of agreement indicates which areas were targeted (or not) by the strategies. For example, with a
budget of $1.5 millions, ninenty four percent of the area was excluded from all three targetting
strategies to implement ideal croping systems and, all the three strategies allocated the budget
differently (3/3 – 0% of the agricultural land).
3.2. Activities: Ideal cropping systems – coupled soil conservation practices
Agroforestry is supported by the PES scheme to increase the number of trees within agricultural land
(FONAFIFO, 2014). Spread trees can particularly provide ES such as scenic beauty, carbon
103
sequestration and biodiversity (Harvey et al., 2006; Perfecto et al., 2008). However, to particularly
provide hydrological services, other soil conservation practices should be considered. In this modeling
effort, we incorporated other vegetative soil conservation practices that minimize soil loss and
maintain agricultural production, with lower implementation cost than engineered structures (BravoUreta et al., 2006; Maetens et al., 2012). For each selected soil conservation practice we completed a
literature review to list the pros and cons (Supplemental Material I) and to estimate the cost of
implementation and the soil retention efficiency (Figure 16).
The Program for Sustainable Agriculture in Steep-lands in Central America (PASOLAC) systematized,
revised and validated promising soil conservation practices using Honduras, Nicaragua and El
Salvador farmers, technicians and organizations’ knowledge and experience (PASOLAC, 2000). We
used this dataset and selected the most suitable soil conservation practices for the agroecological and
production conditions of the Reventazon. Four main soil conservation practices were selected: mulch,
herbaceous hedgerows, agroforestry systems (low and high density) and cover crops or intercropping
(Figure 16). In the Reventazon watershed farmers are already familiar with these selected practices
(Vignola et al., 2010) which are actively being promoted by the watershed management plan
(COMCURE, 2009). In our analysis we also assessed the combined effect of coupling multiple of the
soil conservation practices (termed ideal cropping systems). Coupled practices were based on previous
research (WOCAT, 2012; Vignola et al., 2010; Raudes & Sagastume 2009; COMCURE, 2009; FAO
2000 and 2001,) (Figure 16).
104
Figure 16. Ideal cropping systems or activities implementation and maintenance cost per hectare (I &
M) estimated as the sum of each soil conservation practices implementation and maintenance cost
(¡Error! No se encuentra el origen de la referencia.). Soil retention efficacy (SRE) estimated as the
sum of the minimum reported efficacy for each soil conservation practice. Legend of the soil
conservation practices at the bottom: Hedgerow, agroforestry, cover crops and mulching.
105
Each soil conservation practice has important pros and cons, and factors that limit their efficacy
trapping soil and the adoption by individual farmers (¡Error! No se encuentra el origen de la
referencia.). For example, soil conservation practices might limit the ability of machinery to enter the
field or a practice could increase crop management complexity or increase shade area thereby increase
pest risk (Raudes & Sagastume 2009). In addition, the specific crop, be it annual, perennial or semiperennial, impacts the possible combinations of soil conservation practices. For example, burning is
practiced in the region to harvest sugar cane (semi-perennial); therefore, hedgerows with trees in lineal
arrangement are advocated over intermixed plantings. We considered these factors to design our ideal
cropping systems and to model the effect of implementing those as a strategy to minimize soil loss.
For example, cover crops or mulch will protect the soil from detachment, but if detached, hedgerows
downslope will potentially retain it and agroforestry systems will promote deeper roots and grater
infiltration rates (Supplemental Material I). We implemented ideal cropping systems on current
perennial, annual, semi-perennial and pasture land cover types. But, we implemented reforestation
with endangered tree species on bare soil cover type rather ideal cropping systems.
Implementation and maintenance cost for each one of the soil conservation practices were adopted
from PASOLAC (2000) and updated to Costa Rican wages and prices (¡Error! No se encuentra el
origen de la referencia.). Seed costs were obtained from a tropical research center in Costa Rica
(CATIE) seed bank prices and the cost of the tree seed species correspond to the tree endangered
species promoted according to Costa Rican legislation. The cost of implementing hedgerow increases
with the slope steepness, so we estimated the total cost for each ideal cropping as the sum of each soil
conservation practice cost on level (<15%), moderate (15-30%) and steep (>30%) slopes and used the
averaged total cost across slope steepness (¡Error! No se encuentra el origen de la referencia.). The
cost of reforestation with endangered tree species equals the payment that FONAFIFO is currently
(2014) assigning to this activity ($1,470). Our cost of implementing and maintaining ideal cropping
systems do not include cost associated with running and maintaining a PES program. This includes
106
transaction, training and opportunity costs. Targeting efforts to a small portion of the landscape will
decrease transaction and monitoring costs, yet without a quantification of these costs, this analysis
should not be considered a complete program analysis (Garrick et al., 2013).
The soil retention efficacy by each conservation practice and coupled practices were estimated from a
meta-analysis. We searched in ScienceDirect using keywords such as "mulch" & "soil loss", “cover
crops" & "soil loss", "hedgerow" & "soil loss" and "agroforestry" & "soil loss". We found 30 articles
and 105 observations that reported the soil retention efficacy of specific soil conservation practices
(the difference in measured soil loss with and without the soil conservation practice; 0% no retention
and 100% maximum retention) (¡Error! No se encuentra el origen de la referencia.). We performed
an analysis of variance (ANOVA) to test differences in soil retention efficacy between practices across
slope ranges. The ANOVA indicated that agroforestry and agroforestry combined with hedgerow have
significantly lower soil retention efficacy (36% and 43%, respectively) (p-value = 0.042). There were
no significant differences between the other practices and at the different slopes categories.
We use a conservative method to estimate the soil retention efficacy of each soil conservation practices
and ideal cropping systems due to the high variability among experiments and the lack of clear trends.
We used the minimum reported value across the 105 observations for each practice (¡Error! No se
encuentra el origen de la referencia.). We assumed that the interaction and retention efficacy among
soil conservation practices in the ideal cropping system was additive; and therefore, we estimated the
total soil retention efficacy of each ideal system as the sum of the minimum reported soil retention for
each soil conservation practice (Figure 16, ¡Error! No se encuentra el origen de la referencia. ). In
this study we only assessed soil retention as an ES; however, vegetative practices can also improve
water regulation, nutrient cycling and biological control among other ES at the plot scale (Comerford
et al., 2013). At larger scales, increase forest cover can improve habitat connectivity (Martínez-Salinas
107
& DeClerck, 2010), food security and human nutrition (DeClerck et al., 2011) and reduce vulnerability
to extreme events (Altieri, 2002; Holt-Giménez, 2002).
3.3. Tools: Integrated Valuation of Environmental Services and Tradeoffs (InVEST) and
Resources Investment Optimization System (RIOS)
Our metric for ecosystem service provision was soil retention, or in other words, the reduction of the
exported soil off site by implementing the ideal cropping systems, estimated with InVEST and RIOS.
InVEST and RIOS were developed by the Natural Capital Project and are complementary tools to
assess ecosystem services. InVEST determines the quantity or presence of an ecosystem service; while
RIOS identifies priority areas where changes on land use management to protect or restore an
ecosystem service are potentially more cost-effective (Sharp et al., 2013; Vogl, et al., 2013). Soil
retention was estimated as the difference between the estimated exported soil with InVEST under
current conditions and the three targeting strategies we explored using also three budget levels with
RIOS, over the current conditions’ exported soil. Our analysis only included agricultural lands
available to ideal cropping systems (53% of the watershed [73,441 ha] area). For instance we excluded
protected areas, forest, urban, or water bodies, as well as areas classified as clouds or shadows.
RIOS identifies the areas that are more cost-effective retaining soil by combining information about
the user desired activities (i.e. soil conservation practices), the cost of implementing each activity, the
user´s available budget and the critical factors determining potential effectiveness retaining soil such
as the contributing area, crop management (Factor C), riparian continuity restoration among others
(Table 5) (Vogl et al., 2013). The critical factors determining soil loss come from a detailed review of
literature and hydrological experiments and models; however, the user can modify the goal and weight
of each critical factor according to local conditions (maximize or minimize), exclude factors from the
analysis or use the defaults values as we did (Table 5) (Vogl et al., 2013). RIOS scores each pixel
potential effectiveness for retaining soil as the weighted sum of each one of the critical factors values
per activity (i.e. Figure 16), then, the cost of an activity is assigned to each pixel for all the included
108
activities. This is done to allocate the budget yielding the biggest return on investment; therefore, the
priority areas for an activity will potentially yield the greatest benefit at the lowest cost (Vogl et al.,
2013).
Table 5. Critical factors consider by RIOS to score each pixel’s potential effectiveness retaining soil.
Category
Upslope
Source Index
Downslope
Retention
Index
On-pixel
source:
Factors
Goal
determine
effectiveness
Upslope
Maximize
retention
index
Downslope Minimize
index
Weight Description
Calculated from (by who):
1
Estimates the contributing
area to a pixel and the
magnitude of the contribution
Estimates potential retention
downslope of a pixel
Flow accumulation, pixels sediment
export coefficients, retention factors,
slope (RIOS)
Flow length, slope, retention factors
(RIOS)
Obtained from literature review or by
measuring surface cover, mass
density of superficial roots,
effectiveness of surface cover; mass
density of incorporate surface residue,
surface soil consolidation factor,
surface roughness; canopy height,
surface roughness, fraction of land
surface covered by canopy impacts of
the subsurface residues (USER)
No events per year, erosive rain
Intensity (USER)
1
Sediment
export
coefficient
Maximize except 0.25
for transition keep
native veg
(Minimize)
Factor C in USLE. Indicates
the impacts of previous
cropping systems, the
protection offered to the soil
surface by vegetative canopy,
erosion reduction due to
surface cover, and surface
roughness
On-pixel
source:
Erosivity
factor
Maximize
0.25
On-pixel
source:
Erodibility
factor
Maximize
0.25
On-pixel
source:
On-pixel
retention
Soil depth
Maximize
0.25
Factor R in USLE. Indicates
the effect of raindrop impact
and rate of runoff associated
with rain of moderately sized
storms with occasional large
storms
Factor K in USLE. Reflects Soil structure; soil permeability,
soil profile reaction to
organic matter, %Silt , %Very fine
hydrologic processes (e.g.
sand, %Clay (USER)
raindrop impact, surface flow,
roughness (topographic or
induced), and rain water
infiltration).
(USER)
Sediment
retention
On-pixel
retention
Minimize except 0.5
for transition keep
native vegetation
(Maximize)
Maximize
0.5
Riparian
continuity
Beneficiaries Maximize
1
Reflects the efficacy of a
pixel trapping sediment and
holding it
From literature review. Factor
affected by land cover type and
management, geomorphology,
climate. (USER)
DEM and land use map (RIOS)
Indicated the continuity
riparian areas
Indicate priority areas based (USER)
on the number of
beneficiaries of the ES (no
people) or by the amount of
the service (energy produced)
InVEST models soil retention using the Universal Soil Loss Equation - USLE (Wischmeier & Smith
1978). The USLE is an empirical but robust model that combines the effect of the characteristics of the
109
soil (K factor), the intensity of the precipitation (R factor), conservation practices (P factor), slope
steepness (S factor), slope length (L factor) and cover management (C factor) (Wischmeier & Smith
1978). The empirical equation has important limitations (Sharp et al., 2013; Estrada-Carmona et al., in
review); however, it has shown to be applicable across a wide range of conditions to indicate areas of
greater risk to soil erosion by water (Gaffer et al., 2008).
We parameterized the USLE using available data for the area. The K values were obtained from FAO
surveys at a national level and soil type classification at a scale of 1:200,000 (FAO, 1989). The R
factor was estimated using the total storm energy (E) and a maximum 30 minute intensity (I30) for
each erosive storm (i.e. storms with total accumulated rainfall greater than 13 mm and separated by at
least six hours) for 148 station years of measurements in 54 meteorological stations of the Costa Rican
Institute of Electricity– (ICE; Gómez-Delgado, 2002). InVEST estimates the L and S factors using
Desmet and Govers (1996) methodology for the watershed’s digital elevation model with a 28.5 m
resolution (Imbach, 2006). Land uses were defined by a 1996 LandSat image classification (Pedroni,
2003), the most accurate land use classification with the best spatial and thematic resolutions for our
analysis to our knowledge. The C factor and the crop soil retention values for each the current land use
were obtained from RIOS’s extensive literature review (Vogl et al., 2013). The P factor was assumed
to be 1.0 for current conditions since no detailed information about the support practices in the
watersheds exists. But, we incorporated the effectiveness of the ideal cropping systems retaining soil
by modifying the practices factor (P factor). The P factor was estimated as one minus the soil retention
efficacy for each cropping system.
The USLE is better at estimating long term average erosion and it only estimates erosion by water
(sheet and rill) (Wischmeier & Smith 1978). Therefore, other erosive processes such as bank erosion,
landslides or even other types of erosion such as wind erosion are not considered (Wischmeier &
Smith 1978). This is particularly true in the Cachi drainage area where there is a greater frequency of
110
landslides within the basin (Ramírez et al., 2008). Yet, this source of sediment is not directly related to
land use decisions (afforestation is unlikely to stop land sliding) and should be considered background
variability. A potential larger unquantified land use impact is the construction of unpaved roads
(Gómez-Delgado et al., 2011).
We calculated the sediment delivery ratio, the proportion of the gross sediment exported per each pixel
that actually reaches the reservoirs, to assess the accuracy of the USLE estimations. The delivery ratio
was estimated as the ratio between the measured sediment yield in each reservoir (Table 4) and the
gross sediment for each dam’s drainage area (Bhattarai & Dutta, 2006). Our estimated average
sediment per hectare was calculated as the total gross sediment exported per pixels divided by the
drainage area multiplied by the sediment delivery ratio.
3.4. Targeting strategies
Defining priority areas to target efforts can be based using different criteria. For this reason, we tested
the effectiveness of implementing cropping systems using three targeting strategies: RIOS default
optimization (named RIOS), RIOS constrained to areas in conflict with current legislation (named
RIOS&Legislation) and RIOS constrained to areas with erosive crops or crops on steep lands (named
RIOS&C-S). RIOS optimization uses the pre-determined critical factors (Table 5) to find the most
cost-effective areas to implement ideal cropping systems as we discussed in section 2.3. However, we
also tested if enforcing current land use capability legislation is the most effective strategy or if using
verifiable criteria’s in field and key drivers of soil erosion is the most effective.
We determined the targeting strategy RIOS&Legislation by overlapping the land use capability
developed for the Reventazon management plan (PREVDA, 2008) with the land use from 1996
(Pedroni, 2003). Costa Rica established in 1994 the land use capability for the national territory
according to local conditions such as soil nutrients, soil depth, relieve, rockiness, floodable (Act N°
111
23214-MAG-MIRENEM, 1994). The land use capability classifies the land into eight categories, from
null restrictions for productive activities (i.e. class I) to high restrictions (i.e. class VIII). We defined
conflict areas as those areas that corresponds to 1) any productive activity occurring in areas that
should be dedicated to forest protection (i.e. classes VII, VIII), 2) other agricultural activities than
perennial crops in areas with severe limitations (i.e. class VI) and 3) other agricultural activities than
semi-perennial and perennial crops occurring in areas with strong limitations (i.e. classes IV). We
constrained RIOS to run and prioritize using only the areas in conflict (33,693 ha, ~41% of the upper
Reventazon watershed area).
We determined the targeting strategy RIOS&C-S by overlapping the land use map and the slope.
Estrada-Carmona et al., (in review), identified for the same watershed using a global sensitivity
analysis, that the interaction between cover management and slope steepness is what mainly drives
soil erosion in the region. Therefore, we used Estrada-Carmona et al. (in review) results and identify
those areas located on 1) steep areas (steepness >23%) with productive uses (C factor > 0.07) and 2)
erosive crops (C factor >0.4) on level landscapes (steepness <23%). We constrained RIOS to run and
prioritize using only the areas where C and S factors interacts generating greater soil loss in the upper
Reventazon watershed area (36,009 ha, ~44%).
3.5. Budget allocation
We assessed the changes on the provision of the ecosystem service soil retention across different
budget levels. Low budget allocations correspond to the amount ($0.3 million USD) the Reventazon
watershed plan assigned to invest on soil loss control and to implement agroforestry systems during
2008-2010 (PREVDA, 2008). The medium budget allocations correspond to the lowest and larger
reported yearly dredging cost for both, Angostura and Cachi reservoirs. The national hydropower
company, ICE, spent between $2-4 million dredging the dams (Vignola et al., 2012, Vignola et al.,
2010). These costs exclude the financial support the ICE contributed to the Reventazon management
112
plan (PREVDA, 2008). Finally, the largest budget corresponds to the maximum amount ($7million)
that would be needed to allocate to cover the maximum extent of agricultural land available for ideal
cropping systems. We assumed an adoption rate of 100% during the first five years of implementing
and maintaining ideal cropping systems.
We assumed that at least a five year of continuous budget allocation would be needed for two reasons.
First, this period is approximately what it will take to fully establish ideal cropping systems (maximum
soil retention) and to potentially increase yield production (Alegre, & Rat, 1996). Second, FONAFIFO
distributes the payments for agroforestry in a five-year period (FONAFIFO, 2014).
We estimated the avoided cost as the cost of dredging the retained soil by each targeting strategy at the
different budget allocations for the life span of the dams. Then we compared both, the cost of
implementing ideal cropping systems (budget allocation) and the avoided cots. The cost of dredging
one ton of sediment in the area is $1.3t-1 according to Vignola et al. (2010), who reported that ICE
dredges every year 1.5millions∙tonnes of sediment from the reservoirs (Angostura and Cachi) with a
cost of at least $2 million USD. Approximately 70% of the sediment yield in the reservoirs is removed
during the dredging. For instance, the life span of the dams was estimated as the sum of the
accumulated sediment (30% of the sediment yield) through time until the reservoir capacity was full.
The total retained soil is the cumulative throughout the life span of the dams. The avoided cost is
estimated then as the dredging cost multiplied by the extended life span of the dam and the total
retained soil up-stream due to the implementation of the ideal cropping systems. We excluded the first
five years after of implementation to account for the time it will take to the practices to fully establish.
The avoided cost is estimated only for Cachi and Angostura’s dams. Birris was incorporated into the
Angostura drainage area in this analysis since we lacked information about the volume of the reservoir
(Table 4. ). We assumed constant conditions (i.e. sediment yield in the reservoirs, land cover) through
time to estimate the avoided cost and the extension of the life span of the dams since we lack of
113
historical data for all the dams. Measurements in Angostura indicates a high yearly variability with
reported extremely high sediment yields in the reservoirs up to five times greater than the average
yields (Jiménez-Ramírez et al., 2004).
4. Results
Modeling results indicated a wide range of ES provisioning rates across targeting and budget
allocation. InVEST (particularly the USLE) accuracy assessment indicated that model predictions are
consistent with reported values for the study area. Our comparisons across targeting strategies and
budget allocations indicated that the most cost-effective (highest soil retention per dollar) strategy is to
target lands with erosive crops and crops on steep lands (RIOS&C-S) using medium budgets ($1016.4million). Low budget allocations ($1.5million) yielded similar results across targeting strategies.
And, the benefits of investing on ideal cropping systems exceeded the dredging cost using RIOS&C-S
targeting strategy across budgets, given our modeling assumptions.
4.1. Universal Soil Loss Equation accuracy assessment
The soil retention ES provision rate was estimated as the relative change between current condition
and each targeting strategy across the three budgets (Figure 17 and 18). We used this rate to estimate
the reduction in sediment yield reaching the reservoirs and its effect extending the life span of the
dams (Table 6), rather than the gross estimates of cumulative sediment. As a simple accuracy
assessment of the gross estimates we compared our estimated average sediment per hectare with
reported values. The estimated average sediment per hectare for the Birris and Angostura dams
correspond to the values reported in other studies. The USLE underestimated measured values for the
Cachi drainage area in which the frequency of landslides is higher (Table 4).
114
Figure 17. Covered area and retained soil by the implemented ideal cropping systems in each drainage
area (Angostura, Cachi and Birris) under three targeting strategies (RIOS, RIOS constrained to areas
in conflict with legislation and RIOS constrained to areas with erosive crops on steep slopes) and at
different budget levels. The percentage of the cover area corresponds to the total area of each one of
the drainage area of each dam.
Figure 18. Covered area and retained soil in the upper and middle part of the Reventazon watershed by
using three strategies to target ideal cropping systems (RIOS, RIOS constrained to areas in conflict
with legislation and RIOS constrained to areas with erosive crops on steep slopes) at different budget
levels. One-hundred percent of the area refers to the 73,441ha in the watershed where ideal cropping
systems can be implemented.
115
Table 6. Dams lifespan extension and avoided cost if ideal cropping systems (ICS) are implemented
using different targeting strategies at different budgets levels.
Implementa
tion cost
($millions)
Targeting
strategies
RIOS&Legislation
Total
RIOS&C-S
Total
RIOS
Total
RIOS&Legislation
Total
RIOS&C-S
Total
RIOS
Total
RIOS&Legislation
Total
RIOS&C-S
Total
RIOS
Total
RIOS
Budget
Dam
Life span
Sediment yield
(y)
(millions∙t∙y-1)
No ICS
ICS
No ICS
ICS
Up-stream
Total
Avoided
retention
retained
cost
(millions∙t∙y-1) (millions∙t ($millions
)
)
ICS
ICS
ICS
1.5
1.5
Angostura
Cachi
24
145
24
147
1.5
1.1
1.49
1.09
0.01
0.01
0.3
1.2
1.5
1.5
Angostura
Cachi
24
145
24
147
1.5
1.1
1.49
1.09
0.01
0.01
0.2
1.8
1.5
1.5
Angostura
Cachi
24
145
24
147
1.5
1.1
1.49
1.09
0.01
0.01
0.3
1.9
10
10
Angostura
Cachi
24
145
25
150
1.5
1.1
1.45
1.07
0.05
0.03
1.0
4.7
10
10
Angostura
Cachi
24
145
26
153
1.5
1.1
1.37
1.05
0.13
0.05
2.7
8.1
10
10
Angostura
Cachi
24
145
25
150
1.5
1.1
1.45
1.07
0.05
0.03
1.0
4.7
14.9
14.9
Angostura
Cachi
24
145
25
155
1.5
1.1
1.41
1.03
0.09
0.07
1.8
9.9
16.4
16.4
Angostura
Cachi
24
145
26
161
1.5
1.1
1.36
1.00
0.14
0.10
3.0
16.3
20
20
Angostura
Cachi
24
145
25
153
1.5
1.1
1.43
1.05
0.07
0.05
1.5
8.0
34.5
34.5
Angostura
Cachi
24
145
27
163
1.5
1.1
1.34
0.98
0.16
0.12
3.5
18.8
Total
0.4
1.6
1.9
0.3
2.3
2.6
0.3
2.6
2.9
1.3
6.3
7.6
3.6
10.8
14.4
1.3
6.3
7.6
2.4
13.2
15.7
4.1
21.8
25.9
2.0
10.7
12.7
4.7
25.0
29.7
4.2. Targeting strategies and budget allocation comparison
The Birris dam has smallest drainage area yet has the highest erosion rates (Figure 15). This basin
occupies only 3% of the upper and middle Reventazon, still both targeting strategies RIOS&C-S and
RIOS&Legislation covered more area in this basin with ideal cropping systems yielding slightly
higher soil retention rates, particularly at the higher budget levels (Figure 17). Cachi and Angostura’s
dams have the largest drainage area, occupying 55% and percent 42% of the Reventazon watershed,
respectively. In these two dams, both targeting strategies RIOS and RIOS&Legislation tended to cover
the same proportion of area at the medium budgets yielding similar soil retention rates. Modeling
results show similar soil retention rates across targeting strategies with the lowest budget allocation
116
(Figure 17). Finally, RIOS&C-S yielded the highest soil retention rates across dams when medium and
larger budgets were available (Figure 17 and 18).
The targeting strategy with RIOS and the maximum budget ($34.5million) yielded the maximum soil
retention rate (14%). However, the targeting strategy RIOS&C-S yielded similar results (12%) using
half of the budget ($16.4millions) and covering half of the area (Figure 18). The RIOS & Legislation
targeting strategy is only more effective than RIOS when larger budgets were available (Figure 18).
With low budgets ($1.5millions), all the different targeting strategies had low effectiveness since they
only reduced ~1% of the total exported sediment and changed less than 3% of the area. The targeting
strategies of RIOS & C-S and RIOS & Legislation used partially the $20millions budgeted
($16.4millions and $14.9millions, respectively), indicating that the most effective areas retaining soil
can be covered with lower budgets (Figure 18).
The slope of both the covered area and the soil retention at different budgets indicates a marginal
benefit (Figure 18). Modeling results indicates that on average, every million invested may cover with
ideal cropping systems 2.3% (1,689 ha) of the agricultural land; however, every extra million invested
will only reduce exported soil in a magnitude of 0.4, 0.5 and 0.8 percent using RIOS, RIOS &
Legislation and RIOS & C-S targeting strategies, respectively. The marginal benefit across budgets
was constant for RIOS & C-S, but it increased for RIOS (from 0.3 to 0.6) and RIOS & Legislation
(from 0.3 to 0.8) when budget was increased from $10 to $20 million (Figure 18).
Budget allocation across cropping systems (i.e. annual, perennial, semi-perennial, pasture or
reforestation) was consistent with the current land use distribution. The largest proportion of the
budget (approximately 75%) across targeting strategies and budgets was designated to support
perennial and pasture ideal cropping systems. Bare soil, although occupying low proportion in the
watershed (1.2% of the area), was the third most invested activity across targeting strategies and
117
budgets, despite the highest implementation and maintenance cost (Supplemental Material II). This
means that investing on bare soil is effective in comparison to other activities.
4.3. Benefit of implementing soil conservation practices (avoided cost)
Avoided cost is the cost the hydropower companies would have to spend dredging if the retained soil
by the cropping systems entered the reservoir. Here, we assumed a constant sediment yield through the
life span of each dam. We also assumed a constant soil retention rate through time after five years of
cropping system establishment (Table 6). The estimated rates indicated that the targeting strategy
RIOS & C-S is the only strategy that consistently retained enough soil up-stream across budgets
allocations to make the investment on cropping systems cheaper than to remove the sediment from the
reservoirs (Figure 19a). The targeting strategy RIOS & C-S also extended the dams’ life span close to
the maximum that could extended with RIOS and the highest budget ($34.5), which covers 78% of the
watershed area where ideal cropping systems can be implemented (Figure 18). RIOS targeting strategy
with a budget of $34.5millions extended the life span of the Angostura and Cachi dams, 2.9 years and
17.6 years, respectively. RIOS&C-S targeting strategy and with half of the budget ($16.5millions)
extended both dams life span, 2.5 years and 15.3 years, respectively (Figure 19b).
118
Figure 19. Panel a) shows the avoided cost by the hydropower companies estimated as the cost of
removing the sediment retained up-stream by the cropping systems (black dots) at the different budget
levels and targeting strategies. The black line represents the implementation cost of the cropping
systems, below this line (gray area), the implementation and maintenance cost of the ideal cropping
systems is more expensive than the dredging cost of the retained soil by the ideal cropping systems.
Panel b) shows the extension of the dams’ life span across targeting strategies and budgets.
Other targeting strategies avoided costs was similar or lower than the implementation cost of the ideal
cropping systems, potentially due to a low soil retention rate (Table 7). Still, almost all targeting
strategies extended the life span of the dams between 0.8y and 1.5y for Angostura’s dam and between
4.5y and 9.3y for Cachi’s dam with budgets greater than $1.5millions (Figure 19b and Table 7).
Comparing the total retained soil accumulated up-stream by the ideal cropping systems with the
reported sediment yield in each reservoir offered a non-monetary assessment of the benefits. We found
that targeting strategies RIOS&C-S (budgets $10 and $16.4 million) and RIOS (budget $34.5 million)
retained up-stream during the whole dam’s life span, the equivalent to two years of the current
sediment yield in Angostura’s dam (1.5millions∙t∙y∙r-1, Table 4 and 7). The same targeting strategies
119
retained up-stream what is the equivalent amount to 7, 15 and 17 years, respectively, of the annual
sediment yield (1.1millions∙t∙y∙r-1, Table 4) in Cachi’s dam.
5. Discussion
Our application of InVEST and RIOS tools to assess the provisioning of the soil retention ES is an
initial attempt to better assess the role of agroecosystems as ES providers in Costa Rica. Our results
indicate that targeting efforts to implement ideal cropping systems (combination of at least two or
three soil conservation practices) on erosive crops or crops on steep slopes will likely provide the
highest cost-effectiveness investment scenario, or in other words, the highest soil retention per dollar
spent. Under this particular targeting strategy, investments in ideal cropping systems may be more cost
effective than dredging sediment from the downstream reservoirs, given our modeling assumptions.
5.1. Role of agroecosystems as ES providers
The Costa Rican PES scheme is becoming more supported by local ES consumers such as hydropower
companies, industry, tourisms among others (Pagiola et al., 2008; Blackman & Woodward, 2010).
These consumers may demand a higher provision of ES at this local scale such as water quality.
Improving water quality will require the provision of ES not only from the forested areas or spread
trees but also from a proper agroecosystem management and planning.
ICE previous efforts in the upper-middle Reventazon watershed such as raising awareness, trainings,
nurseries to foment agroforestry and technological transfer (i.e. vermicomposting or biodigestors)
improved in agricultural lands the management of natural resources (Sims & Sinclair, 2008). Still, the
benefits of those efforts in terms of the reduction of sediment loads and pollution in the reservoirs are
marginal (PREVEDA, 2008). Marginal benefits on reducing sediment yield may be due to a poor
monitoring strategy of the on-site and off-site effects of the efforts, to a spatiotemporal lag (e.g.
Fremier et al., 2013) or to a low budget allocation. Low budget allocation ($1.5 million) in our
120
analysis indicates low rate of ES provisioning (less than 2% increase on soil reduction) regardless the
targeting strategy. Yet, these investments might be profitable by the hydropower company as they not
only reduce soil transport into the reservoir, but also for public relations. When considering higher
investments, the amount of soil retained by investments in ideal cropping systems using the RIOS&CS method might be enough to make investments more cost effective than remediating the effects of
dredging (e.g. implementation and maintenance cost $16.4millions versus estimated dredging cots
$23.3millions; Figure 4). Investments in soil conservation practices might also extend dam life span,
which is one of the most critical concerns of hydropower companies with high sedimentation rates
(Haun et al., 2013).
5.2. Targeting strategies
The majority of ES are spatially explicit as well as the pressure or threats (e.g. deforestation, soil
erosion) to ecosystems and the services they provide. Targeting efforts, incentive or policy based,
rather than “first-come first-served” guarantees the additionality and efficiency of the efforts (Robalino
& Pfaff, 2013; Pfaff & Robalino, 2012; Wünscher et al., 2008). The Costa Rican PES scheme
prioritizes PES for agroforestry systems based on land use capability (FONAFIFO, 2014), similarly to
our RIOS&Legislation targeting strategy yet less aggressive at targeting erosive lands. However, our
results indicate that targeting efforts to increase the provision of the ES soil retention on erosive crops
and crops on steep slopes (> 23%) (RIOS&C-S) potentially will yield the highest benefits per dollar
invested. Particularly, with the medium and larger budgets we tested for this targeting strategy ($10 or
$16.4 million). Another advantage of the RIOS&C-S targeting strategy is that both, the slope steepness
and cover management factors, are verifiable on the field. Using verifiable factors on the field to
determine participation criteria in the PES scheme may add a sense of fairness to the program
(Vignola et al., 2010) and decrease negative behavioral spillovers (Alpízar et al., 2013) such as
reducing current voluntary implementation of conservation practices or reducing aversion to
participate.
121
We tested three targeting strategies using an empirically based approach, USLE, to quantify the
provisioning of the soil retention ES. Our modeling strategy, offers a simple but robust and
conservative first approximation to a methodology that can be adapted and modeled iteratively to
assess the potential contribution that changes in agroecosystems management has on providing ES.
This first approximation also contributes to move beyond the assumption that spread trees will provide
the demanded hydrological services by local consumers and contributes to improve spatial planning,
one of the weaknesses of the Costa Rican PES scheme (Robalino & Pfaff, 2013). Also, this modeling
exercise offers an opportunity to quantify the approximate benefits of investing on provisioning ES
and, particularly private sector, may get more engage with more clear and direct benefits (Ruckelshaus
et al., 2012). Higher engagement of the private sector in conservation is currently an important
challenge in agricultural landscape planning across Latin America and the Caribbean (EstradaCarmona et al., 2014). Future efforts with more complete available data may include more
comprehensive hydrological and calibrated models to assess hydrological services (e.g. GómezDelgado et al., 2011).
6. Conclusion
Our results indicate that the cost of implementing ideal cropping systems (combination of at least two
or three soil conservation practices) is potentially similar or cheaper than dredging. Particularly, we
estimated that the highest soil retention per dollar spent is obtained by targeting efforts on erosive
crops (C factor >0.4) or crops (C factor > 0.07) on steep lands (>23%) using medium budget
allocations such as ~$10-20 millions. Low budget allocations yielded marginal benefits providing an
increase of soil retention ES lower than 3%. However, all targeting strategies extended the life span of
the dams by reducing sediment yields in the reservoirs, given our modeling assumptions. Our
estimation of the provisioning of the soil retention ES due to changes in agroecosystem management is
an empirical-based and conservative methodology that can be adapted and modeled iteratively to
improve PES spatial planning in agroecosystems. Our methodology may also improve private or
122
industry sector long-term and strong engagement with more clear and direct benefits of their
investments. Future research should incorporate transaction cost and explore other strategies to boost
the voluntary implementation of ideal cropping systems through training, experimental farms or
farmer scientist.
123
7. References
Abreu, H.M. 1994. Adoption of soil conservation in Tierra Blanca, Costa Rica. In Lutz E, Pagiola S,
Reiche C. 1994. Economic and institutional analysis of the soil conservation projects in Central
America and the Caribbean. World Bank Development paper No. 8, Washington DC, USA. 207
pp.
Alegre, J. C., & Rat, M. R. (1996). Soil and water conservation by contour hedging in the humid
tropics of Peru. Agriculture, Ecosystems and Environment, (57), 17–25.
Alpízar, F., Nordén, A., Pfaff, A., & Robalino, J. (2013). Effects of Exclusion from a Conservation
Policy : Negative Behavioral Spillovers from Targeted Incentives (p. 29). Retrieved from
http://sites.nicholasinstitute.duke.edu/environmentaleconomics/files/2013/11/WP-EE-13-06-Pfaffet-al._full-pdf.pdf
Altieri, M. a. (2002). Agroecology: the science of natural resource management for poor farmers in
marginal environments. Agriculture, Ecosystems & Environment, 93(1-3), 1–24.
doi:10.1016/S0167-8809(02)00085-3
Bhattarai, R., & Dutta, D. (2006). Estimation of Soil Erosion and Sediment Yield Using GIS at
Catchment Scale. Water Resources Management, 21(10), 1635–1647. doi:10.1007/s11269-0069118-z
Blackman, A., & Woodward, R. T. (2010). User financing in a national payments for environmental
services program: Costa Rican hydropower. Ecological Economics, 69(8), 1626–1638.
doi:10.1016/j.ecolecon.2010.03.004
Brandt, S. A., & Swenning, J. (1999). Sedimentological and geomorphological effects of reservoir
flushing: The Cahí reservoir, Costa Rica. Geografiska Annaler, 81, 391–407.
Bravo-Ureta, B. E., Solís, D., Cocchi, H., & Quiroga, R. E. (2006). The impact of soil conservation
and output diversification on farm income in Central American hillside farming. Agricultural
Economics, 35, 267–276.
Brenes, C. (2009). Análisis multitemporal de cambio de uso de suelo y dinámica del paisaje en el
Corredor Biológico Volcánica Central Talamanca, Costa Rica. CATIE.
CADETI. (2004). Programa de Acción Nacional de Lucha contra la Degradación de Tierras en Costa
Rica (2 ed., p. 122). San Jose, Costa Rica: Comisión Asesora sobre Degradación de Tierras
(CADETI) y Ministerio del Ambiente y Energía (MINAE).
Cocchi, H., & Bravo-ureta, B. E. (2007). On-site cost and benefits of soil conservation among hillside
farmers in El Salvador (p. 45). Washington, D.C. Retrieved from
http://ove/oveIntranet/DefaultNoCache.aspx?Action=WUCPublications@ImpactEvaluations
Comerford, N. B., Franzluebbers, A. J., Stromberger, M. E., Morris, L., Markewitz, D., & Moore, R.
(2013). Assessment and Evaluation of Soil Ecosystem Services. Soil Horizons, 54(3), 1–14.
doi:10.2136/sh12-10-0028
Comisión para el Ordenamiento y Manejo de la Cuenca Alta del Río Reventazón (COMCURE). 2009.
Manual Técnico de Incentivos. Retrieved from: http://comcure.go.cr/nosotros/normativa
124
Declerck, F. A. J., Fanzo, J., Palm, C., & Remans, R. (2011). Ecological approaches to human
nutrition. Food and Nutrition Bulletin, 32(1), S41–S50.
Desmet, P., and G. Govers (1996) A GIS procedure for automatically calculating the USLE LS factor
on topographically complex landscape units. Journal of Soil and Water Conservation, vol. 51, no.
5, pp. 427-433.
Dogliotti, S., García, M. C., Peluffo, S., Dieste, J. P., Pedemonte, A. J., Bacigalupe, G. F., … Rossing,
W. a. H. (2013). Co-innovation of family farm systems: A systems approach to sustainable
agriculture. Agricultural Systems. doi:10.1016/j.agsy.2013.02.009
Echeverría-Sáenz, S., Mena, F., Pinnock, M., Ruepert, C., Solano, K., Cruz, E. de la, … Barata, C.
(2012). Environmental hazards of pesticides from pineapple crop production in the Río Jiménez
watershed ( Caribbean Coast , Costa Rica ). Science of the Total Environment, 440, 106–114.
Estrada-Carmona, N., Harper, H., Declerck, F. A. J., & Fremier, A. In review. Global sensitivity
analysis of RUSLE illustrates importance of cover management across environments in predicting
soil erosion rates. Geomorphology.
Estrada-Carmona, N., Hart, A. K., DeClerck, F. A. J., Harvey, C. A., & Milder, J. C. (2014). Integrated
landscape management for agriculture, rural livelihoods, and ecosystem conservation: An
assessment of experience from Latin America and the Caribbean. Landscape and Urban Planning,
129, 1–11. doi:10.1016/j.landurbplan.2014.05.001
FAO. (1989). Evaluación de los estados de la erosión hídrica de los suelos en Costa Rica (Assessment
of soil erosion by water in Costa Rica). Informe técnico Nº2. Programa de cooperación FAO/Italia.
Roma.
FAO. (2000). Manual on integrated soil management and conservation practices (1st ed., p. 228).
Rome, Italy: Food and Agriculture Organization of the United Nationas. Retrieved from
ftp://ftp.fao.org/agl/agll/docs/lw8e.pdf
FAO. (2001). Lessons learned and farmer-to-farmer transfer of technologies (p. 86). FAO. Retrieved
from ftp://ftp.fao.org/agl/agll/docs/sb76e.pdf
FAO. (2013). Statistical Yearbook: World food and agriculture (p. 307). Roma, Italia.
Fondo Nacional de Financiamiento Forestal (FONAFIFO). 2014. Estadísticas del Pago por Servicios
Ambientales. Retrieved from: http://www.fonafifo.go.cr/psa/estadisticas_psa.html
Fremier, A. K., Declerck, F., Bosque-Pérez, N., Estrada-Carmona, N., Hill, R., Joyal, T., … Wulfhorst,
J. D. (2013). Understanding spatiotemporal lags in ecosystem services to improve incentives.
BioScience, 63(6), 472–482. doi:10.1525/bio.2013.63.6.9
Gaffer, R. L., Flanagan, D. C., Denight, M. L., & Engel, B. A. (2008). Geographical information
system erosion assessment at a military training site. Journal of Soil and Water Conservation,
63(1), 1–10. doi:10.2489/63.1.1
Garbach, K., Lubell, M., & DeClerck, F. A. J. (2012). Payment for Ecosystem Services: The roles of
positive incentives and information sharing in stimulating adoption of silvopastoral conservation
practices. Agriculture, Ecosystems & Environment, 156, 27–36. doi:10.1016/j.agee.2012.04.017
125
Garrick, D., McCann, L., & Pannell, D. J. (2013). Transaction costs and environmental policy: Taking
stock, looking forward. Ecological Economics, 88, 182–184. doi:10.1016/j.ecolecon.2012.12.022
Gómez Delgado, F. (2002). Evaluación de la erosión potencial y producción de sedimentos en tres
cuencas de Costa Rica (Assessment of the potential erosion and sediment production in three
Costa Rican watersheds). Costa Rican University.
Gómez-Delgado, F., Roupsard, O., le Maire, G., Taugourdeau, S., Pérez, A., van Oijen, M., …
Moussa, R. (2011). Modelling the hydrological behaviour of a coffee agroforestry basin in Costa
Rica. Hydrology and Earth System Sciences, 15(1), 369–392. doi:10.5194/hess-15-369-2011
Hall, C.A.S, Levitan, L., & Schlichter, T. 2000. Land, energy and agricultural production in Costa
Rica. In: Quantifying Sustainable Development, The future of tropical economics. (eds) Hall,
C.A.S. Academic Press. San Diego, CA. 121-156.
Harvey, C. A, Medina, A., Sánchez, D. M., Vílchez, S., Hernández, B., Saenz, J. C., … Sinclair, F. L.
(2006). Patterns of animal diversity in different forms of tree cover in agricultural landscapes.
Ecological Applications, 16(5), 1986–1999. Retrieved from http://www.jstor.org/stable/40061768
Haun, S., Kjærås, H., Løvfall, S., & Olsen, N. R. B. (2013). Three-dimensional measurements and
numerical modelling of suspended sediments in a hydropower reservoir. Journal of Hydrology,
479, 180–188. doi:10.1016/j.jhydrol.2012.11.060
Holt-Giménez, E. (2002). Measuring farmers’ agroecological resistance after Hurricane Mitch in
Nicaragua: a case study in participatory, sustainable land management impact monitoring.
Agriculture, Ecosystems & Environment, 93(1-3), 87–105. doi:10.1016/S0167-8809(02)00006-3
Imbach P, 2006. Modelo de Elevación Digital (Digital Elevation Model). Grupo Cambio Global
CATIE
Jiménez-Ramírez, O., Rodríguez-Mesa, C. R., & Olsen, N. (2004). Sedimentación del embalse del p.h.
angostura, estudios y experiencias. In 9th International Symposium on River Sedimentation (Vol.
2). Yichang, China.
Lal, R. (2001). Soil degradation by erosion. Land Degradation & Development, 12(6), 519–539.
doi:10.1002/ldr.472
Lenka, N. K., Dass, A., Sudhishri, S., & Patnaik, U. S. (2012). Soil carbon sequestration and erosion
control potential of hedgerows and grass filter strips in sloping agricultural lands of eastern India.
Agriculture, Ecosystems & Environment, 158, 31–40. doi:10.1016/j.agee.2012.05.017
Maetens, W., Poesen, J., & Vanmaercke, M. (2012). How effective are soil conservation techniques in
reducing plot runoff and soil loss in Europe and the Mediterranean? Earth-Science Reviews,
115(1-2), 21–36. doi:10.1016/j.earscirev.2012.08.003
Marchamalo, M. (2004). Ordenación del territorio para la producción de servicios ambientales
hídricos. Aplicación a la cuenca del Río Birrís, Costa Rica. (Territory management for
hydrological environmental services. An application to the Birris basin, Costa Rica). Universidad
Politecnica de Madrid.
126
Martínez-Salinas, M.A. & DeClerck, F. (2010). The role of Agroecosystems and forests in the
conservation of birds within biological corridors. Mesoamericana 14(3). Retrieved from
http://biblioteca.catie.ac.cr:5151/repositoriomap/bitstream/123456789/127/3/224.pdf
Ministerio de Medio Ambiente y Energía (MINAE), 2002. GEO Costa Rica: una perspectiva sobre el
medio ambiente. Observatorio de Desarrollo de la Universidad de Costa Rica, San Jose, 162 pp
Pagiola, S. (2008). Payments for environmental services in Costa Rica. Ecological Economics, 65(4),
712–724. doi:10.1016/j.ecolecon.2007.07.033
Pagiola, S., Agostini, P., Gobbi, J., de Haan, C., Ibrahim, M., Murgueitio, E., … Ruíz, J. P. (2005).
Paying for Biodiversity Conservation Services. Mountain Research and Development, 25(3), 206–
211. doi:10.1659/0276-4741(2005)025[0206:PFBCS]2.0.CO;2
PASOLAC. (2000). Guía téctica de conservación de suelos y agua (1st ed., p. 205). San Salvador, El
Salvador: Programa para la Agricultura Sostenible en Laderas de América Central, PASOLAC.
Pedroni, L. (2003). Improved classification of Landsat Thematic Mapper data using modified prior
probabilities in large and complex landscapes. International Journal of Remote Sensing, 24(1), 91–
113. doi:10.1080/01431160110115005
Perfecto, I., Vandermeer, J., & Paradigm, A. N. C. (2008). Biodiversity conservation in tropical
agroecosystems: a new conservation paradigm. Annals of the New York Academy of Sciences,
1134, 173–200. doi:10.1196/annals.1439.011
Pfaff, A., & Robalino, J. (2012). Protecting forests, biodiversity, and the climate: predicting policy
impact to improve policy choice. Oxford Review of Economic Policy, 28(1), 164–179.
doi:10.1093/oxrep/grs012
PREVDA. (2008). Plan de cuenca del Río Reventazón - Parismina (p. 196). San Jose, Costa Rica.
ProDUS. (2011). Base teórica para la construcción de planes reguladores en la cuenca alta y media del
Río Reventazón (No. Tomo II) (p. 312). San José, Costa Rica.
Ramírez, L., Alvarado, A., Pujol, R., & Brenes, L. G. (2008). Caracterización física de la cuenca media
del río Reventado, Cartago, Costa Rica. Agronomía Costarricense, 32(2), 73–92.
Raudes, M., & Sagastume, N. (2009). Manual de Conservación de Suelos. Programa para la
Agricultura Sostenible en Laderas de América Central (p. 75). El Zamorano, Honduras.
Robalino, J., & Pfaff, A. (2013). Ecopayments and Deforestation in Costa Rica : A Nationwide
Analysis of PSA ’ s Initial Years. Land Economics, 89(3), 432–448.
Robalino, J., Pfaff, A., Sánchez-azofeifa, G. A., Alpízar, F., León, C., & Rodríguez, C. M. (2008).
Environment for Development Deforestation Impacts of Environmental Services Payments,
(August).
Rubin, B. D. & Hyman, G. G. 2000. Soil erosion’s economic impacts on Costa Rica. In: Quantifying
Sustainable Development, The future of tropical economics. (eds) Hall, C.A.S. Academic Press.
San Diego, CA. 121-156.
127
Ruckelshaus, M., McKenzie, E., Tallis, H., Guerry, A., Daily, G., Kareiva, P., … Bernhardt, J. (2013).
Notes from the field: Lessons learned from using ecosystem service approaches to inform realworld decisions. Ecological Economics. doi:10.1016/j.ecolecon.2013.07.009
Sharp, R., Tallis, H. T., Ricketts, T., Guerry, A. D., Wood, S. A., Chaplin-Kramer, R., … Hamel, P.
(2013). InVEST tip User’s Guide (p. 324). Palo Alto, CA. Retrieved from http://ncpdev.stanford.edu/~dataportal/nightly-build/release_tip/release_tip/InVEST_tip_Documentation.pdf
Sims, L., & Sinclair, a. J. (2008). Learning Through Participatory Resource Management Programs:
Case Studies From Costa Rica. Adult Education Quarterly, 58(2), 151–168.
doi:10.1177/0741713607309802
Vignola, R., Koellner, T., Scholz, R. W., & McDaniels, T. L. (2010). Decision-making by farmers
regarding ecosystem services: Factors affecting soil conservation efforts in Costa Rica. Land Use
Policy, 27(4), 1132–1142. doi:10.1016/j.landusepol.2010.03.003
Vignola, R., McDaniels, T. L., & Scholz, R. W. (2012). Negotiation analysis for mechanisms to deliver
ecosystem services: The case of soil conservation in Costa Rica. Ecological Economics, 75, 22–
31. doi:10.1016/j.ecolecon.2012.01.004
Vignola, R., McDaniels, T. L., & Scholz, R. W. (2013). Governance structures for ecosystem-based
adaptation: Using policy-network analysis to identify key organizations for bridging information
across scales and policy areas. Environmental Science & Policy, 31, 71–84.
doi:10.1016/j.envsci.2013.03.004
Vignola, R., Otárola, M., & Calvo, G. (2008). Defining ecosystem-based adaptation strategies for
hydropower production: stakeholders’ participation in developing and evaluating alternative land
use scenarios and the strategies to achieve desired goals. In C. Marínez-Alonso, B. Locatelli, R.
Vignola, & P. Imbach (Eds.), Seminario Internacional sobre Adaptación al Cambio Climático: el
Rol de los Servicios Ecosistémicos (SIAASE (pp. 68–79). Turrialba, Costa Rica: Serie técnica.
Manual técnico / CATIE ; no. 99.
Vogl, A., Tallis, H., Douglass, J., Sharp, R., Veiga, F., Benitez, S., … Sebastián Lozano, J. (2013).
Resource Investment Optimization System ( RIOS ). Palo Alto, CA. Retrieved from http://ncpdev.stanford.edu/~dataportal/rios_releases/RIOSGuide_Combined_8-22-13.pdf
Wischmeier, W. H., & Smith, D. D. (1978). Predicting rainfall erosion lossess a guide to conservation
planning. 1978. Washington, D.C.
WOCAT. (2012). Desire for Greener Land. Options for sustainable land management in drylands. (G.
Schwilch, R. Hessel, & S. Verzandvoort, Eds.). Bern, Switzerland and Wageningen, The
Netherlands: SRIC - World Soil Information and CTA - Technical Centre for Agricultural and
Rural Cooperation. Retrieved from
https://www.wocat.net/fileadmin/user_upload/documents/Books/DESIRE_BOOK_low_resolution.
pdf
Wünscher, T., Engel, S., & Wunder, S. (2008). Spatial targeting of payments for environmental
services: A tool for boosting conservation benefits. Ecological Economics, 65(4), 822–833.
doi:10.1016/j.ecolecon.2007.11.014
128
APPENDIX A
Internet Search Terms (in English, Spanish and Portuguese)
129
Terms (English)
1. Agrobiodiversity
2. Agroecology
3. Agroforestry
4. Biological corridor
5. Buffer zone
6. Community-based forest management
7. Community-based natural resource management
8. Conservation agriculture
9. Food security and conservation
10. Initiative
11. Integrated landscape management
12. Integrated management
13. Integrated watershed management
14. Landscape initiative
15. Landscape management
16. Landscapes and livelihoods
17. Livelihoods
18. Multi-stakeholder
19. Natural resource management
20. Participatory
21. Program
22. Project
23. Socio-ecological
24. Territorial development
25. Territorial management
26. Territory
Plus names of each of the countries in Latin America and the Caribbean (23 Countries).
130
APPENDIX B
Survey to assess Integrated Landscape Management for agriculture, rural Livelihoods, and ecosystem
conservation in Latin America and The Caribbean.
131
132
133
134
135
136
137
138
139
140
141
142
143
144
145
146
147
148
149
APPENDIX C
Interview to assess Integrated Landscape Management for agriculture, rural Livelihoods, and
ecosystem conservation in Latin America and The Caribbean
150
NOTAS SOBRE LA ENTREVISTA DEL TIER 2
LOGISTICA
Verifique que la conexión entre el skype y el callnote está activa. Este segura de comenzar la
grabación antes de llamar.
Leer las respuestas del TIER 1 para estar un poco contextualizada con la iniciativa
Antes de llamar verifique cuáles pregunta le hará al entrevistado
ESTRUCTURA ENCUESTA
Las preguntas están divididas con base en los HECHOS o las INTERPRETACIONES, y con base en
quién/cuántos entrevistados deben responder las preguntas. Estas clasificaciones tienen los siguientes
significados:
HECHOS –básicamente preguntan sobre una información objetiva (basada en hechos) que debe ser
verificable independientemente. Cualquier entrevistado(a) bien informado(a) debe proveer
básicamente la misma respuesta para cuestiones basadas en HECHOS. Así, no es necesario preguntar
cuestiones de HECHOS para todos(as) los(as) entrevistados(as).
INTERPRETATIVA – la pregunta incluye un elemento de subjetividad, interpretación y percepción
personal. Inclusive donde existe una realidad objetiva (e.g., que tan efectiva ha sido una iniciativa con
relación a indicadores variados), diferentes personas pueden tener percepciones distintas de esa
realidad. Cuando estamos interesados en entender esas diferentes percepciones, es cuando hacemos las
preguntas INTERPRETATIVAS.
SOLO 1 – la entrevistadora debe preguntar la pregunta a solamente un(a) entrevistado(a), él(la) cual
se considera ser él(la) mayor conocedor(a) del asunto en cuestión. Las preguntas SOLO1 son basadas
en HECHOS, y una vez que obtenemos la información necesaria, no hay necesidad de hacer la
pregunta a otras personas.
TRIANGULAR – la entrevistadora debe hacer la pregunta a cuantos(as) entrevistados(as) crea
necesario para establecer una respuesta confiable. Preguntas TRIANGULARES generalmente son
preguntas basadas en HECHOS, en relación a las cuales es posible que algunos(as) entrevistados(as)
no tengan la información completa o precisa y entonces nos podrían proveer una respuesta engañosa.
La entrevistadora debe empezar haciendo la pregunta al primer entrevistado(a) que se considere
conocedor del asunto. Si hay duda respecto a la confiabilidad de la respuesta, la entrevistadora debe
continuar haciendo la pregunta a entrevistados(as) adicionales hasta que ella esté satisfecha y con
información consistente y precisa.
PREGUNTE A TODOS(AS) – esas son generalmente preguntas INTERPRETATIVAS cuyo objetivo
es comprender cómo distintos actores perciben la iniciativa y sus resultados. Tales cuestiones deben
ser hechas a todos(as) los(as) entrevistados(as).
Objetivo: cerca de 15 preguntas; no más que 20
Tamaño de la muestra (# de paisajes): seleccionar 12-14 paisajes de alta prioridad que estamos seguros
de incluir, además de 6-8 adicionales que intentaremos incluir si tenemos tiempo.
Intensidad de la muestra (# de entrevistados por paisaje): mínimo de 4, máximo de 6.
Entrevistados(as) deben representar distintos sectores, niveles y perspectivas. Debe haber al menos
alguna representación del sector de conservación y del sector de agricultura. Entrevistados(as) deben
incluir al menos una organización local, una representación rural o de comunidades, y, cuando aplique,
un actor externo (donante, organización nacional o internacional, etc.) para cada iniciativa.
La mayoría, si no la totalidad, de los entrevistados(as) deben tener una perspectiva de todo el paisaje.
No queremos respuestas que sean informadas solamente por el conocimiento del entrevistado(a)
respecto a su finca o pueblo. Una posible excepción es cuando algunos actores ubicados en
comunidades estén familiarizados principalmente con un área local, pero no con todo el paisaje. Esto
está OK en la medida que sus perspectivas parezcan temáticamente anchas (i.e., consciente de las
cuestiones de agricultura, medios de vida y conservación, además de las instituciones, políticas y
estrategias relacionadas a ellas).
151
Presentación nuevo contacto en el TIER 2
Introducción: Actualmente Amigos de la Ecoagricultura en asocio con el CATIE estamos llevando a
cabo una sistematización o búsqueda de experiencias de ecoagricultura en América Latina. La
finalidad de este estudio es conocer y aprender sobre el contexto o bajo qué condiciones de dan este
tipo de manejo de integral de paisajes. Nosotros definimos una iniciativa de ecoagricultura como
aquella iniciativa que busca al mismo tiempo mejorar la producción agropecuaria, la conservación de
los recursos naturales, la calidad y medio de vida de las comunidades y la gobernanza o
empoderamiento de las comunidades sobre sus RN a una escala de paisaje.
Descripción proyecto: La primera etapa del proyecto consistió en contactar a las personas líderes o
personas contacto de un conjunto de iniciativas, proyectos o programas que buscamos a través del
internet. En el caso del [INICIATIVA] contactamos al Sr. / Sra. [NOMBRE CONTACTO], al cual le
solicitamos su colaboración con el llenado de una encuesta. Después de analizar las encuetas que
fueron diligenciadas, seleccionamos unas iniciativas las cuales estamos interesados en conocer más
detalladamente. Para lograr esto queremos entrevistar a varios actores o líderes claves en el paisaje que
han venido trabajando con la iniciativa [INICIATIVA] y tienen un buen conocimiento del paisaje. Lo
estamos contactando porque [NOMBRE CONTACTO] nos indicó que usted nos podría colaborar.
La entrevista: La entrevista que le vamos a hacer, dura aproximadamente una hora. En esta entrevista
le haremos preguntas sobre el paisaje donde se encuentra ubicada la iniciativa [INICIATIVA], sobre la
iniciativa misma, la participación de diferentes actores o grupos en la iniciativa, las instituciones y la
gestión de la iniciativa, políticas y gobernanza, y finalmente sobre las inversiones y los logros de la
misma. No dude en interrumpirme o preguntarme si alguna pregunta o concepto no es claro. Algunas
veces usamos terminología que es muy específica y que puede ser confusa, así que por favor no dude
en preguntarme. De igual manera si no tiene conocimiento o información para responder alguna
pregunta no hay ningún problema y solo pasamos a la siguiente pregunta.
Antes de comenzar me gustaría agradecerle de antemano por su tiempo y colaboración, y también me
gustaría saber si tiene alguna duda o comentario.
Presentación contacto del TIER 1
De antemano le agradezco por su colaboración y participación, en días anteriores estuvimos revisando
y analizando las diferentes encuestas que fueron llenadas por las diferentes iniciativas en América
Latina, y seleccionamos la iniciativa [XXXX] para conocerla más detalladamente.
En esta segunda etapa de nuestra búsqueda de iniciativas ecoagrícolas, nos gustaría poder entrevistar a
varios actores o líderes del paisaje que tiene buen conocimiento sobre la iniciativa y que ha estado
involucrado con la iniciativa durante un buen tiempo. Lo ideal sería si me puede brindar los nombres y
teléfonos de otras 5 o 6 personas que usted considera pueden participar en la entrevista y que han
estado trabajando en los diferentes componentes como el agropecuario, conservación, calidad de vida
de las comunidades, gobernanza, educación, etc. y/o que hace parte de organizaciones locales,
gobiernos, ONG, universidades, etc. [ANOTAR CONTACTOS].
La entrevista:
La entrevista durará aproximadamente una hora y cubriremos temas similares a la encuesta que ya
diligenció pero en más detalle. No dude en interrumpirme o preguntarme si alguna pregunta o
concepto no es claro. Algunas veces usamos terminología que es muy específica y que puede ser
confusa, así que por favor no dude en preguntarme. De igual manera si no tiene conocimiento o
información para responder alguna pregunta no hay ningún problema y solo pasamos a la siguiente
pregunta.
152
Antes de comenzar me gustaría agradecerle de antemano por su tiempo y colaboración, y también me
gustaría saber si tiene alguna duda o comentario.
153
SECCION 1: INFORMACIÓN SOBRE LA PERSONA ENTREVISTADA
Por favor, provea la siguiente información básica sobre usted mismo y su papel en el paisaje y/o en
la iniciativa de paisaje.
*Primer nombre:
Segundo nombre:
*Apellidos:
*Dirección correo electrónico:
*Nombre de su organización:
Teléfono (Por favor incluir el código del país - región):
*Su posición o cargo dentro de la organización:
¿Cuál es su papel en el paisaje o en la iniciativa de paisaje? (por favor describa):
154
SECCION 2: INFORMACIÓN SOBRE EL PAISAJE
POR FAVOR USE EL CUADRO PARA INGRESAR LA INFORMACIÓN ¿? 2.1, 2.11.
ESTE SEGURA QUE INDICA LA IMPORTANCIA. 1: más importante, 4: menos
importante
En orden de importancia, cuáles son las cuatro sectores económicos (p.e. agropecuario, forestal,
pesquero, turismo, extracción, industria y otros) más importantes en el paisaje?
(HECHOS/TRIANGULAR)
Si la agricultura es mencionada, por favor clasifique si es:
Sector
Pequeña escala
Subsisten Comercial
cia
Mercad Mercados
os
internacion
locales / ales /
nacional Exportació
es
n
Mediana escala
Comercial
Gran escala
Comercial
Mercad
os
locales /
nacional
es
Mercad
os
locales /
nacional
es
Mercados
internacion
ales /
Exportació
n
Mercados
internacion
ales /
Exportació
n
Agropecua
rio
Forestal
Pesca
Turismo
Extracción
Industria
Otro:
Otro:
Es posible que varias de esas categorías agrícolas sean prioritarias
POR FAVOR USE EL CUADRO PARA INGRESAR LA INFORMACIÓN ¿? 2.2, 2.2.1.
ESTE SEGURA QUE INDICA LA IMPORTANCIA. 1: más importante, 4: menos importante
En orden de importancia, cuáles son los cultivos u otros productos agropecuarios / forestales más
importantes en el paisaje?
(HECHOS / ¿? SOLO A 1)
Nota entrevistador: Esto puede incluir cultivos, ganadería, fibras, cultivos para biocombustible, otros
productos maderables y no maderables, etc.
Se debe especificar el cultivo o el producto, por ejemplo, maíz, banano, café, leche, puercos, teca o
piscícolas.
“Más importantes” en términos de su contribución económica (para el caso de cultivos orientados a
mercados) o contribución para suplir los mercados locales (para el caso de los cultivos de
subsistencia)
Cuál es el mercado principal o usos para cada uno de esos cinco cultivos o productos:
(HECHOS / ¿? SOLO A 1)
p.e cultivos (cuáles?), ganadería, fibras,
Subsistencia
Mercados
Mercados
cultivos para biocombustible, otros productos
locales /
internacionales /
maderables y no maderables, etc.
nacionales
Exportación
Prod1:
155
Prod2:
Prod3:
Prod4:
Prod5:
Cuál es el tipo de tenencia de la tierra más común en el paisaje?
(HECHOS / ¿? SOLO A 3)
Nota entrevistador: La meta es entender los principales tipos de propiedad y tenencia de la tierra en
el paisaje.
Ejemplos de las categorías de tenencia
Solo las más importantes: abarcan más del 1020% del paisaje
a) tierras públicas o del estado
b) tierras comunales
c) propiedad privada manejada por los
propietarios
d) propiedad privada manejada por compañías
e) propiedad privada aprovechada o manejada por
arrendatarios
Otro:
Otro:
Cómo considera usted que el paisaje donde se encuentra la iniciativa es definido o delimitado
geográficamente?
(INTERPRETATIVA / ¿? TODOS) aclarar
Nota entrevistador: De pronto es necesario hacer la misma pregunta de diferentes maneras para
garantizar que el entrevistado la entienda. Básicamente queremos saber cómo el entrevistado ve la
extensión geográfica del paisaje, y cómo ésta es delimitada. La pregunta NO pretende preguntar sobre
el proceso de delineación del paisaje.
Queremos saber si el entrevistado piensa que los límites corresponden a:
Jurisdicciones (p.e. villas, municipalidades, cantones)
Límite legal (p.e. áreas protegidas y sus zonas de amortiguamiento)
Cuencas
Río, lago, divisoria de aguas, u otro elemento geográfico mayor
Ecosistema (p.e. un humedal grande)
Rango de una o más especies de interés para la conservación
Límite cultural o grupo étnico
Un problema que debía ser resuelto
Usaron otro criterio? Cuál?
Otro:
Otro:
Si
No
Los límites originales del paisaje han cambiado? Cómo y por qué?
(INTERPRETATIVA/ ¿? TODOS)
Hubo eventos (naturales, políticos, sociales, económicos, conflictos) que afectaron el paisaje y
generaron cambios importantes en los últimos 25 años. Por favor, mencionar los más importantes.
156
(INTERPRETATIVA/ ¿? TODOS)
Nota entrevistador: Esta debe ser una pregunta abierta. Queremos saber si hay un entendimiento
común del paisaje y sus dinámicas. La pregunta también debe revelar algunos de los retos que la
iniciativa pretende resolver. Si el entrevistado necesita o quiere ayuda para entender la pregunta, se
pueden dar algunos ejemplos de cambios importantes, como los cambios mayores en el uso de la
tierra o las actividades económicas (p.e. deforestación, nuevas plantaciones), conflictos/guerras, e
importantes designaciones de tierras como áreas protegidas.
SECCION 3: INFORMACIÓN SOBRE LA INICIATIVA
Cuáles fueron los retos principales o problemas que motivaron la creación de la iniciativa de paisaje?
(INTERPRETATIVA/ ¿? TODOS)
Nota entrevistador: Hacer como pregunta abierta. Esperamos que en algunos casos habrá un reto o
un problema principal, mientras que en otros casos habrán más. Queremos que el entrevistado
identifique los retos/problemas más importantes - no una lista inservible. Si se ve que el entrevistado
se esta desviando, hacerlo que mencione máximo tres o cuatro de los retos claves.
1)
2)
3)
4)
Cuáles cree usted son los objetivos más importantes de la iniciativa?
(INTERPRETATIVA/ ¿? TODOS)
Nota entrevistador: De nuevo, puede haber solo un objetivo o varios. Si el entrevistado piensa que
hubo varios objetivos, déjelo listarlos y anótelos. Pero asegúrese al final que tiene claro los tres o
cuatro objetivos más importantes, ya que se preguntará más adelante sobre la efectividad de la
iniciativa en relación a esos objetivos.
1)
2)
3)
4)
Cuáles fueron las 3 o 4 actividades o inversiones principales de la iniciativa?
(INTERPRETATIVA/ ¿? TODOS)
Nota entrevistador: Queremos obtener dos cosas de esta pregunta.
La primera, es entender qué hizo la iniciativa y si esto incluyó un conjunto de actividades
“balanceadas” para alcanzar los múltiples objetivos de la iniciativa. Por lo tanto, la pregunta debe
ser abierta para dejar que la persona mencione las 3 o 4 principales actividades, inversiones, o
intervenciones, a pesar del sector u objetivo en la que esta caiga.
Lo Segundo, es entender si la iniciativa realmente incluyó actividades relacionadas a la agricultura
(cultivos/ganado), conservación, medios de vidas rurales, y fortalecimiento institucional - inclusive si
el entrevistado no identifica estas en las tres o cuatro actividades. Por lo tanto, si las tres o cuatro
actividades no incluyen las actividades o inversiones relacionadas a las categorías, hacer la siguiente
pregunta.
1)
2)
3)
4)
157
La iniciativa incluyó alguna actividad relacionada con X?
(INTERPRETATIVA/ ¿? SI ES NECESARIO)
Nota entrevistador: X puede ser agricultura (cultivos/ganado), conservación, medios de vidas rurales,
y fortalecimiento institucional, si no fue mencionada en las tres o cuatro más importantes.
Cuáles fueron las principales fuentes de financiamiento para las actividades o componentes?
(HECHOS / TRIANGULAR)
Nota entrevistador: Esta pregunta debe ser hecha varias veces, una para cada una de las tres o
cuatro actividades o inversiones que fueron mencionadas en la pregunta 3.3.
Actividades mencionadas 3.3 y
3.3.1
apoyo local en especie / directo
(p.e. plantación árboles,
terrazas hechas por los
finqueros o grupos
comunitarios, esfuerzos de los
trabajadores de los gobiernos)
apoyo externo (p.e. donante o
fondos del gobierno)
SECCION 4: PARTICIPACIÓN EN LA INICIATIVA
Cuáles fueron los principales grupos involucrados en el diseño de la iniciativa? Cuál fue el papel de
cada uno de estos grupos?
(INTERPRETATIVA/ ¿? TODOS)
Nota entrevistador: Esta es una pregunta abierta. Estamos interesados en ver si los entrevistados
identifican los grupos locales y externos, y cuáles sectores son considerados los más influyentes. Los
grupos pueden ser. Los entrevistados puede que mencionen varios grupos de actores del paisaje, como
grupos que no son actores del paisaje pero que están involucrados en el
financiamiento/desarrollo/facilitación de la iniciativa.
Grupos (p.e organizaciones
locales/comunitarias, gobiernos
locales, gobiernos
regionales/nacionales, sociedad
civil, sector privado, donantes,
organizaciones internacionales,
academia u otros)
Papel
Externo o local
158
Grupos (p.e organizaciones
locales/comunitarias, gobiernos
locales, gobiernos
regionales/nacionales, sociedad
civil, sector privado, donantes,
organizaciones internacionales,
academia u otros)
Papel
Externo o local
Se involucraron los grupos marginados del paisaje en el diseño de la iniciativa?
(INTERPRETATIVA/ ¿? TODOS SI NO SALIÖ EN LA PREGUNTA 4.1, sino obviar)
Nota entrevistador: “Grupos marginalizados” puede incluir minorías étnicas, campesinos sin tierra y
mujeres. De todas maneras, sin definir el término, le permitimos al entrevistado interpretar la
pregunta basado en los grupos que él piensa son marginalizados dentro del paisaje.
Se involucraron a los pequeños productores o las asociaciones de productores [nota entrevistador:
incluir si aplica a los gestores forestales de pequeña escala] del paisaje en el diseño de la iniciativa?
(INTERPRETATIVA/ ¿? TODOS SINO SALIO EN LA PREGUNTA 4.1)
Se involucraron a los grandes productores o agronegocios [nota entrevistador: incluir si aplica a los
gestores forestales de gran escala] del paisaje en el diseño de la iniciativa?
(INTERPRETATIVA/ ¿? TODOS SINO SALIO EN LA PREGUNTA 4.1)
Considera que se debió incluir algún grupo de actores en el diseño de la iniciativa y que no fue
incluido? Cuáles grupos?
(INTERPRETATIVA/ ¿? TODOS)
Cuáles fueron los principales grupos involucrados en la implementación de la iniciativa? Cuál fue el
papel de cada uno de estos grupos?
(INTERPRETATIVA/ ¿? TODOS)
Nota entrevistador: Esta es una pregunta abierta. Estamos interesados en ver si los entrevistados
identifican los grupos locales y externos, y cuáles sectores son considerados los más influyentes. Los
entrevistados puede que mencionen varios grupos de actores del paisaje, como grupos que no son
actores del paisaje pero que están involucrados en el financiamiento/desarrollo/facilitación de la
iniciativa.
Grupos (p.e organizaciones
Papel
Externo o local
locales/comunitarias, gobiernos
locales, gobiernos
159
regionales/nacionales, sociedad
civil, sector privado, donantes,
organizaciones internacionales,
academia u otros)
Se involucraron los grupos marginados del paisaje en la implementación de la iniciativa?
(INTERPRETATIVA/ ¿? TODOS SINO SALIO EN LA PREGUNTA 4.2)
Nota entrevistador: s. Preguntar sin definir el término “marginado”, le permitimos al entrevistado
interpretar la pregunta basado en los grupos que él piensa son marginado dentro del paisaje. Si el
entrevistado no entiende el concepto o se desvía, dar ejemplos: “Grupos marginados” puede incluir
minorías étnicas, campesinos sin tierra y mujeres
Se involucraron a los pequeños productores o las asociaciones de productores [nota entrevistador:
incluir si aplica a los gestores forestales de pequeña escala] del paisaje en la implementación de la
iniciativa?
(INTERPRETATIVA/ ¿? TODOS SINO SALIO EN LA PREGUNTA 4.2)
Se involucraron a los grandes productores o agronegocios [nota entrevistador: incluir si aplica a los
gestores forestales de gran escala] del paisaje en la implementación de la iniciativa?
(INTERPRETATIVA/ ¿? TODOS SINO SALIO EN LA PREGUNTA 4.2)
Considera que se debió incluir algún grupo de actores en la implementación de la iniciativa y que no
fue incluido? Cuáles grupos?
(INTERPRETATIVA/ ¿? TODOS)
160
SECCION 5: INSTITUCIONES Y GESTION DE LA INICIATIVA
Al comienzo de la iniciativa existían grupos en el paisaje que estaban liderando o facilitando
actividades para apoyar el manejo integrado del paisaje (p.e. evaluaciones de paisaje, planeación,
procesos multi-actores, etc)? Si fue así, cuáles fueron esos grupos y qué estaban haciendo?
(HECHOS/ TRIANGULACIÓN)
Grupos que existían
aspectos técnicos( p.e.
que tipo de información,
datos, o análisis fueron
usados para hacer la
evaluación del paisaje)
aspectos sobre el proceso (p.e. cómo los grupos
fueron ayudados para guiar o construir las
decisiones sobre el manejo del paisaje, quién
estuvo involucrado en el procesos de toma de
decisiones, y si el proceso fue más tecnocrático o
participativo)
En el transcurso de la iniciativa se crearon nuevos grupos para liderar o facilitar las actividades del
manejo integrado del paisaje?, o fueron grupos existentes que antes no cumplían estas funciones pero
que después de la iniciativa tomaron este papel?. Si fue así, cuáles fueron esos grupos y qué hacen?
(HECHOS/ TRIANGULACIÓN)
Grupos creados
aspectos técnicos( p.e.
que tipo de información,
datos, o análisis fueron
usados para hacer la
evaluación del paisaje)
aspectos sobre el proceso (p.e. cómo los grupos
fueron ayudados para guiar o construir las
decisiones sobre el manejo del paisaje, quién
estuvo involucrado en el procesos de toma de
decisiones, y si el proceso fue mas tecnocrático o
participativo)
Como son financiados los nuevos o existentes grupos? El financiamiento tiene un tiempo limitado o es
contínuo?
(HECHOS/ TRIANGULACIÓN)
SECCION 6: POLÍTICAS Y GOBERNANZA
Nota entrevistador: Provea una breve transición “Ahora, me gustaría preguntarle sobre el papel de las
políticas apoyando o limitando el desarrollo de la iniciativa”.
Hubo algunas políticas públicas, leyes, o procedimientos que fueron especialmente útiles para apoyar e
incentivar desarrollo de la iniciativa?
161
(INTERPRETATIVA/ TRIANGULACIÓN)
Nota entrevistador: Acá estamos preguntando específicamente sobre las políticas que apoyaron el
proceso integrado o participativo del manejo del paisaje. Por lo tanto, eso puede incluir políticas de
descentralización, políticas que reconocen a las entidades locales como administradores de los
recursos, procesos a nivel regional para la planeación de los usos de la tierra o desarrollo territorial,
etc. NO estamos preguntado a los entrevistadores que identifiquen las políticas que tienen el propósito
de incrementar la compatibilidad entre la agricultura y el ambiente, o apoyar paisajes
multifuncionales como los pagos por servicios ambientales, leyes para la protección ambiental, etc.
Hubo alguna política pública, ley o procedimiento que especialmente obstaculizó el desarrollo de la
iniciativa?
(INTERPRETATIVA/ TRIANGULACIÓN)
Nota entrevistador: Similar a la pregunta anterior, acá estamos preguntando específicamente sobre
las políticas que inhibieron el proceso integrado o participativo del manejo del paisaje. Por lo tanto,
esta puede incluir estructuras de gobierno que fallaron en devolver el poder a las autoridades locales
o entidades administradoras de los recursos naturales. De nuevo, NO estamos preguntando al
entrevistado identificar las políticas relacionadas a la agricultura y el ambiente, p.e subsidios
perversos a la agricultura.
La iniciativa resultó en algún cambio importante en la política o gobernanza en relación a uso tierra, el
manejo de los recursos naturales, o la regulación de actividades económicas? Si fue así, por favor
describa según su percepción los cambios más importantes y explique como la iniciativa lo logró.
(HECHOS/ TRIANGULACIÓN)
Nota entrevistador: Similar a las preguntas 6.1 y 6.2, cuál es el contexto político para el proceso del
manejo integrado del paisaje, acá se pregunta sobre el nivel en que la iniciativa incluyó el cambio de
políticas como una estrategia para alcanzar los paisajes integrales y multifuncionales. Por lo tanto, si
la iniciativa resultó en nuevas leyes de protección ambiental, subsidios o incentivos para la
agricultura sostenible, etc., esos pueden ser mencionados. Igualmente estamos interesados en
aprender sobre nuevos sistemas de gobernanza o políticas, por lo tanto cambios en la tierra o
tenencia de la tierra, procesos de toma de decisiones, nuevas entidades de gobernanzas como
mancomunidades, etc.
Hay algunos cambios adicionales en las políticas o gobernanza que usted considera se deberían de
crear o implementar para apoyar los objetivos de la iniciativa?
(INTERPRETATIVA/ TRIANGULACIÓN)
SECCION 7: RESULTADOS Y EFECTIVIDAD DE LA INICIATIVA
Al comienzo de la conversación, usted identificó tres [O la cantidad que mencionó en la pregunta 3.2]
objetivos de la iniciativa de paisaje. Ahora nos gustaría conocer su opinión sobre la efectividad de la
iniciativa en alcanzar cada objetivo. Me gustaría preguntarle en una escala del 1 al 7 cual fue el nivel
de efectividad de cada objetivo, siendo. Luego me gustaría conocer por que les dio esa calificación
(indicadores y/o resultado de la iniciaitva. Vamos a comenzar con el primer objetivo [mencionarlos].
(INTERPRETATIVA/ ¿? TODOS)
Objetivo (ver ¿? 3.2) Nivel efectividad (7
cuando se logró
totalmente el objetivo, 4
Por qué / cómo les asignó ese valor? Usó
indicadores o percepción?. (trate de comprobar si
los resultados son claramente atribuibles
162
cuando se logró
parcialmente y 1 cuando
no hubo ningún
progreso)
propiamente a la iniciativa)
4)
Que tan efectiva ha sido la iniciativa reuniendo a los diferentes actores para incrementar la
cooperación y resolver los conflictos para alcanzar los múltiples objetivos en el paisaje?
(INTERPRETATIVA/ ¿? TODOS)
Nota entrevistador: Esta es una pregunta abierta. Buscamos entender de igual manera la parte
exitosa y no exitosa del proceso del manejo del paisaje con múltiples actores. Queremos conocer si la
iniciativa ayudó a incrementar la coordinación y colaboración entre sectores (p.e. agricultura,
forestal, agua, salud) y a diferentes escalas (p.e. finca, villas, distritos, cuenca, región)
Me gustaría preguntarle sobre los beneficios e inconvenientes de trabajar a escala de paisaje. De qué
manera el enfoque de paisaje de la iniciativa ayudó a los actores a entender y a abordar mejor
diferentes temáticas, problemas y retos en el paisaje? [Pausa para la persona responder, continuar con:]
De qué manera el enfoque de paisaje dificultó el logro de objetivos claves?
(INTERPRETATIVA/ ¿? TODOS)
Nota entrevistador: Estamos tratando de entender si el enfoque de manejo integral de paisajes (p.e.
reuniendo personas de diferentes sectores y en diferentes escalas) ayuda a los actores a encontrar un
sentido común entre los diferentes intereses, o áreas de negociación de discordia o conflicto?.
Igualmente queremos entender si el enfoque de paisaje pudo haber distraído la atención de puntos
claves locales, si este enfoque es considerado irrelevante por algunos actores que están más
preocupados por asuntos sectoriales o locales, o si el enfoque de paisaje creó problemas muy grandes
o complejos de resolver.
Finalmente, me gustaría preguntarle sobre el impacto de la iniciativa en algunos grupos comunitarios
en el paisaje. Me podría decir si la iniciativa benefició, no tuvo ningún efecto, o perjudicó a cada uno
de los siguientes grupos? [Omitir los que no aplican para paisaje]
(INTERPRETATIVA/ ¿? TODOS)
Grupos
Benefici No tuvo
Perjudi
ó
ningún efecto có
Pequeños productores y/o ganaderos
Medianos productores y/o ganaderos
Grandes productores y/o ganaderos beneficio
Personas sin tierra (p.e como los trabajadores de las fincas,
arrendatarios, “parceros”, “tala y quema”)
Comerciantes e industriales agropecuarios.
Responsables / administradores del bosque
Comunidades nativas dependientes del bosque
163
Grupos
Benefici No tuvo
ó
ningún efecto
Perjudi
có
Mujeres.
Comunidades viviendo en los pueblos y/o ciudades (no
involucradas con la agricultura / forestería).
Más ricos:
Más pobres:
Otros:
SECCION 8: LECCIONES APRENDIDAS Y REFLEXÓN GENERAL
Finalmente, nos gustaría solicitarle reflexionar críticamente sobre la iniciativa y compartir algunas
de las lecciones que usted aprendió, y pensamientos sobre cómo las iniciativas de paisaje, como la
actual, pueden ser más efectivas en el futuro.
Cuál fue el aspecto más exitoso de la iniciativa?
(INTERPRETATIVA/ ¿? TODOS, menos al que llenó la encuesta del TIER 1)
Cuál fue el aspecto menos exitoso de la iniciativa?
(INTERPRETATIVA/ ¿? TODOS, menos al que llenó la encuesta del TIER 1)
Si tuviera más plata para diseñar e implementar esta iniciativa qué haría diferente?
(INTERPRETATIVA/ ¿? TODOS, menos al que llenó la encuesta del TIER 1)
Realizaría un monitoreo y control más eficientes
De acuerdo a su experiencia, qué consejo le daría a sus colegas que están comenzando una iniciativa
de paisaje?
(INTERPRETATIVA/ ¿? TODOS)
Nota entrevistador: Esta pregunta está hecha para combinar las dos preguntas anteriores en términos
de las lecciones aprendidas y los aspectos de la iniciativa que son replicables en cualquier lugar. Si el
entrevistado no parece responder la pregunta de esta manera, siéntase libre de redirigirlo.
[Termine agradeciendo a la persona por su participación y déjele saber que recibirá una copia del
estudio cuando éste termine]
164
APPENDIX D
Description of each factor and its parameters, including the maximum values, minimum values and
equations used to create the theoretical dataset. HB: handbook·
165
RUSLE (S=C•R•K•L•S) (tonf•acre-1•year-1)*
Factors / Parameters
Max
Min Equations / Max and min values sources
Cover - Management factor C (dimensionless)
C factor
1
0 C= PLU•CC•SC•S
PLU (Prior Land Use)
1
0 PLU=Cf•Cb•EXP[(-Cur•Bur)+(Cus•Bus/Cf^Cuf)]
Cf: surface soil consolidation
1
0.05 "The value of Cf for freshly tilled conditions is 1. If
factor (decay exponentially
the soil is left undisturbed, this value decays
when soil is left undisturbed)
exponentially to 0.45 over 7 yr, or over some other
length of time specified by the user". HB 703
Bur: Mass density of live and
1,750
345 Based on the RUSLE2 CROP dataset and HB 703
dead roots found in the upper
tables
inch of soil ( lbacre-1in-1)
Bus: mass density of
1,700
0 Based on the RUSLE2 CROP dataset and HB 703
incorporate surface residue in
tables
the upper inch of soil (lbacre1 -1
in )
Cuf: impact of soil
0.5 Describe the relative effectiveness of subsurface
consolidation on the relative
biomass in reducing erosion. The values were
effectiveness of incorporated
calibrated using information from Van Liew and
residue
Saxton (1983), values from table 5 and 5d in
Cb: relative effectiveness of
0.951 Agricultural Handbook 537 (Wischmeier and Smith,
subsurface residue in
1978), and an extensive data set collected from a
consolidation
broad series of no-till experiments. hb 703
Cur: calibration coefficient
0.00398 0.00199
indicating the impacts of the
subsurface residues (acre in
lb-1)
Cus: calibration coefficient
0.000832 0.00042
indicating the impacts of the
subsurface residues (acre in
lb-1)
CC (Canopy cover)
1
0 CC= 1-Fc•exp(-0.1•H)
Fc: Fraction of land surface
1
0.05 HB 703
covered by canopy
H: distance that rain drops fall
33
0.5 Data based on the listed crops on the HB 703
after striking the canopy (ft)
SC (Surface cover)
SC=exp[-b•Sp•(0.24/Ru)^0.08]
b: empirical coefficient.
0.07
0.024 Extreme values from the different b values reported
indicate the effectiveness of
by several authors: Laflen et al., (1980) and Laflen
surface cover in reducing soil
and Colvin (1981) b=0.030 to 0.070 for row crops;
loss
Dickey et al., (1983) b=0.024-0.032 for small
grains; b>0.05 small grains in northwestern wheat
and range region; Simanton et al., (1984) b= 0.039
for rangeland. HB 703
Sp: Percentage of land area
100
0.1 HB 703
covered by surface cover
(crop residue, rocks,
cryotogams and other no
erodible material that is in
direct contact with the soil
surface
166
Ru: surface roughness in in
1.9
0.25
From table 5-5 in HB 703, In Figure 4-3 it is
indicated that a Ru =4 indicate more roughness than
from most primarily tillage operations. It is kept the
value of 2 because Wischmeier and Smith (1978)
affirms that the USLE equation estimate accurately
soil loss for consistent cropping and management
systems that have been represented in the erosion
plot studies
SR (Surface roughness)
1
0.9 SR=exp[-0.66(Ru-0.24)]
Rainfall-runoff erosive factor R (100 foot•tonf•inch•acre-1 •hour-1•year-1)**
R factor
R = ∑(j=1 to j=n)E•I30
I30 (in/hr): Erosive rain
3.00
0.50 The limit of 3in/h is because median drop size does
Intensity
not continue to increase when intensities exceed this
threshold (Carter et al., 1974). The limit for rain
showers less than 0.5in and separated from other
rain periods by more than 6 h are omitted, because
these light rains are usually too small for practical
significance and that, collectively, they have little
effect on the distribution of the annual EI or erosion.
Also reduce time consuming processing EI. HB 703
E (100ft tonf acre-1 in-1):
10.81
6.80 E = (1099•(1-0.72•EXP(-1.27•I)))/100
Kinematic Energy
j (no storm / yr): No events
50.00
5.00 HB 703
per year
Soil - erodibility factor K (tonf•acre•hour•100-1acre-1 foot-1 tonf-1 inch-1)***
K factor
K= [2.1•〖10〗^(-4) (12-OM) M^1.14+3.25• (s2)+2.5• (p-3) ]/100
OM%: Organic matter
4.00
- Based on the nomograph HB 537
Clay% (<0.002 mm)
40.00
10.00
Silt% (0.002 - 0.1 mm)
70.00
10.00 Based on the nomograph HB 537
Sand% (0.1 - 2 mm)
70.00
10.00 Based on the nomograph HB 537
p: Permeability
5
2 Wischmeier and Smith (1978) affirms that the
s: Structure class
4
1 USLE equation estimate accurately soil loss “for
medium – textured soil”
M
M=(%Silt +%Very fine sand)(100-%Clay);
Topographic factor (dimensionless)
Slope length
L= (λ/72.6)^m
Slope steepness
10
2 S= IF(θ<5, (10.8•sinθ+0.03), (16.8•sinθ-0.5))
θ: slope angle in degrees
λ: Slope length (ft).
400
10 Soil runoff will usually concentrate in less than
Horizontal projection
400ft, which is a practical slope length limit in
many situations, although longer slope lengths of up
to 1,000 ft are occasionally found. The equation for
S can’t be applied to slopes shorter than 15 ft
m: a variable slope length
0.44
0.17 m=β/(1+β)
exponent
β: ratio of rill erosion to inter0.80
0.21 β=(sinθ/0.0896)/[3•(sinθ)^0.8+0.56]
rill erosion
*Conversion to SI system: 2.242 metric ton•ha-1•yr-1
**Conversion to SI system: 17.02 megajoule•millimeter•ha-1•hour-1•year-1
*** Conversion to SI system: 0.1317 metric ton•ha•hour•ha-1•megajoule-1•millimeter-1
167
APPENDIX E
Description of the selected soil conservation practices in terms on the mechanism to retain soil, pros
and cons, and factors that limit the efficacy of the practices.
Efficacy reduced by
Cons
Pros
Mechanism
168
Mulch
Cover crops
Hedgerow
Mitigates the impact of the The root system offers resistance Reduce Runoff, promotes
rain drops, reduction soil to the overland flow (Edwards & deposition and water
detachment and increase Burney, 2005)
infiltration
water infiltration
Also, offers same protection as
(Donjadee & Chinnarasri, Mulch
2012).
Agroforestry
Mitigates the impact of the
rain drops, protect soil and
return nutrients via litter or
mulch material
Deep roots favors water
infiltration and reduce
runoff (Niemeyer et al.,
2013)
Reduce soil loss and
Incorporate organic matter and
Facilitates terraces formation More profitable than
runoff (Adekalu, Okunade, nutrients to the soil (Edwards &
through time (Lin et al.,
conventional agriculture
& Osunbitan, 2006)
Burney, 2005)
2009)
(Neupane & Thapa, 2001)
Mulch may form dams and Prevent nutrient loss (RuizProvides fodder for
Deep-rooted trees reduce
build up hollows which
Colmenero, Bienes, & Marques, ruminants, mulch or grains the environmental risk by
delays the afterflow
2011)
(Angima et al., 2002; Dinh et NO3-N pollution and
(Döring et al., 2005)
May form positive associations
al., 2014)
increased water retention
Finer mulch texture cover with crops providing key nutrients Increase crop yields due to capacity of subsurface soil
higher land with not to
and improving main crop yield
the control of soil loss and
(Wang, Zhang, Lin, & Zepp,
moderate effects on soil (i,e, total N content) (Armecin et the improvement of soil bulk 2011)
moisture nor crop yield
al, 2005)
density, gravimetric moisture
(Döring et al., 2005)
Protect soils from extreme climatic content and infiltration
Improves soil moisture,
fluctuations, improves soil
parameters (Oshunsanya,
moderate soil thermal
aggregates (Armecin et al., 2005) 2013)
regime, improves soil
In the long-run it facilitates water Increase soil organic matter,
aeration, promotes
infiltration, increases soil organic total nitrogen and total
biological activity,
carbon and aggregate stability,
phosphorus contents (Bu et
improves soil structure,
(Ruiz-Colmenero et al., 2013)
al., 2009)
add organic matter and
Result in higher macrofauna
nutrients, reduction N loss density and biomass, higher
(Acharya, Hati, &
density of facultative
Bandyopadhyay, 2005)
phytophagous, bacterial-feeding
and predatory nematodes, and
lower density of obligatory
(Blanchart et al., 2006)
Helps to solve weed management
(Erenstein, 2003)
Low levels of mulch may Competition with the main crop
After long periods the
Lower trunk biomass and
have no effect on weeds, for water and nutrients may
portions below of the plant slower tree growth due to
weed cover and above
reduction main crop yields ( Ruiz- hedgerows can also suffer
competition with crops
ground biomass of weeds Colmenero, Bienes, & Marques, severe erosion (Chaowen et during establishment (Ong
(Döring et al., 2005)
2011)
al., 2007)
et al., 2000)
If poor planned it can
Can compete with main crop Superficial roots and high
affect sowing or tillage,
for nutrients and light (Dinh demand for water affect
increase diseases or pest,
et al., 2014; Oshunsanya,
crop yields (Ong et al.,
and limit seedling
2013),
2000)
emergence (Acharya, Hati,
Cutting cost to avoid crop
Bandyopadhyay, 2004)
competition increase farm
labor (Kinama et al., 2007)
Slope gradient, soil type, Quantity and quality of biomass
Low tillering ability and low Insecure land tenure, land
mulch type and dominant (Edwards & Burney, 2005)
root densities (Rodriguez,
fragmentation, poor
soil process (Smets,
Cover type ( Ruiz-Colmenero,
1997; Xiao et al., 2011; Xiao extension service, limited
Poesen, & Knapen, 2008) Bienes, & Marques, 2011)
et al., 2012)
technical know-how, and
Dislodged by wind or
Insecure land tenure, need of short- Steeper slopes and higher
unavailability of planting
frequent runoff (Edwards term outcomes (Erenstein, 2003) rainfall intensities (Xiao, et materials (Neupane &
& Burney, 2005)
al., 2011)
Thapa, 2001)
Tillage technologies (Thapa, Mulch with poor nutrients
Cassel, & Garrity, 1999)
quality and complex
decomposition patterns
(Heineman et al., 1997)
169
References
Acharya, C. L., Hati, K. M., & Bandyopadhyay, K. K. (2005). How Mulching Influences the Soil
Environment. In D. Hillel, C. Rosenzweig, D. Powlson, K. Scow, M. Singer, & D. Sparks (Eds.),
Encyclopedia of soils in the environment (1st ed., pp. 521–532). New York, NY: Academic Press.
Adekalu, K. O., Okunade, D. a., & Osunbitan, J. a. (2006). Compaction and mulching effects on soil
loss and runoff from two southwestern Nigeria agricultural soils. Geoderma, 137(1-2), 226–230.
doi:10.1016/j.geoderma.2006.08.012
Angima, S. D., Stott, D. E., O’Neill, M. K., Ong, C. K., & Weesies, G. a. (2002). Use of calliandra–
Napier grass contour hedges to control erosion in central Kenya. Agriculture, Ecosystems &
Environment, 91(1-3), 15–23. doi:10.1016/S0167-8809(01)00268-7
Armecin, R. B., Seco, M. H. P., Caintic, P. S., & Milleza, E. J. M. (2005). Effect of leguminous cover
crops on the growth and yield of abaca (Musa textilis Nee). Industrial Crops and Products, 21(3),
317–323. doi:10.1016/j.indcrop.2004.04.028
Blanchart, E., Villenave, C., Viallatoux, a., Barthès, B., Girardin, C., Azontonde, a., & Feller, C.
(2006). Long-term effect of a legume cover crop (Mucuna pruriens var. utilis) on the communities
of soil macrofauna and nematofauna, under maize cultivation, in southern Benin. European
Journal of Soil Biology, 42, S136–S144. doi:10.1016/j.ejsobi.2006.07.018
Bu, C., Cai, Q., Ng, S., Chau, K., & Ding, S. (2009). Effects of hedgerows on sediment erosion in
Three Gorges Dam Area , China. International Journal of Sediment Research, 23(2), 119–129.
Chaowen, L., Shihua, T., Jingjing, H., & Yibing, C. (2007). Effects of plant hedgerows on soil erosion
and soil fertility on sloping farmland in the purple soil area. Acta Ecologica Sinica, 27(6), 2191–
2198. doi:10.1016/S1872-2032(07)60050-X
Dinh, V., Hilger, T., Macdonald, L., Clemens, G., Shiraishi, E., Duc, T., … Cadisch, G. (2014). Field
Crops Research Mitigation potential of soil conservation in maize cropping on steep slopes. Field
Crops Research, 156, 91–102. doi:http://dx.doi.org/10.1016/j.fcr.2013.11.002
Donjadee, S., & Chinnarasri, C. (2012). Effects of rainfall intensity and slope gradient on the
application of vetiver grass mulch in soil and water conservation. International Journal of
Sediment Research, 27(2), 168–177. doi:10.1016/S1001-6279(12)60025-0
Döring, T. F., Brandt, M., Heß, J., Finckh, M. R., & Saucke, H. (2005). Effects of straw mulch on soil
nitrate dynamics, weeds, yield and soil erosion in organically grown potatoes. Field Crops
Research, 94(2-3), 238–249. doi:10.1016/j.fcr.2005.01.006
Edwards, L., & Burney, J. (2005). Cover crops. In D. Hillel, J. Hatfield, D. S. Powlson, C.
Rosenzweig, K. M. Scow, M. J. Singer, & D. L. Sparks (Eds.), Encyclopedia of soils in the
environment (1st ed., p. 592). New York, USA: Elsevier.
Erenstein, O. (2003). Smallholder conservation farming in the tropics and sub-tropics: a guide to the
development and dissemination of mulching with crop residues and cover crops. Agriculture,
Ecosystems & Environment, 100(1), 17–37. doi:10.1016/S0167-8809(03)00150-6
Heineman, A. ., Otieno, H. J. ., Mengich, E. ., & Amadalo, B. . (1997). Growth and yield of eight
agroforestry tree species in line plantings in Western Kenya and their effect on maize yields and
170
soil properties. Forest Ecology and Management, 91(1), 103–135. doi:10.1016/S03781127(96)03885-6
Kinama, J. M., Stigter, C. J., Ong, C. K., Ng’ang'a, J. K., & Gichuki, F. N. (2007). Contour Hedgerows
and Grass Strips in Erosion and Runoff Control on Sloping Land in Semi-Arid Kenya. Arid Land
Research and Management, 21(1), 1–19. doi:10.1080/15324980601074545
Lin, C., Tu, S., Huang, J., & Chen, Y. (2009). The effect of plant hedgerows on the spatial distribution
of soil erosion and soil fertility on sloping farmland in the purple-soil area of China. Soil and
Tillage Research, 105(2), 307–312. doi:10.1016/j.still.2009.01.001
Neupane, R. P., & Thapa, G. B. (2001). Impact of agroforestry intervention on soil fertility and farm
income under the subsistence farming system of the middle hills, Nepal. Agriculture, Ecosystems
& Environment, 84(2), 157–167. doi:10.1016/S0167-8809(00)00203-6
Niemeyer, R. J., Fremier, A. K., Heinse, R., Chávez, W., & Declerck, F. A. J. (2013). Woody
Vegetation Increases Saturated Hydraulic Conductivity in Dry Tropical Nicaragua. Vadose Zone
Journal, 13(1), 11. doi:10.2136/vzj2013.01.0025
Ong, C. K., Black, C. R., Wallace, J. S., Khan, A. A. H., Lott, J. E., Jackson, N. A., … Smith, D. M.
(2000). Productivity , microclimate and water use in Grevillea robusta -based agroforestry systems
on hillslopes in semi-arid Kenya. Agriculture, Ecosystems and Environment, 80, 121–141.
Oshunsanya, S. O. (2013). Spacing effects of vetiver grass (Vetiveria nigritana Stapf) hedgerows on
soil accumulation and yields of maize–cassava intercropping system in Southwest Nigeria. Catena,
104, 120–126. doi:10.1016/j.catena.2012.10.019
Rodriguez, O. S. P. (1997). Hedgerows and mulch as soil conservation measures evaluated under field
simulated rainfall. Soil Technology, 11, 79–93.
Ruiz-Colmenero, M., Bienes, R., Eldridge, D. J., & Marques, M. J. (2013). Vegetation cover reduces
erosion and enhances soil organic carbon in a vineyard in the central Spain. Catena, 104, 153–160.
doi:10.1016/j.catena.2012.11.007
Ruiz-Colmenero, M., Bienes, R., & Marques, M. J. (2011). Soil and water conservation dilemmas
associated with the use of green cover in steep vineyards. Soil and Tillage Research, 117, 211–
223. doi:10.1016/j.still.2011.10.004
Smets, T., Poesen, J., & Knapen, a. (2008). Spatial scale effects on the effectiveness of organic
mulches in reducing soil erosion by water. Earth-Science Reviews, 89(1-2), 1–12.
doi:10.1016/j.earscirev.2008.04.001
Thapa, B. B., Cassel, D. K., & Garrity, D. P. (1999). Ridge tillage and contour natural grass barrier
strips reduce tillage erosion $. Soil and Tillage Research, 51, 341–356.
Wang, Y., Zhang, B., Lin, L., & Zepp, H. (2011). Agroforestry system reduces subsurface lateral flow
and nitrate loss in Jiangxi Province, China. Agriculture, Ecosystems & Environment, 140(3-4),
441–453. doi:10.1016/j.agee.2011.01.007
171
Xiao, B., Wang, Q., Wang, H., Dai, Q., & Wu, J. (2011). The effects of narrow grass hedges on soil
and water loss on sloping lands with alfalfa (Medicago sativa L.) in Northern China. Geoderma,
167-168, 91–102. doi:10.1016/j.geoderma.2011.09.010
Xiao, B., Wang, Q., Wang, H., Wu, J., & Yu, D. (2012). The effects of grass hedges and micro-basins
on reducing soil and water loss in temperate regions: A case study of Northern China. Soil and
Tillage Research, 122, 22–35. doi:10.1016/j.still.2012.02.006
172
APPENDIX F
Establishment and maintenance cost for the selected soil conservation practices. Some cost varies
depending the slope steepness (gentle <15%, moderate 15-30%, steep >15%). Cost are established at
pixel level (900m2).WD: Working days
173
Establishment
WD*
Seeds (kg)
Maintenance (y)
WD
Total
Establishment
WD
Seeds (kg)****
Maintenance (y)
WD
Total
Qty
4.4
10.0
<15%, 60 lineal m
$
Total ($/ha)
18.0
79.1
5.0
50.0
1.1
18.0
19.8
148.8
Agroforestry high density
277 trees**
Qty
$
Total ($/ha)
13.1 18.0
235.7
0.06 96.0
6.7
13.1
18.0
235.7
462.2
Mulch
<15%
$
Total ($/ha)
18.0
153.1
Hedgerow
15-30%, 90lineal m
>15%, 180lineal m
Qty
$ Total ($/ha) Qty
$
Total ($/ha)
8.0
18.0
143.8
14.0 18.0
251.6
18.2
5.0
90.9
31.8 5.0
159.1
2.0
18.0
35.9
3.5
270.6
Agroforestry low density
62 trees***
Qty
$ Total ($/ha)
3.2
18.0
57.7
0.01
87.0
1.4
3.2
18.0
18.0
62.9
473.6
57.7
116.7
Cover crops
>15%
Qty
$ Total ($/ha)
4.3
18.0
76.5
51.6
5.0
258.1
Qty
Establishment
WD
8.5
Seeds (kg)
Animal (day)
1.4 20.0
28.4
Maintenance (y)
WD
7.1 18.0
127.6
7.1
18.0
127.6
Total
309.1
462.2
* Minimum wage in Costa Rica for 2014 is Ȼ8944.51 according to the Ministry of labor and Social Security
(http://www.mtss.go.cr/images/stories/Lista_salarios-2014-1semestre.pdf). We used the average value reported in
Oanda to convert it from Costa Rica currency to US dollar (Ȼ497.677=$1).
**Highest tree density usually associated to pastures. Density reported in the agroforestry guideline of the Costa
Rican national office (http://onfcr.org/media/uploads/documents/guia_saf_onf_para_web.pdf).
*** Rainforest Alliance certified coffee farms number of trees in average (http://www.rainforestalliance.org/about/documents/tensie-25anniversary-presentation.pdf)
****One kilogram of mixed seeds of endangered trees species contain in average 19,950 viable seeds per
kilogram.
174
APPENDIX G
Results from the literature review to estimate the soil retention efficacy of each soil conservation
practice we modeled.
175
We conducted a literature review to estimate the soil retention efficacy (SRE) of each
soil conservation practice. A larger numbers of the assessed experiments were conducted at
gentle slopes (Figure 1).
Figure 1. Soil retention efficacy reported by 30 studies and 107 observations
176
We estimated SRE since the reported combinations of soil conservations practices in the reviewed
experiments did not match the combinations of our ideal cropping systems. Also, we consider the high
variability of the reported SRE and decided to choose a conservative method. The estimated SRE is
the sum of the minimum reported SRE for each soil conservation practice in each ideal cropping
system. Ideal cropping systems at slopes higher than 30% should not incorporate mulching practices
but cover crops. We used the average estimated SRE for ideal cropping systems using mulching or
cover crops (i.e. perennial avg =59% ) (Table 1). Reported SRE corresponds to seventeen experiments
also with highly variable results. Table 1 also shows the minimum value reported for the combinations
reported in the reviewed research.
Table 1. Minimum reported and estimated soil retention efficacy (SRE) for coupled soil conservation
practices. Reported soil retention efficacy corresponds to the minimum reported value in seventeen
experiments. Estimated SRE is the sum of the minimum SRE reported for each soil conservation
practice.
Coupled soil conservation practices
Mulch
Cover
crops
Reported SRE
X
X
X
Estimated SRE per ideal cropping system
Perennial
X
X
X
X
Semi-perennial
Pasture
Agroforestry
SRE
X
X
X
26
56
97
20
X
X
X
X
X
X
69
50
69
50
35
35
X
X
Annual
Hedgero
w
X
X
X
X
X
X
X
177
References
Adekalu, K. O., Okunade, D. a., & Osunbitan, J. a. (2006). Compaction and mulching effects on soil
loss and runoff from two southwestern Nigeria agricultural soils. Geoderma, 137(1-2), 226–230.
doi:10.1016/j.geoderma.2006.08.012
Alegre, J. C., & Rat, M. R. (1996). Soil and water conservation by contour hedging in the humid
tropics of Peru. Agriculture, Ecosystems and Environment, (57), 17–25.
Angima, S. D., Stott, D. E., O’Neill, M. K., Ong, C. K., & Weesies, G. a. (2002). Use of calliandra–
Napier grass contour hedges to control erosion in central Kenya. Agriculture, Ecosystems &
Environment, 91(1-3), 15–23. doi:10.1016/S0167-8809(01)00268-7
Bhatt, R., & Khera, K. L. (2006). Effect of tillage and mode of straw mulch application on soil erosion
in the submontaneous tract of Punjab, India. Soil and Tillage Research, 88(1-2), 107–115.
doi:10.1016/j.still.2005.05.004
Blanchart, E., Villenave, C., Viallatoux, a., Barthès, B., Girardin, C., Azontonde, a., & Feller, C.
(2006). Long-term effect of a legume cover crop (Mucuna pruriens var. utilis) on the communities
of soil macrofauna and nematofauna, under maize cultivation, in southern Benin. European
Journal of Soil Biology, 42, S136–S144. doi:10.1016/j.ejsobi.2006.07.018
Bu, C., Cai, Q., Ng, S., Chau, K., & Ding, S. (2009). Effects of hedgerows on sediment erosion in
Three Gorges Dam Area , China. International Journal of Sediment Research, 23(2), 119–129.
Dinh, V., Hilger, T., Macdonald, L., Clemens, G., Shiraishi, E., Duc, T., … Cadisch, G. (2014). Field
Crops Research Mitigation potential of soil conservation in maize cropping on steep slopes. Field
Crops Research, 156, 91–102. doi:http://dx.doi.org/10.1016/j.fcr.2013.11.002
Donjadee, S., & Chinnarasri, C. (2012). Effects of rainfall intensity and slope gradient on the
application of vetiver grass mulch in soil and water conservation. International Journal of
Sediment Research, 27(2), 168–177. doi:10.1016/S1001-6279(12)60025-0
Döring, T. F., Brandt, M., Heß, J., Finckh, M. R., & Saucke, H. (2005). Effects of straw mulch on soil
nitrate dynamics, weeds, yield and soil erosion in organically grown potatoes. Field Crops
Research, 94(2-3), 238–249. doi:10.1016/j.fcr.2005.01.006
FAO. (2000). Manual on integrated soil management and conservation practices (1st ed., p. 228).
Rome, Italy: Food and Agriculture Organization of the United Nationas. Retrieved from
ftp://ftp.fao.org/agl/agll/docs/lw8e.pdf
Gómez, J. a., Guzmán, M. G., Giráldez, J. V., & Fereres, E. (2009). The influence of cover crops and
tillage on water and sediment yield, and on nutrient, and organic matter losses in an olive orchard
on a sandy loam soil. Soil and Tillage Research, 106(1), 137–144. doi:10.1016/j.still.2009.04.008
Guto, S. N., de Ridder, N., Giller, K. E., Pypers, P., & Vanlauwe, B. (2012). Minimum tillage and
vegetative barrier effects on crop yields in relation to soil water content in the Central Kenya
highlands. Field Crops Research, 132, 129–138. doi:10.1016/j.fcr.2011.10.014
Huang, D., Han, J. G., Wu, J. Y., Wang, K., Wu, W. L., Teng, W. J., & Sardo, V. (2010). Grass hedges
for the protection of sloping lands from runoff and soil loss: An example from Northern China.
Soil and Tillage Research, 110(2), 251–256. doi:10.1016/j.still.2010.08.013
178
INIA. (2002). Tecnologías apropiadas para el manejo sustentable de los suelos de la región del Maule.
(E. Varas & J. Riquelme, Eds.) (Serie Acta., p. 146). Villa Alegre, Chile: Instituto de
Investigaciones Agropecuarias, INIA.
Kinama, J. M., Stigter, C. J., Ong, C. K., Ng’ang'a, J. K., & Gichuki, F. N. (2007). Contour Hedgerows
and Grass Strips in Erosion and Runoff Control on Sloping Land in Semi-Arid Kenya. Arid Land
Research and Management, 21(1), 1–19. doi:10.1080/15324980601074545
Lenka, N. K., Dass, A., Sudhishri, S., & Patnaik, U. S. (2012). Soil carbon sequestration and erosion
control potential of hedgerows and grass filter strips in sloping agricultural lands of eastern India.
Agriculture, Ecosystems & Environment, 158, 31–40. doi:10.1016/j.agee.2012.05.017
Li, X.-H., Zhang, Z.-Y., Yang, J., Zhang, G.-H., & Wang, B. (2011). Effects of Bahia Grass Cover and
Mulch on Runoff and Sediment Yield of Sloping Red Soil in Southern China. Pedosphere, 21(2),
238–243. doi:10.1016/S1002-0160(11)60123-9
Lin, C., Tu, S., Huang, J., & Chen, Y. (2009). The effect of plant hedgerows on the spatial distribution
of soil erosion and soil fertility on sloping farmland in the purple-soil area of China. Soil and
Tillage Research, 105(2), 307–312. doi:10.1016/j.still.2009.01.001
Malik, R. K., Green, T. H., Brown, G. F., & Mays, D. (2000). Use of cover crops in short rotation
hardwood plantations to control erosion. Biomass and Bioenergy, 18(6), 479–487.
doi:10.1016/S0961-9534(00)00016-7
Paningbatan, E. P., Ciesiolka, C. a., Coughlan, K. J., & Rose, C. W. (1995). Alley cropping for
managing soil erosion of hilly lands in the Philippines. Soil Technology, 8(3), 193–204.
doi:10.1016/0933-3630(95)00019-4
Pansak, W., Hilger, T., Dercon, G., Kongkaew, T., & Cadisch, G. (2008). Changes in the relationship
between soil erosion and N loss pathways after establishing soil conservation systems in uplands
of Northeast Thailand. Agriculture, Ecosystems & Environment, 128(3), 167–176.
doi:10.1016/j.agee.2008.06.002
Presbitero, A. L., Escalante, M. C., Rose, C. W., Coughlan, K. J., & Ciesiolka, C. A. (1995).
Erodibility evaluation and the effect of land management practices on soil erosion from steep
slopes in Leyte , the Philippines. Soil Technology, 8, 205–213.
Rodriguez, O. S. P. (1997). Hedgerows and mulch as soil conservation measures evaluated under field
simulated rainfall. Soil Technology, 11, 79–93.
Ruiz-Colmenero, M., Bienes, R., & Marques, M. J. (2011). Soil and water conservation dilemmas
associated with the use of green cover in steep vineyards. Soil and Tillage Research, 117, 211–
223. doi:10.1016/j.still.2011.10.004
Ruiz-Colmenero, M., Bienes, R., Eldridge, D. J., & Marques, M. J. (2013). Vegetation cover reduces
erosion and enhances soil organic carbon in a vineyard in the central Spain. Catena, 104, 153–160.
doi:10.1016/j.catena.2012.11.007
Thapa, B. B., Cassel, D. K., & Garrity, D. P. (1999). Ridge tillage and contour natural grass barrier
strips reduce tillage erosion $. Soil and Tillage Research, 51, 341–356.
179
Wang, Y., Zhang, B., Lin, L., & Zepp, H. (2011). Agroforestry system reduces subsurface lateral flow
and nitrate loss in Jiangxi Province, China. Agriculture, Ecosystems & Environment, 140(3-4),
441–453. doi:10.1016/j.agee.2011.01.007
Xiao, B., Wang, Q., Wang, H., Dai, Q., & Wu, J. (2011). The effects of narrow grass hedges on soil
and water loss on sloping lands with alfalfa (Medicago sativa L.) in Northern China. Geoderma,
167-168, 91–102. doi:10.1016/j.geoderma.2011.09.010
Xiao, B., Wang, Q., Wang, H., Wu, J., & Yu, D. (2012). The effects of grass hedges and micro-basins
on reducing soil and water loss in temperate regions: A case study of Northern China. Soil and
Tillage Research, 122, 22–35. doi:10.1016/j.still.2012.02.006
Xiao, B., Wang, Q., Wu, J., Huang, C., & Yu, D. (2010). Protective function of narrow grass hedges on
soil and water loss on sloping croplands in Northern China. Agriculture, Ecosystems &
Environment, 139(4), 653–664. doi:10.1016/j.agee.2010.10.011