1
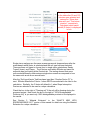
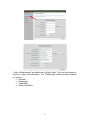
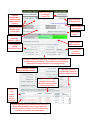
® ErosionWorks Version 9.1 Reference Manual American Excelsior Company 850 Avenue H East Arlington, TX 76011-5067 1-800-777-SOIL March 2009 Table of Contents Introduction------------------------------------------------------------------------- 1 Where to Find Eworks V9.1---------------------------------------------------- 1 Technical Support----------------------------------------------------------------- 2 Conventions Buttons--------------------------------------------------------------------Data Entry Boxes-------------------------------------------------------Drop Down Menus-----------------------------------------------------Check Boxes------------------------------------------------------------- 2 2 2 3 What’s New With ErosionWorks V9.1---------------------------------------Project Information-----------------------------------------------------100% Biodegradable Option-----------------------------------------Material Estimator------------------------------------------------------Desired Product Longevity-------------------------------------------Good, Better, Best Indicator-----------------------------------------Enhanced Report Capabilities--------------------------------------My Reports--------------------------------------------------------------Slope Interruption Devices-------------------------------------------- 3 3 4 5 to 8 9 10 10 11 12 Short Course----------------------------------------------------------------------Main Menu---------------------------------------------------------------Applications Slopes------------------------------------------------------------Channels--------------------------------------------------------Display DOT Approvals------------------------------------------------My Reports----------------------------------------------------------------Logout----------------------------------------------------------------------User Manual--------------------------------------------------------------Unit Systems-------------------------------------------------------------Product Information---------------------------------------------------- - 12 12 13 13 13 to 15 15 15 15 15 to16 17 to 18 Slope Calculations – Background--------------------------------------------RUSLE--------------------------------------------------------------------Average Annual Calculations------------------------------Rainfall Erosivity Factor (R)----------------------Soil Erodibility Factor (K)--------------------------Slope Length and Steepness (LS)--------------Cover Management Factor (C)------------------Support Practice Factor (P)----------------------- 19 19 19 20 20 20 20 21 Single Storm Calculations-----------------------------------Rainfall Erosivity Factor (R)-----------------------Soil Erodibility Factor (K)--------------------------Slope Length and Steepness (LS)--------------Cover Management Factor (C)-------------------Support Practice Factor (P)------------------------ 21 21 22 22 22 22 Slope Calculations – Input and Output screens----------------------------Slope Analysis------------------------------------------------------------Project Information Screen-----------------------------------Slope Data Screen---------------------------------------------Slope Calculation Type--------------------------------Product Type---------------------------------------------- 23 23 23 23 23 24 Average Annual Analysis-----------------------------------------------Average Annual Rainfall Screen----------------------------K-Factor Suggestions Screen-------------------------------Calculate K-Factor Screen-----------------------------------Thawing soil check box---------------------------------------- 24 25 25 25 25 Screen Options-----------------------------------------------------------100% Biodegradable Products only check box---------Enable Material Estimator check box---------------------Desired Product Longevity selection----------------------Results Screen------------------------------------------------------------ 26 26 26 26 26 to 27 Single Storm time intervals and storm duration------------------ 28 to 30 Channel Calculations – Background-----------------------------------------Basics of Open Channel Flow Uniform Flow---------------------------------------------------Hydraulic Radius----------------------------------------------Energy Gradient-----------------------------------------------Manning’s Equation-------------------------------------------Bend Coefficients----------------------------------------------Froude Number------------------------------------------------Shear Stress----------------------------------------------------- 30 31 31 31 32 33 33 33 to 34 Channel Calculations – Input and Output screens------------------------Channel Configuration screen----------------------------------------Project Information screen-----------------------------------Channel Type drop down selection screen--------------Parabolic Channel Configuration input Screens-----------------Channel bed Manning’s n-value input--------------------RECP Application parameters input----------------------Enable Material Estimator check box---------------------Channel data screen------------------------------------------Results screens------------------------------------------------- 34 35 35 35 to 36 37 37 38 38 39 40 Stability Factors--------------------------------------------------------------------- 41 Conclusion--------------------------------------------------------------------------- 41 Literature Cited and Recommended References-------------------------- 42 to 44 Appendix A – Example Single Storm Analysis----------------------------- 45 to 47 Appendix B – RUSLE Units and Conversions------------------------------ 48 INTRODUCTION Welcome to ErosionWorks Version 9.1 (V9.1). This Reference Manual has been developed to assist you in using American Excelsior’s ErosionWorks Version 9.1 software, which is available for free to residents of the U.S. and Canada. ErosionWorks, also known as “EWorks”, allows you to analyze rolled erosion control product (RECP) and slope interruption designs for typical slope applications for a single storm or on an average annual basis. EWorks additionally allows you to analyze RECP channel applications for various configurations. The calculations within the program are based on generally accepted engineering principles related to hydraulics and sediment transport. In addition, EWorks offers you the option of evaluating select best management practices (BMPs) to meet the erosion control and revegetation aspects of your project. EWorks makes product data information available immediately after running calculations and has capabilities to create a digital report of your output in a .pdf style format for use to print, email, or archive your work. EWorks can estimate material quantities and costs for your specific slope or channel project. EWorks also will indicate which American Excelsior products are approved for use in any of the 50 United States by the state selected Department of Transportation. EWorks is supported with a complete technical library, which contains product specifications, staple pattern guides, installation guidelines, and CAD details which can be “cut and pasted” directly into your construction plans as well as other useful documents. The all new Digital Plan Book is a desktop application of our technical support documents. All features of EWorks are easily updated via push technology, which help ensures users are using the most current information available. Our goal has been to make EWorks the most valuable design tool for erosion and sediment control design needs available. We have accomplished this by constant improvements based on user feedback. WHERE TO FIND EWORKS V9.1 Years ago EWorks became the first web-based RECP hillslope and channel erosion analysis and design program. ErosionWorks V9.1 is available in three convenient ways. First, the program can still be ran directly from the internet at www.ErosionWorks.com. Secondly, the program can be downloaded as a desktop application from www.ErosionWorks.com. Thirdly, the program can be downloaded as a desktop application from CDs provided by American Excelsior Company. The EWorks program code is centrally located, thus it can be readily updated and changes are instantly made available to all users. American Excelsior Company’s ErosionLab® is a large-scale erosion research and development testing facility, which continues to have an ever-growing database for our products and their performance. As new data becomes available it can be immediately incorporated into the EWorks program. 1 TECHNICAL SUPPORT For free technical assistance on EWorks, you can contact us by email [email protected], by telephone toll-free at 1-800-777-SOIL (7645), or by fax at 1-817-385-3585. Our standard business hours are: Monday through Friday, 8:00 AM to 5:00 PM, Central Time, excluding holidays. In most cases we will be able to respond to an email request for assistance within a 24 hour time period on all regular business days or possibly even sooner by telephone if your situation constitutes an emergency. CONVENTIONS BUTTONS: EWorks Online uses mouse-type, “point and click” buttons for activity or screen selection. Below is an example of one of these types of buttons: Simply use the mouse to locate the pointer over the “button” and click on it to continue. DATA ENTRY BOXES: This manual provides examples of input data where the text will appear like this: 0.035. The following is an example of a data entry box: Simply place your cursor in the data entry box by left clicking on the mouse over the box. You are now able to enter data directly into the box. DROP DOWN MENUS: The program also contains numerous drop down menus. Below are examples of a drop down menu before and after it has been selected: BEFORE AFTER The drop down menu is accessed by placing your cursor over the small down arrow and pressing your left mouse button. 2 CHECK BOXES: Check boxes are used in EWorks. A check mark will appear in the box when left clicking on the box that is blank to start with. Check boxes with a check mark in them denote the feature is “turned on” at that point: Material Estimator feature is “off” Material Estimator feature is “on” WHAT’S NEW WITH EROSIONWORKS V9.1? ErosionWorks V9.1 has many new and exciting features to enhance the program. Below is an explanation of all the new features: 1. Project Information – At the beginning of any calculation, EWorks will provide a project information data input screen. None of the input fields are required; however, it is very important to provide as much project detail as possible because the project information will be included in your final report generated by the program and the information will be present when recalling projects from your “My Reports” section of the program. Thus, we highly recommend you take the time to fill in the project information so your report contains the detail you will need when accessing it in the future: Example Projection Information Filled in: 3 2. 100% Biodegradable Option – Some projects require materials that contain only biodegradable components. This option is designed for those projects. When the option is selected only materials that are 100% biodegradable will be displayed by EWorks. You can “click on” or “click off” this option on the data input or results screens: Or Gray shaded “Biodegradable Only” button means only biodegradable products will be displayed Only 100% biodegradable products are displayed in output 4 3. Material Estimator – This feature helps estimate how much material and staples/stakes you will need for your project. In addition, budgetary material, installed material, staple/stake, and project costs will be calculated if you enter representative pricing information for your specific project. The Material Estimator is available in both slope and channel calculations and can be “turned on” from the data input screens or from the results screens. The Material Estimator requires you to input additional information so the appropriate calculations can be made. For example, “slope width” needs to be input when using the Material Estimator in slope calculations and “RECP application width” and “Channel length” need to be input when using the Material Estimator in channel calculations. In both slope and channel calculations you will need to tell EWorks if you will be using a trench (top of slope or top of channel side slopes) or if you will be extending the RECP a minimum of 3 ft over the crest of the slope (top of slope or top of channel side slopes). The Material Estimator considers the following when calculating how much material your project will require: project dimensions, material dimensions, side-by-side overlaps (if recommended by AEC), and end of roll over laps. For slope applications the Material Estimator assumes intallation with the slope, as recommended by AEC. For channel applications the Material Estimator assumes installation parallel with the channel flow. Staple quanitities consider density per trench (start and side trenches), end of roll overlaps, bottom of slopes, end of roll terminations, and staple density per product. All information considered by the Material Estimator is based on American Excelsior Company’s recommended installation practices. Following are screen shots of the various stages of the Material Estimator for slope and channel calculations: 5 Material Estimator – Slope calculations. Enable Material Estimator is checked so slope width input box is now required to proceed. Material Estimator – Slope calculations. Enable Material Estimator from results (Slope Analysis) screen by clicking on “Calculate Material Cost” under the products listed in the Good, Better, Best indicator. 6 You will be directed back to the Slope data input screen to enter the slope width Regardless if you enabled the Material Estimator from the Slope data or Slope analysis screen, the next steps in the Material Estimator will appear as follows: 7 Material Estimator – Slope calculation – project physical data has been input to program. Material Estimator defaults to “Best” product. Material Estimator can be run on other products by clicking on the words “Calculate Material Cost” under the product name. At this point, the number of products has been calculated based on the default dimensions for the specific product (4 ft x 101.25 ft for Curlex I in this example). Total area of blankets and number of staples has also been calculated. The next step is to enter pricing information, if desired. 8 Material Estimator – Slope calculation – project physical data and pricing information has been input to program. Product cost, Staple Cost, Installed Cost, and Installed Material + Staple Cost are now displayed because pricing information was provided. Note: Pricing information used here is strictly for example purposes and may have no significance to real world projects. Round numbers were used to illustrate the mathematics that is being conducted by the program. You now have budgetary numbers for the project conditions you entered into EWorks. The same progression of steps is followed for channel calculations, but remember that RECP application width and channel length must be entered when using the Material Estimator in channel calculations. 4. Desired Product Longevity – Some projects have specific conditions that require RECPs or slope interruption devices to have certain desired product longevities. When this is the case, click on the “Desired Product Longevity” drop down menu and choose from the following ranges: All longevities No more than 3 months Between 3 and 18 months Between 18 and 24 months Between 24 and 36 months Greater than 36 months Permanent EWorks defaults to “All longevities” at the start of all calculations. The selected longevity range will be carried through the calculation and displayed and recommended products will only be displayed that match the desired longevity range you selected. The Desired Product Longevity drop down is show below: 9 Desired Product Longevity drop down menu – scroll down for more longevity ranges 5. Good, Better, Best Indicator – EWorks recommends up to three products to meet the conditions of your project. A rating of “Good” equals the 3rd most effective solution for your project, a rating of “Better” equals the 2nd most effective solution for your project, and a rating of “Best” equals the most effective solution for your project. The Good, Better, Best Indicator is based on performance and desired product longevity. Thus, the “Best” product will perform the best within the selected product longevity range selected for the project conditions entered into the program. There may not always be “Good”, “Better”, and “Best” products listed if multiple solutions are not available to meet the project input conditions. 6. Enhanced Report Capabilities – All input, output, and new features of EWorks are conveniently saved into a .pdf file when “Click here to save this analysis as a PDF” is clicked after a slope or a channel analysis. All the information you need for your records is contained in the savable, printable report. If project information was entered at the start of the calculation it will be included on the report. 10 Report containing all the information for your files is easily generated by clicking on, “Click here to save this analysis as a PDF” following both slope and channel analyses. 7. My Reports – This exciting new feature is a handy tool when revisiting projects that you have worked on in the past in EWorks. Each time the “Show Results” button is clicked from either a slope or channel data screen, your project will be automatically saved to your own “My Reports” section. Properly naming projects from the Project Information screen is important for keeping projects organized in your My Reports section. EWorks will remember your project information and input parameters so you can easily update information, rerun a report, or compare a previous project with an upcoming project. The benefits of your My Reports section is endless. Anytime after the “Show Results” button has been clicked, you can recall our project by clicking on “My Reports” from the main menu of the left side of the screen: 11 Click “My Reports” to recall all previous projects 8. Slope Interruption Devices in Slope Calculations – Want to know how slope interruption devices such as Curlex Sediment Logs or AEC Premier Straw Wattles could help reduce soil loss on bare slopes? Now you can choose between RECPs and Slope Interruption Devices in slope calculations. EWorks defaults the C factor to 1, assuming no cover management is present, when evaluating slope interruption devices. SHORT COURSE Analyzing design conditions and selecting Best Management Practices (BMPs) with EWorks is as simple as clicking your mouse button. Before we begin though, there is some basic information about EWorks that you may find useful, including using the MAIN MENU, Applications, Units systems, and Product information. MAIN MENU: The MAIN MENU of EWorks includes six options of 1. Slope Calculations, 2. Channel Calculations, 3. Display DOT Approvals, 4. My Reports, 5. Logout, 6. User Manual: 12 APPLICATIONS: EWorks uses industry recognized methods for analysis of erosion potential and has been designed to support most typical erosion control applications, including both slopes and channels. However, there may be applications that require special attention due to unique project conditions. You should use good engineering judgment to determine the suitability of the results for your given application. If you have questions regarding a specific application we encourage you to contact us at the American Excelsior Company for additional technical assistance. SLOPES: In general, EWorks can be used to determine soil loss estimates on a variety of slope applications including landfill side-slopes, highway cut and fill slopes, mine reclamation sites, and pipeline right-of-ways, for example. Output generated is in mass of erosion caused soil loss off the slope per unit area. CHANNELS: With channels, EWorks can be used to determine approximate shear stresses and water velocities that can be expected in a variety of channel designs. Some examples are landfill downchutes, ditches, swales, culvert aprons, diversions, levees, streambanks, pipeline stream crossings, drop structures, spillways, and other such hydraulic structures. Output will be the factor of safety of how well a particular channel lining will perform. DISPLAY DOT APPROVALS: Most state departments of transportation maintain an approved product list, sometimes referred to as an APL, which lists manufacturer’s products that have been approved for use on that state’s department of transportation construction projects. The methods for evaluation to be added to any particular state DOT “APL” list varies considerably state to state. We at American Excelsior constantly are developing our products and regularly are submitting new information to various DOTs to either get products 13 approved for use or to update the existing information the DOTs retain about our products. EWorks allows you to see if the product listed in your EWorks output has approval in any particular state. First, you can simply click on “Display DOT Approvals” from the main menu. Your home state, based on registration information, is default set and will always be displayed first. By using the pull down menu you can select any state and see which American Excelsior Company products have been approved for use by the particular state: 14 DOT approvals are also listed in the results tables following both slope and channel calculations. Below is an example results table following a slope calculation. Again, the state is default set to the state you provided at registration and you can view DOT approval status for any other state by clicking the drop down menu: MY REPORTS: Clicking on “My Reports” takes you to your saved projects. See details in the “My Reports” section of “WHAT’S NEW WITH EROSIONWORKS V9.1?” earlier in this document. LOGOUT: Clicking Logout ends your session in EWorks and you will need to sign in again before using the program. USER MANUAL: Clicking on User Manual brings you to the document you are currently reading. UNITS SYSTEMS: EWorks allows you to select either English units or System International (S.I.) to use in your input values and output generation. The default units system for EWorks is the English system using feet, pounds (mass), pounds (force), etc. By choosing the adjacent S.I. option, you can easily change to the S.I. system using meters, kilograms, Newtons, etc. Some helpful units conversions are listed below in Table 1: S.I. Units Centimeters (cm) Cubic meters (m3) Cubic meters per second (m3/s) Hectares (ha) Kilograms (kg) Kilograms per hectare (kg/ha) Meters (m) Meters (m) Meters per second (m/s) Newtons (N) Newtons per square meter (N/m2) Square meters (m2) Square meters (m2) Conversion Factor 0.394 264.3 35.34 2.47 2.21 0.893 1.1 3.28 3.28 0.225 0.021 10.56 1.2 15 English Units Inches (in) Gallons (gal) Cubic feet per second (ft3/s) Acres Pounds (lb) - mass Pounds per acre (lb/acre) Yards (yd) Feet (ft) Feet per second (ft/s) Pounds (lb) - force Pounds per square foot (lb/ft2) Square feet (ft2) Square yards (yd2) Table 1. Helpful conversions between S.I. units and English units. To convert from S.I. to English, multiply by the conversion factor. To convert from English to S.I., divide by the conversion factor. EWorks converts between unit systems as soon as you select a different system. The program automatically updates when the change is made so there is no need to refresh screens like other programs. You can select between the units on several screens within the program. Below is a screen shot showing where units of measure are selected on the data input screen in the Slope Analysis section. The same example holds true for channel calculation data input screens: The unit of measure can be changed at any point during the analysis. Below is an example results screen from a slope calculation. English Units are currently being used in the example and if the button was selected then Metric (S.I. Units) would be displayed in the button and all values would be converted accordingly: 16 PRODUCT INFORMATION: The American Excelsior Company (AEC) has provided a wealth of information pertaining to its erosion control products through our web site and the New Digital Plan Book desktop application. After you and EWorks have determined which product(s) best meets the needs of your application, all the product’s technical data information is just a mouse click away. The easiest, most convenient way to access all the support information you may need is to download the Digital Plan Book. The Digital Plan Book allows you to easily sort through all our support material with options to save files in various formats (i.e. .pdf, Microsoft Word, Auto CAD, etc.). www.Curlex.com is also always an option to access all your support information for our products. The following technical support documents are available in your free Digital Plan Book application or on our website in the Technical Support Library: Product Specifications – Provide the material composition, dimensions, description, physical properties, and performance ratings of each AEC product. CSI Specifications – Standard construction specification format applied to all American Excelsior Company’s products. This is the all-encompassing document that will help you easily specify erosion and sediment control products based on PERFORMANCE and not strictly material index properties. Product Data Sheets – Similar to Material Specifications content; however, material physical index results are also provided. 17 Material Safety Data Sheets (MSDS) – Standard legal document that addresses all safety aspects associated with the AEC product. Staple/Stake Pattern Guides – Visually show the recommended staple/stake pattern for each AEC product. Installation Guidelines – Explains the process of installing the AEC product from site preparation to anchoring the product in place. CAD Details – Both slope and channel details are available for every product in EWorks. CAD details are available in a downloadable or printable PDF or .DWG type files (Auto CAD 2000). The AutoCAD files can be edited or copied and pasted for customizing site plans. Case Studies – If you want to see how well American Excelsior Company’s products have worked in the past in various applications. Tech Notes – Technical responses and explanations to questions that have been asked by our customers. Technical Papers – Numerous papers specific to the erosion and sediment control industry. Videos – How are performance ratings established for our products? American Excelsior Company bases product performance on results of large-scale testing. Check out the videos to see the complex, rigorous testing our products are exposed to along with other miscellaneous videos. Miscellaneous Documents – Various resources are found here including, but not limited to: application guides, slope spacing guides, channel spacing guides, etc. 18 SLOPE CALCULATIONS - Background EWorks allows you to analyze rainfall erosion by estimating soil loss for typical slope applications. EWorks utilizes the Revised Universal Soil Loss Equation (RUSLE) formula, which was developed by the United States Department of Agriculture to compute an estimate for soil loss using the characteristics of your project site. Once the site data has been entered, EWorks can then calculate the amount of soil loss expected for bare soil conditions and for conditions where erosion control products are used. EWorks uses the RUSLE formula in both the Single Storm and the Average Annual Analyses. RUSLE: RUSLE stems from advances in the Universal Soil Loss Equation (USLE), which was developed by Wischmeier and Smith for the United States Department of Agriculture. The equation identifies six factors that most greatly influence erosion on slopes, the impact force of raindrops and runoff characteristics. The impact force has a significant effect on dislodging soil particles from the surface. Runoff characteristics identify the potential for loss of soil once the water begins flowing over the slope. The six key factors, which contribute to rainfall-induced soil erosion are described below for both average annual and single storm analyses: AVERAGE ANNUAL CALCULATIONS – Because this equation was derived from data collected in the United States and from the Nation Weather Service, it is currently intended only for application within the United States. However, you can use good judgment and compare non-U.S. locations with those in the U.S. to evaluate average annual slope applications in other locations. In addition, RUSLE is written only in the English units system, primarily because the R-factor map and soil erodibility indices were not published in metric equivalents. However, when using metric units, the calculated soil loss is converted by EWorks to the appropriate measures and then used for calculation. Therefore, the discussion in this chapter is shown only in English units. Appendix B provides RUSLE units and conversions between English and S.I. units for the RUSLE parameters for those needing such reference. The full form of RUSLE: A = R x K x (LS) x C x P Where: A=Annual soil loss per unit area and R=Rainfall erosivity factor K=Soil erodibility factor LS=Slope length and steepness factor C=Cover management factor P=Support practice factor 19 RAINFALL EROSIVITY FACTOR (R) – The R factor considers the two most important storm characteristics – amount of rainfall and peak intensity. Mathematically, R is the product of the total kinetic energy (E) and the 30-minute maximum intensity (I30). The R factor represents the climatic erosivity of a location. Average annual R values are functions of geographic location and are displayed in isoerodent maps – maps which connect points of equal rainfall erosivity and which look much like topographic maps. The isoerodent maps represent average EI30 values over many years. Five isoerodent maps, covering the continental U.S. and Hawaii, are provided in EWorks for reference. The R factor has dimensions of LFL/L2T and U.S. Customary Units of: hundreds foot*tonf *inch/ acre*h*yr. SOIL ERODIBILITY FACTOR (K) – The K factor is defined as the rate of soil loss per unit of rainfall erosion index for a soil cultivated in continuous fallow on a standard plot having a slope length of 72.6 ft (22.1 m) and a slope of 9%. The K factor represents susceptibility of soil to erosion and the rate of runoff. The K factor can be extrapolated from the soil erodibility nomograph, which is based on soil texture, structure, permeability, and organic matter content. EWorks can calculate a K factor for your specific soil based on the above listed soil properties. EWorks also provides a drop down reference menu with the K factors for many common soils. The K factor has dimensions of ML2T/L2LFL and U.S. Customary Units of ton*acre*hr/hundreds of acre*foot*tonf*inch. SLOPE LENGTH AND STEEPNESS FACTOR (LS) – The LS factor, or topographic factor, is a combination of the slope length and steepness. L refers to the slope length, which is the ratio of soil loss from the slope length measured in the field to that from a 72.6 ft (22.1 m) length on the same soil type and gradient. Slope length is the distance from the start of overland flow to the point where concentrated flow or deposition occurs. The most accurate method of determining slope length is to measure the distance on the ground. Slope lengths greater than 1000 ft (305 m) should not be used in RUSLE because concentration usually occurs before the end of segments of this distance. S refers to the slope steepness, which is the ratio of soil loss from the slope found in the field to that from a 9% slope believed to be under the same conditions. Soil particle size and vegetation density along the slope influence the ratio of soil loss to slope steepness. The LS factor is unit-less. COVER MANAGEMENT FACTOR (C) – The C factor represents the effect of surface cover and roughness on soil erosion and is the ratio of soil loss from an area with specified cover management (which could be erosion control blankets) to soil loss from an identical but unprotected area. The C factor is the most common factor used to assess the impact of cover management BMPs on reducing erosion because it can represent the effect of land use on soil erosion. By definition, C=1 under standard fallow conditions. As surface cover is added to the soil, the C-factor value approaches zero. For example, a C-factor of 0.20 20 signifies that 20% of the bare soil erosion will occur using that BMP. The unitless C factor considers the following five subfactors: 1) Prior Land Use (PLU) 2) Canopy Cover (CC) 3) Surface Cover (SC) 4) Surface Roughness (SR) 5) Soil Moisture (SM) SUPPORT PRACTICE FACTOR (P) – The P factor reflects the impact of support practices on the average annual erosion rate. P is the ratio of soil loss with a support factor to that with straight row farming up and down slope. The P factor considers methods that reduce or filter sediment from moving water. For construction activities, these practices include contour furrowing, terracing, buffer strips, and sediment retention devices such as Curlex® Sediment Logs®. The Pfactor value approaches zero with increasing “improvements” resulting from support practices. The P factor is unit-less. EWorks provides a default value of 1.0 for the P factor, which means no support practices are being applied when “Rolled Erosion Control Products” is selected for the slope calculation. Eventbased P Factors specific to American Excelsior Company’s products are used in the slope calculations when “Slope Interruption Devices” is selected for the slope calculation. SINGLE STORM CALCULATIONS – It is possible to use the framework of RUSLE to analyze single storm events on slopes. The same six key factors are used; however, some of the factors are determined differently than the average annual method. Many of the RUSLE values are based on extensive large-scale testing data obtain from studies conducted at American Excelsior’s ErosionLab. All ErosionLab testing has followed procedures provided in ASTM D6459 (2001), “Standard Test Method for Determination of Erosion Control Blanket (ECB) Performance in Protecting Hillslopes from Rainfall-Induced Erosion” or ASTM D6459 (2007), “Standard Test Method for Determination of Rolled Erosion Control Product (RECP) Performance in Protecting Hillslopes from Rainfall-Induced Erosion.” It should be noted the test conditions mimicked construction activities on slopes. The test plots had the characteristics of seedbed conditions before the establishment of any vegetation except for the case of vegetated turf reinforcement mats (TRMs). All data has been analyzed by an independent third party engineering firm. Each of the RUSLE factors are described below for single storm analysis: RAINFALL EROSIVITY FACTOR (R) – The R factor can be determined for any storm where the intensities and durations of the storm segments and total storm duration are known. Agriculture Handbook 703 (1997) references all the equations used to calculate the R factor based on rain gauge measurements. 21 SOIL ERODIBILITY FACTOR (K) – The K factors used within EWorks are based on extensive bare soil testing at the ErosionLab. The testing showed that some soils eroded differently under extreme single storm events as compared to how the same soils erode on an annual basis. Three generic soil types (sand, loam, and clay) are available as an option. SLOPE LENGTH AND STEEPNESS FACTOR (LS) - The LS factor is determined the same way for single storm and average annual analyses. COVER MANAGEMENT FACTOR (C) – The C factors used within the single storm component of EWorks were determined from extensive testing at the ErosionLab. SUPPORT PRACTICE FACTOR (P) – EWorks provides a default value of 1.0 for the P factor, which means no support practices are being applied. 22 SLOPE CALCULATIONS – Input and Output screens Click “Slope Calculations” from the Main Menu on the left side of the screen and enter your Project Information: After clicking “continue” the “Slope Analysis” screen will appear. “Units of Measurement” can be selected now (or at any other time) and the “Slope calculation type” needs to be selected. You can conduct “Single Storm” or “Average Annual” slope analyses with EWorks. Appendix A contains an example calculation using the single storm option of the program. 23 After choosing the “Slope calculation type” the “Product type” needs to be selected. You can evaluate either “Rolled Erosion Control Products” or “Slope Interruption Devices”: Next, project conditions need to be entered. Units for the inputs are located to the right of the input box. The example below shows the “Slope data” screen for an “Average Annual” slope analysis. For “Average Annual” analyses, the average annual rainfall (R factor) is manually entered. Click “View U.S. isoerodent maps” if you do not know the R factor for your project location. Next the “Soil type k factor” needs to be entered. You can either enter it manually, selected a common soil type from the drop down menu (mean value of range will be input to the k factor box by EWorks), or you can calculate the K factor of your soil based on its properties by clicking on “Calculate K Factor.” Thawing soils erode at a different rate than soils that are not thawing. Thus, left click to check the “Thawing soil” box if the soil will experience thawing during the proposed project. Check the “100% Biodegradable Products only” box if you only want biodegradable products displayed in your results. Check the “Enable Material Estimator” box if you want EWorks to calculate the amount of material for your project or if you are also interested in obtaining an estimated cost for your project. (See Section 3 “Material Estimator” in the “WHAT’S NEW WITH EROSIONWORKS V9.1?” portion of this manual for details on using the Material Estimator for a slope calculation.) Lastly, select a “Desired Product Longevity” from the drop down menu. More detail and explanation on 100% Biodegradable Products, Material Estimator, and Desired Product Longevity can be found in a previous section in this manual that is entitled, “WHAT’S NEW WITH EROSIONWORKS V9.1?.” After all input fields have been entered click “Show Results.” 24 25 Slope Analysis – results screen (top portion) Click to go back to change Project Info Click to go back to change data Options can be clicked on/off or changed Link to .pdf report Good, Better, Best Indicator Enter optional pricing information here Select different product dimensions Number of products, total area of blankets, and number of staples already displayed. Cost fields will automatically calculate if pricing information is provided above. 26 Slope Analysis – results screen (bottom portion) Table comparing products that match desired longevity range that was selected Click on any column title to sort the contents No products are highlighted red, thus all products are suitable for the conditions of the slope project. 27 Click drop down to view product approval status in different state The following screen shots show an example single storm slope calculation. Start by selecting “Units of Measurement” then “Slope calculation type” then either “Rolled Erosion Control Products” or “Slope Interruption Devices” then enter “Uniform slope gradient” then enter “Slope length” then choose the “Storm time intervals” from the drop down menu. There are three choices: 15, 30, or 60 minutes. Basically, how frequently do you have known data for the event you are about to enter? In the example to follow we know the intensities of our design storm every 30 minutes for the storm lasting 2 hours. Thus, we will select 30 minutes from the “Storm time intervals” drop down and enter 120 minutes in the “Total storm duration” box. After we enter the duration the “Storm segment intensities” table will populate with the appropriate number of input fields required for the sized storm that was entered. 28 Four segments were created in the table after 30 and 120 minutes were selected and entered for “Storm time intervals” and “Total storm duration”, respectively. Calculated event-based rainfall (R-factor) is displayed in box. Single storm analyses are the same as average annual slope analyses after the event-based rainfall factor is calculated and the soil type has been selected. There are three soil types to choose from in single storm calculations: Sandy, Topsoil (Loam), and Clayey. The K factors used within EWorks are based on extensive bare soil testing at the ErosionLab. The testing showed that some soils eroded differently under extreme single storm events as compared to how the same soils erode on an annual basis. After the “Soil type k-factor” field has been input then “Practice Factor (P)” is next. EWorks defaults the P factor 1 when RECPs are selected to be used in the calculation. Similarily, the C factor will default to 1 when Slope Interruption Devices are selected to be used in a slope calculation. Check the box to the right of “Thawing soil” if the soil will be thawing during the proposed project. Next check the box to the right of “100% Biodegradable Products only” is you want only 100% biodegradable products to be displayed in the results. See Section 3 “Material Estimator” in the “WHAT’S NEW WITH EROSIONWORKS V9.1?” portion of this manual for details on using the Material Estimator for a slope calculation. 29 Lastly click the “Desired Product Longevity” drop down to select how long you desire the material to last. Clicking “Show Results” brings you to the results screen with the Good, Better, Best indicator, input and results for the Material Estimator, product results based on your project conditions, and link for summary report. This screen and it options are similar to average annual slope calculations that were explained above. CHANNEL CALCULATIONS-Background EWorks allows you to analyze hydraulic conditions found in typical open channel flow applications. EWorks uses the Manning’s formula to compute the hydraulic conditions, based on your project’s requirements. Options include TRAPEZOIDAL, PARABOLIC, RECTANGULAR, and KNOWN HYDRAULICS channel calculations. Once the input data has been entered, EWorks will calculate the expected flow depth, flow velocity, Froude number, and shear stress based on your anticipated conditions. In addition, EWorks displays the results of RECPs that are used in channel flow applications. EWorks will compute stability factors, considering both velocity and shear stress criteria, which tells you if the material is likely to fail if the calculated hydraulic conditions are encountered. Some values used within the channel analyses portion of EWorks are based on extensive large-scale testing at the ErosionLab. All testing followed procedures provided in ASTM D6460 (2001), “Standard Test Method for Determination of Erosion Control Blanket (ECB) Performance in Protecting Earthen Channels from Stormwater-Induced Erosion” or ASTM D6460 (2007), “Standard Test Method for Determination of Rolled Erosion Control Product (RECP) Performance in Protecting Earthen Channels from Stormwater-Induced Erosion. All data were analyzed by an independent third party engineering firm. 30 BASICS OF OPEN CHANNEL FLOW Uniform Flow – The equations used in analysis of open channel flow by EWorks are based on uniform flow. Uniform flow is the condition where the fluid is moving at a constant velocity and is neither accelerating nor decelerating. In addition to the velocity being constant, so too are the discharge, flow depth, and flow area. It is also assumed that the fluid is incompressible, which is true for water in open channel flow. When uniform flow conditions are present, the discharge is calculated as: Q = vA where: Q v A = discharge (ft3/s or m3/s) = velocity (ft/s or m/s) = flow area (ft2 or m2) The flow area is simply the cross-sectional area of the channel at the given flow depth. This formula is also often referred to as the continuity equation. Hydraulic Radius – The hydraulic radius is the ratio of flow area to the wetted perimeter. The wetted perimeter is the total length of the channel boundary in contact with the water. The water surface exposed to the air is not included in the wetted perimeter. The formula for the hydraulic radius is: RH = A/P where: RH A P =hydraulic radius (ft or m) =area (ft2 or m2) =wetted perimeter (ft or m) Depending on the shape of the channel cross-section (i.e., trapezoidal, parabolic, etc.), it is possible to use geometric relationships between depth and area to determine the hydraulic radius. Energy Gradient – The energy gradient is the slope of the energy line. If the flow is uniform, the energy gradient is parallel to the bed slope of the channel and is, therefore, equal to the bed slope of the channel. For uniform flow applications, the energy gradient is calculated as: 31 S =dH/dL where: S dH dL =energy gradient (decimal) =change in head (height) (ft or m) =change in length (ft or m) The change in head is usually calculated on a percentage basis per 100 feet (or 100 meters) of channel length. Note that when backwater conditions are encountered, for example, upstream of a culvert or bridge, the additional stored energy of the “stacked” water needs to be added to the bed slope to determine the correct energy gradient. Backwater is typically caused by an obstruction, which makes the upstream depth greater than it would otherwise be. Manning’s Equation – As the name indicates, the Manning’s equation was developed by R. Manning in 1890 and is shown as follows: v = 1.49/n * RH2/3 * S1/2 (English Units) or v = 1/n * RH2/3 * S1/2 (S.I. Units) where: v n RH S =velocity (f/s or m/s) =Manning’s coefficient (unitless) =hydraulic radius (ft or m) =energy gradient (decimal) The Manning’s coefficient is dependent primarily on the boundary characteristics of the channel. The greater the value, the rougher the channel boundary. A smooth concrete channel may have may have an n-value of about 0.013, while a grass-lined channel may have an n-value of up to about 0.040 or more. By inserting Manning’s formula into the continuity equation, the discharge can be used to solve for the hydraulic conditions, as follows: Q = [1.49/n * RH2/3 * S1/2] * A (English Units) or Q = [1/n * RH2/3 * S1/2]* A (Metric Units) 32 Bend Coefficients – When water flowing in an open channel encounters a bend, the momentum of the water increases the hydraulic force at the outside of the bend and reduces it on the inside. The tighter the bend the greater the increase in force on the outside edge. This is analogous to the different centrifugal forces you feel when a car takes a gradual curve versus a sharp corner, both at the same speed. For a straight channel, there is no bend effect, so the bend coefficient is equal to 1.0. For a sharp turn, the bend coefficient can be as great as 2.0. Froude Number – The Froude number is a unitless number that identifies the condition of the flow as either subcritical or supercritical. The Froude number is similar to the Mach number used to determine subsonic or supersonic conditions in air travel. When the Froude number is less than one, the flow is subcritical. When the Froude number is greater than one, the flow is supercritical. When the Froude number is equal to one, the flow is exactly “critical”. The Froude number is calculated, as follows: NFr = v/(gd)1/2 where: NFr v g d =Froude number (unitless) =velocity (ft/s or m/s) =gravitational constant (32.2 ft/s2 or 9.81 m/s2) =flow depth (ft or m) Shear Stress – In hydraulics, shear stress is the force of moving water applied to its boundaries. This friction of water flowing along the perimeter of the channel creates the erosive force, which can cause significant degradation and damage. Shear stress is calculated as follows: =*d*S where: d S =shear stress (lb/ft2 or kN/m2) =normal depth (ft or m) =energy gradient (decimal) =unit weight of water (lb/ft3 or kN/m3) For open channel flow purposes, the unit weight of fresh, clean water is a constant equal to 62.4 lb/ft3 (9.81 kN/m3). Shear stress is considered a better predictor of erosion potential than velocity because it takes the actual force of the water on the channel boundary into consideration. As an analogy, describing two vehicles both traveling at about 60 33 mi/hr (97 km/hr) provides some qualitative indication of their damage potential. However, if the description further identifies one vehicle as a compact passenger car and the other as a semi-truck, the implied inclusion of vehicle weight (i.e., mass) offers a better predictor of their damage potential. For additional information on the use of permissible shear stress criteria for channel linings, see Hydraulic Engineering Circular #15 (HEC-15), as published by the Federal Highway Administration. CHANNEL CALCULATIONS – Input and Output screens Click on “Channel Calculations” from the main menu on the left side of the screen. Channel calculations start with the Project Information screen like slope calculations. As mentioned in the section entitled, “WHAT’S NEW WITH EROSIONWORKS V9.1,” none of the input fields are required; however, it is very important to provide as much project detail as possible because the project information will be included in your final report generated by the program and the information will be present when recalling projects from your “My Reports” section of the program. Thus, we highly recommend you take the time to fill in the project information so your report contains the detail you will need when accessing it in the future: 34 “Units of Measurement” are default set to English units. They can be changed at this time or later in the calculation. The “Channel type” drop down menu contains for options: Parabolic Rectangular Trapezoidal Known Hydraulics 35 After the “Channel type” has been selected the bed slope (ft/ft) is entered in decimal format (i.e. 5% is entered as .05). Next, the Manning’s n value(s) need to be entered. A reference drop down menu is provided. The mean value of the range will be added to the input box when selected. In addition, you can hand key in a value. The classes of vegetation within the N-VALUE REFERENCE table are referenced from “Tractive Force Design of Vegetated Channels”, D. Temple, as published in the 1980 Transactions of the American Society of Agricultural Engineers, Volume #23, pages 884-90. Class A vegetation refers to woody plant species, which are more likely to remain upright in high flow conditions. Class E vegetation refers to short grasses that have less effect in slowing down the flow of water. Classes B, C, and D vegetation fall in between. Note: These screen shots show a Parabolic channel that requires only one Manning’s n input in the form of the “Channel bed Manning’s n-value” input. Trapezoidal channels would have Manning’s n input boxes for the channel bottom and both side slopes. 36 Following along this Parabolic example, the next inputs would be “Channel top width” then “Design discharge” then “Bend coefficient.” There is a reference drop down menu for bend coefficient values. The mean value of the range will be input when clicked on. 37 If you want “100% Biodegradable Products only” to be displayed in the results then click in the box to the right of the statement. A check mark in the box signifies the option has been activated. We are not going to activate the option in this example. If you want to use the “Enable Material Estimator” click in the box to the right of the statement. We will be using the Material Estimator in this example. After the option has been activated two additional input boxes and one question will be populated: “RECP application width” Input Box – This is the total width of channel that will be covered with the RECP to be evaluated. Extensions above high water marks and/or extensions of the crest of the side slopes must be included in the RECP application width. “Channel length” Input Box – Linear length material will cover “Trenching” Question – There are two choices provided. “RECP will be extended a minimum of 3 ft over the crest of channel in lieu of trenching” is the default setting. If trenching along the top of both sides of the channel installation will be used then click the circle to the left of “I will use a trench at the top of this channel.” These options can influence the number of staples that will be required for the installation. After all fields have been completed, click “Show Results” on the bottom of the screen. 38 Note: Channel data input fields/requirements vary slightly amongst the four types of channel calculations. All input fields/requirements must be satisfied before EWorks will allow the calculation to proceed. The Material Estimator inputs and results are the same for all four types of channel calculations. In addition, the following example screen shots of results are the same for all four types of channel calculations. The “Channel Configuration” screen, following this example, is displayed next. We will look at the features toward the top of the screen first then look at the features toward the bottom of the screen. The features of the “Channel Configuration” screen are similar for all four types of channel calculations. 39 Click to go back to change Project Info Channel Configuration – results screen (top portion of screen) Click to go back to change data Link to stability factor info. Options can be clicked on/off or changed Link to .pdf report Hydraulic conditions based on input Good, Better, Best Indicator Enter optional pricing information here Select different product dimensions Number of products, total area of blankets, and number of staples already displayed. Cost fields will automatically calculate if pricing information is provided above. Slope Analysis – results screen (bottom portion) Click drop down to view product approval status in different state Table comparing products that match desired longevity range that was selected Click on any column title to sort the contents Product highlighted red means either velocity or shear stress stability factor is less than one, thus the product is likely to fail if the calculated hydraulic conditions are encountered. 40 STABILITY FACTORS –EWorks calculates stability factors for each product display from any of the four channel type calculations. EWorks compares the typical material performance threshold to the project’s hydraulic conditions and calculates the corresponding stability factors, considering both velocity and shear stress criteria. The stability factors are calculated using the following equations: SFv = vallowable / vactual and SF = allowable / actual If the stability factor is equal to or greater than one, the selected material is a good candidate for the given application. However, if the stability factor is less than one, the selected material is likely to fail if the calculated hydraulic conditions are encountered. To highlight the latter case, the stability factor text color changes to red. CONCLUSION Once you have used EWorks we hope that you will find it the most useful computer program available for the selection of rolled erosion control products and slope interruption devices. We would sincerely appreciate your comments for ways we might improve the program in the future. Please contact us through any American Excelsior representative with your feedback. 41 LITERATURE CITED & RECOMMENDED REFERENCES: American Society of Testing and Materials (ASTM). 2008. “ASTM Annual Book of ASTM Standards –2008: Section Four, Construction”. Vol. 04.09. ASTM, West Conshohocken, PA. American Society of Testing and Materials (ASTM). 2001. “ASTM Annual Book of ASTM Standards –2001: Section Four, Construction”. Vol. 04.09. ASTM, West Conshohocken, PA. American Society of Testing and Materials (ASTM). 2000. “ASTM Annual Book of ASTM Standards –2000: Section Four, Construction”. Vol. 04.08. ASTM, West Conshohocken, PA. Benson, J. 1999. The state of the land. Conservation Voices. Soil and Water Conservation Society. April-May. Bryan, R.B. 1981. Soil erosion under simulated rainfall in the field and laboratory; variability of erosion under controlled conditions. In Erosion and sediment transport measurement. Int. Assoc. Hydrol. Sci. Proc. p.391-403. June 22-26. Washington, DC. Chow, V.T. 1964. Handbook of Applied Hydrology. McGraw-Hill, Inc., New York. Clopper, P., M. Vielleux and A. Johnson. 2001. “Quantifying the Performance of Hillslope Erosion Control Best Management Practices.” World Water And Environmental Resources Congress Professional Paper. Dodson, R.D. 1999. Storm Water Pollution Control – Industry & Construction NPDES Compliance. McGraw-Hill, Inc., New York. Early, J.J., P. Clooper, and T. Johnson. 2003. “Quantitative Erosion Control Product Testing Under Simulated Rainfall. In Proceedings of the International Erosion Control Association’s Conference 34, pp 291-300. Gard, L.E. and C.A. Van Doren. 1949. Soil losses as affected by cover, rainfall, and slope. Soil Sci. Soc. Am. Proc. 14:374-378. Goldman, S. J., K. Jackson and T. A. Bursztynsky. 1986. Erosion and Sediment Control Handbook. McGraw-Hill, Inc., New York. Ivarson, R.E. 2002. “Performance Based Design of Erosion and Sediment Controls For Construction.” In Proceedings of the International Erosion Control Association’s Conference 33, pp 379-392. Kassulke, N. 2003. “Where the Law Meets the Land”. Wisconsin Natural Resources. 27:2. 42 Kinnell, P.I.A., and L.M. Risse. 1998. USLE-M: Empirical modeling rainfall erosion through runoff and sediment concentration. Soil Sci. Soc. Am. J. 62:16671672. Kelsey, K. 2003. “Determining Cover Management Values (C factors) For Surface Surface Cover Best Management Practices (BMPs).” In Proceedings of the International Erosion Control Association’s Conference 34, pp 319-328. Kelsey, K. 2002. “Use of the Revised Universal Soil Loss Equation on an Event-byEvent Basis.” In Proceedings of the International Erosion Control Association’s Conference 33, pp 61-69 Kelsey, K. 2002. “Use of the Revised Universal Soil Loss Equation (RUSLE) to Predict Event Soil Loss.” Thesis. University of Wisconsin-Stevens Point, College of Natural Resources. Stevens Point, WI. Meyer, L. D. and J. V. Mannering. 1963. “Crop Residues as Surface Mulches for Controlling Erosion on Sloping Land Under Intensive Cropping.” Transactions of the American Society of Agricultural Engineers 6 (4): 322-323, 327. Michigan State University. 2001. RUSLE – An online soil erosion assessment tool. Website: http://www.iwr.msu.edu/~ouyangda/rusle/. Musgrave, G.W. 1947. The quantitative evaluation of factors in water erosion: A first approximation. J. Soil Water Conserv. 2:133-138. Nearing, M.A. 2000. Letter. Comments on “usle-m: empirical modeling rainfall erosion through runoff and sediment concentration. Soil Sci. Soc. Am. J. 64:1137. Nearing, M.A., G. Govers, and L.D. Norton. 1999. Variability in soil erosion data from replicated plots. Soil Sci. Soc. Am. J. 63:1829-1835. Pimental, D., C. Harvey, P. Resosudarmo, K. Sinclair, D. Kurz, M. McNair, S. Crist, L. Shpritz, L. Fitton, R. Saffouri, and R. Blair. 1995. “Environmental and Economic Costs of Soil Erosion and Conservation Benefits”. Science. 267:11171123. Renard, K.G., G.R. Foster, G.A. Weesies, D.K. McCool, and D.C. Yoder. 1997. Predicting Soil Erosion by Water: A Guide to Conservation Planning With the Revised Universal Soil Loss Equation – USDA Agric. Handb. 703. US Gov. Print. Office, Washington, D.C. Risse, L.M., M.A. Nearing, A.D. Nicks and J.M. Laflen. 1993. Error essessment in the universal soil loss equation. Soil Sci. Soc. Am. J. 57:825-833. 43 Rüttimann, M., D. Schaub, V. Prasuhn, and W. Rüegg. 1995. Measurement of runoff and soil erosion on regularly cultivated fields in Switzerland – some critical considerations. Catena. 25:127-139. Simanton, J.R. and K.G. Renard. 1982. Seasonal change in infiltration and erosion from USLE plots in Southeastern Arizona. Hydrology and Water Resources in Arizona and the Southwest. 12:37-46. Smith, D.D., and D.M. Whitt. 1947. Estimating soil losses from field areas of claypan soil. Soil Sci. Soc. Am. J. 12:485-490. Treoh, F.R., J.A. Hobbs, and R.L. Donahue. 1999. Soil and water conservation – Productivity and environmental protection. 3rd ed. Prentice-Hall, Inc., Upper Saddle River, NJ. United States Department of Agriculture- Agriculture Research Service National Sedimentation Laboratory. 2001. Revised Universal Soil Loss Equation Project. Website: http://wwwsedlab.olemiss.edu/rusle/. United States Environmental Protection Agency. 2003. National pollutant discharge Elimination system permit program. Website: http://cfpub.epa.gov/npdes/. United States Environmental Protection Agengy – Office of Water. 2001. Storm water phase II final rule fact sheet 3.1: construction rainfall erosivity waiver. U.S. Gov. Print. Office, Washington, DC. Wendt, R.C., E.E. Alberts, and A.T. Hjelmfelt, Jr. 1986. Variability of runoff and soil loss from fallow experimental plots. Soil Sci. Soc. Am. J. 50:730-736. Wischmeier, W.H., and D.D. Smith. 1965. Predicting rainfall-erosion losses from cropland east of the Rocky Mountains: Guide for selection of practices for soil and water conservation- USDA Agric. Handb. 282. U.S. Gov. Print. Office, Washington, DC. Wischmeier, W.H., and D.D. Smith. 1978. Predicting Rainfall Erosion Losses: A Guide For Conservation Planning-USDA Agric. Handb. 537. U.S. Gov. Print. Office, Washington, DC. Zingg, A.W. 1940. Degree and length of land slope as it affects soil loss in runoff. Agric. Eng. 21:59-64. 44 APPENDIX A – EXAMPLE SINGLE STORM ANALYSIS The following example, using the single storm slope analysis option of ErosionWorks V9.1, utilizes the following 2-hr, 100-yr design rainfall data for the city of Fort Collins, Colorado: Time (hr:min) 12:00 12:15 12:30 12:45 13:00 13:15 13:30 13:45 14:00 Intensity (in/hr) 0 1.15 3.51 5.49 1.24 0.95 0.84 0.75 0.69 Project Conditions Uniform slope gradient = 2H:1V Slope length = 30 ft Soil will not be thawing over the course of project We will be final grading the site using a topsoil material We want to use an RECP to protect our slope No support practices will be applied We need our product to last a minimum of 24 months Click on “Slope Calculations” from the main menu on the left side of the screen. Remember to select “Single Storm” from the “Slope calculation type” drop down menu then enter the design storm and project information: 45 Click “Show Results” after all information has been entered to view the “Slope Analysis” screen: 46 Products with a minimum longevity of 24 months are displayed along with their performance information based on the design storm and project conditions that were entered. This quick single storm analysis really shows the importance of using RECPs for erosion control. From the report table, you can see that 1.7 tons/ac/event or .01 inches can be expected from the hillslope under the single storm design conditions if the slope was protected with Curlex III erosion control blankets (ECBs) or 21.5 tons/ac/event or .13 inches if a coconut ECB was used. On the other hand, 76.6 tons/ac or 0.47 inches can be expected from the same hillslope under the same single storm design conditions if the slope was left unprotected! This is an enormous difference and highlights the importance of utilizing erosion control products to achieve compliance with NPDES stormwater discharge regulations. 47 APPENDIX B – RUSLE UNITS AND CONVERSIONS RUSLE Factor I e EI Dimensions L/T LF/L2L LFL/L2T R LFL/L2TT K A A ML2T/L2LFL M/L2T M/L2T U.S. Customary Units in/hr ft*tonf/acre*inch hundreds of ft*tonf*inch/acre*hr hundreds of ft*tonf*inch/acre*hr*yr(event) ton*acre*hr/hundreds of acre*ft*tonf*in ton/acre*yr(event) ton/acre*yr(event) Multiply by to Obtain... 25.4 2.638*10-4 17.02 SI Units mm/h MJ/ha*mm MJ*mm/ha*h 17.02 MJ*mm/ha*h*y(event) 0.1317 2.242 0.2242 t*ha*h/ha*MJ*mm t/ha kg/m2 Note: tonf indicates ton force. : “hundreds of” means that the numerical value of the factor is .01 times its true value. That is, if R=125, its true value is 12,500 ft*tonf*in/ acre*h*yr. The converse is true for “hundreds of” in the denominator of a fraction. : hour and year are written in U.S. customary units as h and yr and in SI units as h and y. Mega=1*10^6. : I is the rainfall intensity. : e is the rainfall energy per unit of rainfall. : EI is the storm erosivity. Taken from: Renard, K.G, G.R. Foster, G.A. Weesies, D.K. McCool, and D.C. Yoder. 1997. Predicting soil erosion by water: a guide to conservation planning with the revised universal soil loss equation (rusle). USDA Agric. Handb. 703. Gov. Print. Office, Washington, D.C. 48