1
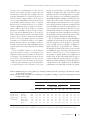
CARACTERIZACIÓN DEL CONSUMIDOR DE CARNE BOVINA EN LA ZONA METROPOLITANA DEL VALLE DE MÉXICO CHARACTERIZATION OF THE BEEF CONSUMER IN THE METROPOLITAN AREA OF THE VALLEY OF MÉXICO Ricardo Tellez-Delgado, J. Saturnino Mora-Flores*, M. Ángel Martínez-Damián, Roberto García-Mata, J. Alberto García-Salazar Economía. Campus Montecillo. Colegio de Postgraduados. 56230. Montecillo, Estado de México. ([email protected]). Resumen Abstract La carne bovina es un alimento importante para la nutrición del ser humano y el buen funcionamiento del organismo. La Zona Metropolitana del Valle de México es el principal centro de comercialización y consumo de este alimento en el país. El objetivo del presente estudio fue realizar una caracterización del consumidor de carne bovina en la Zona Metropolitana del Valle de México para conocer el tipo de productos que demanda, asociando variables como nivel de ingresos, nivel de consumo y servicios integrados, entre otras. La metodología empleada fue el algoritmo CHAID (Chi-squared Automatic Interaction Detection) y pruebas de asociación mediante la distribución X2, segmentando las variables cuantitativas y categóricas de carácter económico y social. La información se obtuvo mediante una encuesta semiestructurada, aplicada a 440 individuos. Para analizar la información se usaron tablas de contingencia y frecuencias relativas. El análisis de los resultados muestra que el ingreso y el consumo están correlacionadas positivamente (19.5 %) con los tipos de cortes de carne y su frescura; además se detectó una correlación positiva débil (10.7 %) con el tipo de expendio de venta y el tipo de empaque del producto. Se concluye que los consumidores con ingresos medios y bajos (37.2 %) demandan cortes populares (bistec, molida y retazo) que los compran principalmente en los mercados públicos. Beef is an important food for human nutrition and good functioning of the organism. The Metropolitan Area of the Valley of México is the principal center of commercialization and consumption of this food in the country. The objective of the present study was to carry out a characterization of the consumer of in the Metropolitan Area of the Valley of Mexico to know the type of products that are demanded, associating variables such as income level, consumption level and integrated services, among others. The methodology employed was the CHAID algorithm (Chi-squared Automatic Interaction Detection) and tests of association by means of the X2 distribution, segmenting the quantitative and categorical variables of economic and social level. The information was obtained by means of a semi-structured survey, applied to 440 individuals. To analyze the information, tables of contingency and relative frequencies were used. The analysis of the results shows that income and consumption are positively correlated (19.5 %) with the types of meat cuts and freshness; furthermore, a weak positive correlation was found (10.7 %) with the type of sales outlet and type of packaging of the product. It is concluded that consumers with middle and low incomes (37.2 %) demand popular cuts (steak, ground meat and remnant) which are purchased mainly in public markets. Palabras claves: algoritmo CHAID, carne bovina, consumidor, Zona Metropolitana. Key words: CHAID algorithm, beef, consumer, Metropolitan Area. Introducción Introduction L a carne bovina es un componente importante en la alimentación y nutrición humana. Es rica en proteínas, minerales (potasio, fósforo y B eef is an important component in human food and nutrition. It is rich in proteins, minerals (potassium, phosphorus and iron), and vitamins for the proper functioning of the organism (SE, 2006). Therefore it is necessary to * Autor responsable v Author for correspondence. Recibido: julio, 2011. Aprobado: diciembre, 2011. Publicado como ARTÍCULO en Agrociencia 46: 75-86. 2012. 75 AGROCIENCIA, 1 de enero - 15 de febrero, 2012 hierro), y vitaminas para el buen funcionamiento del organismo (SE, 2006). Por lo anterior es necesario un manejo adecuado de las especies de abasto, mediante la producción, procesamiento y aprovechamiento. La cadena producción-consumidor de la carne bovina está integrada por agentes que involucran al sector primario o ganaderos, los comercializadores y transportadores de ganado en pie, o de productos finalizados. El sector industrial está integrado por rastros de Tipo Inspección Federal (TIF), municipales y regionales de sacrificio, y empresas dedicadas a la transformación de la carne en otros productos (embutidos y cortes). Otro agente de la cadena son los comercializadores como las carnicerías, mercados y supermercados, que llevan el producto al consumidor. Del volumen total por tipos de carne consumido por la población mexicana, la carne bovina ocupa 28 %, aves 41 %, cerdo 26.5 % y los otros tipos de carnes (ovino, caprino principalmente) 4.5 % (SAGARPA, 2010). El mercado principal de la carne bovina en México es la Zona Metropolitana del Valle de México (ZMVM) donde, con 20 millones de habitantes, el consumo es 40 % y la comercialización 70 % del total nacional (FIRA, 2003). Esta región se abastece de carne del ganado engordado en algunos municipios aledaños del Estado de México (Chicoloapan, La Paz y Ecatepec de Morelos), los cuales abastecen casi 19 %. Otra proporción importante de la carne proviene de los rastros TIF de los estados de Veracruz, Jalisco, Chiapas, Tabasco, Sonora, Chihuahua y Sinaloa (SIAP, 2010). En las regiones Bio-Bio y Araucanía en Chile, Schnettler et al. (2008) evaluaron los hábitos de consumo de los principales tipos de carne y aplicaron 770 encuestas a compradores y consumidores de carne. Encontraron una gran diferencia en la frecuencia y tipos de carne demandados, de acuerdo con las características sociodemográficas del consumidor. En la Región del Papaloapan, Veracruz, México, Vilaboa et al. (2009) aplicaron 286 entrevistas semiestructuradas a consumidores y observaron que los consumidores demandan carne bovina de una a tres veces por semana, pero la mayoría desconoce la procedencia, raza y tipo de bovino de carne. La ZMVM es el principal centro de consumo de carne bovina nacional, por lo que el objetivo de este estudio fue realizar un análisis del tipo de consumidores, considerando el nivel de ingreso, el tipo de cortes 76 VOLUMEN 46, NÚMERO 1 have an adequate management of the supply species, through their production, processing and use. The production-consumer chain of beef is integrated by agents that involve the primary sector or cattle breeders, the marketers and transporters of livestock, or of finished products. The industrial sector is integrated by slaughterhouses of Federal Inspection Type (FIT), municipal and regional slaughters, and businesses dedicated to the transformation of meat into other products (sausages and cuts). Another agent of the chain is the retailer, such as butcher shops, markets and supermarkets, which bring the product to the consumer. Of the total volume by types of meat consumed by the Mexican population, beef occupies 28 %, poultry 41 %, pork 26.5 % and other types of meats (sheep and goat, principally) 4.5 % (SAGARPA, 2010). The principal beef market in Mexico is the Metropolitan Area of the Valley of México (MAVM), where with 20 million inhabitants, consumption is 40 % and marketing 70 % of the national total (FIRA, 2003). This region is supplied with meat of cattle fattened in some neighboring municipalities of the Estado de México (Chicoloapan, La Paz and Ecatepec de Morelos), which supply nearly 19 %. Another important proportion of meat comes from the FIT slaughterhouses of the states of Veracruz, Jalisco, Chiapas, Tabasco, Sonora, Chihuahua and Sinaloa (SIAP, 2010). In the Bio-Bio and Araucanía regions of Chile, Schnettler et al. (2008) evaluated the consumption habits of the principal types of meat and the sociodemographic characteristics of the consumers; they applied 770 questionnaires to buyers and consumers of meat. They found a great difference in the frequency and types of meat demanded, according to the sociodemographic characteristics of the consumer. In the Papaloapan Region of Veracruz, México, Vilaboa et al. (2009) applied 286 semi-structured interviews to consumers and they observed that the consumers demand beef one to three times a week, but most ignore its origin, race and type of beef cattle. The MAVM is the principal center of national beef consumption, thus the objective of the present study was to carry out an analysis of the type of consumers, considering the income level, type of cuts demanded, the establishments where the meat is bought, as well as the services integrated to the product which add to its value. The hypothesis was CARACTERIZACIÓN DEL CONSUMIDOR DE CARNE BOVINA EN LA ZONA METROPOLITANA DEL VALLE DE MÉXICO de carne demandada, los establecimientos donde se compra la carne, así como los servicios integrados al producto que le dan un mayor valor. La hipótesis fue que hay un mercado de carne bovina diferenciado por cortes para los distintos estratos de consumidores por niveles de ingreso, y que la mayor demanda del producto la constituyen piezas con pocos servicios integrados y sin diferenciación. Materiales y Métodos La caracterización de los consumidores de carne bovina de la ZMVM comprendió 18 municipios del área conurbada del Estado de México: Atizapán de Zaragoza, Cuautitlán Izcalli, Coacalco de Berriozábal, Cuautitlán, Chalco, Chicoloapan, Chimalhuacán, Ecatepec de Morelos, Huixquilucan, Ixtapaluca, La Paz, Nicolás Romero, Naucalpan de Juárez, Nezahualcóyotl, Tecámac, Tlalnepantla de Baz, Tultitlán y Valle de Chalco Solidaridad; y las 16 Delegaciones del Distrito Federal: Álvaro Obregón, Azcapotzalco, Benito Juárez, Coyoacán, Cuajimalpa de Morelos, Cuauhtémoc, Gustavo A. Madero, Iztacalco, Iztapalapa, La Magdalena Contreras, Miguel Hidalgo, Milpa Alta, Tláhuac, Tlalpan, Venustiano Carranza y Xochimilco. En el estudio se usó un método de análisis multivariado llamado algoritmo CHAID (Chi-squared Automatic Interaction Detection) que mediante una técnica de análisis de segmentación de variables (explicadas y explicativas) permite establecer relaciones de dependencia entre las mismas; con estas variables se formaron arboles de respuestas usando frecuencias relativas en sus relaciones (Escobar, 1998). Para analizar las variables se usó SPSS cuya característica es realizar la segmentación de variables para formar más de dos categorías al unísono, y por tanto se usa en las ciencias sociales para efectuar análisis económicos y sociológicos; además integra el algoritmo para realizar las pruebas de Chi-cuadrada (SPSS, 2008). Para obtener la información de los consumidores de la ZMVM se diseñó una encuesta semiestructurada que contempla variables cuantitativas y categóricas de carácter económico y social. En el cálculo de la muestra se partió de la población total a entrevistar en la ZMVM, 18 240 060 habitantes según la Encuesta de Población y Vivienda del INEGI (2005). El tamaño de la muestra se obtuvo mediante la siguiente ecuación: that there is a beef market differentiated by cuts for the different strata of consumers by income level, and that the highest demand of the product is comprised of cuts with few integrated services and without differentiation. Materials and Methods The characterization of the beef consumers of the MAVM included 18 municipalities of the surrounding area of the Estado de México: Atizapán de Zaragoza, Cuautitlán Izcalli, Coacalco de Berriozábal, Ecatepec de Morelos, Huixquilucan, Ixtapaluca, La Paz, Nicolás Romero, Naucalpan de Juárez, Nezahualcóyotl, Tecámac, Tlalnepantla de Baz, Tultitlán and Valle de Chalco Solidaridad; and the 16 Delegations of the Federal District; Álvaro Obregón, Azcapotzalco, Benito Juárez, Coyoacán, Cuajimalpa de Morelos, Cuauhtémoc, Gustavo A. Madero, Iztacalco, La Magdalena Contreras, Miguel Hidalgo, Milpa Alta, Tláhuac, Tlalpan, Venustiano Carranza and Xochimilco. In the study a multivariate analysis method was used known as the CHAID algorithm (Chi-squared Automatic Interaction Detection), which through a technique of analysis of segmentation of variables (explained and explicative) makes it possible to establish relationships of dependence among the variables; with these variables response trees were formed using relative frequencies in their relationships (Escobar, 1998). To analyze the variables SPSS was used, whose characteristic is to carry out the segmentation of variables to form more than two categories at the same time, and therefore, is used in the social sciences to make economic and sociological analyses; furthermore, it integrates the algorithm to carry out the Chisquared tests (SPSS, 2008). To obtain the information of the consumers of the MAVM, a semi-structured survey was designed which contemplates quantitative and categorical variables of economic and social character. In the calculation of the sample, the total population to be interviewed in the MAVM was taken as the departure point, 18 240 060 inhabitants according to the Population and Housing Survey of the INEGI (2005). The size of the sample was obtained by means of the following equation: n n d i ( p )( q )( N ) Z E 2 aN 1f Z 2 d i ( p )( q )( N ) Z 2 E 2 aN 1f Z 2 ( p )( q ) (1) 2 ( p )( q ) (1) donde, N es la población total del universo de estudio (18 240 060 habitantes); n es el tamaño de la muestra; p es el porcentaje estimado where N is the total population of the universe of study (18 240 060 inhabitants); n is the size of the sample; p is the estimated percentage of positive variability (50 %); q=100-p (negative variability); E is the error or precision of estimation permitted (5 %); Z is the confidence level: Z of squares = 1.96. Substituting values: TELLEZ-DELGADO et al. 77 AGROCIENCIA, 1 de enero - 15 de febrero, 2012 de variabilidad positiva (50 %); q=100-p (variabilidad negativa); E es el error o precisión de estimación permitido (5 %); Z es el nivel de confianza: Z de cuadros = 1.96. Sustituyendo valores: n ( 0.50 )( 0.50 )(18 240 060 )(1.96 )2 0.052 (18 240 060 1) 4( 0.50 )( 0.50 ) 384 entrevistas (2) El tamaño de la muestra calculado fue 384 individuos a entrevistar pero se realizaron 440 encuestas. El tamaño de la muestra se obtuvo para un muestreo no probabilístico por cuotas; el criterio de selección de los individuos fue su disposición a ser entrevistados. Las 440 entrevistas se obtuvieron en las delegaciones y municipios jerarquizándolas de mayor a menor en densidad poblacional, los individuos fueron entrevistados en las carnicerías, mercados públicos, centros comerciales, parques y expendios de alimentos. Las variables en la encuesta se consideraron en dos bloques: 1) primero se preguntaba nombre, lugar de origen, género, edad, escolaridad y número de integrantes de la familia; 2) luego se inquirió acerca del monto de ingreso familiares, cantidad e ingreso destinado a la compra de alimentos y carne, preferencias sobre el tipo de carne (pollo, res y cerdo), restricciones para consumir carne, frecuencia (semanal o mensual) del consumo de carne, tipo de piezas o cortes consumidas, precios, lugares de adquisición, servicios agregados a la carne, etc. La clasificación del nivel ingreso se hizo de acuerdo con la zona geográfica del país y el salario total que perciben dentro de la familia del entrevistado. Los niveles de ingreso fueron: menos de $5000.00 ingresos bajos, de $5001.00 a $15 000.00 ingresos medios y más de $15 000.00 ingresos altos. Un ingreso máximo de $5 000.00 mensuales para los estratos de consumidores con ingresos bajos equivale a un percepción familiar diaria de $166.66, el cual está en el rango de los menores salarios percibidos por los trabajadores de menores ingresos de la región (trabajadoras domesticas y peones), quienes perciben entre $100.00 y $200.00 al día; estos trabajadores no se contratan al salario mínimo indicativo de la zona ($58.13) (CONASAMI, 2011). Los niveles de consumo se clasificaron de la forma siguiente: frecuencia de 1 a 5 veces por mes, consumo bajo; 6 a 15 veces al mes, consumo medio; más de 16 veces, consumo alto. Los datos obtenidos de las entrevistas se recolectaron durante el primer cuatrimestre de 2010 y se copiaron en una plantilla estructurada de la hoja de cálculo de EXCEL. Mediante SPSS 17.0 (2008) se analizaron las variables en tablas de contingencia personalizadas para obtener frecuencias, realizar pruebas de hipótesis y dispersión. 78 VOLUMEN 46, NÚMERO 1 n ( 0.50 )( 0.50(18240060 )(1.96 )2 0.052 (18240060 1) 4( 0.50 )( 0.50 ) 384 interviews (2) The calculated size of the sample was 384 individuals to interview, but 440 interviews were carried out. The sample size was obtained for a non-probabilistic sampling by quotas; the selection criterion of the individuals was their disposition to be interviewed. The 440 interviews were obtained in the delegations and municipalities putting them in hierarchies of highest to lowest in population density, the individuals were interviewed in butcher shops, public markets, shopping centers, parks and food suppliers. The variables in the survey were considered in two blocks: 1) first, name, place of birth, sex, age, educational level and number of family members were asked; 2) then, questions were asked about the amount of family income, amount and income destined to the purchase of food and meat, preferences of the type of meat (broiler, beef and pork), restrictions of meat consumption, frequency (weekly or monthly) of meat consumption, type of pieces or cuts consumed, prices, places of purchase, services added to the meat, etc. The classification of the income level was made according to the geographic zone of the country and the total salary earned within the family of the person interviewed. The income levels were: less than $5000.00 low income, from $5001.00 to $15 000.00 middle income and more than $15 000.00 high income. A maximum income of $5000.00 per month for the consumers strata of consumers with low levels is equivalent to a daily family income of $166.66, which is found among the rank of the lowest salaries perceived by the workers of lowest income of the region (maids and laborers), who earn between $100.00 and $200.00 per day; these workers do not work for the minimum wage indicative of the zone ($58.13) (CONASAMI, 2011). The consumption levels are classified as follows: frequency of 1 to 5 times per month, low consumption: 6 to 15 times per month, moderate consumption; more than 16 times, high consumption. The data obtained from the interviews was collected during the first quarter of 2010 and were copied in a structured format of the calculation page of EXCEL. The variables were analyzed by means of SPSS 17.0 (2008) in personalized contingency tables to obtain frequencies, carry out hypothesis and dispersal tests. Results and Discussion The sample of the consumers interviewed was integrated mainly by women (91.1 %), with an average age of between 30 and 59 years, pertaining to a family with three to four members. With respect CARACTERIZACIÓN DEL CONSUMIDOR DE CARNE BOVINA EN LA ZONA METROPOLITANA DEL VALLE DE MÉXICO Resultados y Discusión La muestra de los consumidores entrevistados estuvo integrada principalmente por mujeres (91.1 %), con una edad promedio entre 30 y 59 años, pertenecientes a una familia con tres a cuatro personas. Respecto a la escolaridad, 54.5 % había cursado secundaria y preparatoria, 23.9 % primaria o menos, y sólo 21.6 % tenía licenciatura o superior. En cuanto a la decisión de compra de alimentos para el hogar el 87.7 % de los entrevistados toma la decisión. Además, 56.4 % de los individuos de la ZMVM gasta 21 a 50 % del ingreso familiar en alimentos, mientras que 30 % destina sólo 20 % del ingreso familiar a este rubro. El consumo de carne en la población es 79.5 % de carne de res y la mayoría (46.8 %) tiene un consumo medio de 6 a 15 veces al mes, en tanto que 28.0 % presenta un consumo bajo de 5 veces o menos al mes. Otro rubro importante es el tipo de consumidores por nivel de ingreso mensual y el tipo de cortes de carne bovina que adquiere el consumidor: 1) 51.4 % tiene ingresos bajos, 36.4 % tiene ingresos medios, y sólo 12.4 % tiene ingresos altos; 2) 68.4 % compra cortes populares, 10.5 % cortes populares y especiales, y 0.7 % sólo cortes especiales. De acuerdo con la población entrevistada, 74.3 % no presenta restricciones para consumir cualquier tipo de carne (res, cerdo y pollo), en tanto que 25 % muestra limitaciones para consumir principalmente carne bovina y cerdo. Las causas para no consumir esas carnes son principalmente colesterol alto (4.8 %), diabetes (2.7 %), presión arterial alta (2 %) y ácido úrico elevado (1.8 %). El análisis de resultados en la segunda parte se realizó mediante la formación de arboles de respuestas con las frecuencias relativas. Estos árboles de respuestas relacionan variables en la parte superior como niveles de consumo e ingreso, con variables en la parte inicial del cuadro como tipo de cortes demandados por el consumidor, lugar donde compra la carne o servicios integrados. Se supone que las variables en ambos lados de los cuadros son aleatorias y el cruce entre casillas de las variables muestra su correlación. El análisis de resultados se sustenta además en las pruebas de X2, las cuales al obtener una X2c calculada, y contrastarla con una X2t de tablas, expresará en su regla de decisión que si X2c<X2t, entonces se acepta la hipótesis nula (Ho) de que la distribución de las to educational level, 54.5 % had finished junior and senior high school, 23.9 % elementary school or less, and only 21.6 % had a bachelor’s degree or higher. With respect to the food purchase decision for the home, 87.7 % of those interviewed make the decision. Furthermore, 56.4 % of the individuals of the MAVM spends 21 to 50 % of the family income on food, whereas 30 % destines only 20 % of the family income to this purpose. The meat consumption of the population is 79.5 % beef and the majority (46.8 %) have an average consumption of 6 to 15 times a month, while 28.0 % presents a low consumption of 5 times or less per month. Another important category is the type of consumers per monthly income level and the type of beef cuts acquired by the consumer: 1) 51.4 % has low income, 36.4 % has middle income, and only 12.4 % has high income; 2) 68.4 % buys popular cuts, 10.5 % popular and special cuts, and 0.7 % only special cuts. According to the population interviewed, 74.3 % does not present restrictions for consuming any type of meat (beef, pork and broiler), while 25 % have limitations for consuming principally beef and pork. The causes for not consuming these meats are principally high cholesterol (4.8 %), diabetes (2.7 %), high blood pressure (2 %) and high uric acid (1.8 %). The analysis of results in the second part was carried out by means of the formation of response trees with the relative frequencies. These response trees relate variables in the upper section as levels of consumption and income, with variables in the initial part of the table such as type of cuts demanded by the consumer, where he buys the meat or integrated services. It is assumed that the variables on both sides of the tables are random and the cross among compartments of the variables shows their correlation. The analysis of results is also sustained in the tests of X2, which by obtaining a calculated X2c, and contrasted with an X2t of tables, will express in its rule of decision that if X2c<X2t, then the null hypothesis is accepted (Ho) that the distribution of the responses in the compartments in the tables is uniform; in contrast, if X2c>X2t, the alternative hypothesis is accepted (Ha), that the distribution among the compartments is different. The X2 calculated for the different levels of consumption and income with respect to the type of cuts demanded by the consumer (popular or special TELLEZ-DELGADO et al. 79 AGROCIENCIA, 1 de enero - 15 de febrero, 2012 repuestas en las casillas en los cuadros es uniforme; por el contrario si X2c> X2t se acepta la hipótesis alternativa (Ha) de que la distribución entre las casillas es diferente. Las X2 calculadas para los distintos niveles de consumo e ingreso respecto al tipo de cortes que demanda el consumidor (cortes populares o especiales) son 45.83, 76.26 y 9.8, y la probabilidad de encontrar una X2c menor a la X2t es prácticamente cero, por lo que se acepta Ha; es decir, hay diferencia en las correlaciones entre las variables. Las correlaciones positivas entre variables (Cuadro 1) indican que los niveles de consumo bajo y medio decantados con los niveles de ingreso bajo y medio presentan la mayor correlación positiva con la demanda de cortes populares (bistec, molida y retazo), mientras que la demanda de cortes especiales (ribye, sirloin, T-bone y New York) es marginal para los distintos niveles de consumo e ingreso. Al respecto, Benítez et al. (2010) señalan que en los países en desarrollo como México al aumentar el ingreso también aumenta el gasto en el consumo de carne y, por ende, la cantidad demandada. Es decir, las variables ingreso y consumo están correlacionadas con el tipo de carne que demanda el consumidor. El análisis estadístico de las X2 de los resultados indica que sólo para la variable consumo bajo con nivel de ingreso bajo en su relación con la cantidad de tipos de cortes populares que demanda el consumidor es 32.40, y la probabilidad de encontrar una cuts) are 45.83, 76.26 and 9.8, and the probability of finding an X2c lower than X2t is practically zero, thus Ha is accepted; that is, there is difference in the correlations among the variables. The positive correlations among variables (Table 1) indicate that the levels of low and moderate consumption decanted with the low and middle income levels present the highest positive correlation with the demand of popular cuts (steak, ground meat and trimmings), whereas the demand of special cuts (rib-eye, sirloin, T-bone and New York) is marginal for the different levels of consumption and income. To this respect, Benítez et al. (2010) point out that in the developing countries such as México, as the income increases, so does the expenditure in meat consumption, and therefore, the amount demanded. That is, the variables income and consumption are correlated with the type of meat demanded by the consumer. The statistical analysis of the X2 of the results indicates that only for the variable low consumption with low income level in its relationship with the amount of types of popular cuts demanded by the consumer is 32.40, and the probability of finding an X2c higher than X2t is practically zero. Therefore, the relationship between consumption level and low income is strongly correlated with the number of popular cuts that are demanded. The values of X2 for the high and middle levels of consumption and Cuadro 1. Tipo de corte que consume la población, según su ingreso y frecuencia de consumo de carne bovina (porcentaje). Table 1. Type of cut consumed by the population, according to their income and frequency of beef consumption (percentage). Cuántas veces al mes consumen carne bovina No consumen Consumo bajo Consumo medio Consumo alto Ingreso familiar al mes Total Tipo de corte consume: que especial, popular o ambos cortes Ningún corte Corte especial Corte popular Corte especial y popular Total IB IM IA IB IM IA IB IM IA IB IM IA 20.7 0.7 68.3 10.7 6.4 0. 0.0 0.0 0.0 3.4 0.0 0.0 0.0 0.0 18.0 0.2 0.0 7.5 0.0 0.5 0.7 0.0 0.0 19.5 0.0 0.0 17.7 0.0 0.2 1.4 0.0 0.0 1.6 0.0 0.0 1.4 0.0 0.0 0.5 10.4 100.0 0.0 0.0 10.7 6.4 0.0 3.4 0.5 18.5 0.5 8.2 0.2 1.4 1.1 20.6 2.5 20.2 4.3 5.9 0.0 1.6 0.2 1.6 1.1 1.6 IB: ingreso bajo ($5000.00 o menos de ingreso mensual); IM: ingreso medio ($5001.00 hasta $15 000.00 mensuales); IA: ingreso alto (más de $15 001.00 mensuales) v IB: low income ($5000.00 or less monthly income); IM: middle income ($5001.00 to $15 000.00 monthly); IA: high income (more than $15 000.00 monthly income). Fuente: elaboración propia con datos obtenidos de la encuesta v Source: made by the authors with data obtained from the survey. 80 VOLUMEN 46, NÚMERO 1 CARACTERIZACIÓN DEL CONSUMIDOR DE CARNE BOVINA EN LA ZONA METROPOLITANA DEL VALLE DE MÉXICO X2t mayor a X2c es prácticamente cero. Por tanto, la relación entre nivel de consumo e ingreso bajo está fuertemente correlacionada con el numero de cortes populares demandados. Los valores de X2 para los niveles de consumo e ingreso medios y altos son 11.42 y 8.12, y la probabilidad de encontrar una X2 mayor a las de tablas es 0.33 y 0.09; por tanto, se acepta la hipótesis nula. La situación anterior no es estadísticamente significativa para los niveles de consumo e ingreso medios y altos. En el Cuadro 2 se muestra que para el consumidor de bajo consumo e ingreso bajo es relevante la demanda de uno o dos cortes populares, mientras que para niveles de consumo medio e ingresos bajos y medios es importante la demanda de uno o dos cortes populares de carne. Lo anterior concuerda con el estudio de Vilaboa et al. (2009), quienes muestran que los consumidores varían su consumo de acuerdo con la disponibilidad de dinero y que el interés de la compra depende de la cantidad y precio. Las X2c calculadas (Cuadro 3) con los distintos niveles de consumo e ingreso en su relación con la adquisición del producto en tiendas de autoservicio son grandes, y la probabilidad de encontrar X2t mayores a las X2c son prácticamente cero. Por tanto, la compra de carne bovina en tiendas de autoservicio es relevante para los distintos tipos de consumidores y su nivel de ingreso. Por el contrario, las X2c para income are 11.42 and 8.12, and the probability of finding an X2 higher than that of the tables is 0.33 and 0.09; therefore, the null hypothesis is accepted. The above situation is not statistically significant for the middle and high consumption and income levels. Table 2 shows that for the consumer of low income and consumption, the demand of one or two popular cuts is relevant, while for moderate consumption and low and middle income levels, the demand for one or two popular cuts is important. The above concurs with the study of Vilaboa et al. (2009), who show that the consumers vary their consumption according to the availability of money and that the interest of the purchase depends on the amount and the price. The X2c calculated (Table 3) with the different consumption and income levels in their relationship with the acquisition of the product in self-service stores are high, and the probability of finding X2t higher than the X2c are practically zero. Therefore, the acquisition of beef in self-service stores is relevant for the different types of consumers and their income level. In contrast, the X2c for the acquisition of the product in public markets and neighborhood butcher shops in their relationship with the type of consumers and their income levels are not relevant, and the probability of finding X2t higher than the X2c is high; therefore, the distribution of the different compartments is rejected (Ha), and (Ho) is accepted. Cuadro 2.Cantidad de tipos de cortes populares que consume la población de acuerdo con su ingreso y frecuencia de consumo de carne bovina (porcentaje). Table 2. Amount of types of popular cuts consumed by the population according to their income and frequency of beef consumption (percentage). Cuántas veces al mes consumen carne bovina No consumen Consumo bajo Consumo medio Consumo alto Ingreso familiar al mes Total IB IM IA IB IM IA IB IM IA IB IM IA Cantidad de tipos de cortes populares que se consumen 21.4 29.2 27.9 17.4 3.2 0.6 99.7 10.7 0.0 0.0 0.0 0.0 0.0 10.7 6.4 0.0 0.0 0.0 0.0 0.0 6.4 3.4 0.0 0.0 0.0 0.0 0.0 3.4 0.0 7.7 5.2 4.5 0.7 0.2 18.3 0.2 4.1 3.0 0.9 0.0 0.0 8.2 0.5 0.7 0.2 0.0 0.0 0.0 1.4 0.0 7.0 8.6 3.4 1.4 0.2 20.6 0.0 7.0 7.5 4.5 0.9 0.2 20.1 0.2 2.5 1.4 1.6 0.2 0.0 5.9 0.0 0.2 1.1 0.2 0.0 0.0 1.5 0.0 0.0 0.2 1.4 0.0 0.0 1.6 0.0 0.0 0.7 0.9 0.0 0.0 1.6 Ningún corte Un corte Dos cortes Tres cortes Cuatro cortes Cinco cortes Total IB: ingreso bajo; IM: ingreso medio; IA: ingreso alto v IB: low income; IM: middle income; IA: high income. Fuente: elaboración propia con datos obtenidos de la encuesta v Source: made by the authors with data obtained from the survey. TELLEZ-DELGADO et al. 81 AGROCIENCIA, 1 de enero - 15 de febrero, 2012 Cuadro 3. Pruebas de Chi-cuadrada de Pearson del Cuadro 4. Table 3. Pearson Chi-squared tests of Table 4. Cuántas veces al mes consumen carne bovina No consumen Consumo bajo Consumo medio Consumo alto Ingreso familiar al mes Tiendas de autoservicio Chi cuadrada G.l. Sig. . . . 37.593 2 .000° 41.960 2 .000° 14.127 2 .001† Mercados públicos Carnicerías del barrio Chi cuadrada G.l. Sig. Chi cuadrada G.l. Sig. . . . . . . 2.887 2 .236 5.473 2 .065 2.513 2 .285 5.727 2 .057 .382 2 .826 2.827 2 .243 El estadístico de Chi-cuadrada es significativo (p£0.05). v The Chi-squared statistic is significant (p£0.05). Fuente: Cuadro 4 y el programa SPSS v Source: Table 4 and the program SPSS. † la adquisición del producto en mercados públicos y carnicerías del barrio en su relación con el tipo de consumidores y sus niveles de ingreso no son relevantes, y la probabilidad de encontrar X2t mayores a las X2c es alta; por tanto, la distribución de las diferentes casillas se rechaza (Ha), y se acepta (Ho). El lugar más importante donde se compra la carne son las tiendas de autoservicios para todos los estratos de consumo y de ingreso, en tanto que la compra en mercados públicos y carnicerías del barrio también es relevante, pero no significativa para la diferenciación por estratos de consumidores y niveles de ingreso, de acuerdo con las pruebas estadísticas (Cuadro 4). Según Segovia et al. (2005), una alta proporción (38 %) compra carne bovina en carnicerías cerca de su casa, otros lo hacen en mercados populares (21 %), y sólo una baja proporción (6 %) en supermercados. Esos resultados contrastan con los del presente estudio, debido a que en el Valle de México la compra de carne bovina en las tiendas de autoservicio es importante para todos los estratos de consumidores, quienes no hacen diferencia para adquirir el producto en carnicerías de barrio y mercados públicos. Las X2c para los distintos niveles de ingreso y consumo en su relación con el tipo de carne bovina que se adquiere, ya sea sin refrigerar (fresca o caliente) o refrigerada, son altas, y la probabilidad de encontrar X2t mayores a las X2c es prácticamente cero; por tanto hay una distribución diferenciada de las frecuencias 82 VOLUMEN 46, NÚMERO 1 The most important place where beef is bought is the self-service stores for all strata of consumption and income, while the acquisition in public markets and neighborhood butcher shops is relevant, but not significant for the differentiation by strata of consumers and income levels, as shown the statistical tests (Table 4). According to Segovia et al. (2005), a high proportion (38 %) buys the beef in butcher shops near home, others do so in popular markets (21 %), and only a low proportion (6 %) in supermarkets. Those results contrast with those found in the present study, due to the fact that in the Valley of México the purchase of beef in self-service stores is important for all strata of consumers, and they do not make a difference for acquiring the product in neighborhood butcher shops or public markets. The X2c for the different income and consumption levels in their relationship with the type of beef acquired, whether it is without refrigeration (fresh or warm) or refrigerated, are high, and the probability of finding X2t higher than the X2c are practically zero, thus there is a differentiated distribution of the frequencies in the compartments (Table 5). Indeed, a positive correlation is observed among the income levels (low and middle) for unrefrigerated beef consumption; also high are the correlations of low and moderate consumption with middle and high income levels, with the demand of refrigerated CARACTERIZACIÓN DEL CONSUMIDOR DE CARNE BOVINA EN LA ZONA METROPOLITANA DEL VALLE DE MÉXICO Cuadro 4. Tipos de tienda donde se compra carne bovina de acuerdo al ingreso y frecuencia de consumo (porcentaje). Table 4. Types of store where beef is bought according to income and frequency of consumption (percentage). Cuántas veces al mes consumen carne bovina Consumo bajo Consumo medio Consumo alto Ingreso familiar al mes Total IB IM IA IB IM IA IB IM IA Tiendas de autoservicio 27.4 1.4 4.2 1.2 3.7 9.3 5.1 0.0 0.9 1.6 Tipos de expendios que compra la carne el consumidor Mercado público 37.0 8.9 3.0 0.2 9.6 10.7 2.1 0.7 0.9 0.9 5.2 1.9 0.7 0.0 1.4 0.7 0.0 0.0 0.5 0.0 Carnicería del barrio 28.2 8.2 2.6 0.0 8.4 6.3 0.9 0.9 0.7 0.2 Central de abasto 0.8 0.2 0.2 0.2 0.2 0.0 0.0 0.0 0.0 0.0 Matanza con algún vecino 0.2 0.0 0.0 0.0 0.2 0.0 0.0 0.0 0.0 0.0 Otro 0.7 0.5 0.0 0.0 0.0 0.2 0.0 0.0 0.0 0.0 Total 99.5 21.1 10.7 1.6 23.5 27.2 8.1 1.6 3.0 2.7 Tianguis o mercado sobre ruedas IB: ingreso bajo; IM: ingreso medio; IA: ingreso alto v IB: low income; IM: middle income; IA: high income Fuente: Elaboración propia con datos obtenidos de la encuesta v Source: made by the authors with data obtained from the survey. en las casillas (Cuadro 5). Efectivamente, hay correlación positiva entre los niveles de ingreso (bajo y medio) para consumo de carne bovina sin refrigerar; también son relevantes las correlaciones de consumo bajo y medio con niveles de ingreso medios y altos, con la demanda de carne bovina refrigerada (Cuadro 6). Las cifras anteriores muestran que la mayoría de los consumidores con ingresos bajos y medios consumen principalmente carne fresca sin refrigerar, y para consumidores con ingresos medios y altos, también es relevante la demanda de carne refrigerada, pero en menor proporción que el consumo en fresco. Vilaboa et. al. (2009) indican que los segmentos de consumidores de mayores ingresos compran carne bovina en los supermercados, porque ahí el producto es sanitariamente más confiable, al ofrecer productos refrigerados. Esos resultados concuerdan con los del presente estudio donde consumidores con ingresos beef (Table 6). The above figures show that the majority of consumers with low and middle incomes consume mainly unrefrigerated fresh beef, and for consumers with middle and high incomes, the demand of refrigerated beef is also relevant, but in a smaller proportion than fresh beef consumption. Vilaboa et al. (2009) point out that the segments of consumers with highest income purchase the beef in the supermarkets, because there the hygiene of the product is more reliable, by offering refrigerated beef. Those results agree with those found in the present study where consumers with low and middle incomes demand unrefrigerated fresh beef, whereas higher income levels demand the frozen product with higher value. The X2c that correlate the strata of consumers and their income levels with the services provided to the beef (properly refrigerated and packaged in TELLEZ-DELGADO et al. 83 AGROCIENCIA, 1 de enero - 15 de febrero, 2012 Cuadro 5. Pruebas de Chi-cuadrada de Pearson del Cuadro 6. Table 5. Pearson Chi-squared tests from Table 6. Cuántas veces al mes consumen carne bovina No consumen Consumo bajo Consumo de carne bovina refrigerada o sin refrigerar Chi cuadrada G.l. Sig. Consumo medio Consumo alto Ingreso familiar al mes . . . 41.905 6 0.000 45.742 6 0.000 14.150 4 0.007† El estadístico de Chi-cuadrada es significativo (p£0.05) v The Chi-squared statistic is significant (p£0.05). Fuente: Cuadro 6 y el programa SPSS v Source: Table 6 and the program SPSS. † Cuadro 6. Consumo de carne bovina en frio o caliente que consume la población de acuerdo con su ingreso y frecuencia de consumo (porcentaje). Table 6. Cold or warm beef consumption of the population according to income and frequency of consumption (percentage). Cuántas veces al mes consumen carne bovina Consumo bajo Consumo medio Ingreso familiar al mes Total IB IM IA Consumo de carne bovina refrigerada o sin refrigerar 21.2 10.7 14.8 0.0 52.0 0.0 6.4 0.0 0.0 11.9 0.0 99.9 10.7 0.0 6.4 No consume Refrigerada Sin refrigerar Refrigerada y sin refrigerar Total Consumo alto IB IM IA IB IM IA IB IM IA 3.4 0.5 0.0 0.5 0.0 16.6 0.0 2.5 4.1 0.0 0.9 0.2 0.0 2.7 17.0 0.2 4.5 10.9 0.0 3.0 0.9 0.0 0.0 1.6 0.0 0.0 0.2 0.5 0.7 0.0 0.0 0.9 3.4 18.5 1.6 8.2 0.2 1.3 0.9 20.6 4.5 20.1 2.0 5.9 0.0 1.6 0.7 1.1 1.6 1.6 IB: ingreso bajo; IM: ingreso medio; IA: ingreso alto v IB: low income; IM: middle income; IA: high income. Fuente: Elaboración propia con datos obtenidos de la encuesta v Source: made by the authors with data obtained from the survey. bajos y medios demandan carne fresca sin refrigerar, en tanto que mayores niveles de ingresos demandan el producto congelado con mayor valor. Las X2c que correlacionan a los estratos de consumidores y sus niveles de ingreso con los servicios proporcionados a la carne ����������������������� bovina (debidamente ���������������� refrigerada y empacada en charolas de unicel, o cortadas en piezas sin refrigerar y despachada en bolsas de plástico), son altas, y las probabilidades de encontrar X2c mayores a las X2t son prácticamente de cero. Por tanto hay correlaciones distintas entre los consumidores y los servicios demandados en la carne bovina (Cuadro 7). Estos resultados estadísticos se validan con las correlaciones positivas entre las variables mostradas en el Cuadro 8, donde se observa que la de- 84 VOLUMEN 46, NÚMERO 1 Styrofoam trays, or cut in unrefrigerated pieces and sold in plastic bags), are high, and the probabilities of finding X2c higher than the X2t are practically zero. Therefore, there are different correlations among the consumers and the services demanded in the beef (Table 7). The above statistical results are validated with the positive correlations among the variables shown in Table 8, where it observed that the demand of beef properly refrigerated and packaged in Styrofoam trays is relevant for the different strata of consumers with low, middle and high incomes. Also, the beef with least added value (cut in pieces and sold in plastic bags) is demanded by the consumers of low income and consumption, that is, the poorest. CARACTERIZACIÓN DEL CONSUMIDOR DE CARNE BOVINA EN LA ZONA METROPOLITANA DEL VALLE DE MÉXICO Cuadro 7. Pruebas de Chi-cuadrada de Pearson del Cuadro 8. Table 7. Pearson Chi-squared tests from Table 8. Cuántas veces al mes consumen carne bovina No consumen Consumo bajo Consumo medio Consumo alto Ingreso familiar al mes Debidamente refrigerada Chi cuadrada G.l. Sig. . . . 0.544 2 0.762 14.646 2 0.001 0.404 2 0.817† Cortes empacados en charolas de unicel Chi cuadrada G.l. Sig. . . . 28.547 2 0.000 40.066 2 0.000 14.127 2 0.001 Carne cortada en Chi cuadrada piezas y en su bolsa G.l. de plástico Sig. . . . 10.754 2 0.005 1.945 2 0.378 1.167 2 0.558† El estadístico de Chi-cuadrada es significativo (p£0.05) v The Chi-squared statistic is significant (p≤0.05). Fuente: Cuadro 8 y programa SPSS v Source: Table 8 and the program SPSS. † Conclusions manda de carne bovina debidamente refrigerada y empacada en charolas de unicel es relevante para los distintos estratos de consumidores con ingresos bajos, medios y altos. Y que la carne con menor valor agregado (cortada en piezas y despachada en bolsas de plástico), es demandada por los consumidores In the Metropolitan Area of the Valley of Mexico, beef consumption is massive due to the high population concentration and because it is one of the principal preferred meats. Beef is present on Cuadro 8. Tipo de servicio agregado a la carne bovina que consume la población de acuerdo con su ingreso y frecuencia de consumo (porcentaje). Table 8. Type of service added to the beef consumed by the population according to their income and frequency of consumption (percentage). Cuántas veces al mes consumen carne bovina Consumo bajo Consumo medio Servicios agregados que tiene la carne bovina 1 2 3 4 5 Total Consumo alto Ingreso familiar al mes Total IB IM IA IB IM IA IB IM IA 21.3 18.7 16.5 9.8 33.9 100.0 4.7 1.4 5.8 3.4 9.8 25.1 2.3 2.6 1.4 0.8 3.0 10.1 0.5 0.8 0.0 0.0 0.3 1.6 3.6 2.6 5.1 2.8 8.6 22.7 6.4 6.2 3.4 1.9 8.4 26.3 2.5 3.4 0.2 0.3 1.9 8.3 0.5 0.0 0.3 0.2 0.5 1.5 0.5 0.6 0.3 0.2 0.8 2.4 0.3 1.1 0.0 0.2 0.6 2.2 IB: ingreso bajo; IM: ingreso medio; IA: ingreso alto v IB: low income; IM: middle income; IA: high income. 1: debidamente refrigerada 2: cortes empacados en charolas de unicel; 3: piezas grandes refrigeradas a granel en una vitrina; 4: carne no refrigerada y expuesta en el mostrador lista para despachar; 5: la carne se corta en piezas, y se entrega en bolsas plásticas v 1: properly refrigerated; 2: cuts are packaged in Styrofoam trays; 3: large pieces are refrigerated in bulk in a display case; 4: beef is not refrigerated and exposed in the display case ready to be sold; 5: beef cut in pieces and sold in plastic bags Fuente: Elaboración propia con datos obtenidos de la encuesta v Source: made by the authors with data obtained from the survey. TELLEZ-DELGADO et al. 85 AGROCIENCIA, 1 de enero - 15 de febrero, 2012 de bajo consumo y bajo ingreso, es decir, los más pobres. Conclusiones En la Zona Metropolitana del Valle de México el consumo de carne bovina es masivo debido a la mayor concentración poblacional y por ser una de las principales carnes preferidas. La carne bovina está presente en la mesa de las familias mexicanas, lo cual responde a factores relacionados con el ingreso y frecuencia de consumo de la carne. Los consumidores con distintos niveles de ingreso y consumo demandan los cortes populares (bistec, molida y retazo). El consumidor de los diferentes estratos de consumo e ingreso prefiere comprar en tiendas de autoservicio, aunque también es relevante la adquisición en mercados públicos y carnicerías del barrio. El tipo de carne bovina que demanda el consumidor fresca o refrigerada presenta una fuerte correlación con ingreso y consumo, con una alta proporción que prefiere el consumo en fresco. En una menor proporción consumidores de ingreso alto consumen carne refrigerada y realizan la compra en mercados de autoservicio con mayor valor agregado. Los consumidores de menores ingresos y consumo bajo de carne adquieren el producto no refrigerado, con menor valor agregado (servicios) y en mercados públicos y carnicerías de barrio. Literatura Citada Benítez R. J., R. García M., J. S. Mora F., y J. A. García S. 2010. Determinación de los factores que afectan el mercado de carne bovina en México. Agrociencia, 44:1: 109-119. Escobar M. 1998. Las aplicaciones del análisis de segmentación: El procedimiento Chaid. Metodología de las Ciencias Sociales 1: 13-49. INEGI, 2005. Instituto Nacional de Estadistica, y Geografia. Encuesta de Poblacion y Vivienda del INEGI. (Consultado: marzo 2011). FIRA. 2003. Fideicomisos Instituidos en Relación con la Agricultura en el Banco de México: Perspectivas de la Red Carne de Bovino. (Consultado: febrero 2011). SAGARPA, 2010. Secretaría de Agricultura, Ganadería, Desarrollo Rural, Pesca y Alimentación: Base de datos en línea, página oficial de SAGARPA. (Consultado: septiembre-noviembre 2010). 86 VOLUMEN 46, NÚMERO 1 the table of Mexican families, which corresponds to factors related to income and frequency of beef consumption. The consumers with different income and consumption levels demand the popular cuts (steak, ground meat and trimmings). The consumer of the different strata of consumption and income prefer to buy in self-service stores, although its acquisition is also relevant in public markets and neighborhood butcher shops. The type of beef demanded by the consumer, fresh or refrigerated, presents a strong correlation with income and consumption, with a high proportion that prefers consumption of fresh beef. In a smaller proportion consumers of high income consume refrigerated beef and purchase it in self-service stores with higher added value. The consumers with lower income and low beef consumption acquire the unrefrigerated product, with lower added value (services) and in public markets and neighborhood butcher shops. —End of the English version— pppvPPP Schnettler M. B., R. Silva F., y N. Sepúlveda B. 2008. Consumo de carne en el sur de Chile y su relación con las características sociodemográficas de los consumidores. Chilena de Nutrición 35:1:262-271. CONASAMI, 2011. Comisión Nacional de Salarios Mínimos. Tabla de salarios mínimos por área geográfica generales y profesionales. SE, 2006. Secretaria de Economía. México Calidad Suprema. México, D.F. 26 p. Segovia E. D., D. Contreras, D. Marcano, R. Pirela, y A. Albornoz. 2005. Conducta del consumidor de carne bovina según clase socioeconómica en el Municipio de Maracaibo, Estado de Zulia, Venezuela. Agroalimentaria 11(21): 113-121. SIAP, SAGARPA. Servicio de Información Agroalimentaria y Pesquera SAGARPA: Base de datos pecuario 2000-2009 en línea. (Consultado: septiembre-noviembre 2010). SPSS. Manual del usuario de SPSS (Statistical Package for the Social Sciences) versión 17. http://pagines.uab.cat/plopez/ sites/pagines.uab.cat.plopez/files/SPSS%20Statistcs%20 Base%20User’s%20Guide%2017.0.pdf (Consultado: septiembre 2010). Vilaboa A. J., P. Díaz R., O. Ruiz R., D. Platas R., S. González M., y F. Juárez L. 2009. Patrones de consumo de carne bovina en la Región del Papaloapan, Veracruz, México. Agricultura, Sociedad y Desarrollo 6(2):145-159.