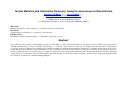
1
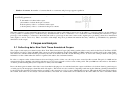
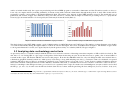
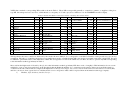
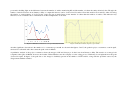
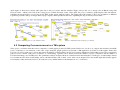
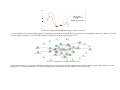
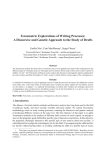
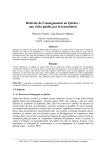
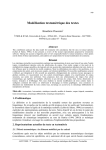
Textual Statistics and Information Discovery: Using Co-occurrences to Detect Events
Erin MACMURRAY (*,**), Liangcai SHEN (**),
[email protected], [email protected],
(*) TEMIS, 164 rue de Rivoli 75001 Paris (France),
(**) SYLED-Université Paris 3, 19 rue des Bernardins 75005 Paris (France).
Mots clefs :
Statistiques textuelles, fouille textuelle, co-occurrences, détection d’événements
Keywords:
Textual statistics, text mining, co-occurrences, event detection
Palabras clave :
Estadisticas texuales, búsqueda textual, co-occurrencias, detección de eventos
Abstract
One of the major shortcomings of Text Mining systems is in their failure to relate extracted information to the greater context in which a text was produced,
defining with difficulty an “event” as actually corresponding to a “real world” object. An event is made up of a complex network of references, leaving lexical
“footprints” in the text. Whereas more traditional text mining techniques use predetermined qualitative annotations to formulate interpretations about events,
textual statistics uses quantitative textual information to come to qualitative conclusions. The objective of this paper is therefore to test textual statistics as a
means for mining and more specifically using co-occurrence calculations to detect statistically significant events. In analyzing the New York Times annotated
corpus with the co-occurrences of known named entities, this method hopes to reveal these lexical “footprints”, therefore discovering new information that
may otherwise go unnoticed by standard mining techniques.
1 Introduction
It’s no scoop that data- or the “quiet revolution” as Bollier [2] puts it- has grown tremendously since the availability of computing and databases, even more so
since the dawn of the internet. Some reports even state that the amount of digital content on the web is close to five hundred billion gigabytes, up from the
estimated three hundred billion gigabytes in 2007 [2], [25]. Data is not just conveniently stored in structured databases, it comes in the form of natural
language: articles, blogs, forums are among some of the many formats in the mobile network for sharing information. Today, metadata is widely used to
preserve information (date, author, subject, key words, among others) on digital media. However, with the advent of the “semantic web”, access to natural
language data remains as much a challenge today as it was when these analyses became heavily commercialized in the 1990’s. One of the more popular goals
is the detection and extraction of current events in large compilations of text, such as the online media. The race for information extraction is on, with an
increase in the number of open source extraction tools available on the web. Although, various systems exist yielding impressive results, most of them fail to
take into account the context of the extractions they produce.
The objective of this paper is therefore to test textual statistics as a means for mining information about business/economic events in the corpus the New York
Times. Here we apply one method of monolingual text exploration, co-occurrences, in assisting the identification of events for business and strategic
intelligence applications. In order to test this strategy, a list of entities was gathered from among the Fortune 500 companies. The goal here is to use the entity
as the pivot-type for co-occurrence calculations. The software Trameur [9] helps calculate and visualize the co-occurrence relationship at the article level,
displaying the pivot-type and its associated types as a network. In order to return to the context in which a co-occurrence relationship was found, the
corresponding newspaper article can be easily accessed using Trameur function “map of sections”. The results of the co-occurrences will constantly be
compared to the original newspaper article in which they appear so as to verify the results with their greater context.
From the Firthean inspiration “You shall know a word by the company it keeps” [8], we chose to focus on two aspects for event identification:
1.) Quantitative: the importance of named entity frequency in the corpus,
2.) Qualitative: The “company”, or co-occurring vocabulary that a named entity effectively has in the corpus.
Co-occurrences are used here as a method for revealing the “footprint” or lexical network used to discuss an event by the media. From this analysis we attempt
to discover knowledge that may otherwise go unnoticed by qualitative annotations used in standard extraction techniques.
2 Background
2.1 Big Data Problem and Data Mining Solutions
Since the mid-1990s, Data Mining has seen a steady growth due to the development of new efficient algorithms that handle large volumes of data in the
commercial domain [5]. Data Mining will be defined, for the purpose of this research, as the sum of techniques and strategies used in the exploration and
analysis of computerized databases in order to detect rules, tendencies, associations, and patterns in the data. The techniques can be either descriptive or
exploratory, with the goal of bringing to light information that would otherwise be obscured by the sheer quantity of data. Alternatively, they can be defined
as predictive or explanatory, aiming at extrapolating new information from the information available [27]. Text Mining (TM) is often described as a subfield
of Data Mining with an added challenge of structuring natural language so that standard Data Mining techniques can be applied [13], [6]. The goals for
processing natural language are therefore twofold:
1. Structuring free text for use by other computer applications,
2. Providing strategies for following the trends and/or patterns expressed in the text.
Early work in text mining tried simply applying the algorithms developed for data mining without considering the specific nature of their data, showing how it
is possible to use the methods of extraction sequences to identify new trends in a database [16].
Today, there are many natural language mining techniques: machine learning and information extraction through automatic semantic morpho-syntactic
patterns to name just a couple as discussed during the Message Understanding Conferences (MUC) [11]. The units of analysis used by these techniques rarely
go beyond the sentence level and sometimes fail to consider their object of analysis, the text, as a component in and of itself. Here, we chose to shift the focus
from the sentence level to the text level by applying existing statistical strategies to discover patterns at the text level in a corpus of textual data.
2.2 Searching for information: entities, relationships and events
2.2.1 Named Entities
Information Extraction systems have long attempted to group textual elements into Named Entities and relationships or template scenarios between these
entities [11], [22]. Named Entity Recognition (NER) and Relation Templates continue to be hot topics today as they were during the MUCs, which can be
noted by the number of open source technologies that have begun to undertake this task. The definitions attributed to what are called entities and relationships
remain unsatisfactory. Entities are roughly defined as names of people, organizations, and geographic locations in a text [10] ,[11]. They are perceived as rigid
designators that reference ‘real world’ objects organized in an ontology [23]. However, these definitions fail to take into account the semantic complexity of
named entities in terms of their surface polysemy and their underlying referentiality which aims at combining both the linguistic designation of an entity and
the extra-linguistic level or the ‘real world’ object an entity refers to [23]. At this stage, our method has yet to provide a satisfactory definition of named
entities. Given the intricacy of entity modeling, we disregard any predefined named entity (here after NE) categorization.
2.2.2 Relationships
Relationship templates prove to be even more difficult to define. In many cases, the literature confuses ‘naturally’ occurring relationships with domain
information models. ‘Naturally’ occurring relationships exist either through a semantic relationship between two words (synonym, antonym, conceptual), an
ontological relationship (hyperonym, hyponym, meronym), or a syntactic relationship (predicate, argument). Most templates try to use a conceptual model for
defining a scenario or event. For example, a predefined scenario may be: a person has a position in a company and is starting this job [10]. These models are
very much like Frame semantics [7] applied in the FrameNet project that uses human annotators to code various predefined scenarios in a corpus.
Unfortunately, for business intelligence applications, these generic templates often change from one need to the next, requiring more or less detail in the
concepts they provide. However generic conceptual models may be, their genericity does not cover enough ground, explaining why domain information
models are so heavily sought after. Being capable of detecting events without the use of a predefined information model is therefore not trivial in business
intelligence applications.
2.2.3 Events
The general objective for text mining systems is defined as detecting pertinent information or pertinent “events” and linking these events to others occurring in
text. However, determining what exactly “pertinent information” or an “event” is, in order to arrive at “real world” conclusions, proves to be no easy task.
As mentioned above, one of the major shortcomings of Text Mining systems is in their failure to relate extracted information to the greater context in which a
text was produced. It is difficult to define an “event” as actually corresponding to a “real world” object. As discussed in a number of articles ranging from
Named Entity Recognition to the discourse analysis of proper nouns, the actual designation of events changes with time, not only in graphical form, but also in
meaning [4], [14],[20],[21],[23]. Likewise as David [4] states “the media [is] subject to an ontological reality that is fickle and unstable.”
Events therefore are not just “entities” or templates, as defined by most Information Extraction systems [11],[27],[30], rather they are directly linked to the
corpus and will only give information about the corpus in which they appear. Furthermore, in trying to identify an “event” it must be noted that it is more than
a self-contained expression [28]. An “event” is built up of a network of other references either in the same article or a series of articles [1]. This research is
based on the seven characteristics of an event in narrative texts as defined by Adam [1] and Cicurel [3]:
• Event core: description of the event by its protagonists, described by journalists or explained by scientists.
• Past events: other events of the same nature, the current event is therefore compared to past events.
• The context: general atmosphere in which the event took place.
• The periodicity of the event core: reproducibility of the event.
• The background or comments: explanation of the event.
• Verbal reactions: reactions to the event by a variety of speakers – victims, experts, representatives, etc.
• Similar stories: stories not directly linked to the event but having to do with the general atmosphere associated to the event (example: after September
11th, articles discussing studies on panic and fear).
Each of these characteristics can give rise to any number of individual articles or can be discussed within the same article. This model shows how events are
discussed and related by the written press as a network of intricate pieces of information. Following these arguments, two hypotheses can be formulated:
1.) The NE involved in an event will have a higher frequency and greater number of co-occurrences as it is discussed by a series of newspaper articles,
2.) Events leave lexical “footprints” in the text that can be revealed using textual statistics by determining what is statistically significant in a given
article.
2.3 Textual Statistics and co-occurrences: a mining strategy
2.3.1 Textual statistics
As mentioned above, using qualitative coding- usually in the form of morpho-syntactic or semantic annotations as discussed above- to drive quantitative
conclusions almost defeats the purpose of discovering unknown information in the text. This calls into question the accurate interpretation of results acquired
using basic information extraction techniques. Can there be a bias-free interpretation of big data? This question also brings to mind current evaluations of TM
systems. Following MUC guidelines, precision and recall remain the gold standards for measuring such systems. However, “one man’s noise is another man’s
data” [2], which clearly points out the difficulty in creating a generic system that can objectively process large quantities of data.
“There is no agnostic method of running over data, once you touch the data, you’ve spoiled it.” [2]
To what extent is “bad data good for you?” [2] This being stated, processing purely raw data is beyond the scope of this article; however, the textometric
strategy considers the text as material on its own. Pre-analysis categories (qualitative coding) may result in the mutilation of the textual material [15]. This
research therefore, aims at bypassing qualitative coding when studying textual data by using known methods of textual statistics. Although, this field is not
generally considered a text mining technique by the industrial community, it seems an appropriate strategy for discovering related events in a corpus when no
predetermined information model is available. Textual or lexical statistics use quantitative information to formulate qualitative interpretations [15]. Following
this definition, this method can be included among other text mining strategies.
Textual statistics consists of seeing the document through a prism of numbers and figures, producing information on the frequency counts of words, otherwise
known as tokens [19], or occurrences [15]. The term token will be used in this paper, by opposition with type [19] or form [15], which is a single graphical
unit corresponding to several instances (tokens) in the text. Another important unit of count is the co-occurrence, the statistical attraction of two or more words
in a given span of text (sentence, paragraph, entire article).
In comparison with approaches that use qualitative coding, textual statistics would have a relatively low maintenance cost, due to the minimum amount of
actual processing.
2.3.2 Co-occurrences as a unit of analysis
Co-occurrences are one of several units of analysis in textual statistics. As stated above, a co-occurrence is two words or more that appear at the same time in
the same predetermined span of text. This analysis allows for the precise description of the lexical environment of a pivot-type (or pivot-word). A
hypergeometric model (below) is applied to calculate the lexical associations of a pivot-type, in which several variables are left to the end-user [17]. First, the
co-frequency of two associations must be determined; this frequency indicates the lowest number of times two types appear together in the corpus, in the
defined context. When no pivot-type is available, repeated segments, two tokens or more appearing together [15], can be used to discover co-occurrences with
a specified frequency. Second, a threshold is provided, designating the probability level that co-occurrence relationship must have for appearing in the
predefined context [15].
What results is a list or network of co-occurring types that can be interpreted through the following:
- Frequency: the total frequency of the co-occurrence in the corpus
- Co-Frequency: the frequency with which the co-occurrence appears with the pivot-type in the defined context
- Specificness: the degree of probability that the co-occurrence will appear in that context
-
Number of contexts: the number of contexts that the co-occurrence and pivot-type appear together in.
Thehypergeometric
hypergeometric mode
model determines the most probable value according to
The
the following parameters :
T: the number of tokens in the corpus
t: the number of tokens in the pivot contexts
F: the frequency of the co-occurrence in the corpus
f: the frequency of the co-occurrence in the pivot contexts
This unit of analysis seems particularly interesting for detecting associative relationships between words. In taking co-occurrence analysis one step further, it
is also possible to calculate polyco-occurrences [18], otherwise known as the co-occurrences of co-occurrences. After calculating the network for a given
pivot-type, each resulting co-occurrence is then analyzed itself as a pivot-type in the same context as the original pivot, producing a network of interrelated
units (figures 8 and 9 section 4.2). These associative relationships help show prominent information that may otherwise go unidentified by qualitative
annotations of the corpus.
3 Corpus and Analysis
3.1 Collecting data- New York Times Annotated Corpus
The corpus for this study was taken from the New York Times Annotated Corpus [26] which contains almost every article in the New York Times (NYT)
from January 1st 1987 to June 19th 2007. This corpus uses the News Industry Text Format (NITF), an XML standard now widely used by the online media.
The articles are enriched with metadata provided by the New York Times News Room and Indexing service, as well as the online production staff, giving
information on the column where the article is organized, the author, date, and named entities.
In order to compare results obtained between short and longer periods of time, two sub-corpora were created for this research. The period of 2002 and an
extracted subcorpus containing only articles with the type hewlett were selected to follow events of that period. The year 2002 was chosen due to the number
of articles produced during that year in comparison to other years since 2000.
Due to the heterogeneous nature of the data, it was clear that for the purposes of a statistical study the corpus would have to be broken down by genre/category
or in this case by the newspaper column the article belonged to. This decision is also useful for comparing results among the different columns predetermined
by the NYT in the metadata. Selecting articles according to this criterion proved to be more difficult than expected. Although the NYT annotations indicate
the column, their names are not always consistent. Likewise, more than one column name can be attributed to the same article. In order to determine which
articles to include in this study, the corpus was parsed using an in house PERL program to extract the column name and date. From these results, we chose to
focus only on complete articles (excluding summaries of current events) with consistent column names throughout the periods of study. Here results will be
presented for articles corresponding to the Business/Financial Desk. The articles were stripped of their XML metadata except for the month and year of
publication and cleaned of upper case distinction. They were then saved in a collective file in simple txt format for processing in Lexico 3 [24] and the
Trameur [9], both textual statistic tools developed by the University Sorbonne Nouvelle (Paris 3).
Figure 1: Number of Tokens in NYT 2002 corpus per month
Figure 2: Number of Types in NYT 2002 corpus per month
The final cleaned corpus NYT 2002 contains a total of 10,968 articles for 8,059,702 tokens and 71,072 types. The number of tokens fluctuates only slightly
over each month with July having the highest number of tokens at 758,512 and August, the lowest, at 631,054 tokens in figure 1. The number of types seems
to show greater fluctuation over the year. Again, July has by far the greatest variety of vocabulary with 25,378 types in figure 2.
3.2 Analyzing data- methodology and criteria
As previously stated, co-occurrence analysis with the Trameur was selected as a means of detecting events that companies or NEs could be involved in. The
aim, here is to see if using NEs as a pivot-type would produce lexical network denoting an event. It was thus necessary to gather a list of attested NEs for
research in this corpus. The Fortune 500 list was used for this purpose. From the first 200 NEs in the list, only non ambiguous NEs were retained. Due to
tokenization (graphical element between two white spaces) issues that go along with analyzing raw data, co-occurrences cannot be calculated on repeated
segments. NE such as General Electric are therefore considered as two separate tokens general and electric1, by the Trameur, making a distinction between
these tokens and their counterparts that are not NE, difficult to determine. The token ge could therefore be used to search for occurrences of General Electric,
instead of searching for the ambiguous tokens general and electric separately in the corpus. In certain cases an unambiguous acronym could be used to find
the NE (ge, gm, amr, cbs) in other cases the NE was broken down into two tokens, with the part being the least ambiguous (hewlett, berkshire, kraft, ford)
1
Here the when a Named Entity is being referred to, capital letters will be used (General Electric); however, when the type or token in the corpus is being discussed, lower
case letters show the exact way they were written in the corpus (ge or general electric).
used as the pivot-type in the co-occurrence calculation. The degree to which a NE was ambiguous for this corpus was left up to the human tester’s discretion.
After cleaning the Fortune 500 list, only 91 of the original 200 NE were retained for co-occurrence analysis. Those NEs with 24 tokens or less were also
removed from the list, due to their low frequency that would not produce results on a corpus of this size. Each NE from this list was then put as pivot-type in
the Trameur co-occurrence option. A co-frequency of 10 and a threshold of 20 were used in the context of the sentence, in other words the boundary of the
punctuation mark period. These criteria were set at high levels in order to keep the resulting co-occurrence graphs legible without losing too much
information. A stop-list of common English words was also used so as to avoid taking them into account in the analysis, removing a potential source for noise.
In order to test the first hypothesis, a number of co-occurrences- frequency of pivot-type ratio was calculated:
The higher the ratio, the more chance a prominent event may have of taking place. The second hypothesis was tested through a qualitative analysis of the
resulting co-occurrence and polyco-occurrence graphs.
In order to then follow an event as it unfolds month by month, a subcorpus was compiled containing all the articles mentioning hewlett. The smaller subcorpus
allows for a more manageable size in analyzing polyco-occurrences of a single event in the Trameur. Accordingly, the co-frequency and threshold were
lowered to 5 and 10 for the reasons mentioned earlier.
4 Results
4.1 Fortune 500 Named Entities and Co-occurrence networks
Only 76 of the remaining 91 NEs showed co-occurrences in the corpus. Those that did not produce results had, in general, low frequencies (for example,
metlife, kbr, and pnc had frequencies of 25, 32, and 45 respectively). From here on out, the remaining list of 76 Fortune 500 NEs will be referred to as the
76NEs. The total frequency for the retained 76NEs is 29,452 corresponding to 388 tokens for each of the 76NEs. In using a threshold of 20 or higher the NE
had on average 11 co-occurrences. The highest return for this threshold was 100 co-occurrences (Microsoft) and the lowest, frequency of zero excluded, was
one (Alcoa, Chevron, CVS, Wells Fargo, Costco, Conagra, Tyson, Rite Aid, Staples, J.C. Penney).
One of our first remarks was the number of new NEs (following a rough MUC definition of Person, Location or Company) that appeared in the cooccurrences of each of the original 76NEs. Of the average 11 co-occurrences, four were other NEs (this count includes only new NE, not co-occurrences that
correspond to part of the original company, for example “foods” in “Conagra Foods” is not counted as an NE for the retained 76NEs “Conagra”). The total of
76NEs that contained a corresponding NE was 60 as shown in Table 1. These NEs corresponded generally to competitors, partners, or suppliers of the pivottype NE. One unexpected case was Xerox, which shared a co-frequency of 37 and a specificness indicator over 49 with KPMG an audit company.
Table 1: Fortune 500 Entities retained for analysis containing other named entities
Named Entity
1
2
3
4
5
6
7
8
9
10
11
12
13
14
15
At&T
1352
Aetna
Alcoa
113
Amazon
Amgen
AMR
Apple
Berkshire Hathaway
Boeing
CBS
Cigna
Cisco
Citigroup
Coca-cola
Comcast
Named Entity
Freq
40
591
105
91
449
120
552
1030
144
430
1399
387
339
16
17
18
19
20
21
22
23
24
25
26
27
28
29
30
Freq
Named Entity
Dell
580
Delta
475
Disney
Exxon
Fannie Mae
Ford Motors
Freddie Mac
General Electric
General Motors
Goldman Sachs
Google
Halliburton
Hewlett-Packard
Intel
Kraft Foods
1297
148
155
1928
134
145
37
1054
298
309
1613
746
75
31
32
33
34
35
36
37
38
39
40
41
42
43
44
45
Named Entity
Lockheed Martin
148
Lowe
Macy
125
McDonald
375
Medco
136
Merck
Microsoft
381
1323
Motorola
257
Nike
150
Northrop
Oracle
Pepsi
Pfizer
Phillip Morris
Procter & Gamble
56
226
194
440
436
387
244
46
47
48
49
50
51
52
53
54
55
56
57
58
59
60
Qwest Communications
Freq
1040
Sears
309
Sprint
Squibb
303
Staples
116
Tiaa
UAL
173
70
283
UPS
US Bancorp
256
Verizon
445
Viacom
561
Wal Mart
648
Warner
Wellpoint
Xerox
88
2384
65
512
The hypothesis, the more a subject is discussed by the media, the more likely it is to correspond to some kind of business event, proved not to be an easy
assumption. The ratio co-occurrences-frequency is not significant enough to conclude that the NE is involved in a potential event in the corpus NYT. It would
be difficult to present this ratio for the entire table of NEs. The average ratio for each of the 76NEs was 3.4. Here, we chose to present only NEs corresponding
to the information technology industry in Table 2.
Microsoft has the highest ratio followed by Google, the other information technology industry NEs have a ratio of roughly 2. This information does not seem
sufficient to come to any clear conclusions on the hypothesis that the higher the number of co-occurrences per frequency denotes an event. If the actual cooccurrence networks of these NEs are compared, the implication of Google, Dell, Apple, Cisco, Intel, Oracle in an event is not clear. Hewlett- Packard (HP)
and Xerox, however, show a great deal of vocabulary that does not correspond to what could be expected from an information technology company:
i.)
Hewlett: fight, dissident, founders, merger …
ii.)
Xerox: kpmg, restate, accounting, investigation …
As can be seen in the figure 3 below, Intel, for example has a higher ratio than HP but does not contain any vocabulary that could denote an event. This
appeared to be the case for other 76NEs as well. Wellpoint, for instance, had a ratio of 9.2, but only co-occurrences of competitors or drugs were observed,
nothing that would alert an analyst to a potential event. Microsoft on the other hand has a ratio of 7.5 and contains, like HP and Xerox, a great deal of event
vocabulary (court, settlement, sanctions, illegally …)
Table 2: Ratio Co-occurrences-Frequency for Computer Industry NE
Company
Freq
Coocs
Apple
449
Cisco
Dell
430
Google
HewlettPackard
298
Intel
Microsoft
Oracle
Xerox
580
1613
746
1323
194
512
Ratio
11
11
11
12
2.4
2.5
1.8
4
38
25
100
2
7
2.3
3.3
7.5
1
1.3
Intel displays in figure 3, what can be called descriptor or categorizing vocabulary. It comes as no surprise that this company, which produces microchips for
PCs, has such tokens in its co-occurrence network2.
2
The colors in the following networks (figures 3 and 4) correspond to the degree of specificness of the co-occurrence, from most to least specific: red, green, orange, blue.
The thickness of the relationship denotes the number of contexts the co-occurrence shares with the pivot-type, the more common contexts are found, the thicker the line. The
numbers provided (for example figure 3- microprocessor 31(**)(29)) correspond to, in order of appearance, the co-frequency, specificness, and number of shared contexts.
The double asterix denotes a specificness of 49 or higher.
Figure 3: graph of Intel cooccurences
Observations in a study on automatic disambiguation of Proper Nouns (PN), described clauses immediately following the PN as having a certain number of
categorizing types or pronouns semantically marked, allowing for the identification of the PN referent as belonging to a semantic class [29]. The types found
with the co-occurrence analysis are similar in that they do define the NE pivot-type as belonging to a semantic class within the scope of the corpus.
Without attempting to provide a complete semantic or referential study of the NE, here, this information is important to shed light the observed contrast
between both co-occurrence graphs intel and hewlett. The latter in figure 4 shows few categorizing types; whereas, intel and others have comparable cooccurrence networks as can be seen in Table 3. Shared vocabulary is listed in bold in the table below.
Intel
chips
micro
corporation
hewlett
microprocessors
processor
devices
chip
pentium
Table 3: Co-occurrence for intel, dell and apple
Dell
microprocessor
computer
grove
pc
quarter
computers
dell
hewlett
packard
computers
advanced
intel
microsoft
quarter
design
personal
processors
printers
Apple
imac
macintosh
computer
desktop
ipod
microsoft
x
windows
jobs
technology
computer
semiconductor
servers
personal
packard
itanium
compaq
computers
os
Categorizing terms such as computer or personal and NEs corresponding to competitors, microsoft, or partners appear. These pivot-types (intel, dell and
apple) all seem linked through their lexical networks.
Figure 4: graph of hewlett co-occurrences
Though, it can be noted that a ratio co-occurrences-frequency does not necessarily mean an event is taking place for the overall corpus 2002, it may help
follow or detect such information on a monthly basis.
4.2 A Closer look at the HP Compaq merger
The subcorpus Hewlett, as discussed in section 3.1, is made up of 200 NYT articles from the original NYT 2002 corpus. The type hewlett was used as the
pivot-type in co-occurrence and polyco-occurrence calculations. Figure 6 shows the relative frequency for hewlett3 over the course of 2002. It seems clear
from this figure that some kind of activity is taking place from January 2002 to May 2002, after which, the relative number of tokens drops significantly. This
figure is also comparable to the total frequency of this entity and the number of polyco-occurrences found each month. Figure 5 shows the number of articles
3
The type packard showed the very similar results.
per month, shedding light on the difference between the number of articles mentioning HP and the number of tokens the entity effectively has. Though, the
number of articles increases from January to May, a comparable increase can be observed for November. Given this notable rise in articles, when observing
the relative or total frequency of hewlett in the corpus, the gap is much larger for the number of tokens than the number of articles. This indicator may
therefore, not be a reliable source of information on the real importance of an event.
Figure 5: Number of articles vs. coocs per month for hewlett
Figure 6: Hewlett relative frequency per month
Another significant observation is the number of co-occurrences per month. As shown in the figures 5 and 7, the peaks in polyco-occurrences occur in April,
whereas for both article and token counts the peak occurs in March.
A qualitative analysis of the polyco-occurrences shows the merger of HP and Compaq to be the focus from January to May. The actual vote to merge both
companies takes place in March; however, the founder, Walter Hewlett, sues the company over the voting process, which may be an explanation for the peak
observed in April. In figure 5, the peak due to the merger is definitely present in the number of NYT articles, along with the problems caused by the
disagreement with the founders.
Figure 7 : Hewlett Coocs vs. Hewlett Frequency per month4
Below table 4 displays the chronological ratio for the type hewlett. The month of April shows a ratio well above those observed over the entire year 2002. On
a monthly basis, this ratio could alert us to a potential event, especially when compared to the ratio of other months in 2002, as well as the results of the
polyco-occurrence graph (figure 9). However, October is a major exception, in following our hypothesis, with a ratio of 14.2, it seems that there should be a
major event for this month. The actual polyco-occurrence graph shows a relationship with depot and computers. This can be explained by an article describing
a supply deal between HP and Home Depot for providing PCs to Home Depot stores. Could this exception display possible weak signals in the Hewlett
subcorpus? This question needs further investigation. Nevertheless, it must be noted that the months of June, July, August, September, October, and December
have very little data to be entirely conclusive in terms of a statistical analysis.
Table 4: Ratio for hewlett per month 2002
Month
January
February
March
April
May
June
Freq
Coocs
197
214
431
234
159
40
Ratio
8
11
19
20
6
0
Month
4 July
5.1
4.4
8.5
3.7
0
August
September
October
November
December
Freq
Coocs
21
48
66
21
155
27
Ratio
1
2
2
3
8
0
4.7
4.1
3
14.2
5.1
0
The qualitative analysis also confirms the ratio figures. Co-occurrences such as merger, deal, vote, … appear in the polyco-occurrence graphs from January to
May. Figures 8 and 9 show the polyco-occurrences for January and April, respectively. January (figure 8) already displays the disagreement with the founders
of HP in their relationship with the co-occurrence merger. The months that follow are fairly similar in their lexical networks, with the exception of March and
4
The frequencies of hewlett in figure 7 have been divided by 100 so that the number of co-occurrences and the frequency could be displayed on the same graph.
April, figure 9, where more activity takes place due to the proxy battle with the founders. Figure 9 shows the vote to merge (also in March) along with
Deutsche Bank , which is involved in the voting process scandal discussed earlier. After April, the polyco-occurrence graph displays little information,
reflecting the fact that HP is covered less by the NYT at that period, until November. The slight peak in November is due to the resignation of Micheal
Capellas as president of the post-merger HP-Compaq company, which quickly left the news, explaining the drop in activity for December.
Figure 8: Hewlett polycoocs for January, 2002
Figure 9: Hewlett relative frequency per month
4.3 Comparing Co-occurrences to a TM system
These polyco-occurrence networks can be compared to certain graphs produced by TM systems. In this case, we chose to compare the month by month HP
polyco-occurrences to an extraction on the same corpus using the graphs produced by Luxid®, a TM application by Temis. Luxid® applies Temis Skill
Cartridge™ (SC™) technology to detect and extract information of interest. Here, the SC™ for business intelligence relationships was used for comparative
purposes. If we consider each polyco-occurrence as a relationship, a parallel can be drawn between the number of polyco-occurrences and the number of
Luxid® relationships on a monthly basis. The quantitative analysis in figure 10 shows a similar trend in the fluctuation of both types of relationships. It must
be noted that the SC™ Board relationships were not included in this count, as their “event” status can be disputed. It is clear in this figure that activity appears
from January to May and from October to November in a very similar manner to the fluctuations of co-occurrences.
Figure 10: Comparison of Luxid® Relationships and Co-occurrences
A closer qualitative look at the resulting graphs for both January and April show that the HP-Compaq merger is the highlight of this period. However, Luxid®
does not display information on the dissident founders nor the Deutsche Bank scandal, figures 11-12.
Figure 11: Luxid® Relationships for HP January 2002
On the other hand, the co-occurrence calculations will not pick up on info that is directly sought after through SC™ patterns (partnership, manpower in the
graph figure 11). If the information has no statistical weight for the month analyzed, textual statistics will not pick it up.
Figure 12: Luxid® Relationships for HP April 2002
5 Discussion and limits
In this paper we used textual statistics, more specifically co-occurrences, as a method for the detection of significant events in the corpus. Two approaches,
quantitative and qualitative were used to analyze the lexical network produced by co-occurrence analysis of NEs.
Firstly, as we observed in section 4.1, for the 76NEs tested, neither the frequency nor the number of co-occurrences was enough information to alert us to an
event that the pivot-type could be involved in. However, it would be interesting to perform further qualitative analysis on NEs with higher ratios than usual in
order to see how they are discussed by the NYT, especially when not related to any specific event. The chronological study of hewlett did reveal alarming
peaks for the month of April and to a lesser degree November. To what extent these figures can be used to alert end-users to potential events requires further
exploration and testing. This current research, at least over the span of a year, does not show the individual counts of frequency or co-occurrences as being
sufficient enough for event detection on their own. The ratio, as we have observed, provides interesting contrast on a month to month basis, but requires
further investigation especially when dealing with very low figures. One of the more important limits to this research, the identification of NEs, remains
difficult when using tokens as a unit of search. Ambiguous NEs could produce such incoherent results they would be unexploitable for the end-user. Likewise,
NEs that are made up of two distinct segments (general electric, for example) present, for the moment, complications when interpreted as a single pivot-type
for co-occurrence calculations. Though work-arounds do exist, we have not implemented them for this research.
Secondly, the qualitative analysis of the resulting co-occurrence networks showed a great deal of vocabulary actually categorizing the NEs, placing them in a
specific domain. For the IT industry, the co-occurrences were similar among the pivot-types, what was interesting were those NEs that did not have cooccurrences related to their general fields. These “unexpected” associative relationships generally corresponded to events. The chronological qualitative
analysis revealed pertinent lexical networks, not only alerting us to the merger of HP-Compaq but also to the role the founders and more specifically Walter
Hewlett played in how the merger unfolded. The “proxy battle” and Deutsche Bank relationships appeared between March and April at the high point of the
push to merge both companies. These lexical networks give interesting insight to how the NYT covered the merger bringing to light key elements of the
voting process. In the comparison with Luxid® these elements were overlooked by the application, as they were not part of the predetermined scenario for a
merger. The extraction or qualitative annotations used by Luxid® do bring to the forefront important static information in the text, corresponding to pre-coded
patterns. As mentioned before, this information, void of any statistical weight, will not appear using textual statistic methods. However, unexpected events or
even information related to an event (such as dissident founders) is not part of the generally coded patterns used for extraction. This information that is not
determined by a conceptual model will not be detected by such information extraction techniques.
Textual statistics, a more dynamic approach to the text, helped shed light on associative relationships NEs were involved in. Though not all these relationships
corresponded to an event of interest, they did produce lexical networks summarizing how the NEs were discussed in the NYT. Such calculations could help
define and evaluate current information extraction systems through comparing both quantitative (chronological fluctuations of relationships) and qualitative
(lexical networks) results.
In conclusion, if we consider NEs as dynamic units that are susceptible to chronological change, textual statistics, as we have observed, is an appropriate
means of following such evolutions.
6 References
[1] ADAM, J-M. Unités rédactionnelles et genres discursifs : cadre général pour une approche de la presse écrite, Pratiques n°94, 1997.
[2] BOLLIER, D. The Promise and Peril of Big Data. Washington, DC : The Aspen Institute, 2010.
[3] CICUREL, F. Les scénarios d'information dans la presse quotidienne, le Français dans le monde, numéro spécial Recherches et applications, "Médias, faits et effets". Septembre, 1994.
[4] DAVID, B. Guerre en Irak, Armes de communication massive: Informations de guerre en Irak 1991-2003. Paris : CNRS Editions, 2004.
[5] FAYYARD, U.M, PIATESTKY, G., SMYTH, P. & UTHURUSAMY, R. Advances in Knowledge Discovery and Data Mining. AAAI/MIT Press, 1996.
[6] FELDMAN, R. & DAGAN, I. Knowledge discovery from textual databases. In Proceedings of the International Conference on Knowledge Discovery from DataBases, pages 112–117, 1995.
[7] FILLMORE, C. J. Frame semantics and the nature of language, Annals of the New York Academy of Sciences: Conference on the Origin and Development of Language and Speech, 1976,
Volume 280, p. 20-32.
[8] FIRTH, J.R. A Synopsis of Linguistic Theory 1930-1955, Linguistic Analysis Philological Society, Oxford, 1957.
[9] FLEURY, S. Le Métier Textométrique: Le Trameur, Manuel d’utilisation. Universtiy Paris 3 Centre de Textométrie, 2007.
[10] GRISHMAN, R. Information Extraction, The Oxford Handbook of Computational Linguistics, R. Mitkov. Oxford: Oxford University Press, 2003, p. 545-559.
[11] GRISHMAN, R. & SUNDHEIM, B. Message Understanding Conference- 6 : A Brief History. Proceedings of the 16th International Conference on Computational Linguistics (COLING), I.
Kopenhagen, 1996 p.466–471,.
[12] HABERT, B., NAZARENKNO, A., SALEM, A. Les linguistiques de corpus. Paris: Armand Colin/Masson, 1997.
[13] KODRATOFF, Y. Knowledge discovery in texts: A definition and applications, Proceedings of the International Symposium on Methodologies for Intelligent Systems, 1999, volume LNAI
1609, p. 16–29.
[14] KRIEG-PLANQUE, A. La notion de “formule” en analyse du discours. Cadre théorique et méthodologique. Besançon : Presses Universitaires de Franche-Comté, 2009.
[15] LEBART, L. & SALEM, A. Statistique textuelle. Paris, Dunod, 1994.
[16] LENT, B., AGRAWAL, R., & SRIKANT, R. Discovering trends in text databases, Proceedings KDD’1997, AAAI Press, 14–17 p. 227–230.
[17] MARTINEZ, W. Mise en évidence de rapports synonymiques par la méthode des cooccurrences, Actes des 5es Journées Internationales d’Analyse Statistique des Données Textuelles,
Ecole Polytechnique de Lausanne, 2000.
[18] MARTINEZ, W. Contribution à une méthodologie de l’analyse des cooccurrences lexicales multiples dans les corpus textuels, Thèse pour le doctorat en Sciences du Langage, Université de
la Sorbonne nouvelle - Paris 3, 2003.
[19] MCENERY, T. & WILSON, A. Corpus Linguistics, Edinburgh University Press, 1996.
[20] MOIRAND, S. Les discours de la presse quotidienne, observer, analyser, comprendre. Paris : Presses Universitaires de France, 2007.
[21] NEE, E. Insécurité et élections présidentielles dans le journal Le Monde, Lexicometrica, numéro thématique " Explorations textuelles ", S. Fleury, A. Salem, 2008.
[22] POIBEAU T. Extraction automatique d’information. Du texte brut au web sémantique. Paris : Hermès Sciences, 2003.
[23] POIBEAU, T. Sur le statut référentiel des entités nommées, Proceedings TALN’05. Dourdan, France, 2005.
[24] SALEM, A. Lexico 3 version 3.6. Paris: Lexi&Co, 2009.
[25] SAND, J. Information Overload, How, April, 2009 p.192-196.
[26] SANDHAUS, E. The New York Times Annotated Corpus. Philadelphia: Linguistic Data Consortium, 2008.
[27] TUFFERY, S. Data mining et statistique décisionnelle: l'intelligence des données. Paris : Editions Technip, 2007.
[28] VEINARD, M. La nomination d’un événement dans la presse quotidienne nationale. Une étude sémantique et discursive : la guerre en Afghanistan et le conflit des intermittents dans le
Monde et le Figaro. Thèse pour le doctorat en Sciences du Langage, Université de la Sorbonne nouvelle - Paris 3, 2007.
[29] VICENTE, M.R. La glose comme outil de désambiguïsation référentielle des noms propres purs. Corela, Numéros Spéciaux le traitement lexicographique des noms propres,
2005.
[30] WRIGHT, K. Using Open Source Common Sense Reasoning Tools in Text Mining Research, the International Journal of Applied Management and Technology, 2006 vol 4 n°2 p.349-387.