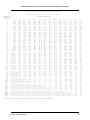
1
Microdata User Guide
National Survey of Giving, Volunteering and Participating
August 2001
Table of Contents
1.0
Introduction . . . . . . . . . . . . . . . . . . . . . . . . . . . . . . . . . . . . . . . . . . . . . . . . . . . . . . . . . 6
2.0
Background . . . . . . . . . . . . . . . . . . . . . . . . . . . . . . . . . . . . . . . . . . . . . . . . . . . . . . . . . 7
3.0
Objectives . . . . . . . . . . . . . . . . . . . . . . . . . . . . . . . . . . . . . . . . . . . . . . . . . . . . . . . . . . 8
4.0
Concepts and Definitions . . . . . . . . . . . . . . . . . . . . . . . . . . . . . . . . . . . . . . . . . . . . . . 9
4.1
Labour Force Survey Concepts and Definitions . . . . . . . . . . . . . . . . . . . . . . . . . 9
4.2
National Survey of Giving, Volunteering and Participating Concepts and
Definitions . . . . . . . . . . . . . . . . . . . . . . . . . . . . . . . . . . . . . . . . . . . . . . . . . . . . 11
5.0
Survey Methodology . . . . . . . . . . . . . . . . . . . . . . . . . . . . . . . . . . . . . . . . . . . . . . . . . 15
5.1
Population Coverage . . . . . . . . . . . . . . . . . . . . . . . . . . . . . . . . . . . . . . . . . . . . 15
5.2
Sample Design . . . . . . . . . . . . . . . . . . . . . . . . . . . . . . . . . . . . . . . . . . . . . . . . 15
5.2.1 Primary Stratification . . . . . . . . . . . . . . . . . . . . . . . . . . . . . . . . . . . . . . 15
5.2.2 Types of Areas . . . . . . . . . . . . . . . . . . . . . . . . . . . . . . . . . . . . . . . . . . . 16
5.2.3 Secondary Stratification . . . . . . . . . . . . . . . . . . . . . . . . . . . . . . . . . . . . 16
5.2.4 Cluster Delineation and Selection . . . . . . . . . . . . . . . . . . . . . . . . . . . . . 17
5.2.5 Dwelling Selection . . . . . . . . . . . . . . . . . . . . . . . . . . . . . . . . . . . . . . . . 18
5.2.6 Person Selection . . . . . . . . . . . . . . . . . . . . . . . . . . . . . . . . . . . . . . . . . 18
5.3
Sample Size . . . . . . . . . . . . . . . . . . . . . . . . . . . . . . . . . . . . . . . . . . . . . . . . . . . 20
5.4
Sample Rotation . . . . . . . . . . . . . . . . . . . . . . . . . . . . . . . . . . . . . . . . . . . . . . . 20
5.5
Modifications to the LFS design for the National Survey of Giving, Volunteering
and Participating . . . . . . . . . . . . . . . . . . . . . . . . . . . . . . . . . . . . . . . . . . . . . . . 21
5.6
Sample size by Province for the National Survey of Giving, Volunteering and
Participating . . . . . . . . . . . . . . . . . . . . . . . . . . . . . . . . . . . . . . . . . . . . . . . . . . . 21
6.0
Data Collection . . . . . . . . . . . . . . . . . . . . . . . . . . . . . . . . . . . . . . . . . . . . . . . . . . . . . 22
6.1
Interviewing for the LFS . . . . . . . . . . . . . . . . . . . . . . . . . . . . . . . . . . . . . . . . . . 22
6.2
Supervision and Control . . . . . . . . . . . . . . . . . . . . . . . . . . . . . . . . . . . . . . . . . . 22
6.3
Non-Response to the LFS . . . . . . . . . . . . . . . . . . . . . . . . . . . . . . . . . . . . . . . . 23
6.4
Data Collection Modifications for the National Survey of Giving, Volunteering and
Participating . . . . . . . . . . . . . . . . . . . . . . . . . . . . . . . . . . . . . . . . . . . . . . . . . . . 23
6.5
Non-Response to the National Survey of Giving, Volunteering and Participating24
7.0
Data Processing . . . . . . . . . . . . . . . . . . . . . . . . . . . . . . . . . . . . . . . . . . . . . . . . . . . .
7.1
Editing . . . . . . . . . . . . . . . . . . . . . . . . . . . . . . . . . . . . . . . . . . . . . . . . . . . . . . .
7.2
Coding of Open-ended Questions . . . . . . . . . . . . . . . . . . . . . . . . . . . . . . . . . .
7.3
Imputation . . . . . . . . . . . . . . . . . . . . . . . . . . . . . . . . . . . . . . . . . . . . . . . . . . . .
7.4
Creation of Derived Variables . . . . . . . . . . . . . . . . . . . . . . . . . . . . . . . . . . . . .
7.5
Weighting . . . . . . . . . . . . . . . . . . . . . . . . . . . . . . . . . . . . . . . . . . . . . . . . . . . . .
7.6
Suppression of Confidential Information . . . . . . . . . . . . . . . . . . . . . . . . . . . . .
SpecialSurveysDivision
25
25
25
26
27
27
28
3
8.0
Data Quality . . . . . . . . . . . . . . . . . . . . . . . . . . . . . . . . . . . . . . . . . . . . . . . . . . . . . . . .
8.1
Response Rates . . . . . . . . . . . . . . . . . . . . . . . . . . . . . . . . . . . . . . . . . . . . . . .
8.2
Survey Errors . . . . . . . . . . . . . . . . . . . . . . . . . . . . . . . . . . . . . . . . . . . . . . . . . .
8.2.1 The Frame . . . . . . . . . . . . . . . . . . . . . . . . . . . . . . . . . . . . . . . . . . . . . .
8.2.2 Data Collection . . . . . . . . . . . . . . . . . . . . . . . . . . . . . . . . . . . . . . . . . . .
8.2.3 Data Processing . . . . . . . . . . . . . . . . . . . . . . . . . . . . . . . . . . . . . . . . . .
8.2.4 Non-response . . . . . . . . . . . . . . . . . . . . . . . . . . . . . . . . . . . . . . . . . . . .
8.2.5 Measurement of sampling error . . . . . . . . . . . . . . . . . . . . . . . . . . . . . .
29
29
29
30
30
31
32
33
9.0
Guidelines for Tabulation, Analysis and Release . . . . . . . . . . . . . . . . . . . . . . . . . .
9.1
Rounding Guidelines . . . . . . . . . . . . . . . . . . . . . . . . . . . . . . . . . . . . . . . . . . . .
9.2
Sample Weighting Guidelines for Tabulation . . . . . . . . . . . . . . . . . . . . . . . . . .
9.3
Definitions of types of estimates: Categorical vs. Quantitative . . . . . . . . . . . .
9.3.1 Categorical Estimates . . . . . . . . . . . . . . . . . . . . . . . . . . . . . . . . . . . . . .
9.3.2 Tabulation of Categorical Estimates . . . . . . . . . . . . . . . . . . . . . . . . . . .
9.3.3 Tabulation of Quantitative Estimates . . . . . . . . . . . . . . . . . . . . . . . . . .
9.4
Guidelines for Statistical Analysis . . . . . . . . . . . . . . . . . . . . . . . . . . . . . . . . . .
9.5
C.V. Release Guidelines . . . . . . . . . . . . . . . . . . . . . . . . . . . . . . . . . . . . . . . . .
34
34
35
35
35
36
37
37
38
10.0
Approximate Sampling Variability Tables . . . . . . . . . . . . . . . . . . . . . . . . . . . . . . . . 40
10.1 How to use the CV tables for Categorical Estimates . . . . . . . . . . . . . . . . . . . . 41
10.1.1 Examples of using the C.V. tables for Categorical Estimates . . . . . . . . 43
10.2 How to use the C.V. tables to obtain Confidence Limits . . . . . . . . . . . . . . . . . . 46
10.2.1 Example of using the C.V. tables to obtain confidence limits . . . . . . . . 47
10.3 How to use the C.V. tables to do a t-test . . . . . . . . . . . . . . . . . . . . . . . . . . . . . 47
10.3.1 Example of using the C.V. tables to do a t-test . . . . . . . . . . . . . . . . . . 48
10.4 Coefficients of Variation for Quantitative Estimates . . . . . . . . . . . . . . . . . . . . . 48
10.5 Release cut-off's for the National Survey of Giving, Volunteering and Participating
49
10.6 C.V. Tables . . . . . . . . . . . . . . . . . . . . . . . . . . . . . . . . . . . . . . . . . . . . . . . . . . . 50
11.0
Weighting . . . . . . . . . . . . . . . . . . . . . . . . . . . . . . . . . . . . . . . . . . . . . . . . . . . . . . . . . . 61
11.1 Weighting Procedures for the LFS . . . . . . . . . . . . . . . . . . . . . . . . . . . . . . . . . . 61
11.2 Weighting Procedures for the National Survey of Giving, Volunteering and
Participating . . . . . . . . . . . . . . . . . . . . . . . . . . . . . . . . . . . . . . . . . . . . . . . . . . . 62
12.0
Structure of the National Survey of Giving, Volunteering and Participating Files 63
12.1 Variable Naming Conventions used in the National Survey of Giving, Volunteering
and Participating Files . . . . . . . . . . . . . . . . . . . . . . . . . . . . . . . . . . . . . . . . . . . 63
Special Surveys Division
4
13.0
Record Layout and Univariates . . . . . . . . . . . . . . . . . . . . . . . . . . . . . . . . . . . . . . . . 67
Main File . . . . . . . . . . . . . . . . . . . . . . . . . . . . . . . . . . . . . . . . . . . . . . . . . . . . . . . . . . . 68
VD File . . . . . . . . . . . . . . . . . . . . . . . . . . . . . . . . . . . . . . . . . . . . . . . . . . . . . . . . . . . 163
GS File . . . . . . . . . . . . . . . . . . . . . . . . . . . . . . . . . . . . . . . . . . . . . . . . . . . . . . . . . . . 176
Special Surveys Division
5
2000 National Survey of Giving, Volunteering and Participating - User Guide
1.0
Introduction
The National Survey of Giving, Volunteering and Participating (NSGVP) is one component of the
Voluntary Sector Initiative, a collaborative program of the federal government and the voluntary
sector. The 2000 NSGVP was conducted by Statistics Canada in October, November and early
December of 2000 on behalf of the Voluntary Sector Initiative and in partnership with federal
policy departments and voluntary organizations.
This manual has been produced to facilitate the manipulation of the microdata file of the survey
results.
Any questions about the data set or its use should be directed to:
Statistics Canada
Client Services
Special Surveys Division, Statistics Canada
Section B-5
5th floor, Jean Talon Building
Tunney's Pasture
Ottawa, Ontario
K1A 0T6
[email protected]
1-888-297-7355
[email protected]
Special Surveys Division
6
2000 National Survey of Giving, Volunteering and Participating - User Guide
2.0
Background
Canadians provide support to one another and their communities in a myriad of ways, however,
the breadth and depth of this support was largely unknown and undocumented until recently. In
1997, the National Survey of Giving, Volunteering and Participating (NSGVP) provided the first
comprehensive look at the contributions that Canadians made to one another through their gifts of
time and money. Using a similar framework, this survey was conducted again in 2000 enabling an
examination of the changes in these behaviours over a three-year period. Fittingly, the release of
the results of the 2000 NSGVP coincides with The United Nations’ International Year of
Volunteers (IYV), which serves to highlight the contributions that volunteers make to Canadian
life.
The NSGVP is the result of a partnership of federal government departments and voluntary sector
organizations that includes the Canadian Centre for Philanthropy, Canadian Heritage, Health
Canada, Human Resources Development Canada, Statistics Canada and Volunteer Canada. It
was conducted in 1997 as a special survey by Statistics Canada and, beginning with the 2000
survey, the NSGVP will be conducted every three years as part of the Federal Government’s
Voluntary Sector Initiative.
The content of the 2000 NSGVP and its methodology are, for the most part, identical to that of the
1997 Survey. The 2000 survey is based on a representative sample of 14,724 Canadians aged 15
and over who were asked how they gave money and other resources to individuals and to
organizations, volunteered time to help others and to enhance their communities, and participated
in the practices of active citizenship.
The survey, given its scale, provides the most comprehensive assessment of giving, volunteering
and participating ever undertaken in Canada or, to the best of our knowledge, in the world. The
2000 survey replicates the 1997 survey and enables us to begin to track both changes in
contributory behaviours and changes in the characteristics of those Canadians making
contributions. Any trend in these behaviours has important implications for Canadian society. The
results from the survey allow this report to paint a portrait of the ways Canadians contribute to
society through their monetary and voluntary support of others.
Special Surveys Division
7
2000 National Survey of Giving, Volunteering and Participating - User Guide
3.0
Objectives
The objectives of the NSGVP are threefold:
1)
2)
3)
to collect national data to fill a void of information about individual contributory behaviours
including volunteering, charitable giving and civic participation;
to provide reliable and timely data to the System of National Accounts; and
to inform both the public and voluntary sectors in policy and program decisions that relate
to the charitable and volunteer sector.
Special Surveys Division
8
2000 National Survey of Giving, Volunteering and Participating - User Guide
4.0
Concepts and Definitions
This chapter outlines concepts and definitions of interest to the users. The concepts and
definitions used in the Labour Force Survey are described in section 4.1 while those specific to
the National Survey of Giving, Volunteering and Participating are given in section 4.2. Users are
referred to Chapter 12 of this document for a copy of the actual survey forms used.
4.1
Labour Force Survey Concepts and Definitions
Labour Force Status
Status of the respondent in the labour market : a member of the non-institutional
population 15 years and over is designated as either employed, unemployed or not in the
labour force.
Employed
Employed persons are those who, during the reference week:
(a)
did any work1 at all
(b)
had a job but were not at work due to:
- own illness or disability
- personal or family responsibilities
- bad weather
- labour dispute
- vacation
- other reason not specified above (excluding persons on layoff and
persons whose job attachment was to a job starting at a definite date in the
future).
Unemployed
Unemployed persons are those who, during the reference week:
(a)
were without work, had actively looked for work in the past four weeks (ending with
reference week), and were available for work2;
1
Work includes any work for pay or profit, that is, paid work in the context of an employer-employee relationship, or selfemployment. It also includes unpaid family work where unpaid family work is defined as unpaid work which contributed
directly to the operation of a farm, business or professional practice owned or operated by a related member of the
household. Such activities may include keeping books, selling products, waiting on tables, and so on. Tasks such as
housework or maintenance of the home are not considered unpaid family work.
2
Persons in this group meeting the following criteria are regarded as available:
(i)
were full-time students seeking part-time work who also met condition (ii) below. (Full-time students looking for
full-time work are classified as not available for work in the reference week.)
(ii)
reported that there was no reason why they could not take a job in reference week, or if they could not take a
job it was because of "own illness or disability", "personal or family responsibilities", or "already had a job".
Special Surveys Division
9
2000 National Survey of Giving, Volunteering and Participating - User Guide
(b)
had not actively looked for work in the past four weeks but had been on layoff3 and
were available for work;
(c)
had not actively looked for work in the past four weeks but had a new job to start in
four weeks or less from the reference week, and were available for work.
Not in the Labour Force
Those persons in the civilian non-institutional population 15 years of age and over who,
during the reference week, were neither employed nor unemployed.
Industry and Occupation
The Labour Force Survey provides information about the occupation and industry
attachment of employed and unemployed persons, and of persons not in the labour force
who have held a job in the past five years. Since 1984, these statistics have been based
on the 1980 Standard Occupational Classification and the 1980 Standard Industrial
Classification. Prior to 1984, the 1971 Standard Occupational Classification and the 1970
Standard Industrial Classification were used.
Reference week
Entire calendar week covered by the Labour Force Survey each month. It is usually the
week containing the 15th day of the month. The interviews are conducted during the
following week, called the Survey Week, and the labour force status determined is that of
the reference week.
Full-time
Full-time employment consists of persons who usually work 30 hours or more per week,
plus those who usually work less than 30 hours but consider themselves to be employed
full-time (e.g. airline pilots).
3
Persons are classified as being on layoff only when they expect to return to the job from which they were laid off.
Special Surveys Division
10
2000 National Survey of Giving, Volunteering and Participating - User Guide
Part-time
Part-time employment consists of all other persons who usually work less than 30 hours
per week.
4.2
National Survey of Giving, Volunteering and Participating
Concepts and Definitions
Cash donation
Refers to a donation of cash made to a charitable or non-profit organization. Three types
of cash donations were measured:
1)
Financial donation refers to a cash donation made in response to, or by
approaching a charitable or non-profit organization;
2)
Cash box donation refers to depositing spare change in cash boxes usually
located beside a cash register at store check-outs; and
3)
Leaving a bequest which involves leaving a cash donation to a charitable or nonprofit organization in one’s will.
Charitable giving
Encompasses the following types of charitable giving which were measured in this survey:
cash donations, in-kind donations and indirect financial support.
Donor
Any person who made donations of money to a charitable or non-profit organization during
the 12-month period preceding the survey
Indirect financial support
This survey also measured individuals participation in supporting charitable and non-profit
organizations through indirect financial support. Indirect financial support includes
purchasing goods such as chocolate bars or coupon books where the proceeds go to a
charitable organization, purchasing charity-sponsored raffle or lottery tickets, and gaming
in charity sponsored bingos or casinos.
Special Surveys Division
11
2000 National Survey of Giving, Volunteering and Participating - User Guide
In-Kind Donations
Are non-monetary donations made to a charitable or non-profit organization. Examples
include donations of clothing or household items and donations of food.
Volunteer
Any individual who volunteered, i.e. , who willingly performed a service without pay,
through a group or organization during the 12-month reference period preceding the
survey.
Other types of giving
The NSGVP also asked questions about financial support given to people directly, not
through an organization. Individuals were asked about whether they had given money to
relatives living outside of their household, homeless people or others living outside of their
household.
Other ways of helping people
The NSGVP also asked individuals about a variety of ways in which they provided help to
others directly, not though the structure of an organization. This type of help refers to help
given to individuals living outside of the respondents household.
Participating
Refers to being a member or a participant in any of the following types of organizations:
work related; sports or recreation; religious affiliated; community or school related; cultural,
educational, or hobby related; service club or fraternal organization; and political.
Organization classification
Respondents were asked to provide information on the organizations for which they
volunteered and to which they made donations. Respondents were first asked to provide
the name of the organization. A pick-list of common organizations was used. If the
organization cited by the respondent was not on this pick-list, the respondent was then
asked to provide information about what this organization does. This information was then
used to group organizations into broad categories.
The International Classification of Nonprofit Organizations (ICNPO) Revision 1,
developed by the Johns Hopkins Comparative Nonprofit Sector Project, was used to code
organizations. A major advantage of the ICNPO system is that it is used widely by other
countries and thus allows for international comparisons. The ICNPO system groups
Special Surveys Division
12
2000 National Survey of Giving, Volunteering and Participating - User Guide
organizations into 12 Major Activity Groups, including a catch-all “Not Elsewhere
Classified” category. These 12 Major Activity Groups are further subdivided into 24 subgroups. The groups are as follows:
1.
Culture and Recreation: includes organizations and activities in general and
specialized fields of culture and recreation. Three sub-groups of organizations are
included in this group: (1) culture and arts (i.e., media and communications; visual
arts, architecture, ceramic art; performing art; historical, literacy and humanistic
societies; museums; and zoos and aquariums); (2) sports; and (3) other recreation
and social clubs (i.e., service clubs and recreation and social clubs).
2.
Education and Research: includes organizations and activities administering,
providing, promoting, conducting, supporting and servicing education and
research. Four sub-groups are contained in this group: (1) primary and secondary
education organizations; (2) higher education organizations; (3) organizations
involved in other education (i.e., adult/continuing education and
vocational/technical schools); and 4) organizations involved in research (i.e.,
medical research, science and technology, and social sciences).
3.
Health: includes organizations that engage in health-related activities, providing
health care, both general and specialized services, administration of health care
services, and health support services. Four sub-groups are included in this
category: (1) hospitals and rehabilitation; (2) nursing homes; (3) mental health and
crisis intervention; and (4) other health services (i.e., public health and wellness
education, out-patient health treatment, rehabilitative medical services, and
emergency medical services).
4.
Social Services: includes organizations and institutions providing human and
social services to a community or target population. Three sub-groups are
contained in this category: (1) social services (including organizations providing
services for children, youth, families, the handicapped and the elderly, and selfhelp and other personal social services; (2) emergency and relief; and income
support and maintenance.
5.
Environment: includes organizations promoting and providing services in
environmental conservation, pollution control and prevention, environmental
education and health, and animal protection. Two sub-groups are included in this
category: environment and animal protection.
6.
Development and Housing: includes organizations promoting programs and
providing services to help improve communities and promote the economic and
social well-being of society. Three sub-groups are included in this category: (1)
economic, social and community development (including community and
neighbourhood organizations); (2) housing; and (3) employment and training.
Special Surveys Division
13
2000 National Survey of Giving, Volunteering and Participating - User Guide
7.
Law, Advocacy and Politics: includes organizations and groups that work to
protect and promote civil and other rights, advocate the social and political
interests of general or special constituencies, offer legal services and that promote
public safety. Three sub-groups are contained in this category: (1) civic and
advocacy organizations; (2) law and legal services; and (3) political organizations.
8.
Philanthropic Intermediaries and Voluntarism: includes philanthropic
organizations and organizations promoting charity and charitable activities
including grant-making foundations, voluntarism promotion and support, and fundraising organizations.
9.
International: includes organizations promoting cultural understanding between
peoples of various countries and historical backgrounds and also those providing
relief during emergencies and promoting development and welfare abroad.
10.
Religion: organizations promoting religious beliefs and administering religious
services and rituals; includes churches, mosques, synagogues, temples, shrines,
seminaries, monasteries and similar religious institutions, in addition to related
organizations and auxiliaries of such organizations.
11.
Business and professional associations, Unions: includes organizations
promoting, regulating and safeguarding business, professional and labour
interests.
12.
Groups not elsewhere classified
Special Surveys Division
14
2000 National Survey of Giving, Volunteering and Participating - User Guide
5.0
Survey Methodology
The National Survey of Giving, Volunteering and Participating was administered in October,
November and early December of 2000 to a sub-sample of the dwellings in the Labour Force
Survey (LFS) sample, and therefore its sample design is closely tied to that of the LFS. The LFS
design is briefly described in Sections 5.1 to 5.44 Sections 5.5 and 5.6 describe how the National
Survey of Giving, Volunteering and Participating departed from the basic LFS design in October
2000.
5.1
Population Coverage
The LFS is a monthly household survey whose sample of individuals is representative of
the civilian, non-institutionalized population 15 years of age or older in Canada's ten
provinces. Specifically excluded from the survey's coverage are residents of the Yukon5,
Northwest Territories and Nunavut, persons living on Indian Reserves, full-time members
of the Canadian Armed Forces and inmates of institutions. These groups together
represent an exclusion of approximately 2% of the population aged 15 or over.
5.2
Sample Design
The LFS has undergone an extensive redesign, culminating in the introduction of the new
design at the end of 1994. The LFS sample is based upon a stratified, multi-stage design
employing probability sampling at all stages of the design. The design principles are the
same for each province. A diagram summarizing the design stages appears at the end of
this section.
5.2.1
Primary Stratification
Provinces are divided into economic regions and employment insurance regions.
Economic regions (ERs) are geographic areas of more or less homogeneous
economic structure formed on the basis of federal provincial agreements. They
are relatively stable over time. Employment insurance economic regions (EIERs)
are also geographic areas, and are roughly the same size and number as ERs, but
they do not share the same definitions. Labour force estimates are produced for
the EIER regions for the use of Human Resources Development Canada.
4
A detailed description of the LFS design is available in the Statistics Canada publication entitled Methodology of the
Canadian Labour Force Survey, 1994-2000 (catalogue #71-526-XPB).
5
Since 1992, the LFS has been administered in the Yukon, using an alternative methodology that accommodates some of
the operational difficulties inherent to remote locales. To improve reliability due to small sample size, estimates are
available on a three month average basis only. These estimates are not included in national totals.
Special Surveys Division
15
2000 National Survey of Giving, Volunteering and Participating - User Guide
The intersections of the two types of regions form the first level of stratification for
the LFS. These ER/EIER intersections are treated as primary strata and further
stratification is carried out within them (see section 5.2.3). Note that a third set of
regions, Census Metropolitan Areas (CMAs), is also respected by stratification in
the current LFS design, since each CMA is also an EIER.
5.2.2
Types of Areas
The primary strata (ER/EIER intersections) are further disaggregated into 3 types
of areas: rural, urban, and remote areas. Urban and rural areas are loosely based
on the Census definitions of urban and rural, with some exceptions to allow for the
formation of strata in some areas. Urban areas include the largest CMAs down to
the smallest villages categorized by the 1991 Census as urban (1000 people or
more), while rural areas are made up of areas not designated as urban or remote.
All urban areas are further subdivided into two types: those using an apartment list
frame and an area frame, as well as those using only an area frame.
Approximately 1% of the LFS population is found in remote areas of provinces
which are less accessible to LFS interviewers than other areas. For administrative
purposes, this portion of the population is sampled separately through the remote
area frame. Some populations, not congregated in places of 25 or more people,
are excluded from the sampling frame.
5.2.3
Secondary Stratification
In urban areas with sufficiently large numbers of apartment buildings, the strata are
subdivided into apartment frames and area frames. The apartment list frame is a
register which is based upon information supplied by Canadian Mortgage and
Housing Corporation (CMHC) and is maintained in the 18 largest cities across
Canada. The purpose of this is to ensure better representation of apartment
dwellers in the sample as well as to minimize the effect of growth in clusters, due
to construction of new apartment buildings. In the major cities, the apartment strata
are further stratified into low income strata and regular strata.
Where it is possible and/or necessary, the urban area frame is further stratified into
regular strata, high income strata, and low population density strata. Most urban
areas fall into the regular urban strata, which, in fact, cover the majority of
Canada’s population. High income strata are found in major urban areas, while low
density urban strata consist of small towns that are geographically scattered.
In rural areas, the population density can vary greatly from relatively high
population density areas to low population density areas, resulting in the formation
of strata that reflect these variations. The different stratification strategies for rural
Special Surveys Division
16
2000 National Survey of Giving, Volunteering and Participating - User Guide
areas were based not only on concentration of population, but also on costefficiency and interviewer constraints.
In each province, remote settlements are sampled proportional to the number of
dwellings in the settlement, with no further stratification taking place. Dwellings are
selected using systematic sampling in each of the places sampled.
5.2.4
Cluster Delineation and Selection
Households in final strata are not selected directly. Instead, each stratum is divided
into clusters, and then a sample of clusters is selected within the stratum.
Dwellings are then sampled from selected clusters. Different methods are used to
define the clusters, depending on the type of stratum.
Within each urban stratum in the urban area frame, a number of geographically
contiguous groups of dwellings, or clusters, are formed based upon 1991 Census
counts. These clusters are generally a set of one or more city blocks or block
faces. The selection of a sample of clusters (always 6 or a multiple of 6 clusters)
from each of these secondary strata represents the first stage of sampling in most
urban areas. In some other urban areas, Census Enumeration Areas (EAs) are
used as clusters. In the low density urban strata, a three stage design is followed.
Under this design, two towns within a stratum are sampled, and then six or 24
clusters within each town are sampled.
For urban apartment strata, instead of defining clusters, the apartment building is
the primary sampling unit. Apartment buildings are sampled from the list frame with
probability proportional to the number of units in each building.
Within each of the secondary strata in rural areas, where necessary, further
stratification is carried out in order to reflect the differences among a number of
socio-economic characteristics within each stratum. Within each rural stratum, six
EAs or two or three groups of EAs are sampled as clusters.
Special Surveys Division
17
2000 National Survey of Giving, Volunteering and Participating - User Guide
5.2.5
Dwelling Selection
In all three types of areas (urban, rural and remote areas) selected clusters are
first visited by enumerators in the field and a listing of all private dwellings in the
cluster is prepared. From the listing, a sample of dwellings is then selected. The
sample yield depends on the type of stratum. For example, in the urban area
frame, sample yields are either 6 or 8 dwellings, depending on the size of the city.
In the urban apartment frame, each cluster yields 5 dwellings, while in the rural
areas and EA parts of cities, each cluster yields 10 dwellings. In all clusters,
dwellings are sampled systematically. This represents the final stage of sampling.
5.2.6
Person Selection
Demographic information is obtained for all persons for whom the selected
dwelling is the usual place of residence. LFS information is obtained for all civilian
household members 15 years of age or older. Response burden is minimized for
the elderly (70 years of age or older) by carrying forward their responses for the
initial interview to the subsequent five months in the survey.
Special Surveys Division
18
Labour Force Survey Sample Design - 1995+
Province
EIR-ER
Intersection
{76.4%}
{22.6%}
Urban Areas
Rural Areas
{5.6%}
{70.8%}
Apartment List Frame
Area Frame
{0.6%}
Low Income
Apartments
{5.0%}
Regular
Apartments
{1.0%}
Remote Areas
{69.2%}
{0.8%}
{0.8%}
{18.3%}
{4.3%}
Regular
Area Frame
High Income
Area Frame
Low Population
Density
High Population
Density
Low Population
Density
stratum
stratum
stratum
stratum
stratum
stratum
stratum
stratum
building
building
cluster & EA
cluster & EA
town
EA
EA group
Place/EA
dwelling
dwelling
dwelling
dwelling
cluster
dwelling
dwelling
dwelling
dwelling
= level of stratification
= stage of sampling
EIR - Employment Insurance Region
ER - Economic Region
{%} - percentage of total sample
EA - Census Enumeration Area
cluster - set of blockfaces
2000 National Survey of Giving, Volunteering and Participating - User Guide
5.3
Sample Size
The sample size of eligible persons in the LFS is determined so as to meet the statistical
precision requirements for various labour force characteristics at the provincial and
subprovincial level, to meet the requirements of federal, provincial and municipal
governments as well as a host of other data users.
The monthly LFS sample consists of approximately 60,000 dwellings. After excluding
dwellings found to be vacant, dwellings demolished or converted to non-residential uses,
dwellings containing only ineligible persons, dwellings under construction, and seasonal
dwellings, about 52,350 dwellings remain which are occupied by one or more eligible
persons. From these dwellings, LFS information is obtained for approximately 102,000
civilians aged 15 or over.
5.4
Sample Rotation
The LFS employs a panel design whereby the entire monthly sample of dwellings consists
of 6 panels, or rotation groups, of approximately equal size. Each of these panels is, by
itself, representative of the entire LFS population. All dwellings in a rotation group remain
in the LFS sample for 6 consecutive months after which time they are replaced (rotated
out of the sample) by a new panel of dwellings selected from the same or similar clusters.
This rotation pattern was adopted to minimize any problems of non-response or
respondent burden that would occur if households were to remain in the sample for longer
than 6 months. It also has the statistical advantage of providing a common sample base
for short-term month-to-month comparisons of LFS characteristics, since five of the six
rotation groups in the LFS sample are common from month to month.
Because of the rotation group feature, it is possible to readily conduct supplementary
surveys using the LFS design but employing less than the full size sample.
Special Surveys Division
20
2000 National Survey of Giving, Volunteering and Participating - User Guide
5.5
Modifications to the LFS design for the National Survey of
Giving, Volunteering and Participating
The National Survey of Giving, Volunteering and Participating used five of the six rotation
groups in the October 2000 LFS sample. For the NSGVP, the coverage of the LFS was
set at the household level. Unlike the LFS where information is collected for all eligible
household members, the NSGVP only collected information from one pre-selected
household member and proxy responses were not permitted.
5.6
Sample size by Province for the National Survey of Giving,
Volunteering and Participating
The following table shows the number of households in the LFS sampled rotations who
were eligible for the National Survey of Giving, Volunteering and Participating supplement.
This tables includes households which were non-respondents to the LFS.
PROVINCE
SAMPLE SIZE
Newfoundland
1,628
Prince Edward Island
1,222
Nova Scotia
2,946
New Brunswick
2,589
Quebec
8,876
Ontario
13,102
Manitoba
3,199
Saskatchewan
3,393
Alberta
3,520
British Columbia
4,137
CANADA
44,612
Special Surveys Division
21
2000 National Survey of Giving, Volunteering and Participating - User Guide
6.0
Data Collection
Data collection for the LFS is carried out each month during the week following the LFS reference
week, usually the third week of the month.
6.1
Interviewing for the LFS
Statistics Canada interviewers, who are part-time employees hired and trained specifically
to carry out the LFS, contact each of the sampled dwellings to obtain the required labour
force information. Each interviewer contacts approximately 70 dwellings per month.
Dwellings new to the sample are contacted through a personal visit. The interviewer first
obtains socio-demographic information for each household member and then obtains
labour force information for all eligible members. Provided there is a telephone in the
dwelling and permission has been granted, subsequent interviews are conducted by
telephone. As a result, approximately 85% of all dwellings are interviewed by telephone.
In these subsequent monthly interviews, as they are called, the interviewer confirms the
socio-demographic information collected in the first month and collects the labour force
information for the current month.
In all dwellings, information about all household members is obtained from a
knowledgeable household member - usually the person at home when the interviewer
calls. Such 'proxy' reporting, which accounts for approximately 55% of the information
collected, is used to avoid the high cost and extended time requirements that would be
involved in repeat visits or calls necessary to obtain information directly from each
respondent.
At the conclusion of the LFS monthly interviews, interviewers introduce the supplementary
survey, if any, to be administered to some or all household members that month.
If, during the course of the six months that a dwelling normally remains in the sample, an
entire household moves out and is replaced by a new household, information is obtained
about the new household for the remainder of the six-month period.
6.2
Supervision and Control
All LFS interviewers are under the supervision of a staff of senior interviewers who are
responsible for ensuring that interviewers are familiar with the concepts and procedures of
the LFS and its many supplementary surveys, and also for periodically monitoring their
interviewers and reviewing their completed documents. The senior interviewers are, in
Special Surveys Division
22
2000 National Survey of Giving, Volunteering and Participating - User Guide
turn, under the supervision of the LFS program managers, located in each of the 8
Statistics Canada regional offices.
6.3
Non-Response to the LFS
Interviewers are instructed to make all reasonable attempts to obtain LFS interviews with
members of eligible households. For individuals who at first refuse to participate in the
LFS, a letter is sent from the Regional Office to the dwelling address stressing the
importance of the survey and the household's cooperation. This is followed by a second
call (or visit) from the interviewer. For cases in which the timing of the interviewer's call (or
visit) is inconvenient, an appointment is arranged to call back at a more convenient time.
For cases in which there is no one home, numerous call backs are made. Under no
circumstances are sampled dwellings replaced by other dwellings for reasons of nonresponse.
Each month, after all attempts to obtain interviews have been made, a small number of
non-responding households remain. For households non-responding to the LFS and for
which LFS information was obtained in the previous month, this information is brought
forward and used as the current month's LFS information. No supplementary survey
information is collected for these households.
6.4
Data Collection Modifications for the National Survey of Giving,
Volunteering and Participating
The National Survey of Giving, Volunteering and Participating was administered to one
randomly selected individual per household. The random selection was carried out after
the LFS survey was completed .
Upon completion of the Labour Force Survey interview, the interviewer asked to speak to
the randomly selected person for the National Survey of Giving, Volunteering and
Participating. If the selected person was not available, the interviewer arranged for a
convenient time to phone back. Proxy response was not allowed, hence the collection
period was extended until December to allow the interviewers time to contact the preselected individuals.
Further sub-sampling was carried out on respondents who were not volunteers. After
completion of the first set of NSGVP questions relating to volunteer activities, respondents
who were not volunteers had a 65% chance of being dropped from the survey which was
determined by a pre-programmed random selection process. Consequently, 13,449
respondents who were not volunteers were screened out of the survey. While these
respondents were used in calculating the response rates, they are not included in the final
data file.
Special Surveys Division
23
2000 National Survey of Giving, Volunteering and Participating - User Guide
6.5
Non-Response to the National Survey of Giving, Volunteering
and Participating
For households responding to the LFS (40,236 of 44,612 households), the next stage of
data collection was to administer the National Survey of Giving, Volunteering and
Participating. In total, 40,236 households (in which one individual was selected) were
eligible for the supplementary survey while 4,376 households were non-responses to the
LFS and thus were not contacted for the NSGVP. The National Survey of Giving,
Volunteering and Participating interview was completed for 28,173 of these individuals for
a collection response rate of 70.0%. The overall response rate (response over all sampled
households (response or non-response)) is 63.2%. Of those who responded to NSGVP,
13,449 non-volunteers were screened out of the survey. More detailed information on
response rates is presented in Chapter 8 (Data Quality).
Special Surveys Division
24
2000 National Survey of Giving, Volunteering and Participating - User Guide
7.0
Data Processing
The main output of the National Survey of Giving, Volunteering and Participating is a "clean"
microdata file. This section presents a brief summary of the processing steps involved in
producing this file.
7.1
Editing
The first stage of survey processing undertaken at head office was the replacement of any
'out-of-range' values on the data file with blanks. This process was designed to make
further editing easier.
The first type of error treated was errors in questionnaire flow, where questions which did
not apply to the respondent (and should therefore not have been answered) were found to
contain answers. In this case a computer edit automatically eliminated superfluous data
by following the flow of the questionnaire implied by answers to previous, and in some
cases, subsequent questions.
The second type of error treated involved a lack of information in questions which should
have been answered. For this type of error, a non-response or "not-stated" code was
assigned to the item except for certain cases where an imputation process was used to
derive a value. This is discussed in more details in section 7.3.
7.2
Coding of Open-ended Questions
A few data items on the questionnaire were recorded by interviewers in an open-ended
format. A total of four partially or completely open-ended questions were included in the
survey. These were items relating to organization information for which an individual
volunteered or to whom an individual made a donation. An “Other, specify” category was
asked for type of volunteer activity, how first became a volunteer, type of employer support
received for volunteering, skills gained by volunteering, other type of informal volunteering,
other type of donations made, country of birth, ethnicity, and religious affiliation.
Open-ended questions relating to organization information was used to classify
organizations into categories based on the International Classification for Non-Profit
Organizations (ICNPO) structure. Please see section 4.2 for further details on organization
classification.
For open-ended questions relating to “Other, specify” categories, the text was coded back
to an existing category, where one existed. In cases, where there was a high enough
frequency, another category was created and “Other, specify’s” were coded to a newly
created category.
Special Surveys Division
25
2000 National Survey of Giving, Volunteering and Participating - User Guide
7.3
Imputation
Imputation is the process that supplies valid values for those variables that have been
identified for a change either because of invalid information or because of missing
information. The new values should be supplied in such a way as to preserve the
underlying structure of the data and to ensure that the resulting records will pass all
required edits. In other words, the objective is not to reproduce the true micro-data values,
but rather to establish internally consistent data records that yield good aggregate
estimates.
We can distinguish between three types of non-response. Complete non-response is
when the respondent quits the interview before the minimum set of questions was
answered. These records are reweighted. Partial non-response is when the respondent
quits the interview after the minimum set of questions was answered. The rest of the
questionnaire is filled using other respondent's information and this process is described
later. Finally there is item non-response when the respondent does not provide an answer
to one question, but goes on to the next question.
All imputations involved donors that were selected using a score function. For each item
non-response or partial non-response records (also called recipient records), we
compared certain characteristics to characteristics from all the donors. When the
characteristics were the same between a donor and the recipient, a value was added to
the score of that donor. The donor with the highest score was deemed the “closest” donor
and was chosen to fill in missing pieces of information of the non-respondents. If there
was more than one donor with the highest score, a random selection occurred. The pool of
donors was made up in such a way that the imputed value assigned to the recipient, in
conjunction with other non-imputed items from the recipient would still pass the edits.
Imputation was done in five independent steps. The first step was to impute both personal
and household income on the MAIN file (see section 12 for file structure). The second step
was to impute the volunteer-related variables (months of volunteering or number of weeks
volunteering, number of hours volunteered, etc…) on the VD file. The third step was to
impute on the MAIN file the number of organizations volunteered for and the number of
additional hours volunteered for organizations in cases where more than three
organizations are reported (only the details of the three most important organizations (in
terms of hours volunteered) are found on the VD file). The fourth step was to impute the
variables related to amount donated on the GS file. The last step was to impute partially
completed records on the MAIN file (partial non-response cases). In order to be kept on
the final file, each respondent had to complete at least the volunteering section of the
questionnaire. A number of respondents stopped filling in the questionnaire after this stage
and the rest of their questionnaire was imputed for a total of 158 different variables.
Further information on the imputation process is given in the data quality section.
Special Surveys Division
26
2000 National Survey of Giving, Volunteering and Participating - User Guide
7.4
Creation of Derived Variables
A number of data items on the microdata file have been derived by combining items on the
questionnaire in order to facilitate data analysis. Most derived variable names have a ‘D’
in the fourth character position of the name. Some of the derived variables have been
grouped for ease of use and are referred to as grouped variables which have a ‘G’ in the
fourth character position of the name.
Examples of derived variables include: total number of volunteer events and total hours
volunteered for the 12 organization types (derived from the VD file and put on the MAIN
file); total number of donations and total amount of donations for the 12 organization types
(derived from the GS file and put on the MAIN file);and total number of donations and total
amount of donations by solicitation method (derived from the GS file and put on the MAIN
file).
In general, a derived variable was not calculated if any part of the equation was not
answered (e.g., don't know, refusal, and not stated). In these cases the code assigned to
the derived variable was "not stated".
7.5
Weighting
The principle behind estimation in a probability sample such as the LFS is that each
person in the sample "represents", besides himself or herself, several other persons not in
the sample. For example, in a simple random 2% sample of the population, each person
in the sample represents 50 persons in the population.
The weighting phase is a step which calculates, for each record, what this number is. This
weight appears on the microdata file, and must be used to derive meaningful estimates
from the survey. For example, if the number of individuals who volunteered during the
past 12 months is to be estimated, it is done by selecting the records referring to those
individuals in the sample with that characteristic and summing the weights entered on
those records.
Details of the method used to calculate these weights are presented in Chapter 11.
Special Surveys Division
27
2000 National Survey of Giving, Volunteering and Participating - User Guide
7.6
Suppression of Confidential Information
It should be noted that the 'Public Use' microdata files described above differ in a number
of important respects from the survey 'master' files held by Statistics Canada. These
differences are the result of actions taken to protect the anonymity of individual survey
respondents. Users requiring access to information excluded from the microdata files may
purchase custom tabulations. Estimates generated will be released to the user, subject to
meeting the guidelines for analysis and release outlined in Section 9 of this document.
Province - Suppression of Geographic Identifiers
The survey master data file includes explicit geographic identifiers for province, economic
region and Census Metropolitan Area. It is also possible to obtain, where sample sizes
permit, estimates by urban size class. The survey public-use microdata files do not contain
any geographic identifiers below the provincial level.
Special Surveys Division
28
2000 National Survey of Giving, Volunteering and Participating - User Guide
8.0
Data Quality
8.1
Response Rates
The following table summarizes the response rates to the Labour Force Survey and to the
National Survey of Giving, Volunteering and Participating.
LFS
sample
LFS
response
LFS
response
rate
NSGVP
sample
NSGVP
response
rate
NSGVP
overall
response
rate
NSGVP
records
kept
Newfoundland
1,628
1,474
90.5%
1,083
73.5%
66.5%
593
Prince Edward Island
1,222
1,085
88.8%
778
71.7%
63.7%
437
Nova Scotia
2,946
2,668
90.6%
1,941
72.8%
65.9%
1,056
New Brunswick
2,589
2,359
91.1%
1,742
73.8%
67.3%
895
Québec
8,876
7,983
89.9%
5,588
70.0%
63.0%
2,368
Ontario
13,102
11,764
89.8%
8,572
72.9%
65.4%
4,520
Manitoba
3,199
2,910
91.0%
2,022
69.5%
63.2%
1,175
Saskatchewan
3,393
3,120
92.0%
2,247
72.0%
66.2%
1,351
Alberta
3,520
3,101
88.1%
1,979
63.8%
56.2%
1,189
British Columbia
4,137
3,772
91.2%
2,221
58.9%
53.7%
1,140
44,612
40,236
90.2%
28,173
70.0%
63.2%
14,724
CANADA
Note: LFS counts are in terms of households while NSGVP counts are in terms of selected
individuals within households (only one individual is selected per household). The
NSGVP sample column includes rejected non-volunteer while the NSGVP records kept
column excludes them. The NSGVP overall response rate is based on all LFS sampled
records including LFS non-respondents.
8.2
Survey Errors
The estimates derived from this survey are based on a sample of households.
Somewhat different figures might have been obtained if a complete census had been
taken using the same questionnaire, interviewers, supervisors, processing methods, etc.
as those actually used. The difference between the estimates obtained from the sample
Special Surveys Division
29
2000 National Survey of Giving, Volunteering and Participating - User Guide
and the results from a complete count taken under similar conditions is called the
sampling error of the estimate.
Errors which are not related to sampling may occur at almost every phase of a survey
operation. Interviewers may misunderstand instructions, respondents may make errors
in answering questions, the answers may be incorrectly entered on the questionnaire
and errors may be introduced in the processing and tabulation of the data. These are all
examples of non-sampling errors.
Over a large number of observations, randomly occurring errors will have little effect on
estimates derived from the survey. However, errors occurring systematically will
contribute to biases in the survey estimates. Considerable time and effort was made to
reduce non-sampling errors in the survey. Quality assurance measures were
implemented at each step of the data collection and processing cycle to monitor the
quality of the data. These measures included the use of highly skilled interviewers,
extensive training of interviewers with respect to the survey procedures and
questionnaire, observation of interviewers to detect problems of questionnaire design or
misunderstanding of instructions, procedures to ensure that data capture errors were
minimized and coding and edit quality checks to verify the processing logic.
8.2.1
The Frame
Because the National Survey of Giving, Volunteering and Participating was a
supplement to the LFS, the frame used was the LFS frame. Any non-response to
the LFS had an impact on the NSGVP frame. Because non-response to the LFS
is quite low (usually less than 5%, but around 10% for the period of reference)
this impact was minimal. The quality of the sampling variables in the frame was
very high. The NSGVP sample consisted of five rotation groups from the LFS.
No records were dropped due to missing rotation group number or any other
type of sampling variable.
Note that the LFS frame excludes about 2% of all households in the 10 provinces
of Canada. Therefore, the NSGVP frame also excludes the same proportion of
households in the same geographical area. It is unlikely that this exclusion
introduces any significant bias into the survey data.
8.2.2
Data Collection
Interviewer training consisted of reading the NSGVP Procedures Manual,
Interviewers' Manual, practicing with the NSGVP training cases on the laptop
computer, and discussing any questions with senior interviewers before the start
of the survey. A description of the background and objectives of the survey was
provided, as well as a glossary of terms and a set of questions and answers.
Special Surveys Division
30
2000 National Survey of Giving, Volunteering and Participating - User Guide
Interviewers collected NSGVP information after the LFS information was
collected. The collection period ran from the week of October 16th to December
8th, 2001.
8.2.3
Data Processing
During processing of the data, 26 NSGVP records did not match to
corresponding records in the LFS. Thus they were coded as out-of-scope and
were dropped from further processing. When supplementary survey records do
not match to host survey records they must be dropped since a weight cannot be
derived for them.
Some records were discarded because they did not complete the first section of
the questionnaire (about volunteering). There was 236 such records and these
were coded as non-response.
Data processing of the NSGVP was done in a number of steps including
verification, coding, editing, imputation, estimation, confidentiality, etc... At each
step a picture of the output files is taken and an easy verification can be made
comparing files at the current and previous step. This greatly improved the data
processing stage.
Special Surveys Division
31
2000 National Survey of Giving, Volunteering and Participating - User Guide
8.2.4
Non-response
A major source of non-sampling errors in surveys is the effect of non-response
on the survey results. The extent of non-response varies from partial nonresponse (failure to answer just one or some questions) to total non-response.
Total non-response occurred because the interviewer was either unable to
contact the respondent, no member of the household was able to provide the
information, or the respondent refused to participate in the survey. Total nonresponse was handled by adjusting the weight of households who responded to
the survey to compensate for those who did not respond.
In most cases, partial and item non-response to the survey occurred when the
respondent did not understand or misinterpreted a question, refused to answer a
question, or could not recall the requested information. In partial and item nonresponse cases, donor imputation was performed for certain variables as
described in section 7.3. Most of these imputations were done in order to provide
complete data enabling the calculation of totals (total number of hours and total
number of amount given). Also, the imputation helped to keep records in sample
even if part of the required information was not filled in by the respondent.
The imputation was done in five steps and was performed on the three files. The
next table shows the rate of imputation by step:
Step 1
Income
Main
Step 2
Volunteer
VD
Step 3
Volunteer
Main
Step 4
Giver
GS
Step 5
Partial records
Main
Imputed
6,215
1,409
276
13,394
1,403
Total
14,724
13,067
14,724
56,280
14,724
Rate
46%
11%
2%
24%
10%
The 2000 NSGVP imputation process worked well and helped to fill incomplete
responses with the experience of other respondents with similar or identical
characteristics. This will add to the number of units used in any analysis
performed by researchers.
Note that the public use microdata file does not contain any of the imputation
flags. This also protects the confidentiality of respondents participating in the
survey.
Special Surveys Division
32
2000 National Survey of Giving, Volunteering and Participating - User Guide
8.2.5
Measurement of sampling error
Since it is an unavoidable fact that estimates from a sample survey are subject
to sampling error, sound statistical practice calls for researchers to provide users
with some indication of the magnitude of this sampling error. This section of the
documentation outlines the measures of sampling error which Statistics Canada
commonly uses and which it urges users producing estimates from this
microdata file to use also.
The basis for measuring the potential size of sampling errors is the standard
error of the estimates derived from survey results.
However, because of the large variety of estimates that can be produced from a
survey, the standard error of an estimate is usually expressed relative to the
estimate to which it pertains. This resulting measure, known as the coefficient of
variation (CV) of an estimate, is obtained by dividing the standard error of the
estimate by the estimate itself and is expressed as a percentage of the estimate.
For example, suppose that, based upon the survey results, one estimates that
80.9% of Canadian volunteers did so in order to use their skills and experience,
and this estimate is found to have standard error of .009. Then the coefficient of
variation of the estimate is calculated as :
.009
.809
Special Surveys Division
x 100% ' 1.1%
33
2000 National Survey of Giving, Volunteering and Participating - User Guide
9.0
Guidelines for Tabulation, Analysis and Release
This section of the documentation outlines the guidelines to be adhered to by users tabulating,
analyzing, publishing or otherwise releasing any data derived from the survey microdata tapes.
With the aid of these guidelines, users of microdata should be able to produce the same figures
as those produced by Statistics Canada and, at the same time, will be able to develop currently
unpublished figures in a manner consistent with these established guidelines.
9.1
Rounding Guidelines
In order that estimates for publication or other release derived from these microdata
tapes correspond to those produced by Statistics Canada, users are urged to adhere to
the following guidelines regarding the rounding of such estimates:
a)
Estimates in the main body of a statistical table are to be rounded to the nearest
hundred units using the normal rounding technique. In normal rounding, if the
first or only digit to be dropped is 0 to 4, the last digit to be retained is not
changed. If the first or only digit to be dropped is 5 to 9, the last digit to be
retained is raised by one. For example, in normal rounding to the nearest 100, if
the last two digits are between 00 and 49, they are changed to 00 and the
preceding digit (the hundreds digit) is left unchanged. If the last digits are
between 50 and 99 they are changed to 00 and the preceding digit is
incremented by 1.
b)
Marginal sub-totals and totals in statistical tables are to be derived from their
corresponding unrounded components and then are to be rounded themselves
to the nearest 100 units using normal rounding.
c)
Averages, proportions, rates and percentages are to be computed from
unrounded components (i.e. numerators and/or denominators) and then are to
be rounded themselves to one decimal using normal rounding. In normal
rounding to a single digit, if the final or only digit to be dropped is 0 to 4, the last
digit to be retained is not changed. If the first or only digit to be dropped is 5 to
9, the last digit to be retained is increased by 1.
d)
Sums and differences of aggregates (or ratios) are to be derived from their
corresponding unrounded components and then are to be rounded themselves
to the nearest 100 units (or the nearest one decimal) using normal rounding.
e)
In instances where, due to technical or other limitations, a rounding technique
other than normal rounding is used resulting in estimates to be published or
otherwise released which differ from corresponding estimates published by
Special Surveys Division
34
2000 National Survey of Giving, Volunteering and Participating - User Guide
Statistics Canada, users are urged to note the reason for such differences in the
publication or release document(s).
f)
Under no circumstances are unrounded estimates to be published or otherwise
released by users. Unrounded estimates imply greater precision than actually
exists.
9.2
Sample Weighting Guidelines for Tabulation
The sample design used for the National Survey of Giving, Volunteering and
Participating was not self-weighting. When producing simple estimates, including the
production of ordinary statistical tables, users must apply the proper sampling weight.
If proper weights are not used, the estimates derived from the microdata tapes cannot
be considered to be representative of the survey population, and will not correspond to
those produced by Statistics Canada.
Users should also note that some software packages may not allow the generation of
estimates that exactly match those available from Statistics Canada, because of their
treatment of the weight field.
9.3
Definitions of types of estimates: Categorical vs. Quantitative
Before discussing how the National Survey of Giving, Volunteering and Participating
data can be tabulated and analyzed, it is useful to describe the two main types of point
estimates of population characteristics which can be generated from the microdata file
for the National Survey of Giving, Volunteering and Participating.
9.3.1
Categorical Estimates
Categorical estimates are estimates of the number, or percentage of the
surveyed population possessing certain characteristics or falling into some
defined category. The number of Canadians who volunteered or the number of
Canadians who made financial donations are examples of such estimates. An
estimate of the number of persons possessing a certain characteristic may also
be referred to as an estimate of an aggregate.
Examples of Categorical Questions:
Special Surveys Division
35
2000 National Survey of Giving, Volunteering and Participating - User Guide
Q:
In the past 12 months, as an unpaid volunteer for an organization did you
provide information or help to educate, influence public opinion or lobby
others?:
R:
Yes / No
Q:
In the past 12 months, have you made a charitable donation by
responding to a request through the mail?
R:
Yes/ No
Quantitative Estimates
Quantitative estimates are estimates of totals or of means, medians and other
measures of central tendency of quantities based upon some or all of the
members of the surveyed population. They also specifically involve estimates of
^ ^
^
the form X/
Y where X^ is an estimate of surveyed population quantity total and Y
is an estimate of the number of persons in the surveyed population contributing
to that total quantity.
An example of a quantitative estimate is the average hours volunteered by
volunteers. The numerator is an estimate of the total number of hours
volunteered, and its denominator is the number of persons who volunteered.
Examples of Quantitative Questions :
Q:
How many hours per week did you usually volunteer for this
organization?
R:
|_|_| hours
Q:
What was the amount of this donation?
R:
|_|_|_|_|_| dollars
9.3.2
Tabulation of Categorical Estimates
Estimates of the number of people with a certain characteristic can be obtained
from the microdata file by summing the final weights of all records possessing
^
the characteristic(s) of interest. Proportions and ratios of the form X^ /Y
are
obtained by:
Special Surveys Division
36
2000 National Survey of Giving, Volunteering and Participating - User Guide
(a)
(b)
(c)
summing the final weights of records having the characteristic of interest
(X^ ),
^
summing the final weights of records the proportion is based on (Y
), then
dividing estimate (a) by estimate (b).
9.3.3
Tabulation of Quantitative Estimates
Estimates of quantities can be obtained from the microdata file by multiplying the
value of the variable of interest by the final weight for each record, then summing
this quantity over all records of interest. For example, to obtain an estimate of
the total number of hours volunteered by those aged 65 and over, multiply the
value reported in VD1DHRS (hours volunteered) by the final weight for the
record, then sum this value over all records with DH1DAGE=6 (age group 65
and over).
^ ^
^
To obtain a weighted average of the form X/Y
, the numerator (X)
is calculated as
^
for a quantitative estimate and the denominator (Y) is calculated as for a
categorical estimate. For example, to estimate the average number of hours
volunteered by those 65 years of age and older:
(a)
(b)
(c)
9.4
estimate the total number of hours volunteered as described above,
estimate the number of people in this category by summing the final
weights of all records with DH1DAGE=6, then
divide estimate (a) by estimate (b).
Guidelines for Statistical Analysis
The National Survey of Giving, Volunteering and Participating is based upon a complex
sample design, with stratification, multiple stages of selection, and unequal probabilities
of selection of respondents. Using data from such complex surveys presents problems
to analysts because the survey design and the selection probabilities affect the
estimation and variance calculation procedures that should be used. In order for survey
estimates and analyses to be free from bias, the survey weights must be used.
While many analysis procedures found in statistical packages allow weights to be used,
the meaning or definition of the weight in these procedures differ from that which is
appropriate in a sample survey framework, with the result that while in many cases the
estimates produced by the packages are correct, the variances that are calculated are
poor. Variances for simple estimates such as totals, proportions and ratios (for
qualitative variables) are provided in the accompanying Approximate Sampling
Variability Tables.
Special Surveys Division
37
2000 National Survey of Giving, Volunteering and Participating - User Guide
For other analysis techniques (for example linear regression, logistic regression and
analysis of variance), a method exists which can make the variances calculated by the
standard packages more meaningful, by incorporating the unequal probabilities of
selection. The method rescales the weights so that there is an average weight of 1.
For example, suppose that analysis of all male respondents is required. The steps to
rescale the weights are as follows:
-
-
select all respondents from the file who reported SEX=male
Calculate the AVERAGE weight for these records by summing the original
person weights from the microdata file for these records and then dividing by the
number of respondents who reported SEX=male
for each of these respondents, calculate a RESCALED weight equal to the
original person weight divided by the AVERAGE weight
perform the analysis for these respondents using the RESCALED weight.
However, because the stratification and clustering of the sample's design are still not
taken into account, the variance estimates calculated in this way are likely to be underestimates.
The calculation of truly meaningful variance estimates requires detailed knowledge of
the design of the survey. Such detail cannot be given in this microdata file because of
confidentiality. Variances that take the complete sample design into account can be
calculated for many statistics by Statistics Canada on a cost recovery basis.
9.5
C.V. Release Guidelines
Before releasing and/or publishing any estimate from the National Survey of Giving,
Volunteering and Participating, users should first determine the quality level of the
estimate. The quality levels are acceptable, marginal and unacceptable. Data quality is
affected by both sampling and non-sampling errors as discussed in section 8. However
for this purpose, the quality level of an estimate will be determined only on the basis of
sampling error as reflected by the coefficient of variation as shown in the table below.
Nonetheless users should be sure to read section 8 to be more fully aware of the quality
characteristics of these data.
First, the number of respondents who contribute to the calculation of the estimate should
be determined. If this number is less than 30, the weighted estimate should be
considered to be of unacceptable quality. For weighted estimates based on sample
sizes of 30 or more, users should determine the coefficient of variation of the estimate
and follow the guidelines below. These quality level guidelines should be applied to
weighted rounded estimates.
Special Surveys Division
38
2000 National Survey of Giving, Volunteering and Participating - User Guide
All estimates can be considered releasable. However, those of marginal or
unacceptable quality level must be accompanied by a warning to caution subsequent
users.
Quality Level Guidelines
Quality Level of
Estimate
Guidelines
1. Acceptable
Estimates have:
a sample size of 30 or more; and
low coefficients of variation in the range 0.0% - 16.5%
No warning is required.
2. Marginal
Estimates have:
a sample size of 30 or more; and
high coefficients of variation in the range 16.6% - 33.3%.
Estimates should be flagged with the letter M (or some similar identifier).
They should be accompanied by a warning to caution subsequent users
about the high levels of error, associated with the estimates.
3. Unacceptable
Estimates have:
a sample size of less than 30;
or very high coefficients of variation in excess of 33.3%.
Statistics Canada recommends not to release estimates of unacceptable
quality. However, if the user chooses to do so then estimates should be
flagged with the letter U (or some similar identifier) and the following
warning should accompany the estimates:
"The user is advised that . . . (specify the data) . . . do not meet Statistics
Canada's quality standards for this statistical program. Conclusions based
on these data will be unreliable, and most likely invalid. These data and
any consequent findings should not be published. If the user chooses to
publish these data or findings, then this disclaimer must be published with
the data."
Special Surveys Division
39
2000 National Survey of Giving, Volunteering and Participating - User Guide
10.0 Approximate Sampling Variability Tables
In order to supply coefficients of variation which would be applicable to a wide variety of
categorical estimates produced from this microdata file and which could be readily accessed by
the user, a set of Approximate Sampling Variability Tables has been produced. These CV
tables allow the user to obtain an approximate coefficient of variation based on the size of the
estimate calculated from the survey data.
The coefficients of variation (CV) are derived using the variance formula for simple random
sampling and incorporating a factor which reflects the multi-stage, clustered nature of the
sample design. This factor, known as the design effect, was determined by first calculating
design effects for a wide range of characteristics and then choosing from among these a
conservative value to be used in the look-up tables which would then apply to the entire set of
characteristics.
The table below shows the conservative value of the design effects, sample sizes and
population counts by province which were used to produce the Approximate Sampling
Variability Tables.
PROVINCE
DESIGN
EFFECT
SAMPLE
SIZE
POPULATION
Newfoundland
1.7
593
439,794
Prince Edward Island
1.8
437
109,944
Nova Scotia
2.0
1,056
749,927
New Brunswick
1.7
895
604,505
Quebec
2.8
2,368
5,947,590
Ontario
2.7
4,520
9,329,190
Manitoba
2.0
1,175
860,303
Saskatchewan
1.8
1,351
763,745
Alberta
2.0
1,189
2,329,405
British Columbia
1.9
1,140
3,248,804
Canada
3.1
14,724
24,383,207
Special Surveys Division
40
2000 National Survey of Giving, Volunteering and Participating - User Guide
All coefficients of variation in the Approximate Sampling Variability Tables are approximate and,
therefore, unofficial. Estimates of actual variance for specific variables may be obtained from
Statistics Canada on a cost-recovery basis. Since the approximate CV is conservative, the use
of actual variance estimates would allow users to switch from one quality level to an other. For
instance a marginal estimate could become acceptable based on the exact CV calculation.
Remember: If the number of observations on which an estimate is based is less than 30, the
weighted estimate is most likely unacceptable and Statistics Canada recommends not to
release such an estimate, regardless of the value of the coefficient of variation.
10.1 How to use the CV tables for Categorical Estimates
The following rules should enable the user to determine the approximate coefficients of
variation from the Sampling Variability Tables for estimates of the number, proportion or
percentage of the surveyed population possessing a certain characteristic and for ratios
and differences between such estimates.
Rule 1:
Estimates of Numbers Possessing a Characteristic
(Aggregates)
The coefficient of variation depends only on the size of the estimate itself. On the CV
table for the appropriate geographic area, locate the estimated number in the left-most
column of the table (headed "Numerator of Percentage") and follow the asterisks (if any)
across to the first figure encountered. This figure is the approximate coefficient of
variation.
Rule 2:
Estimates of Proportions or Percentages Possessing a
Characteristic
The coefficient of variation of an estimated proportion or percentage depends on both
the size of the proportion or percentage and the size of the total upon which the
proportion or percentage is based. Estimated proportions or percentages are relatively
more reliable than the corresponding estimates of the numerator of the proportion or
percentage, when the proportion or percentage is based upon a sub-group of the
population. For example, the proportion of volunteers is more reliable than the
estimated number of volunteers. (Note that in the tables the cv's decline in value
reading from left to right).
When the proportion or percentage is based upon the total population of the geographic
area covered by the table, the cv of the proportion or percentage is the same as the cv
of the numerator of the proportion or percentage. In this case, Rule 1 can be used.
Special Surveys Division
41
2000 National Survey of Giving, Volunteering and Participating - User Guide
When the proportion or percentage is based upon a subset of the total population (e.g.
those in a particular sex or age group), reference should be made to the proportion or
percentage (across the top of the table) and to the numerator of the proportion or
percentage (down the left side of the table). The intersection of the appropriate row and
column gives the coefficient of variation.
Rule 3:
Estimates of Differences Between Aggregates or Percentages
The standard error of a difference between two estimates is approximately equal to the
square root of the sum of squares of each standard error considered separately. That
is, the standard error of a difference (dˆ = X^ 1 - X^ 2) is:
2
2
s dˆ ' (Xˆ1 a1) % (Xˆ2 a2)
where X^ 1 is estimate 1, X^ 2 is estimate 2, and a1 and a2 are the coefficients of variation of
^
X^ 1 and X^ 2 respectively. The coefficient of variation of d^ is given by s dˆ /d.
This formula is
accurate for the difference between separate and uncorrelated characteristics, but is
only approximate otherwise.
Rule 4:
Estimates of Ratios
In the case where the numerator is a subset of the denominator, the ratio should be
converted to a percentage and Rule 2 applied. This would apply, for example, to the
case where the denominator is the number of volunteers and the numerator is the
number of volunteers who are employed.
In the case where the numerator is not a subset of the denominator, as for example, the
ratio of the number of full-time paid workers who volunteered as compared to the
number of part-time paid workers who volunteered in the reference year, the standard
deviation of the ratio of the estimates is approximately equal to the square root of the
sum of squares of each coefficient of variation considered separately multiplied by R.
^
That is, the standard error of a ratio (R
= X^ 1 / X^ 2) is:
s Rˆ ' Rˆ a12 % a22
where a1 and a2 are the coefficients of variation of X^ 1 and X^ 2 respectively. The
^
^
coefficient of variation of R
is given by s ^R/R.
The formula will tend to overstate the error,
^
^
if X1 and X2 are positively correlated and understate the error if X^ 1 and X^ 2 are negatively
correlated.
Special Surveys Division
42
2000 National Survey of Giving, Volunteering and Participating - User Guide
Rule 5:
Estimates of Differences of Ratios
In this case, Rules 3 and 4 are combined. The cv's for the two ratios are first
determined using Rule 4, and then the cv of their difference is found using Rule 3.
10.1.1 Examples of using the C.V. tables for Categorical Estimates
The following 'real life' examples are included to assist users in applying the
foregoing rules.
Example 1 : Estimates of Numbers Possessing a Characteristic
(Aggregates)
Suppose that a user estimates that 3,023,581 men were volunteers in the
reference period. How does the user determine the coefficient of variation of this
estimate?
(1)
Refer to the cv table for CANADA.
(2)
The estimated aggregate (3,023,581) does not appear in the left-hand
column (the 'Numerator of Percentage' column), so it is necessary to use
the figure closest to it, namely 3,000,000.
(3)
The coefficient of variation for an estimated aggregate is found by
referring to the first non-asterisk entry on that row, namely, 3.8%.
(4)
So the approximate coefficient of variation of the estimate is 3.8%.
The finding that 3,023,581 men (to be rounded according to the rounding
guidelines in section 9.1) were volunteers in the reference period is
publishable with no qualifications.
Example 2 : Estimates of Proportions or Percentages Possessing a
Characteristic
Suppose that the user estimates that 912,534/3,023,581=30.2% of men who
volunteer were a teacher or a coach for an organization in the reference period.
How does the user determine the coefficient of variation of this estimate?
(1)
Refer to the table for CANADA.
Special Surveys Division
43
2000 National Survey of Giving, Volunteering and Participating - User Guide
(2)
Because the estimate is a percentage which is based on a subset of the
total population (i.e. men who are volunteers), it is necessary to use both
the percentage (30.2%) and the numerator portion of the percentage
(912,534) in determining the coefficient of variation.
(3)
The numerator, 912,534, does not appear in the left-hand column (the
'Numerator of Percentage' column) so it is necessary to use the figure
closer to it, namely 1,000,000. Similarly, the percentage estimate does
not appear as any of the column headings, so it is necessary to use the
figure closest to it, 30.0%.
(4)
The figure at the intersection of the row and column used, namely 6.0%
is the coefficient of variation to be used.
(5)
So the approximate coefficient of variation of the estimate is 6.0%. The
finding that 30.2% of men who volunteer were a teacher or a coach for an
organization can be published with no qualifications.
Example 3 : Estimates of Differences Between Aggregates or Percentages
Suppose that a user estimates that 837,955/3,488,086=24.0% of women who
volunteer were a teacher or a coach for an organization, while 30.2% of men do
the same thing. How does the user determine the coefficient of variation of the
difference between these two estimates?
(1)
Using the CANADA cv table in the same manner as described in example
2 gives the cv of the estimate for women as 7.1%, and the cv of the
estimate for men was 6.0%.
(2)
Using rule 3, the standard error of a difference (dˆ = X^ 1 - X^ 2) is:
2
s dˆ ' (Xˆ1 a1) % (Xˆ2 a2)
2
where X^ 1 is estimate 1, X^ 2 is estimate 2, and a1 and a2 are the coefficients of
variation of X^ 1 and X^ 2 respectively.
That is, the standard error of the difference dˆ = (0.302-0.240) = .062 is:
Special Surveys Division
44
2000 National Survey of Giving, Volunteering and Participating - User Guide
s dˆ ' [(.302)(.060)]2 % [(.240)(.071)]2
'
(.000328) % (.000290)
' .025
(3)
The coefficient of variation of dˆ is given by s dˆ /dˆ = .025/.062 = 0.403.
(4)
So the approximate coefficient of variation of the difference between the
estimates is 40.3%. This estimate can not be released under any
circumstances and should be deleted and replaced by dashes.
Example 4 : Estimates of Ratios
Suppose that the user estimates that 837,955 women who volunteer were a
teacher or a coach for an organization, while 912,534 men who volunteer were a
teacher or a coach for an organization. The user is interested in comparing the
estimate of women versus that of men in the form of a ratio. How does the user
determine the coefficient of variation of this estimate?
(1)
First of all, this estimate is a ratio estimate, where the numerator of the
estimate (= X^ 1 ) is the number of women who volunteer that were a
teacher or a coach for an organization. The denominator of the estimate
(= X^ 2 ) is the number of men who volunteer that were a teacher or a
coach for an organization.
(2)
Refer to the table for CANADA.
(3)
The numerator of this ratio estimate is 837,955. The figure closest to it is
750,000. The coefficient of variation for this estimate is found by referring
to the first non-asterisk entry on that row, namely, 8.0%.
(4)
The denominator of this ratio estimate is 912,534. The figure closest to it
is 1,000,000. The coefficient of variation for this estimate is found by
referring to the first non-asterisk entry on that row, namely, 6.9%.
(5)
So the approximate coefficient of variation of the ratio estimate is given
by rule 4, which is,
aRˆ ' a12 % a22
where a1 and a2 are the coefficients of variation of X^ 1 and X^ 2 respectively.
Special Surveys Division
45
2000 National Survey of Giving, Volunteering and Participating - User Guide
That is,
aRˆ ' (.080)2 % (.069)2
' 0.106
The obtained ratio of women versus men volunteer that were a teacher or a
coach for an organization is 837,955/912,534 which is 0.92:1. The coefficient of
variation of this estimate is 10.6%, which is releasable with no qualifications.
10.2 How to use the C.V. tables to obtain Confidence Limits
Although coefficients of variation are widely used, a more intuitively meaningful measure
of sampling error is the confidence interval of an estimate. A confidence interval
constitutes a statement on the level of confidence that the true value for the population
lies within a specified range of values. For example a 95% confidence interval can be
described as follows:
If sampling of the population is repeated indefinitely, each sample leading to a new
confidence interval for an estimate, then in 95% of the samples the interval will cover the
true population value.
Using the standard error of an estimate, confidence intervals for estimates may be
obtained under the assumption that under repeated sampling of the population, the
various estimates obtained for a population characteristic are normally distributed about
the true population value. Under this assumption, the chances are about 68 out of 100
that the difference between a sample estimate and the true population value would be
less than one standard error, about 95 out of 100 that the difference would be less than
two standard errors, and about 99 out 100 that the differences would be less than three
standard errors. These different degrees of confidence are referred to as the
confidence levels.
^
Confidence intervals for an estimate, X,
are generally expressed as two numbers, one
^
below the estimate and one above the estimate, as (X-k,
X^ +k) where k is determined
depending upon the level of confidence desired and the sampling error of the estimate.
Confidence intervals for an estimate can be calculated directly from the CV tables by
first determining from the appropriate table the coefficient of variation of the estimate X^ ,
and then using the following formula to convert to a confidence interval CI:
CI X ' [ Xˆ & t Xˆ aXˆ , Xˆ % t Xˆ aXˆ ]
where a^X is the determined coefficient of variation of X^ , and
Special Surveys Division
46
2000 National Survey of Giving, Volunteering and Participating - User Guide
t = 1 if a 68% confidence interval is desired
t = 1.6 if a 90% confidence interval is desired
t = 2 if a 95% confidence interval is desired
t = 3 if a 99% confidence interval is desired.
Note: Release guidelines which apply to the estimate also apply to the confidence
interval. For example, if the estimate is not releasable, then the confidence
interval is not releasable either.
10.2.1 Example of using the C.V. tables to obtain confidence limits
A 95% confidence interval for the estimated proportion of men who volunteer as
a teacher or a coach for an organization in the reference period (from Example
2, section 10.1.1) would be calculated as follows.
X^ =
30.2% (or expressed as a proportion = .302)
t=
2
a^X =
6.0% (.060 expressed as a proportion) is the coefficient of variation of
this estimate as determined from the tables.
CI^X =
{.302 - (2) (.302) (.060), .302+ (2) (.302) (.060)}
CI^X =
{.302 - .036, .302 + .036}
CI^X =
{.266, .338}
With 95% confidence it can be said that between 26.6% and 33.8% of men who
volunteer were a teacher or a coach for an organization in the reference period.
10.3 How to use the C.V. tables to do a t-test
Standard errors may also be used to perform hypothesis testing, a procedure for
distinguishing between population parameters using sample estimates. The sample
estimates can be numbers, averages, percentages, ratios, etc. Tests may be performed
at various levels of significance, where a level of significance is the probability of
concluding that the characteristics are different when, in fact, they are identical.
^
^
Let X
1 and X2 be sample estimates for 2 characteristics of interest. Let the standard
error on the difference X^ 1 - X^ 2 be s dˆ .
Special Surveys Division
47
2000 National Survey of Giving, Volunteering and Participating - User Guide
If
t '
Xˆ1 & Xˆ2
s dˆ
is between -2 and 2, then no conclusion about the difference between
the characteristics is justified at the 5% level of significance. If however, this ratio is
smaller than -2 or larger than +2, the observed difference is significant at the 0.05 level.
That is to say that the characteristics are significant.
10.3.1 Example of using the C.V. tables to do a t-test
Let us suppose that the user wishes to test, at 5% level of significance, the
hypothesis that there is no difference between the proportion of women who
volunteer were a teacher or a coach for an organization and the proportion of
men who volunteer were a teacher or a coach for an organization in the
reference period. From example 3, section 10.2, the standard error of the
difference between these two estimates was found to be = .025. Hence ,
t '
Xˆ1 & Xˆ2
s dˆ
'
.240 & .302
&.062
'
' &2.48.
.025
.025
Since t = -2.48 is less than -2, it must be concluded that there is a significant
difference between the two estimates at the 0.05 level of significance.
10.4 Coefficients of Variation for Quantitative Estimates
For quantitative estimates, special tables would have to be produced to determine their
sampling error. Since most of the variables for the National Survey of Giving,
Volunteering and Participating are primarily categorical in nature, this has not been
done.
As a general rule, however, the coefficient of variation of a quantitative total will be
larger than the coefficient of variation of the corresponding category estimate (i.e. the
estimate of the number of persons contributing to the quantitative estimate). If the
corresponding category estimate is not releasable, the quantitative estimate will not be
either. For example, the coefficient of variation of the total number of hours volunteered
by men would be greater than the coefficient of variation of the corresponding proportion
of men volunteers. Hence if the coefficient of variation of the proportion is not
releasable, then the coefficient of variation of the corresponding quantitative estimate
will also not be releasable.
Special Surveys Division
48
2000 National Survey of Giving, Volunteering and Participating - User Guide
Coefficients of variation of such estimates can be derived as required for a specific
estimate using a technique known as pseudo replication. This involves dividing the
records on the microdata files into subgroups (or replicates) and determining the
variation in the estimate from replicate to replicate. Users wishing to derive coefficients
of variation for quantitative estimates may contact Statistics Canada for advice on the
allocation of records to appropriate replicates and the formulae to be used in these
calculations.
10.5 Release cut-off's for the National Survey of Giving,
Volunteering and Participating
The minimum size of the estimate at the provincial and Canada levels are specified in
the table below.
Table of Release Cut-offs
Province
Unacceptable
Newfoundland
under 11,000
11,000 to < 41,000
41,000 & over
Prince Edward Island
under 4,000
4,000 to <15,000
15,000 & over
Nova Scotia
under 13,000
13,000 to < 49,000
49,000 & over
New Brunswick
under 10,000
10,000 to < 39,000
39,000 & over
Quebec
under 64,000
64,000 to < 251,000
251,000 & over
Ontario
under 50,000
50,000 to < 201,000
201,000 & over
Manitoba
under 13,000
13,000 to < 51,000
51,000 & over
Saskatchewan
under 9,000
9,000 to < 36,000
36,000 & over
Alberta
under 35,000
35,00 to <134,000
134,000 & over
British Columbia
under 49,000
49,000 to < 190,000
190,000 & over
CANADA
under 46,000
46,000 to <185,000
185,000 & over
Special Surveys Division
Marginal
Acceptable
49
2000 National Survey of Giving, Volunteering and Participating - User Guide
10.6 C.V. Tables
2000 National Survey of Giving, Volunteering & Participating
Approximate Sampling Variability Tables for Newfoundland
NUMERATOR OF
PERCENTAGE
('000)
1
2
3
4
5
6
7
8
9
10
11
12
13
14
15
16
17
18
19
20
21
22
23
24
25
30
35
40
45
50
55
60
65
70
75
80
85
90
95
100
125
150
200
250
300
350
ESTIMATED PERCENTAGE
0.1%
1.0%
2.0%
5.0%
10.0%
15.0%
20.0%
25.0%
30.0%
35.0%
40.0%
50.0%
70.0%
90.0%
********
110.0
109.4
107.7
104.9
101.9
98.9
95.7
92.5
89.1
85.6
78.2
60.5
********
77.8
77.4
76.2
74.2
72.1
69.9
67.7
65.4
63.0
60.5
55.3
42.8
********
63.5
63.2
62.2
60.5
58.8
57.1
55.3
53.4
51.5
49.4
45.1
35.0
********
55.0
54.7
53.9
52.4
51.0
49.4
47.9
46.2
44.6
42.8
39.1
30.3
****************
48.9
48.2
46.9
45.6
44.2
42.8
41.4
39.9
38.3
35.0
27.1
****************
44.7
44.0
42.8
41.6
40.4
39.1
37.8
36.4
35.0
31.9
24.7
****************
41.4
40.7
39.6
38.5
37.4
36.2
35.0
33.7
32.4
29.5
22.9
****************
38.7
38.1
37.1
36.0
35.0
33.8
32.7
31.5
30.3
27.6
21.4
************************
35.9
35.0
34.0
33.0
31.9
30.8
29.7
28.5
26.1
20.2
************************
34.1
33.2
32.2
31.3
30.3
29.2
28.2
27.1
24.7
19.1
************************
32.5
31.6
30.7
29.8
28.9
27.9
26.9
25.8
23.6
18.3
************************
31.1
30.3
29.4
28.5
27.6
26.7
25.7
24.7
22.6
17.5
************************
29.9
29.1
28.3
27.4
26.6
25.7
24.7
23.7
21.7
16.8
************************
28.8
28.0
27.2
26.4
25.6
24.7
23.8
22.9
20.9
16.2
************************
27.8
27.1
26.3
25.5
24.7
23.9
23.0
22.1
20.2
15.6
************************
26.9
26.2
25.5
24.7
23.9
23.1
22.3
21.4
19.5
15.1
************************
26.1
25.4
24.7
24.0
23.2
22.4
21.6
20.8
19.0
14.7
************************
25.4
24.7
24.0
23.3
22.6
21.8
21.0
20.2
18.4
14.3
************************
24.7
24.1
23.4
22.7
22.0
21.2
20.4
19.6
17.9
13.9
************************
24.1
23.5
22.8
22.1
21.4
20.7
19.9
19.1
17.5
13.5
************************
23.5
22.9
22.2
21.6
20.9
20.2
19.4
18.7
17.1
13.2
********************************
22.4
21.7
21.1
20.4
19.7
19.0
18.3
16.7
12.9
********************************
21.9
21.3
20.6
20.0
19.3
18.6
17.9
16.3
12.6
********************************
21.4
20.8
20.2
19.5
18.9
18.2
17.5
16.0
12.4
********************************
21.0
20.4
19.8
19.1
18.5
17.8
17.1
15.6
12.1
********************************
19.1
18.6
18.1
17.5
16.9
16.3
15.6
14.3
11.1
********************************
17.7
17.2
16.7
16.2
15.6
15.1
14.5
13.2
10.2
********************************
16.6
16.1
15.6
15.1
14.6
14.1
13.5
12.4
9.6
****************************************
15.2
14.7
14.3
13.8
13.3
12.8
11.7
9.0
****************************************
14.4
14.0
13.5
13.1
12.6
12.1
11.1
8.6
****************************************
13.7
13.3
12.9
12.5
12.0
11.5
10.5
8.2
****************************************
13.2
12.8
12.4
11.9
11.5
11.1
10.1
7.8
****************************************
12.6
12.3
11.9
11.5
11.1
10.6
9.7
7.5
************************************************
11.8
11.4
11.1
10.7
10.2
9.3
7.2
************************************************
11.4
11.1
10.7
10.3
9.9
9.0
7.0
************************************************
11.1
10.7
10.3
10.0
9.6
8.7
6.8
************************************************
10.7
10.4
10.0
9.7
9.3
8.5
6.6
********************************************************
10.1
9.7
9.4
9.0
8.2
6.4
********************************************************
9.8
9.5
9.1
8.8
8.0
6.2
********************************************************
9.6
9.2
8.9
8.6
7.8
6.1
****************************************************************
8.3
8.0
7.7
7.0
5.4
************************************************************************
7.3
7.0
6.4
4.9
****************************************************************************************
5.5
4.3
************************************************************************************************
3.8
************************************************************************************************
3.5
********************************************************************************************************
35.0
24.7
20.2
17.5
15.6
14.3
13.2
12.4
11.7
11.1
10.5
10.1
9.7
9.3
9.0
8.7
8.5
8.2
8.0
7.8
7.6
7.5
7.3
7.1
7.0
6.4
5.9
5.5
5.2
4.9
4.7
4.5
4.3
4.2
4.0
3.9
3.8
3.7
3.6
3.5
3.1
2.9
2.5
2.2
2.0
1.9
NOTE: FOR CORRECT USAGE OF THESE TABLES PLEASE REFER TO MICRODATA DOCUMENTATION
Special Surveys Division
50
2000 National Survey of Giving, Volunteering and Participating - User Guide
2000 National Survey of Giving, Volunteering & Participating
Approximate Sampling Variability Tables for P.E.I.
NUMERATOR OF
PERCENTAGE
('000)
1
2
3
4
5
6
7
8
9
10
11
12
13
14
15
16
17
18
19
20
21
22
23
24
25
30
35
40
45
50
55
60
65
70
75
80
85
90
95
ESTIMATED PERCENTAGE
0.1%
1.0%
2.0%
5.0%
10.0%
15.0%
20.0%
25.0%
30.0%
35.0%
40.0%
50.0%
70.0%
90.0%
********
66.6
66.3
65.3
63.5
61.7
59.9
58.0
56.0
54.0
51.9
47.4
36.7
****************
46.9
46.2
44.9
43.7
42.4
41.0
39.6
38.2
36.7
33.5
25.9
************************
37.7
36.7
35.6
34.6
33.5
32.4
31.2
30.0
27.3
21.2
************************
32.6
31.8
30.9
30.0
29.0
28.0
27.0
25.9
23.7
18.3
************************
29.2
28.4
27.6
26.8
25.9
25.1
24.1
23.2
21.2
16.4
********************************
25.9
25.2
24.5
23.7
22.9
22.0
21.2
19.3
15.0
********************************
24.0
23.3
22.6
21.9
21.2
20.4
19.6
17.9
13.9
********************************
22.5
21.8
21.2
20.5
19.8
19.1
18.3
16.7
13.0
********************************
21.2
20.6
20.0
19.3
18.7
18.0
17.3
15.8
12.2
********************************
20.1
19.5
18.9
18.3
17.7
17.1
16.4
15.0
11.6
****************************************
18.6
18.1
17.5
16.9
16.3
15.6
14.3
11.1
****************************************
17.8
17.3
16.7
16.2
15.6
15.0
13.7
10.6
****************************************
17.1
16.6
16.1
15.5
15.0
14.4
13.1
10.2
****************************************
16.5
16.0
15.5
15.0
14.4
13.9
12.7
9.8
****************************************
15.9
15.5
15.0
14.5
13.9
13.4
12.2
9.5
****************************************
15.4
15.0
14.5
14.0
13.5
13.0
11.8
9.2
************************************************
14.5
14.1
13.6
13.1
12.6
11.5
8.9
************************************************
14.1
13.7
13.2
12.7
12.2
11.2
8.6
************************************************
13.7
13.3
12.9
12.4
11.9
10.9
8.4
************************************************
13.4
13.0
12.5
12.1
11.6
10.6
8.2
************************************************
13.1
12.7
12.2
11.8
11.3
10.3
8.0
********************************************************
12.4
11.9
11.5
11.1
10.1
7.8
********************************************************
12.1
11.7
11.3
10.8
9.9
7.6
********************************************************
11.8
11.4
11.0
10.6
9.7
7.5
********************************************************
11.6
11.2
10.8
10.4
9.5
7.3
****************************************************************
10.2
9.9
9.5
8.6
6.7
************************************************************************
9.1
8.8
8.0
6.2
********************************************************************************
8.2
7.5
5.8
****************************************************************************************
7.1
5.5
****************************************************************************************
6.7
5.2
************************************************************************************************
4.9
************************************************************************************************
4.7
************************************************************************************************
4.5
************************************************************************************************
4.4
************************************************************************************************
4.2
********************************************************************************************************
********************************************************************************************************
********************************************************************************************************
********************************************************************************************************
21.2
15.0
12.2
10.6
9.5
8.6
8.0
7.5
7.1
6.7
6.4
6.1
5.9
5.7
5.5
5.3
5.1
5.0
4.9
4.7
4.6
4.5
4.4
4.3
4.2
3.9
3.6
3.3
3.2
3.0
2.9
2.7
2.6
2.5
2.4
2.4
2.3
2.2
2.2
NOTE: FOR CORRECT USAGE OF THESE TABLES PLEASE REFER TO MICRODATA DOCUMENTATION
Special Surveys Division
51
2000 National Survey of Giving, Volunteering and Participating - User Guide
2000 National Survey of Giving, Volunteering & Participating
Approximate Sampling Variability Tables for Nova Scotia
NUMERATOR OF
PERCENTAGE
('000)
1
2
3
4
5
6
7
8
9
10
11
12
13
14
15
16
17
18
19
20
21
22
23
24
25
30
35
40
45
50
55
60
65
70
75
80
85
90
95
100
125
150
200
250
300
350
400
450
500
ESTIMATED PERCENTAGE
0.1%
1.0%
2.0%
5.0%
10.0%
15.0%
20.0%
25.0%
30.0%
35.0%
40.0%
50.0%
70.0%
90.0%
********
118.5
117.9
116.1
113.0
109.8
106.5
103.1
99.6
96.0
92.2
84.2
********
83.8
83.4
82.1
79.9
77.6
75.3
72.9
70.5
67.9
65.2
59.5
********
68.4
68.1
67.0
65.2
63.4
61.5
59.5
57.5
55.4
53.3
48.6
********
59.2
58.9
58.0
56.5
54.9
53.3
51.6
49.8
48.0
46.1
42.1
********
53.0
52.7
51.9
50.5
49.1
47.6
46.1
44.6
42.9
41.3
37.7
********
48.4
48.1
47.4
46.1
44.8
43.5
42.1
40.7
39.2
37.7
34.4
********
44.8
44.6
43.9
42.7
41.5
40.3
39.0
37.7
36.3
34.9
31.8
****************
41.7
41.0
39.9
38.8
37.7
36.5
35.2
33.9
32.6
29.8
****************
39.3
38.7
37.7
36.6
35.5
34.4
33.2
32.0
30.7
28.1
****************
37.3
36.7
35.7
34.7
33.7
32.6
31.5
30.4
29.2
26.6
****************
35.5
35.0
34.1
33.1
32.1
31.1
30.0
28.9
27.8
25.4
****************
34.0
33.5
32.6
31.7
30.7
29.8
28.8
27.7
26.6
24.3
****************
32.7
32.2
31.3
30.5
29.5
28.6
27.6
26.6
25.6
23.4
****************
31.5
31.0
30.2
29.3
28.5
27.6
26.6
25.7
24.7
22.5
************************
30.0
29.2
28.3
27.5
26.6
25.7
24.8
23.8
21.7
************************
29.0
28.2
27.4
26.6
25.8
24.9
24.0
23.1
21.1
************************
28.2
27.4
26.6
25.8
25.0
24.2
23.3
22.4
20.4
************************
27.4
26.6
25.9
25.1
24.3
23.5
22.6
21.7
19.8
************************
26.6
25.9
25.2
24.4
23.7
22.9
22.0
21.2
19.3
************************
26.0
25.3
24.6
23.8
23.1
22.3
21.5
20.6
18.8
************************
25.3
24.7
24.0
23.2
22.5
21.7
21.0
20.1
18.4
************************
24.7
24.1
23.4
22.7
22.0
21.2
20.5
19.7
18.0
************************
24.2
23.6
22.9
22.2
21.5
20.8
20.0
19.2
17.6
************************
23.7
23.1
22.4
21.7
21.1
20.3
19.6
18.8
17.2
************************
23.2
22.6
22.0
21.3
20.6
19.9
19.2
18.4
16.8
************************
21.2
20.6
20.0
19.4
18.8
18.2
17.5
16.8
15.4
************************
19.6
19.1
18.6
18.0
17.4
16.8
16.2
15.6
14.2
********************************
17.9
17.4
16.8
16.3
15.8
15.2
14.6
13.3
********************************
16.8
16.4
15.9
15.4
14.9
14.3
13.8
12.6
********************************
16.0
15.5
15.1
14.6
14.1
13.6
13.0
11.9
********************************
15.2
14.8
14.4
13.9
13.4
12.9
12.4
11.4
********************************
14.6
14.2
13.8
13.3
12.9
12.4
11.9
10.9
********************************
14.0
13.6
13.2
12.8
12.4
11.9
11.4
10.4
********************************
13.5
13.1
12.7
12.3
11.9
11.5
11.0
10.1
****************************************
12.7
12.3
11.9
11.5
11.1
10.7
9.7
****************************************
12.3
11.9
11.5
11.1
10.7
10.3
9.4
****************************************
11.9
11.6
11.2
10.8
10.4
10.0
9.1
****************************************
11.6
11.2
10.9
10.5
10.1
9.7
8.9
****************************************
11.3
10.9
10.6
10.2
9.9
9.5
8.6
****************************************
11.0
10.7
10.3
10.0
9.6
9.2
8.4
************************************************
9.5
9.2
8.9
8.6
8.3
7.5
********************************************************
8.4
8.1
7.8
7.5
6.9
****************************************************************
7.0
6.8
6.5
6.0
************************************************************************
6.1
5.8
5.3
****************************************************************************************
4.9
****************************************************************************************
4.5
************************************************************************************************
************************************************************************************************
************************************************************************************************
65.2
46.1
37.7
32.6
29.2
26.6
24.7
23.1
21.7
20.6
19.7
18.8
18.1
17.4
16.8
16.3
15.8
15.4
15.0
14.6
14.2
13.9
13.6
13.3
13.0
11.9
11.0
10.3
9.7
9.2
8.8
8.4
8.1
7.8
7.5
7.3
7.1
6.9
6.7
6.5
5.8
5.3
4.6
4.1
3.8
3.5
3.3
3.1
2.9
37.7
26.6
21.7
18.8
16.8
15.4
14.2
13.3
12.6
11.9
11.4
10.9
10.4
10.1
9.7
9.4
9.1
8.9
8.6
8.4
8.2
8.0
7.9
7.7
7.5
6.9
6.4
6.0
5.6
5.3
5.1
4.9
4.7
4.5
4.3
4.2
4.1
4.0
3.9
3.8
3.4
3.1
2.7
2.4
2.2
2.0
1.9
1.8
1.7
NOTE: FOR CORRECT USAGE OF THESE TABLES PLEASE REFER TO MICRODATA DOCUMENTATION
Special Surveys Division
52
2000 National Survey of Giving, Volunteering and Participating - User Guide
2000 National Survey of Giving, Volunteering & Participating
Approximate Sampling Variability Tables for New Brunswick
NUMERATOR OF
PERCENTAGE
('000)
1
2
3
4
5
6
7
8
9
10
11
12
13
14
15
16
17
18
19
20
21
22
23
24
25
30
35
40
45
50
55
60
65
70
75
80
85
90
95
100
125
150
200
250
300
350
400
450
500
ESTIMATED PERCENTAGE
0.1%
1.0%
2.0%
5.0%
10.0%
15.0%
20.0%
25.0%
30.0%
35.0%
40.0%
50.0%
70.0%
90.0%
********
105.0
104.4
102.8
100.1
97.3
94.4
91.4
88.3
85.0
81.7
74.6
57.8
********
74.2
73.8
72.7
70.8
68.8
66.7
64.6
62.4
60.1
57.8
52.7
40.9
********
60.6
60.3
59.4
57.8
56.2
54.5
52.7
51.0
49.1
47.2
43.1
33.4
********
52.5
52.2
51.4
50.0
48.6
47.2
45.7
44.1
42.5
40.9
37.3
28.9
********
46.9
46.7
46.0
44.8
43.5
42.2
40.9
39.5
38.0
36.5
33.4
25.8
********
42.8
42.6
42.0
40.9
39.7
38.5
37.3
36.0
34.7
33.4
30.5
23.6
****************
39.5
38.9
37.8
36.8
35.7
34.5
33.4
32.1
30.9
28.2
21.8
****************
36.9
36.4
35.4
34.4
33.4
32.3
31.2
30.1
28.9
26.4
20.4
****************
34.8
34.3
33.4
32.4
31.5
30.5
29.4
28.3
27.2
24.9
19.3
****************
33.0
32.5
31.6
30.8
29.8
28.9
27.9
26.9
25.8
23.6
18.3
****************
31.5
31.0
30.2
29.3
28.4
27.5
26.6
25.6
24.6
22.5
17.4
****************
30.1
29.7
28.9
28.1
27.2
26.4
25.5
24.6
23.6
21.5
16.7
************************
28.5
27.8
27.0
26.2
25.3
24.5
23.6
22.7
20.7
16.0
************************
27.5
26.7
26.0
25.2
24.4
23.6
22.7
21.8
19.9
15.4
************************
26.5
25.8
25.1
24.4
23.6
22.8
22.0
21.1
19.3
14.9
************************
25.7
25.0
24.3
23.6
22.8
22.1
21.3
20.4
18.6
14.4
************************
24.9
24.3
23.6
22.9
22.2
21.4
20.6
19.8
18.1
14.0
************************
24.2
23.6
22.9
22.2
21.5
20.8
20.0
19.3
17.6
13.6
************************
23.6
23.0
22.3
21.6
21.0
20.2
19.5
18.7
17.1
13.3
************************
23.0
22.4
21.7
21.1
20.4
19.7
19.0
18.3
16.7
12.9
************************
22.4
21.8
21.2
20.6
19.9
19.3
18.6
17.8
16.3
12.6
************************
21.9
21.3
20.7
20.1
19.5
18.8
18.1
17.4
15.9
12.3
************************
21.4
20.9
20.3
19.7
19.0
18.4
17.7
17.0
15.6
12.0
************************
21.0
20.4
19.9
19.3
18.6
18.0
17.4
16.7
15.2
11.8
************************
20.6
20.0
19.5
18.9
18.3
17.7
17.0
16.3
14.9
11.6
************************
18.8
18.3
17.8
17.2
16.7
16.1
15.5
14.9
13.6
10.5
********************************
16.9
16.4
15.9
15.4
14.9
14.4
13.8
12.6
9.8
********************************
15.8
15.4
14.9
14.4
14.0
13.4
12.9
11.8
9.1
********************************
14.9
14.5
14.1
13.6
13.2
12.7
12.2
11.1
8.6
********************************
14.2
13.8
13.3
12.9
12.5
12.0
11.6
10.5
8.2
********************************
13.5
13.1
12.7
12.3
11.9
11.5
11.0
10.1
7.8
********************************
12.9
12.6
12.2
11.8
11.4
11.0
10.5
9.6
7.5
****************************************
12.1
11.7
11.3
10.9
10.5
10.1
9.3
7.2
****************************************
11.6
11.3
10.9
10.5
10.2
9.8
8.9
6.9
****************************************
11.2
10.9
10.5
10.2
9.8
9.4
8.6
6.7
****************************************
10.9
10.5
10.2
9.9
9.5
9.1
8.3
6.5
****************************************
10.5
10.2
9.9
9.6
9.2
8.9
8.1
6.3
****************************************
10.3
9.9
9.6
9.3
9.0
8.6
7.9
6.1
************************************************
9.7
9.4
9.1
8.7
8.4
7.7
5.9
************************************************
9.4
9.1
8.8
8.5
8.2
7.5
5.8
********************************************************
8.2
7.9
7.6
7.3
6.7
5.2
********************************************************
7.5
7.2
6.9
6.7
6.1
4.7
************************************************************************
6.0
5.8
5.3
4.1
****************************************************************************************
4.7
3.7
****************************************************************************************
4.3
3.3
************************************************************************************************
3.1
************************************************************************************************
2.9
********************************************************************************************************
********************************************************************************************************
33.4
23.6
19.3
16.7
14.9
13.6
12.6
11.8
11.1
10.5
10.1
9.6
9.3
8.9
8.6
8.3
8.1
7.9
7.7
7.5
7.3
7.1
7.0
6.8
6.7
6.1
5.6
5.3
5.0
4.7
4.5
4.3
4.1
4.0
3.9
3.7
3.6
3.5
3.4
3.3
3.0
2.7
2.4
2.1
1.9
1.8
1.7
1.6
1.5
NOTE: FOR CORRECT USAGE OF THESE TABLES PLEASE REFER TO MICRODATA DOCUMENTATION
Special Surveys Division
53
2000 National Survey of Giving, Volunteering and Participating - User Guide
2000 National Survey of Giving, Volunteering & Participating
Approximate Sampling Variability Tables for Quebec
NUMERATOR OF
PERCENTAGE
('000)
1
2
3
4
5
6
7
8
9
10
11
12
13
14
15
16
17
18
19
20
21
22
23
24
25
30
35
40
45
50
55
60
65
70
75
80
85
90
95
100
125
150
200
250
300
350
400
450
500
750
1000
1500
2000
3000
4000
5000
ESTIMATED PERCENTAGE
0.1%
1.0%
2.0%
5.0%
10.0%
15.0%
20.0%
25.0%
30.0%
35.0%
40.0%
50.0%
70.0%
90.0%
266.9
265.7
264.3
260.3
253.3
246.2
238.8
231.3
223.4
215.3
206.8
188.8
146.3
188.7
187.9
186.9
184.0
179.1
174.1
168.9
163.5
158.0
152.2
146.3
133.5
103.4
154.1
153.4
152.6
150.3
146.3
142.1
137.9
133.5
129.0
124.3
119.4
109.0
84.4
133.4
132.8
132.2
130.1
126.7
123.1
119.4
115.6
111.7
107.6
103.4
94.4
73.1
119.4
118.8
118.2
116.4
113.3
110.1
106.8
103.4
99.9
96.3
92.5
84.4
65.4
********
108.5
107.9
106.3
103.4
100.5
97.5
94.4
91.2
87.9
84.4
77.1
59.7
********
100.4
99.9
98.4
95.7
93.0
90.3
87.4
84.4
81.4
78.2
71.4
55.3
********
93.9
93.5
92.0
89.6
87.0
84.4
81.8
79.0
76.1
73.1
66.8
51.7
********
88.6
88.1
86.8
84.4
82.1
79.6
77.1
74.5
71.8
68.9
62.9
48.8
********
84.0
83.6
82.3
80.1
77.9
75.5
73.1
70.6
68.1
65.4
59.7
46.3
********
80.1
79.7
78.5
76.4
74.2
72.0
69.7
67.4
64.9
62.4
56.9
44.1
********
76.7
76.3
75.1
73.1
71.1
68.9
66.8
64.5
62.1
59.7
54.5
42.2
********
73.7
73.3
72.2
70.3
68.3
66.2
64.1
62.0
59.7
57.4
52.4
40.6
********
71.0
70.6
69.6
67.7
65.8
63.8
61.8
59.7
57.5
55.3
50.5
39.1
********
68.6
68.3
67.2
65.4
63.6
61.7
59.7
57.7
55.6
53.4
48.8
37.8
********
66.4
66.1
65.1
63.3
61.5
59.7
57.8
55.9
53.8
51.7
47.2
36.6
********
64.4
64.1
63.1
61.4
59.7
57.9
56.1
54.2
52.2
50.2
45.8
35.5
********
62.6
62.3
61.3
59.7
58.0
56.3
54.5
52.7
50.7
48.8
44.5
34.5
********
61.0
60.6
59.7
58.1
56.5
54.8
53.1
51.3
49.4
47.5
43.3
33.6
********
59.4
59.1
58.2
56.6
55.0
53.4
51.7
50.0
48.1
46.3
42.2
32.7
********
58.0
57.7
56.8
55.3
53.7
52.1
50.5
48.8
47.0
45.1
41.2
31.9
********
56.6
56.4
55.5
54.0
52.5
50.9
49.3
47.6
45.9
44.1
40.3
31.2
********
55.4
55.1
54.3
52.8
51.3
49.8
48.2
46.6
44.9
43.1
39.4
30.5
********
54.2
54.0
53.1
51.7
50.3
48.8
47.2
45.6
43.9
42.2
38.5
29.9
********
53.1
52.9
52.1
50.7
49.2
47.8
46.3
44.7
43.1
41.4
37.8
29.3
********
48.5
48.3
47.5
46.3
44.9
43.6
42.2
40.8
39.3
37.8
34.5
26.7
********
44.9
44.7
44.0
42.8
41.6
40.4
39.1
37.8
36.4
35.0
31.9
24.7
********
42.0
41.8
41.2
40.1
38.9
37.8
36.6
35.3
34.0
32.7
29.9
23.1
********
39.6
39.4
38.8
37.8
36.7
35.6
34.5
33.3
32.1
30.8
28.1
21.8
********
37.6
37.4
36.8
35.8
34.8
33.8
32.7
31.6
30.4
29.3
26.7
20.7
********
35.8
35.6
35.1
34.2
33.2
32.2
31.2
30.1
29.0
27.9
25.5
19.7
****************
34.1
33.6
32.7
31.8
30.8
29.9
28.8
27.8
26.7
24.4
18.9
****************
32.8
32.3
31.4
30.5
29.6
28.7
27.7
26.7
25.7
23.4
18.1
****************
31.6
31.1
30.3
29.4
28.5
27.6
26.7
25.7
24.7
22.6
17.5
****************
30.5
30.1
29.3
28.4
27.6
26.7
25.8
24.9
23.9
21.8
16.9
****************
29.6
29.1
28.3
27.5
26.7
25.9
25.0
24.1
23.1
21.1
16.4
****************
28.7
28.2
27.5
26.7
25.9
25.1
24.2
23.4
22.4
20.5
15.9
****************
27.9
27.4
26.7
26.0
25.2
24.4
23.5
22.7
21.8
19.9
15.4
****************
27.1
26.7
26.0
25.3
24.5
23.7
22.9
22.1
21.2
19.4
15.0
****************
26.4
26.0
25.3
24.6
23.9
23.1
22.3
21.5
20.7
18.9
14.6
************************
23.3
22.7
22.0
21.4
20.7
20.0
19.3
18.5
16.9
13.1
************************
21.3
20.7
20.1
19.5
18.9
18.2
17.6
16.9
15.4
11.9
************************
18.4
17.9
17.4
16.9
16.4
15.8
15.2
14.6
13.4
10.3
************************
16.5
16.0
15.6
15.1
14.6
14.1
13.6
13.1
11.9
9.3
********************************
14.6
14.2
13.8
13.4
12.9
12.4
11.9
10.9
8.4
********************************
13.5
13.2
12.8
12.4
11.9
11.5
11.1
10.1
7.8
********************************
12.7
12.3
11.9
11.6
11.2
10.8
10.3
9.4
7.3
********************************
11.9
11.6
11.3
10.9
10.5
10.1
9.8
8.9
6.9
********************************
11.3
11.0
10.7
10.3
10.0
9.6
9.3
8.4
6.5
****************************************
9.0
8.7
8.4
8.2
7.9
7.6
6.9
5.3
************************************************
7.6
7.3
7.1
6.8
6.5
6.0
4.6
****************************************************************
5.8
5.6
5.3
4.9
3.8
************************************************************************
4.8
4.6
4.2
3.3
************************************************************************************************
2.7
************************************************************************************************
2.3
********************************************************************************************************
84.4
59.7
48.8
42.2
37.8
34.5
31.9
29.9
28.1
26.7
25.5
24.4
23.4
22.6
21.8
21.1
20.5
19.9
19.4
18.9
18.4
18.0
17.6
17.2
16.9
15.4
14.3
13.4
12.6
11.9
11.4
10.9
10.5
10.1
9.8
9.4
9.2
8.9
8.7
8.4
7.6
6.9
6.0
5.3
4.9
4.5
4.2
4.0
3.8
3.1
2.7
2.2
1.9
1.5
1.3
1.2
NOTE: FOR CORRECT USAGE OF THESE TABLES PLEASE REFER TO MICRODATA DOCUMENTATION
Special Surveys Division
54
2000 National Survey of Giving, Volunteering and Participating - User Guide
2000 National Survey of Giving, Volunteering & Participating
Approximate Sampling Variability Tables for Ontario
NUMERATOR OF
PERCENTAGE
('000)
1
2
3
4
5
6
7
8
9
10
11
12
13
14
15
16
17
18
19
20
21
22
23
24
25
30
35
40
45
50
55
60
65
70
75
80
85
90
95
100
125
150
200
250
300
350
400
450
500
750
1000
1500
2000
3000
4000
5000
6000
7000
8000
ESTIMATED PERCENTAGE
0.1%
1.0%
2.0%
5.0%
10.0%
15.0%
20.0%
25.0%
30.0%
35.0%
40.0%
50.0%
70.0%
90.0%
235.9
234.8
233.6
230.0
223.9
217.6
211.1
204.4
197.5
190.3
182.8
166.9
129.3
166.8
166.0
165.2
162.7
158.3
153.9
149.3
144.5
139.6
134.5
129.3
118.0
91.4
136.2
135.6
134.9
132.8
129.3
125.6
121.9
118.0
114.0
109.9
105.5
96.4
74.6
117.9
117.4
116.8
115.0
111.9
108.8
105.5
102.2
98.7
95.1
91.4
83.4
64.6
105.5
105.0
104.5
102.9
100.1
97.3
94.4
91.4
88.3
85.1
81.8
74.6
57.8
96.3
95.9
95.4
93.9
91.4
88.8
86.2
83.4
80.6
77.7
74.6
68.1
52.8
89.2
88.8
88.3
86.9
84.6
82.2
79.8
77.3
74.6
71.9
69.1
63.1
48.9
83.4
83.0
82.6
81.3
79.2
76.9
74.6
72.3
69.8
67.3
64.6
59.0
45.7
78.6
78.3
77.9
76.7
74.6
72.5
70.4
68.1
65.8
63.4
60.9
55.6
43.1
********
74.3
73.9
72.7
70.8
68.8
66.8
64.6
62.4
60.2
57.8
52.8
40.9
********
70.8
70.4
69.4
67.5
65.6
63.6
61.6
59.5
57.4
55.1
50.3
39.0
********
67.8
67.4
66.4
64.6
62.8
60.9
59.0
57.0
54.9
52.8
48.2
37.3
********
65.1
64.8
63.8
62.1
60.3
58.5
56.7
54.8
52.8
50.7
46.3
35.9
********
62.8
62.4
61.5
59.8
58.2
56.4
54.6
52.8
50.9
48.9
44.6
34.5
********
60.6
60.3
59.4
57.8
56.2
54.5
52.8
51.0
49.1
47.2
43.1
33.4
********
58.7
58.4
57.5
56.0
54.4
52.8
51.1
49.4
47.6
45.7
41.7
32.3
********
57.0
56.7
55.8
54.3
52.8
51.2
49.6
47.9
46.1
44.3
40.5
31.4
********
55.3
55.1
54.2
52.8
51.3
49.8
48.2
46.5
44.8
43.1
39.3
30.5
********
53.9
53.6
52.8
51.4
49.9
48.4
46.9
45.3
43.7
41.9
38.3
29.7
********
52.5
52.2
51.4
50.1
48.7
47.2
45.7
44.2
42.5
40.9
37.3
28.9
********
51.2
51.0
50.2
48.9
47.5
46.1
44.6
43.1
41.5
39.9
36.4
28.2
********
50.1
49.8
49.0
47.7
46.4
45.0
43.6
42.1
40.6
39.0
35.6
27.6
********
49.0
48.7
48.0
46.7
45.4
44.0
42.6
41.2
39.7
38.1
34.8
27.0
********
47.9
47.7
47.0
45.7
44.4
43.1
41.7
40.3
38.8
37.3
34.1
26.4
********
47.0
46.7
46.0
44.8
43.5
42.2
40.9
39.5
38.1
36.6
33.4
25.9
********
42.9
42.7
42.0
40.9
39.7
38.5
37.3
36.1
34.7
33.4
30.5
23.6
********
39.7
39.5
38.9
37.8
36.8
35.7
34.5
33.4
32.2
30.9
28.2
21.9
********
37.1
36.9
36.4
35.4
34.4
33.4
32.3
31.2
30.1
28.9
26.4
20.4
********
35.0
34.8
34.3
33.4
32.4
31.5
30.5
29.4
28.4
27.3
24.9
19.3
********
33.2
33.0
32.5
31.7
30.8
29.9
28.9
27.9
26.9
25.9
23.6
18.3
********
31.7
31.5
31.0
30.2
29.3
28.5
27.6
26.6
25.7
24.7
22.5
17.4
********
30.3
30.2
29.7
28.9
28.1
27.3
26.4
25.5
24.6
23.6
21.5
16.7
********
29.1
29.0
28.5
27.8
27.0
26.2
25.4
24.5
23.6
22.7
20.7
16.0
********
28.1
27.9
27.5
26.8
26.0
25.2
24.4
23.6
22.7
21.9
19.9
15.5
********
27.1
27.0
26.6
25.9
25.1
24.4
23.6
22.8
22.0
21.1
19.3
14.9
********
26.3
26.1
25.7
25.0
24.3
23.6
22.9
22.1
21.3
20.4
18.7
14.5
********
25.5
25.3
25.0
24.3
23.6
22.9
22.2
21.4
20.6
19.8
18.1
14.0
********
24.8
24.6
24.2
23.6
22.9
22.3
21.5
20.8
20.1
19.3
17.6
13.6
****************
24.0
23.6
23.0
22.3
21.7
21.0
20.3
19.5
18.8
17.1
13.3
****************
23.4
23.0
22.4
21.8
21.1
20.4
19.7
19.0
18.3
16.7
12.9
****************
20.9
20.6
20.0
19.5
18.9
18.3
17.7
17.0
16.4
14.9
11.6
****************
19.1
18.8
18.3
17.8
17.2
16.7
16.1
15.5
14.9
13.6
10.6
************************
16.3
15.8
15.4
14.9
14.5
14.0
13.5
12.9
11.8
9.1
************************
14.5
14.2
13.8
13.4
12.9
12.5
12.0
11.6
10.6
8.2
************************
13.3
12.9
12.6
12.2
11.8
11.4
11.0
10.6
9.6
7.5
************************
12.3
12.0
11.6
11.3
10.9
10.6
10.2
9.8
8.9
6.9
************************
11.5
11.2
10.9
10.6
10.2
9.9
9.5
9.1
8.3
6.5
************************
10.8
10.6
10.3
10.0
9.6
9.3
9.0
8.6
7.9
6.1
********************************
10.0
9.7
9.4
9.1
8.8
8.5
8.2
7.5
5.8
********************************
8.2
7.9
7.7
7.5
7.2
6.9
6.7
6.1
4.7
****************************************
6.9
6.7
6.5
6.2
6.0
5.8
5.3
4.1
************************************************
5.5
5.3
5.1
4.9
4.7
4.3
3.3
********************************************************
4.6
4.4
4.3
4.1
3.7
2.9
************************************************************************
3.5
3.3
3.0
2.4
****************************************************************************************
2.6
2.0
************************************************************************************************
1.8
************************************************************************************************
1.7
********************************************************************************************************
********************************************************************************************************
74.6
52.8
43.1
37.3
33.4
30.5
28.2
26.4
24.9
23.6
22.5
21.5
20.7
19.9
19.3
18.7
18.1
17.6
17.1
16.7
16.3
15.9
15.6
15.2
14.9
13.6
12.6
11.8
11.1
10.6
10.1
9.6
9.3
8.9
8.6
8.3
8.1
7.9
7.7
7.5
6.7
6.1
5.3
4.7
4.3
4.0
3.7
3.5
3.3
2.7
2.4
1.9
1.7
1.4
1.2
1.1
1.0
0.9
0.8
NOTE: FOR CORRECT USAGE OF THESE TABLES PLEASE REFER TO MICRODATA DOCUMENTATION
Special Surveys Division
55
2000 National Survey of Giving, Volunteering and Participating - User Guide
2000 National Survey of Giving, Volunteering & Participating
Approximate Sampling Variability Tables for Manitoba
NUMERATOR OF
PERCENTAGE
('000)
1
2
3
4
5
6
7
8
9
10
11
12
13
14
15
16
17
18
19
20
21
22
23
24
25
30
35
40
45
50
55
60
65
70
75
80
85
90
95
100
125
150
200
250
300
350
400
450
500
750
ESTIMATED PERCENTAGE
0.1%
1.0%
2.0%
5.0%
10.0%
15.0%
20.0%
25.0%
30.0%
35.0%
40.0%
50.0%
70.0%
90.0%
********
120.0
119.4
117.6
114.4
111.2
107.9
104.5
100.9
97.3
93.4
85.3
66.1
********
84.9
84.4
83.1
80.9
78.6
76.3
73.9
71.4
68.8
66.1
60.3
46.7
********
69.3
68.9
67.9
66.1
64.2
62.3
60.3
58.3
56.1
53.9
49.2
38.1
********
60.0
59.7
58.8
57.2
55.6
53.9
52.2
50.5
48.6
46.7
42.6
33.0
********
53.7
53.4
52.6
51.2
49.7
48.2
46.7
45.1
43.5
41.8
38.1
29.5
********
49.0
48.7
48.0
46.7
45.4
44.0
42.6
41.2
39.7
38.1
34.8
27.0
********
45.4
45.1
44.4
43.3
42.0
40.8
39.5
38.1
36.8
35.3
32.2
25.0
********
42.4
42.2
41.6
40.5
39.3
38.1
36.9
35.7
34.4
33.0
30.2
23.4
****************
39.8
39.2
38.1
37.1
36.0
34.8
33.6
32.4
31.1
28.4
22.0
****************
37.8
37.2
36.2
35.2
34.1
33.0
31.9
30.8
29.5
27.0
20.9
****************
36.0
35.4
34.5
33.5
32.5
31.5
30.4
29.3
28.2
25.7
19.9
****************
34.5
33.9
33.0
32.1
31.1
30.2
29.1
28.1
27.0
24.6
19.1
****************
33.1
32.6
31.7
30.8
29.9
29.0
28.0
27.0
25.9
23.7
18.3
****************
31.9
31.4
30.6
29.7
28.8
27.9
27.0
26.0
25.0
22.8
17.7
****************
30.8
30.4
29.5
28.7
27.9
27.0
26.1
25.1
24.1
22.0
17.1
****************
29.9
29.4
28.6
27.8
27.0
26.1
25.2
24.3
23.4
21.3
16.5
****************
29.0
28.5
27.8
27.0
26.2
25.3
24.5
23.6
22.7
20.7
16.0
************************
27.7
27.0
26.2
25.4
24.6
23.8
22.9
22.0
20.1
15.6
************************
27.0
26.3
25.5
24.8
24.0
23.2
22.3
21.4
19.6
15.2
************************
26.3
25.6
24.9
24.1
23.4
22.6
21.7
20.9
19.1
14.8
************************
25.7
25.0
24.3
23.5
22.8
22.0
21.2
20.4
18.6
14.4
************************
25.1
24.4
23.7
23.0
22.3
21.5
20.7
19.9
18.2
14.1
************************
24.5
23.9
23.2
22.5
21.8
21.0
20.3
19.5
17.8
13.8
************************
24.0
23.4
22.7
22.0
21.3
20.6
19.9
19.1
17.4
13.5
************************
23.5
22.9
22.2
21.6
20.9
20.2
19.5
18.7
17.1
13.2
************************
21.5
20.9
20.3
19.7
19.1
18.4
17.8
17.1
15.6
12.1
************************
19.9
19.3
18.8
18.2
17.7
17.1
16.4
15.8
14.4
11.2
************************
18.6
18.1
17.6
17.1
16.5
16.0
15.4
14.8
13.5
10.4
********************************
17.1
16.6
16.1
15.6
15.0
14.5
13.9
12.7
9.8
********************************
16.2
15.7
15.3
14.8
14.3
13.8
13.2
12.1
9.3
********************************
15.4
15.0
14.5
14.1
13.6
13.1
12.6
11.5
8.9
********************************
14.8
14.4
13.9
13.5
13.0
12.6
12.1
11.0
8.5
********************************
14.2
13.8
13.4
13.0
12.5
12.1
11.6
10.6
8.2
********************************
13.7
13.3
12.9
12.5
12.1
11.6
11.2
10.2
7.9
********************************
13.2
12.8
12.5
12.1
11.7
11.2
10.8
9.8
7.6
********************************
12.8
12.4
12.1
11.7
11.3
10.9
10.4
9.5
7.4
********************************
12.4
12.1
11.7
11.3
10.9
10.5
10.1
9.3
7.2
****************************************
11.7
11.4
11.0
10.6
10.3
9.8
9.0
7.0
****************************************
11.4
11.1
10.7
10.4
10.0
9.6
8.8
6.8
****************************************
11.1
10.8
10.4
10.1
9.7
9.3
8.5
6.6
****************************************
9.9
9.6
9.3
9.0
8.7
8.4
7.6
5.9
************************************************
8.8
8.5
8.2
7.9
7.6
7.0
5.4
********************************************************
7.4
7.1
6.9
6.6
6.0
4.7
****************************************************************
6.4
6.2
5.9
5.4
4.2
************************************************************************
5.6
5.4
4.9
3.8
****************************************************************************************
4.6
3.5
****************************************************************************************
4.3
3.3
************************************************************************************************
3.1
************************************************************************************************
3.0
********************************************************************************************************
38.1
27.0
22.0
19.1
17.1
15.6
14.4
13.5
12.7
12.1
11.5
11.0
10.6
10.2
9.8
9.5
9.3
9.0
8.8
8.5
8.3
8.1
8.0
7.8
7.6
7.0
6.4
6.0
5.7
5.4
5.1
4.9
4.7
4.6
4.4
4.3
4.1
4.0
3.9
3.8
3.4
3.1
2.7
2.4
2.2
2.0
1.9
1.8
1.7
1.4
NOTE: FOR CORRECT USAGE OF THESE TABLES PLEASE REFER TO MICRODATA DOCUMENTATION
Special Surveys Division
56
2000 National Survey of Giving, Volunteering and Participating - User Guide
2000 National Survey of Giving, Volunteering & Participating
Approximate Sampling Variability Tables for Saskatchewan
NUMERATOR OF
PERCENTAGE
('000)
1
2
3
4
5
6
7
8
9
10
11
12
13
14
15
16
17
18
19
20
21
22
23
24
25
30
35
40
45
50
55
60
65
70
75
80
85
90
95
100
125
150
200
250
300
350
400
450
500
ESTIMATED PERCENTAGE
0.1%
1.0%
2.0%
5.0%
10.0%
15.0%
20.0%
25.0%
30.0%
35.0%
40.0%
50.0%
70.0%
90.0%
********
100.0
99.5
98.0
95.3
92.7
89.9
87.0
84.1
81.0
77.9
71.1
********
70.7
70.4
69.3
67.4
65.5
63.6
61.5
59.5
57.3
55.0
50.3
********
57.7
57.4
56.6
55.0
53.5
51.9
50.3
48.5
46.8
44.9
41.0
********
50.0
49.7
49.0
47.7
46.3
44.9
43.5
42.0
40.5
38.9
35.5
********
44.7
44.5
43.8
42.6
41.4
40.2
38.9
37.6
36.2
34.8
31.8
********
40.8
40.6
40.0
38.9
37.8
36.7
35.5
34.3
33.1
31.8
29.0
********
37.8
37.6
37.0
36.0
35.0
34.0
32.9
31.8
30.6
29.4
26.9
****************
35.2
34.6
33.7
32.8
31.8
30.8
29.7
28.6
27.5
25.1
****************
33.2
32.7
31.8
30.9
30.0
29.0
28.0
27.0
26.0
23.7
****************
31.5
31.0
30.2
29.3
28.4
27.5
26.6
25.6
24.6
22.5
****************
30.0
29.5
28.7
27.9
27.1
26.2
25.4
24.4
23.5
21.4
****************
28.7
28.3
27.5
26.7
26.0
25.1
24.3
23.4
22.5
20.5
****************
27.6
27.2
26.4
25.7
24.9
24.1
23.3
22.5
21.6
19.7
****************
26.6
26.2
25.5
24.8
24.0
23.3
22.5
21.7
20.8
19.0
****************
25.7
25.3
24.6
23.9
23.2
22.5
21.7
20.9
20.1
18.3
************************
24.5
23.8
23.2
22.5
21.8
21.0
20.3
19.5
17.8
************************
23.8
23.1
22.5
21.8
21.1
20.4
19.7
18.9
17.2
************************
23.1
22.5
21.8
21.2
20.5
19.8
19.1
18.3
16.8
************************
22.5
21.9
21.3
20.6
20.0
19.3
18.6
17.9
16.3
************************
21.9
21.3
20.7
20.1
19.5
18.8
18.1
17.4
15.9
************************
21.4
20.8
20.2
19.6
19.0
18.3
17.7
17.0
15.5
************************
20.9
20.3
19.8
19.2
18.6
17.9
17.3
16.6
15.2
************************
20.4
19.9
19.3
18.7
18.1
17.5
16.9
16.2
14.8
************************
20.0
19.5
18.9
18.3
17.8
17.2
16.5
15.9
14.5
************************
19.6
19.1
18.5
18.0
17.4
16.8
16.2
15.6
14.2
************************
17.9
17.4
16.9
16.4
15.9
15.4
14.8
14.2
13.0
************************
16.6
16.1
15.7
15.2
14.7
14.2
13.7
13.2
12.0
********************************
15.1
14.7
14.2
13.8
13.3
12.8
12.3
11.2
********************************
14.2
13.8
13.4
13.0
12.5
12.1
11.6
10.6
********************************
13.5
13.1
12.7
12.3
11.9
11.5
11.0
10.1
********************************
12.9
12.5
12.1
11.7
11.3
10.9
10.5
9.6
********************************
12.3
12.0
11.6
11.2
10.9
10.5
10.1
9.2
********************************
11.8
11.5
11.2
10.8
10.4
10.1
9.7
8.8
********************************
11.4
11.1
10.7
10.4
10.1
9.7
9.3
8.5
********************************
11.0
10.7
10.4
10.1
9.7
9.4
9.0
8.2
****************************************
10.4
10.1
9.7
9.4
9.1
8.7
7.9
****************************************
10.1
9.8
9.4
9.1
8.8
8.4
7.7
****************************************
9.8
9.5
9.2
8.9
8.5
8.2
7.5
****************************************
9.5
9.2
8.9
8.6
8.3
8.0
7.3
****************************************
9.3
9.0
8.7
8.4
8.1
7.8
7.1
************************************************
8.0
7.8
7.5
7.2
7.0
6.4
************************************************
7.3
7.1
6.9
6.6
6.4
5.8
****************************************************************
5.9
5.7
5.5
5.0
************************************************************************
5.1
4.9
4.5
********************************************************************************
4.5
4.1
****************************************************************************************
3.8
************************************************************************************************
************************************************************************************************
************************************************************************************************
55.0
38.9
31.8
27.5
24.6
22.5
20.8
19.5
18.3
17.4
16.6
15.9
15.3
14.7
14.2
13.8
13.4
13.0
12.6
12.3
12.0
11.7
11.5
11.2
11.0
10.1
9.3
8.7
8.2
7.8
7.4
7.1
6.8
6.6
6.4
6.2
6.0
5.8
5.6
5.5
4.9
4.5
3.9
3.5
3.2
2.9
2.8
2.6
2.5
31.8
22.5
18.3
15.9
14.2
13.0
12.0
11.2
10.6
10.1
9.6
9.2
8.8
8.5
8.2
7.9
7.7
7.5
7.3
7.1
6.9
6.8
6.6
6.5
6.4
5.8
5.4
5.0
4.7
4.5
4.3
4.1
3.9
3.8
3.7
3.6
3.4
3.4
3.3
3.2
2.8
2.6
2.2
2.0
1.8
1.7
1.6
1.5
1.4
NOTE: FOR CORRECT USAGE OF THESE TABLES PLEASE REFER TO MICRODATA DOCUMENTATION
Special Surveys Division
57
2000 National Survey of Giving, Volunteering and Participating - User Guide
2000 National Survey of Giving, Volunteering & Participating
Approximate Sampling Variability Tables for Alberta
NUMERATOR OF
PERCENTAGE
('000)
1
2
3
4
5
6
7
8
9
10
11
12
13
14
15
16
17
18
19
20
21
22
23
24
25
30
35
40
45
50
55
60
65
70
75
80
85
90
95
100
125
150
200
250
300
350
400
450
500
750
1000
1500
2000
ESTIMATED PERCENTAGE
0.1%
1.0%
2.0%
5.0%
10.0%
15.0%
20.0%
25.0%
30.0%
35.0%
40.0%
50.0%
70.0%
90.0%
196.3
195.4
194.4
191.4
186.3
181.1
175.7
170.1
164.3
158.3
152.1
138.9
107.6
138.8
138.2
137.5
135.4
131.8
128.0
124.2
120.3
116.2
112.0
107.6
98.2
76.1
********
112.8
112.3
110.5
107.6
104.5
101.4
98.2
94.9
91.4
87.8
80.2
62.1
********
97.7
97.2
95.7
93.2
90.5
87.8
85.0
82.2
79.2
76.1
69.4
53.8
********
87.4
87.0
85.6
83.3
81.0
78.6
76.1
73.5
70.8
68.0
62.1
48.1
********
79.8
79.4
78.2
76.1
73.9
71.7
69.4
67.1
64.6
62.1
56.7
43.9
********
73.9
73.5
72.4
70.4
68.4
66.4
64.3
62.1
59.8
57.5
52.5
40.7
********
69.1
68.7
67.7
65.9
64.0
62.1
60.1
58.1
56.0
53.8
49.1
38.0
********
65.1
64.8
63.8
62.1
60.4
58.6
56.7
54.8
52.8
50.7
46.3
35.9
********
61.8
61.5
60.5
58.9
57.3
55.6
53.8
52.0
50.1
48.1
43.9
34.0
********
58.9
58.6
57.7
56.2
54.6
53.0
51.3
49.5
47.7
45.9
41.9
32.4
********
56.4
56.1
55.3
53.8
52.3
50.7
49.1
47.4
45.7
43.9
40.1
31.1
********
54.2
53.9
53.1
51.7
50.2
48.7
47.2
45.6
43.9
42.2
38.5
29.8
********
52.2
52.0
51.2
49.8
48.4
46.9
45.5
43.9
42.3
40.7
37.1
28.8
********
50.5
50.2
49.4
48.1
46.8
45.4
43.9
42.4
40.9
39.3
35.9
27.8
********
48.9
48.6
47.9
46.6
45.3
43.9
42.5
41.1
39.6
38.0
34.7
26.9
********
47.4
47.2
46.4
45.2
43.9
42.6
41.3
39.9
38.4
36.9
33.7
26.1
********
46.1
45.8
45.1
43.9
42.7
41.4
40.1
38.7
37.3
35.9
32.7
25.4
********
44.8
44.6
43.9
42.7
41.5
40.3
39.0
37.7
36.3
34.9
31.9
24.7
********
43.7
43.5
42.8
41.7
40.5
39.3
38.0
36.7
35.4
34.0
31.1
24.1
********
42.6
42.4
41.8
40.7
39.5
38.3
37.1
35.9
34.6
33.2
30.3
23.5
********
41.7
41.5
40.8
39.7
38.6
37.5
36.3
35.0
33.8
32.4
29.6
22.9
********
40.7
40.5
39.9
38.9
37.8
36.6
35.5
34.3
33.0
31.7
29.0
22.4
****************
39.7
39.1
38.0
37.0
35.9
34.7
33.5
32.3
31.1
28.3
22.0
****************
38.9
38.3
37.3
36.2
35.1
34.0
32.9
31.7
30.4
27.8
21.5
****************
35.5
35.0
34.0
33.1
32.1
31.1
30.0
28.9
27.8
25.4
19.6
****************
32.9
32.4
31.5
30.6
29.7
28.8
27.8
26.8
25.7
23.5
18.2
****************
30.7
30.3
29.5
28.6
27.8
26.9
26.0
25.0
24.1
22.0
17.0
****************
29.0
28.5
27.8
27.0
26.2
25.4
24.5
23.6
22.7
20.7
16.0
************************
27.1
26.4
25.6
24.8
24.1
23.2
22.4
21.5
19.6
15.2
************************
25.8
25.1
24.4
23.7
22.9
22.2
21.4
20.5
18.7
14.5
************************
24.7
24.1
23.4
22.7
22.0
21.2
20.4
19.6
17.9
13.9
************************
23.7
23.1
22.5
21.8
21.1
20.4
19.6
18.9
17.2
13.3
************************
22.9
22.3
21.6
21.0
20.3
19.6
18.9
18.2
16.6
12.9
************************
22.1
21.5
20.9
20.3
19.6
19.0
18.3
17.6
16.0
12.4
************************
21.4
20.8
20.2
19.6
19.0
18.4
17.7
17.0
15.5
12.0
************************
20.8
20.2
19.6
19.1
18.4
17.8
17.2
16.5
15.1
11.7
************************
20.2
19.6
19.1
18.5
17.9
17.3
16.7
16.0
14.6
11.3
************************
19.6
19.1
18.6
18.0
17.5
16.9
16.2
15.6
14.2
11.0
************************
19.1
18.6
18.1
17.6
17.0
16.4
15.8
15.2
13.9
10.8
********************************
16.7
16.2
15.7
15.2
14.7
14.2
13.6
12.4
9.6
********************************
15.2
14.8
14.3
13.9
13.4
12.9
12.4
11.3
8.8
********************************
13.2
12.8
12.4
12.0
11.6
11.2
10.8
9.8
7.6
****************************************
11.5
11.1
10.8
10.4
10.0
9.6
8.8
6.8
****************************************
10.5
10.1
9.8
9.5
9.1
8.8
8.0
6.2
************************************************
9.4
9.1
8.8
8.5
8.1
7.4
5.8
************************************************
8.8
8.5
8.2
7.9
7.6
6.9
5.4
************************************************
8.3
8.0
7.7
7.5
7.2
6.5
5.1
********************************************************
7.6
7.3
7.1
6.8
6.2
4.8
************************************************************************
5.8
5.6
5.1
3.9
****************************************************************************************
4.4
3.4
************************************************************************************************
2.8
********************************************************************************************************
62.1
43.9
35.9
31.1
27.8
25.4
23.5
22.0
20.7
19.6
18.7
17.9
17.2
16.6
16.0
15.5
15.1
14.6
14.2
13.9
13.6
13.2
13.0
12.7
12.4
11.3
10.5
9.8
9.3
8.8
8.4
8.0
7.7
7.4
7.2
6.9
6.7
6.5
6.4
6.2
5.6
5.1
4.4
3.9
3.6
3.3
3.1
2.9
2.8
2.3
2.0
1.6
1.4
NOTE: FOR CORRECT USAGE OF THESE TABLES PLEASE REFER TO MICRODATA DOCUMENTATION
Special Surveys Division
58
2000 National Survey of Giving, Volunteering and Participating - User Guide
2000 National Survey of Giving, Volunteering & Participating
Approximate Sampling Variability Tables for British Columbia
NUMERATOR OF
PERCENTAGE
('000)
1
2
3
4
5
6
7
8
9
10
11
12
13
14
15
16
17
18
19
20
21
22
23
24
25
30
35
40
45
50
55
60
65
70
75
80
85
90
95
100
125
150
200
250
300
350
400
450
500
750
1000
1500
2000
ESTIMATED PERCENTAGE
0.1%
1.0%
2.0%
5.0%
10.0%
15.0%
20.0%
25.0%
30.0%
35.0%
40.0%
50.0%
70.0%
90.0%
233.8
232.7
231.5
228.0
221.9
215.6
209.2
202.5
195.7
188.6
181.2
165.4
165.3
164.5
163.7
161.2
156.9
152.5
147.9
143.2
138.4
133.3
128.1
116.9
135.0
134.4
133.7
131.6
128.1
124.5
120.8
116.9
113.0
108.9
104.6
95.5
********
116.4
115.8
114.0
110.9
107.8
104.6
101.3
97.8
94.3
90.6
82.7
********
104.1
103.5
101.9
99.2
96.4
93.5
90.6
87.5
84.3
81.0
74.0
********
95.0
94.5
93.1
90.6
88.0
85.4
82.7
79.9
77.0
74.0
67.5
********
88.0
87.5
86.2
83.9
81.5
79.1
76.6
74.0
71.3
68.5
62.5
********
82.3
81.9
80.6
78.4
76.2
74.0
71.6
69.2
66.7
64.0
58.5
********
77.6
77.2
76.0
74.0
71.9
69.7
67.5
65.2
62.9
60.4
55.1
********
73.6
73.2
72.1
70.2
68.2
66.1
64.0
61.9
59.6
57.3
52.3
********
70.2
69.8
68.7
66.9
65.0
63.1
61.1
59.0
56.9
54.6
49.9
********
67.2
66.8
65.8
64.0
62.2
60.4
58.5
56.5
54.4
52.3
47.7
********
64.5
64.2
63.2
61.5
59.8
58.0
56.2
54.3
52.3
50.2
45.9
********
62.2
61.9
60.9
59.3
57.6
55.9
54.1
52.3
50.4
48.4
44.2
********
60.1
59.8
58.9
57.3
55.7
54.0
52.3
50.5
48.7
46.8
42.7
********
58.2
57.9
57.0
55.5
53.9
52.3
50.6
48.9
47.1
45.3
41.3
********
56.4
56.2
55.3
53.8
52.3
50.7
49.1
47.5
45.7
43.9
40.1
********
54.8
54.6
53.7
52.3
50.8
49.3
47.7
46.1
44.4
42.7
39.0
********
53.4
53.1
52.3
50.9
49.5
48.0
46.5
44.9
43.3
41.6
37.9
********
52.0
51.8
51.0
49.6
48.2
46.8
45.3
43.8
42.2
40.5
37.0
********
50.8
50.5
49.7
48.4
47.1
45.6
44.2
42.7
41.1
39.5
36.1
********
49.6
49.4
48.6
47.3
46.0
44.6
43.2
41.7
40.2
38.6
35.3
********
48.5
48.3
47.5
46.3
45.0
43.6
42.2
40.8
39.3
37.8
34.5
********
47.5
47.3
46.5
45.3
44.0
42.7
41.3
39.9
38.5
37.0
33.8
********
46.5
46.3
45.6
44.4
43.1
41.8
40.5
39.1
37.7
36.2
33.1
********
42.5
42.3
41.6
40.5
39.4
38.2
37.0
35.7
34.4
33.1
30.2
****************
39.1
38.5
37.5
36.4
35.4
34.2
33.1
31.9
30.6
28.0
****************
36.6
36.0
35.1
34.1
33.1
32.0
30.9
29.8
28.6
26.1
****************
34.5
34.0
33.1
32.1
31.2
30.2
29.2
28.1
27.0
24.7
****************
32.7
32.2
31.4
30.5
29.6
28.6
27.7
26.7
25.6
23.4
****************
31.2
30.7
29.9
29.1
28.2
27.3
26.4
25.4
24.4
22.3
****************
29.9
29.4
28.6
27.8
27.0
26.1
25.3
24.3
23.4
21.3
************************
28.3
27.5
26.7
25.9
25.1
24.3
23.4
22.5
20.5
************************
27.2
26.5
25.8
25.0
24.2
23.4
22.5
21.7
19.8
************************
26.3
25.6
24.9
24.2
23.4
22.6
21.8
20.9
19.1
************************
25.5
24.8
24.1
23.4
22.6
21.9
21.1
20.3
18.5
************************
24.7
24.1
23.4
22.7
22.0
21.2
20.5
19.6
17.9
************************
24.0
23.4
22.7
22.0
21.3
20.6
19.9
19.1
17.4
************************
23.4
22.8
22.1
21.5
20.8
20.1
19.3
18.6
17.0
************************
22.8
22.2
21.6
20.9
20.3
19.6
18.9
18.1
16.5
************************
20.4
19.8
19.3
18.7
18.1
17.5
16.9
16.2
14.8
************************
18.6
18.1
17.6
17.1
16.5
16.0
15.4
14.8
13.5
********************************
15.7
15.2
14.8
14.3
13.8
13.3
12.8
11.7
********************************
14.0
13.6
13.2
12.8
12.4
11.9
11.5
10.5
********************************
12.8
12.4
12.1
11.7
11.3
10.9
10.5
9.5
****************************************
11.5
11.2
10.8
10.5
10.1
9.7
8.8
****************************************
10.8
10.5
10.1
9.8
9.4
9.1
8.3
****************************************
10.2
9.9
9.5
9.2
8.9
8.5
7.8
************************************************
9.4
9.1
8.8
8.4
8.1
7.4
********************************************************
7.4
7.1
6.9
6.6
6.0
************************************************************************
6.0
5.7
5.2
****************************************************************************************
4.3
************************************************************************************************
128.1
90.6
74.0
64.0
57.3
52.3
48.4
45.3
42.7
40.5
38.6
37.0
35.5
34.2
33.1
32.0
31.1
30.2
29.4
28.6
28.0
27.3
26.7
26.1
25.6
23.4
21.7
20.3
19.1
18.1
17.3
16.5
15.9
15.3
14.8
14.3
13.9
13.5
13.1
12.8
11.5
10.5
9.1
8.1
7.4
6.8
6.4
6.0
5.7
4.7
4.1
3.3
2.9
74.0
52.3
42.7
37.0
33.1
30.2
28.0
26.1
24.7
23.4
22.3
21.3
20.5
19.8
19.1
18.5
17.9
17.4
17.0
16.5
16.1
15.8
15.4
15.1
14.8
13.5
12.5
11.7
11.0
10.5
10.0
9.5
9.2
8.8
8.5
8.3
8.0
7.8
7.6
7.4
6.6
6.0
5.2
4.7
4.3
4.0
3.7
3.5
3.3
2.7
2.3
1.9
1.7
NOTE: FOR CORRECT USAGE OF THESE TABLES PLEASE REFER TO MICRODATA DOCUMENTATION
Special Surveys Division
59
2000 National Survey of Giving, Volunteering and Participating - User Guide
2000 National Survey of Giving, Volunteering & Participating
Approximate Sampling Variability Tables for Canada
NUMERATOR OF
PERCENTAGE
('000)
1
2
3
4
5
6
7
8
9
10
11
12
13
14
15
16
17
18
19
20
21
22
23
24
25
30
35
40
45
50
55
60
65
70
75
80
85
90
95
100
125
150
200
250
300
350
400
450
500
750
1000
1500
2000
3000
4000
5000
6000
7000
8000
9000
10000
12500
15000
20000
ESTIMATED PERCENTAGE
70.0%
90.0%
224.9
223.9
222.8
219.3
213.5
207.5
201.3
194.9
188.3
181.4
174.3
159.1
123.3
159.0
158.3
157.5
155.1
151.0
146.7
142.3
137.8
133.1
128.3
123.3
112.5
87.2
129.9
129.3
128.6
126.6
123.3
119.8
116.2
112.5
108.7
104.8
100.6
91.9
71.2
112.5
112.0
111.4
109.7
106.7
103.7
100.6
97.4
94.1
90.7
87.2
79.6
61.6
100.6
100.1
99.6
98.1
95.5
92.8
90.0
87.2
84.2
81.1
78.0
71.2
55.1
91.8
91.4
90.9
89.5
87.2
84.7
82.2
79.6
76.9
74.1
71.2
65.0
50.3
85.0
84.6
84.2
82.9
80.7
78.4
76.1
73.7
71.2
68.6
65.9
60.1
46.6
79.5
79.2
78.8
77.5
75.5
73.4
71.2
68.9
66.6
64.1
61.6
56.3
43.6
75.0
74.6
74.3
73.1
71.2
69.2
67.1
65.0
62.8
60.5
58.1
53.0
41.1
71.1
70.8
70.4
69.4
67.5
65.6
63.7
61.6
59.5
57.4
55.1
50.3
39.0
67.8
67.5
67.2
66.1
64.4
62.6
60.7
58.8
56.8
54.7
52.6
48.0
37.2
64.9
64.6
64.3
63.3
61.6
59.9
58.1
56.3
54.4
52.4
50.3
45.9
35.6
62.4
62.1
61.8
60.8
59.2
57.5
55.8
54.1
52.2
50.3
48.3
44.1
34.2
60.1
59.8
59.5
58.6
57.1
55.5
53.8
52.1
50.3
48.5
46.6
42.5
32.9
58.1
57.8
57.5
56.6
55.1
53.6
52.0
50.3
48.6
46.8
45.0
41.1
31.8
56.2
56.0
55.7
54.8
53.4
51.9
50.3
48.7
47.1
45.4
43.6
39.8
30.8
54.6
54.3
54.0
53.2
51.8
50.3
48.8
47.3
45.7
44.0
42.3
38.6
29.9
53.0
52.8
52.5
51.7
50.3
48.9
47.4
45.9
44.4
42.8
41.1
37.5
29.1
51.6
51.4
51.1
50.3
49.0
47.6
46.2
44.7
43.2
41.6
40.0
36.5
28.3
50.3
50.1
49.8
49.0
47.7
46.4
45.0
43.6
42.1
40.6
39.0
35.6
27.6
49.1
48.9
48.6
47.9
46.6
45.3
43.9
42.5
41.1
39.6
38.0
34.7
26.9
48.0
47.7
47.5
46.8
45.5
44.2
42.9
41.6
40.1
38.7
37.2
33.9
26.3
46.9
46.7
46.5
45.7
44.5
43.3
42.0
40.6
39.3
37.8
36.3
33.2
25.7
45.9
45.7
45.5
44.8
43.6
42.4
41.1
39.8
38.4
37.0
35.6
32.5
25.2
********
44.8
44.6
43.9
42.7
41.5
40.3
39.0
37.7
36.3
34.9
31.8
24.7
********
40.9
40.7
40.0
39.0
37.9
36.7
35.6
34.4
33.1
31.8
29.1
22.5
********
37.8
37.7
37.1
36.1
35.1
34.0
32.9
31.8
30.7
29.5
26.9
20.8
********
35.4
35.2
34.7
33.8
32.8
31.8
30.8
29.8
28.7
27.6
25.2
19.5
********
33.4
33.2
32.7
31.8
30.9
30.0
29.1
28.1
27.0
26.0
23.7
18.4
********
31.7
31.5
31.0
30.2
29.3
28.5
27.6
26.6
25.7
24.7
22.5
17.4
********
30.2
30.0
29.6
28.8
28.0
27.1
26.3
25.4
24.5
23.5
21.5
16.6
********
28.9
28.8
28.3
27.6
26.8
26.0
25.2
24.3
23.4
22.5
20.5
15.9
********
27.8
27.6
27.2
26.5
25.7
25.0
24.2
23.4
22.5
21.6
19.7
15.3
********
26.8
26.6
26.2
25.5
24.8
24.1
23.3
22.5
21.7
20.8
19.0
14.7
********
25.9
25.7
25.3
24.7
24.0
23.2
22.5
21.7
21.0
20.1
18.4
14.2
********
25.0
24.9
24.5
23.9
23.2
22.5
21.8
21.1
20.3
19.5
17.8
13.8
********
24.3
24.2
23.8
23.2
22.5
21.8
21.1
20.4
19.7
18.9
17.3
13.4
********
23.6
23.5
23.1
22.5
21.9
21.2
20.5
19.8
19.1
18.4
16.8
13.0
********
23.0
22.9
22.5
21.9
21.3
20.7
20.0
19.3
18.6
17.9
16.3
12.6
********
22.4
22.3
21.9
21.3
20.7
20.1
19.5
18.8
18.1
17.4
15.9
12.3
********
20.0
19.9
19.6
19.1
18.6
18.0
17.4
16.8
16.2
15.6
14.2
11.0
********
18.3
18.2
17.9
17.4
16.9
16.4
15.9
15.4
14.8
14.2
13.0
10.1
********
15.8
15.8
15.5
15.1
14.7
14.2
13.8
13.3
12.8
12.3
11.3
8.7
****************
14.1
13.9
13.5
13.1
12.7
12.3
11.9
11.5
11.0
10.1
7.8
****************
12.9
12.7
12.3
12.0
11.6
11.3
10.9
10.5
10.1
9.2
7.1
****************
11.9
11.7
11.4
11.1
10.8
10.4
10.1
9.7
9.3
8.5
6.6
****************
11.1
11.0
10.7
10.4
10.1
9.7
9.4
9.1
8.7
8.0
6.2
****************
10.5
10.3
10.1
9.8
9.5
9.2
8.9
8.6
8.2
7.5
5.8
************************
9.8
9.5
9.3
9.0
8.7
8.4
8.1
7.8
7.1
5.5
************************
8.0
7.8
7.6
7.3
7.1
6.9
6.6
6.4
5.8
4.5
************************
6.9
6.8
6.6
6.4
6.2
6.0
5.7
5.5
5.0
3.9
********************************
5.5
5.4
5.2
5.0
4.9
4.7
4.5
4.1
3.2
********************************
4.8
4.6
4.5
4.4
4.2
4.1
3.9
3.6
2.8
****************************************
3.8
3.7
3.6
3.4
3.3
3.2
2.9
2.3
************************************************
3.2
3.1
3.0
2.9
2.8
2.5
1.9
********************************************************
2.8
2.7
2.6
2.5
2.3
1.7
********************************************************
2.5
2.4
2.3
2.3
2.1
1.6
****************************************************************
2.3
2.2
2.1
1.9
1.5
************************************************************************
2.0
1.9
1.8
1.4
********************************************************************************
1.8
1.7
1.3
****************************************************************************************
1.6
1.2
************************************************************************************************
1.1
************************************************************************************************
1.0
********************************************************************************************************
0.1%
1.0%
2.0%
5.0%
10.0%
15.0%
20.0%
25.0%
30.0%
35.0%
40.0%
50.0%
71.2
50.3
41.1
35.6
31.8
29.1
26.9
25.2
23.7
22.5
21.5
20.5
19.7
19.0
18.4
17.8
17.3
16.8
16.3
15.9
15.5
15.2
14.8
14.5
14.2
13.0
12.0
11.3
10.6
10.1
9.6
9.2
8.8
8.5
8.2
8.0
7.7
7.5
7.3
7.1
6.4
5.8
5.0
4.5
4.1
3.8
3.6
3.4
3.2
2.6
2.3
1.8
1.6
1.3
1.1
1.0
0.9
0.9
0.8
0.8
0.7
0.6
0.6
0.5
NOTE: FOR CORRECT USAGE OF THESE TABLES PLEASE REFER TO MICRODATA DOCUMENTATION
Special Surveys Division
60
2000 National Survey of Giving, Volunteering and Participating - User Guide
11.0 Weighting
Since the National Survey of Giving, Volunteering and Participating used a sub-sample of the
LFS sample, the derivation of weights for the survey records is clearly tied to the weighting
procedure used for the LFS. The LFS weighting procedure is briefly described below.
11.1 Weighting Procedures for the LFS
In the LFS, the final weight attached to each record is the product of the following
factors: the basic weight, the cluster sub-weight, the balancing factor for non-response,
and the province-age-sex and subprovincial ratio adjustment factor. Each is described
below.
Basic Weight
In a probability sample, the sample design itself determines weights which must be used
to produce unbiased estimates of the population. Each record must be weighted by the
inverse of the probability of selecting the person to whom the record refers. In the
example of a 2% simple random sample, this probability would be .02 for each person
and the records must be weighted by 1/.02=50. Because all eligible individuals in a
dwelling are interviewed (directly or by proxy), this probability is the same as the
probability with which the dwelling is selected.
Cluster Sub-weight
The cluster delineation is such that the number of dwellings in the sample increases
very slightly with moderate growth in the housing stock. Substantial growth can be
tolerated in an isolated cluster before the additional sample represents a field collection
problem. However, if growth takes place in more than one cluster in an interviewer
assignment, the cumulative effect of all increases may create a workload problem. In
clusters where substantial growth has taken place, sub-sampling is used as a means of
keeping interviewer assignments manageable. The cluster sub-weight represents the
inverse of this sub-sampling ratio in clusters where sub-sampling has occurred.
Non-response
Notwithstanding the strict controls of the LFS, some non-response is inevitable, despite
all the attempts made by the interviewers. The LFS non-response rate is approximately
10%. For certain types of non-response (eg. household temporarily absent, refusal),
data from a previous month's interview with the household if any, is brought forward and
used as the current month's data for the household.
In other cases, non-response is compensated for by proportionally increasing the
weights of responding households. The weight of each responding record is increased
by the ratio of the number of households that should have been interviewed, divided by
the number that were actually interviewed. This adjustment is done separately for nonresponse areas, which are defined by employment insurance region, type of area, and
rotation group. It is based on the assumption that the households that have been
Special Surveys Division
61
2000 National Survey of Giving, Volunteering and Participating - User Guide
interviewed represent the characteristics of those that should have been interviewed
within non-response areas. To the extent that this assumption is not true, the estimates
will be somewhat biased.
LFS Sub-Weight
The product of the previously described weighting factors is called the LFS sub-weight.
All members of the same sampled dwelling have the same sub-weight.
Subprovincial and Province-Age-Sex Adjustments
The sub-weight can be used to derive a valid estimate of any characteristic for which
information is collected by the LFS. In particular, estimates are produced of the total
number of persons 15+ in provincial economic regions and the 24 large metropolitan
areas as well as of designated age-sex groups in each of the ten provinces.
Independent estimates are available monthly for various age and sex groups by
province. These are population projections based on the most recent Census data,
records of births and deaths, and estimates of migration. In the final step, this auxiliary
information is used to transform the sub-weight into the final weight. This is done using
a calibration method. This method ensures that the final weights it produces sum to the
census projections for the auxiliary variables, namely various age-sex groups, economic
regions and census metropolitan areas.
This weighting procedure ensures consistency with external Census counts and that
each rotation group is representative of the population.
11.2 Weighting Procedures for the National Survey of Giving,
Volunteering and Participating
The principles behind the calculation of the weights for the National Survey of Giving,
Volunteering and Participating are identical to those for the LFS. However, further
adjustments are made to the LFS weights in order to derive a final weight for the
individual records on the National Survey of Giving, Volunteering and Participating
microdata file.
The first adjustment is for the use of a five-sixth sub-sample, instead of the full LFS
sample. The next adjustment is to account for the random selection of one respondent
from the selected household. There is an adjustment to account for the additional
non-response to the supplementary survey i.e., non-response to the National Survey of
Giving, Volunteering and Participating for individuals who did respond to the LFS or for
which previous month's LFS data was brought forward. We then have an adjustment to
account for the sub-sample of non-volunteers records. An other adjustment deals with
outlier records and a final adjustment is done to match the Census projections for
independent province-sex-age groups and census metropolitan area (CMA) counts (in a
calibration exercise).
The resulting weight (FINWGHT) is the final weight which appears on the National
Survey of Giving, Volunteering and Participating microdata file.
Special Surveys Division
62
2000 National Survey of Giving, Volunteering and Participating - User Guide
12.0 Structure of the National Survey of Giving, Volunteering and
Participating Files
There are three data files for the NSGVP. The main answer file (MAIN.TXT), the volunteer
event file (VD.TXT) and the giver event file (GS.TXT). To link between files use the variable
MICRO_ID.
MAIN.TXT
This is the main answer file and contains one record per respondent. All questions
except for those on the VD and GS files are located here. In addition, summary derived
variables have been created from the VD and GS files and placed on the MAIN file. Use
the MICRO_ID to link with other files.
VD.TXT
This is the volunteer organization answer file. It will contain 1-3 records per person who
volunteered (1 per organization the respondent volunteered with). This file contains
information on the type of organization for which the individual volunteered, and the
number of hours volunteered for the organization.
GS.TXT
This is the charitable donation answer file. It will contain 1-55 records per person per
solicitation method who made a charitable donation. Each record represents 1 donation
made to a charitable organization. For each donation made, this file contains
information on the type of organization to whom the donation was made as well as the
value of the donation.
12.1 Variable Naming Conventions used in the National Survey of
Giving, Volunteering and Participating Files
The NSGVP has adopted a variable naming convention which allows data users to
easily use and refer to similar data from different collection years. The following
requirements were mandatory: restrict variable names to a maximum of 8 characters for
ease of use by analytical software products; identify the survey occasion (cycle 1(year
2000) , 2 (year 2001) or 3 (year 2002) etc,) in the name; and allow conceptually identical
variables to be easily identifiable over survey occasions. For example, conceptually
identical data on volunteering will be collected in cycles 1 , 2 and 3. The variable names
about volunteering should only differ in the year position in the variable name that
identifies the particular survey occasion in which they were collected. This convention
will be followed throughout subsequent NSGVP surveys.
Variable Name Component Structure
Each of the eight characters in a variable name contains information about the type of
data contained in the variable.
Special Surveys Division
63
2000 National Survey of Giving, Volunteering and Participating - User Guide
Positions1-2:
Position 3:
Position 4:
Positions 5-8:
Variable / Questionnaire section name
Cycle/year variable appears
Variable type
Variable number / name from questionnaire
Example: SD1_04A
SD:
1:
04A:
Appears in the Socio-demographic content section of the questionnaire;
Appears in cycle 1 (year 2000)
_:
Collected variable (can be found on the questionnaire) and;
Variable name/number (usually corresponds to the question number e.g. Q04).
This example is a mark-all question type, thus has the extension of a, b, c etc. If
the question type had been a yes/no type the variable name/number would
simply have been "04".
Special Surveys Division
64
2000 National Survey of Giving, Volunteering and Participating - User Guide
Positions 1-2: Variable / Questionnaire Section Name
Position
1-2
Questionnaire Section
Name
Position
1-2
Questionnaire Section Name
FV
Formal Volunteering
GS
Giving Specifics
VS
Volunteer Specifics
RG
Reasons for Giving
VD
Volunteer Details
NG
Reasons for not Giving (more)
RV
Reasons for Volunteering
OG
Other Giving
ES
Employer Support
PA
Participating
SK
Skills gained from
Volunteering
EA
Youth Experiences and Attitudes
NV
Reasons for Not Volunteering
(more)
SD
Socio-demographics
IV
Informal Volunteer Activity
IN
Income
FG
Financial Giving to Charitable
Organizations
AM
Administration
LF
Labour Force
GE
Geography
ED
Education
DH
Demographic Household
OT
Other
Note: A few important variables do not follow the naming convention: e.g. MICRO_ID, ORGID
and FINWGTH.
Position 3: Cycle / Year Variable
0
1
2
3
Static variable (e.g. dh0_sex, dh0_yob)
Cycle 1 (Year 2000)
Cycle 2 (Year 2001)
Cycle 3 (Year 2002)
0
1
2
3
Static variable (e.g. dh0_sex, dh0_yob)
Cycle 1 (Year 2003) New survey
Cycle 2 (Year 2004)
Cycle 3 (Year 2005)
Special Surveys Division
65
2000 National Survey of Giving, Volunteering and Participating - User Guide
Position 4: Variable Type
_
Collected variable
A variable that appeared directly on the
questionnaire
C
Coded variable
A variable coded from one or more collected
variables (e.g., NAICS, Standard Occupational
Classification code)
D
Derived variable
A variable calculated from one or more collected
or coded variables, usually calculated during head
office processing (e.g., total hours volunteered)
F
Flag variable
A variable calculated from one or more collected
variables (like a derived variable), but usually
calculated by the computer application for later
use during the interview (e.g., volunteer flag).
G
Grouped variable
Collected, coded, suppressed or derived variables
collapsed into groups (e.g., age groups)
Positions 5-8: Variable Name/Number
In general, the last four positions follow the naming on the questionnaire. Numbers are
used where possible: Q01 becomes 01. “Mark-all” questions use letters for each
possible answer category: Q01 (mark all that apply) becomes 01A, 01B, 01C, etc.
Demographic variables which are used frequently by analysts are identified by a three
letter identifier, rather than by a question number; for example “age” is DH1_AGE in
cycle 1 and DH2_AGE in cycle 2.
As a general rule, a leading zero was put in front of the question name if the number
was less than 10 and no leading zero after 10. (e.g. 01, 02, 03 ,,, 10,11, 12 etc.)
Special Surveys Division
66
2000 National Survey of Giving, Volunteering and Participating - User Guide
13.0 Record Layout and Univariates
Special Surveys Division
67
Main File
2000 National Survey of Giving, Volunteering and Participating - User Guide
Administration:
MICRO_ID
Position:
1
Length:
5
Position:
6
Length:
2
Sequence number of record
Coverage:
All respondents
Geographic Variables:
GE1_PROV
Province
10
11
12
13
24
35
46
47
48
59
FREQ
593
437
1,056
895
2,368
4,520
1,175
1,351
1,189
1,140
=======
14,724
Newfoundland
Prince Edward Island
Nova Scotia
New Brunswick
Québec
Ontario
Manitoba
Saskatchewan
Alberta
British Columbia
Coverage:
WTD
439,794
109,944
749,927
604,505
5,947,590
9,329,190
860,303
763,745
2,329,405
3,248,804
==========
24,383,207
All respondents
Demographic Household:
DH1GAGE
Position:
8
Length:
1
Grouped Variable: Age group
1
2
3
4
5
6
15-24 years
25-34 years
35-44 years
45-54 years
55-64 years
65 years and over
Coverage:
FREQ
1,724
2,340
3,387
2,650
1,948
2,675
=======
14,724
WTD
4,078,366
4,295,488
5,231,392
4,356,266
2,802,480
3,619,215
==========
24,383,207
All respondents
Special Surveys Division
69
2000 National Survey of Giving, Volunteering and Participating - User Guide
Demographic Household:
DH0_SEX
Position:
9
Length:
1
Sex of respondent
1
2
FREQ
6,422
8,302
=======
14,724
Male
Female
Coverage:
Administration:
WTD
11,978,497
12,404,710
==========
24,383,207
All respondents
DH1GMS
Position:
10
Length:
1
Grouped Variable: Marital status
1
2
3
4
FREQ
8,712
3,231
1,296
1,485
=======
14,724
Married/Common-law
Single, Never married
Widow/widower
Separated/Divorced
Coverage:
WTD
15,068,653
6,416,140
1,293,466
1,604,948
==========
24,383,207
All respondents
Demographic Household:
DH1GEDLV
Position:
11
Length:
1
Grouped Variable: Highest level of education completed
1
2
3
4
5
Less than high school
Graduated from high school
Some post secondary
Post secondary diploma
University Degree
Coverage:
FREQ
3,816
2,594
1,293
4,563
2,458
=======
14,724
WTD
6,544,903
4,787,890
2,239,731
6,748,894
4,061,790
==========
24,383,207
All respondents
Special Surveys Division
70
2000 National Survey of Giving, Volunteering and Participating - User Guide
Demographic Household:
DH1GHHSZ
Position:
12
Length:
1
Grouped Variable: Household size
1
2
3
4
5
FREQ
3,148
5,014
2,455
2,632
1,475
=======
14,724
1
2
3
4
5 and over
Coverage:
WTD
3,002,932
7,762,790
4,998,695
5,131,382
3,487,408
==========
24,383,207
All respondents
Demographic Household:
DH1DKL18
Position:
13
Length:
1
Derived variable: Presence of one or more child in the household aged less than 18 years old
1
2
FREQ
4,532
10,192
=======
14,724
Yes
No
Coverage:
All respondents
Administration:
AM1_MOI
Position:
Month of Interview
Allowed Min:
10 Allowed Max:
12
10
11
12
October
November
December
Coverage:
WTD
7,229,724
17,153,483
==========
24,383,207
14
Length:
FREQ
5,224
7,870
1,630
=======
14,724
2
WTD
7,700,042
13,125,979
3,557,187
==========
24,383,207
All respondents
Special Surveys Division
71
2000 National Survey of Giving, Volunteering and Participating - User Guide
Administration:
AM1_DOI
Position:
Day of Interview
Allowed Min:
01 Allowed Max:
31
16
Length:
FREQ
14,724
=======
14,724
01 : 31
Coverage:
2
WTD
24,383,207
==========
24,383,207
All respondents
Administration:
AM1_YOI
Position:
18
Length:
4
Year of Interview
2000
FREQ
14,724
=======
14,724
2000
Coverage:
Other:
WTD
24,383,207
==========
24,383,207
All respondents
AM1DVG
Position:
22
Length:
1
Derived Variable: Combined volunteer and giver status
1
2
3
4
Volunteer and giver
Volunteer, not a giver
Not a Volunteer, but a giver
Neither volunteer nor giver
Coverage:
FREQ
7,687
538
4,918
1,581
=======
14,724
WTD
5,923,455
589,516
13,112,224
4,758,012
==========
24,383,207
All respondents
Special Surveys Division
72
2000 National Survey of Giving, Volunteering and Participating - User Guide
Formal Volunteering:
FV1_02
Position:
23
Length:
1
In the past 12 months, as an unpaid volunteer for an organization: ... did you do any canvassing, campaigning, or
fundraising?
1
2
7
8
FREQ
3,495
11,225
4
0
=======
14,724
Yes
No
Don't know
Refusal
Coverage:
WTD
2,627,513
21,754,404
1,290
0
==========
24,383,207
All respondents
Formal Volunteering:
FV1_03
Position:
24
Length:
1
... did you serve as an unpaid member of a board or committee?
1
2
7
8
FREQ
3,595
11,123
5
1
=======
14,724
Yes
No
Don't know
Refusal
Coverage:
WTD
2,682,484
21,692,437
8,184
102
==========
24,383,207
All respondents
Formal Volunteering:
FV1_04
Position:
25
Length:
1
... did you provide information or help to educate, influence public opinion or lobby others?
1
2
7
8
Yes
No
Don't know
Refusal
Coverage:
FREQ
2,396
12,312
13
3
=======
14,724
WTD
1,868,419
22,505,852
4,714
4,222
==========
24,383,207
All respondents
Special Surveys Division
73
2000 National Survey of Giving, Volunteering and Participating - User Guide
Formal Volunteering:
FV1_05
Position:
26
Length:
1
... did you help to organize or supervise activities or events for an organization?
1
2
7
8
FREQ
4,709
10,011
3
1
=======
14,724
Yes
No
Don't know
Refusal
Coverage:
WTD
3,717,666
20,664,599
841
102
==========
24,383,207
All respondents
Formal Volunteering:
FV1_06
Position:
27
Length:
1
In the past 12 months, as an unpaid volunteer for an organization: ... did you do any consulting, executive, office, or
administrative work?
1
2
7
8
FREQ
2,424
12,298
1
1
=======
14,724
Yes
No
Don't know
Refusal
Coverage:
WTD
1,950,243
22,431,210
1,652
102
==========
24,383,207
All respondents
Formal Volunteering:
FV1_07
Position:
28
Length:
1
Teach or coach for an organization
1
2
7
8
Yes
No
Don't know
Refusal
Coverage:
FREQ
2,089
12,633
1
1
=======
14,724
WTD
1,750,489
22,631,414
1,203
102
==========
24,383,207
All respondents
Special Surveys Division
74
2000 National Survey of Giving, Volunteering and Participating - User Guide
Formal Volunteering:
FV1_08
Position:
29
Length:
1
... did you provide care or support, including counselling and friendly visiting?
1
2
7
8
FREQ
2,219
12,501
2
2
=======
14,724
Yes
No
Don't know
Refusal
Coverage:
WTD
1,723,734
22,657,700
1,460
313
==========
24,383,207
All respondents
Formal Volunteering:
FV1_09
Position:
30
Length:
1
... did you provide any health care (not already mentioned) in a hospital or a senior citizens' home?
1
2
8
FREQ
607
14,114
3
=======
14,724
Yes
No
Refusal
Coverage:
WTD
481,810
23,899,155
2,242
==========
24,383,207
All respondents
Formal Volunteering:
FV1_10
Position:
31
Length:
1
In the past 12 months, as an unpaid volunteer for an organization: ... did you provide assistance to anyone as a member of
a self-help mutual aid group such as a single parents group, a bereaved parents group or AA?
1
2
7
8
Yes
No
Don't know
Refusal
Coverage:
FREQ
712
14,009
1
2
=======
14,724
WTD
529,568
23,852,123
1,203
313
==========
24,383,207
All respondents
Special Surveys Division
75
2000 National Survey of Giving, Volunteering and Participating - User Guide
Formal Volunteering:
FV1_11
Position:
32
Length:
1
... did you collect, serve, or deliver food or other goods?
1
2
7
8
FREQ
2,041
12,680
1
2
=======
14,724
Yes
No
Don't know
Refusal
Coverage:
WTD
1,598,655
22,783,847
391
313
==========
24,383,207
All respondents
Formal Volunteering:
FV1_12
Position:
33
Length:
1
... did you help to maintain, repair or build facilities?
1
2
7
8
FREQ
1,336
13,382
4
2
=======
14,724
Yes
No
Don't know
Refusal
Coverage:
WTD
1,016,548
23,363,383
2,962
313
==========
24,383,207
All respondents
Formal Volunteering:
FV1_13
Position:
34
Length:
1
... did you do volunteer driving?
1
2
7
8
Yes
No
Don't know
Refusal
Coverage:
FREQ
1,696
13,025
1
2
=======
14,724
WTD
1,279,668
23,103,100
125
313
==========
24,383,207
All respondents
Special Surveys Division
76
2000 National Survey of Giving, Volunteering and Participating - User Guide
Formal Volunteering:
FV1_14
Position:
35
Length:
1
In the past 12 months, as an unpaid volunteer for an organization: ... did you help with first-aid, fire-fighting or search and
rescue?
1
2
8
FREQ
569
14,152
3
=======
14,724
Yes
No
Refusal
Coverage:
WTD
413,398
23,969,091
718
==========
24,383,207
All respondents
Formal Volunteering:
FV1_15
Position:
36
Length:
1
... did you engage in any activities aimed at protecting the environment or wildlife?
1
2
7
8
FREQ
1,286
13,434
2
2
=======
14,724
Yes
No
Don't know
Refusal
Coverage:
WTD
1,015,339
23,365,376
2,179
313
==========
24,383,207
All respondents
Formal Volunteering:
FV1_16
Position:
37
Length:
1
In the past 12 months, did you volunteer in an other way to a group or organization? (e.g. help given to schools, religious
organizations, community associations, etc.)
1
2
7
8
Yes - Specify
No
Don't know
Refusal
Coverage:
FREQ
1,522
13,198
2
2
=======
14,724
WTD
1,298,175
23,084,307
412
313
==========
24,383,207
All respondents
Special Surveys Division
77
2000 National Survey of Giving, Volunteering and Participating - User Guide
Formal Volunteering:
FV1FVOL
Position:
38
Length:
1
Volunteer Flag
1
2
FREQ
8,225
6,499
=======
14,724
Volunteer
Non-volunteer (screened in)
WTD
6,512,971
17,870,236
==========
24,383,207
Coverage:
All respondents
Note: Answered at least one 'Yes' to FV1_02 to FV1_16
Volunteer Specifics:
VS1_01
Position:
39
Length:
2
In the past 12 months, for how many organizations did you volunteer?
Allowed Min:
01 Allowed Max:
20
01 : 20
96
FREQ
8,225
6,499
=======
14,724
Valid skip
Coverage:
WTD
6,512,971
17,870,236
==========
24,383,207
Volunteers
Volunteer Details:
VD1DHRS
Position:
41
Length:
4
Derived variable: Total number of hours volunteered
0001 : 4800
9996
Valid skip
FREQ
8,225
6,499
=======
14,724
WTD
6,512,971
17,870,236
==========
24,383,207
Coverage:
Volunteers
Note: Includes additional hours reported in VD1_09
Special Surveys Division
78
2000 National Survey of Giving, Volunteering and Participating - User Guide
Volunteer Details:
VD1DNE01
Position:
45
Length:
1
Derived variable: Number of volunteer events: Culture and Recreation
Allowed Min:
0 Allowed Max:
3
0
1
2
3
6
FREQ
5,582
2,176
410
57
6,499
=======
14,724
No events
1 event
2 events
3 events
Valid skip
Coverage:
WTD
4,536,270
1,636,232
306,385
34,084
17,870,236
==========
24,383,207
Volunteers
Volunteer Details:
VD1DHR01
Position:
46
Length:
4
Derived variable: Total hours volunteered: Culture and Recreation
0001 : 2912
0000
9996
Coverage:
FREQ
2,643
5,582
6,499
=======
14,724
No hours
Valid skip
WTD
1,976,701
4,536,270
17,870,236
==========
24,383,207
Volunteers
Volunteer Details:
VD1DNE02
Position:
50
Length:
1
Derived variable: Number of volunteer events: Education and Research
Allowed Min:
0 Allowed Max:
3
0
1
2
3
6
No events
1 event
2 events
3 events
Valid skip
Coverage:
FREQ
6,779
1,348
89
9
6,499
=======
14,724
WTD
5,274,590
1,158,193
74,272
5,915
17,870,236
==========
24,383,207
Volunteers
Special Surveys Division
79
2000 National Survey of Giving, Volunteering and Participating - User Guide
Volunteer Details:
VD1DHR02
Position:
51
Length:
4
Derived variable: Total hours volunteered: Education and Research
0001 : 3135
0000
9996
Coverage:
FREQ
1,446
6,779
6,499
=======
14,724
No hours
Valid skip
WTD
1,238,381
5,274,590
17,870,236
==========
24,383,207
Volunteers
Volunteer Details:
VD1DNE03
Position:
55
Length:
1
Derived variable: Number of volunteer events: Health
Allowed Min:
0 Allowed Max:
3
0
1
2
3
6
FREQ
6,795
1,242
161
27
6,499
=======
14,724
No events
1 event
2 events
3 events
Valid skip
Coverage:
WTD
5,408,232
959,044
124,579
21,116
17,870,236
==========
24,383,207
Volunteers
Volunteer Details:
VD1DHR03
Position:
56
Length:
4
Derived variable: Total hours volunteered: Health
0001 : 4800
0000
9996
Coverage:
No hours
Valid skip
FREQ
1,430
6,795
6,499
=======
14,724
WTD
1,104,739
5,408,232
17,870,236
==========
24,383,207
Volunteers
Special Surveys Division
80
2000 National Survey of Giving, Volunteering and Participating - User Guide
Volunteer Details:
VD1DNE04
Position:
60
Length:
1
Derived variable: Number of volunteer events: Social Services
Allowed Min:
0 Allowed Max:
3
0
1
2
3
6
FREQ
5,889
2,067
245
24
6,499
=======
14,724
No events
1 event
2 events
3 events
Valid skip
Coverage:
WTD
4,732,670
1,594,958
163,954
21,389
17,870,236
==========
24,383,207
Volunteers
Volunteer Details:
VD1DHR04
Position:
61
Length:
4
Derived variable: Total hours volunteered: Social Services
0001 : 3128
0000
9996
Coverage:
FREQ
2,336
5,889
6,499
=======
14,724
No hours
Valid skip
WTD
1,780,301
4,732,670
17,870,236
==========
24,383,207
Volunteers
Volunteer Details:
VD1DNE05
Position:
65
Length:
1
Derived variable: Number of volunteer events: Environment
Allowed Min:
0 Allowed Max:
3
0
1
2
3
6
No events
1 event
2 events
3 events
Valid skip
Coverage:
FREQ
7,888
306
27
4
6,499
=======
14,724
WTD
6,259,903
229,280
19,164
4,624
17,870,236
==========
24,383,207
Volunteers
Special Surveys Division
81
2000 National Survey of Giving, Volunteering and Participating - User Guide
Volunteer Details:
VD1DHR05
Position:
66
Length:
4
Derived variable: Total hours volunteered: Environment
0001 : 1922
0000
9996
Coverage:
FREQ
337
7,888
6,499
=======
14,724
No hours
Valid skip
WTD
253,068
6,259,903
17,870,236
==========
24,383,207
Volunteers
Volunteer Details:
VD1DNE06
Position:
70
Length:
1
Derived variable: Number of volunteer events: Development and Housing
Allowed Min:
0 Allowed Max:
3
0
1
2
3
6
FREQ
7,645
557
22
1
6,499
=======
14,724
No events
1 event
2 events
3 events
Valid skip
Coverage:
WTD
6,030,495
463,515
18,276
685
17,870,236
==========
24,383,207
Volunteers
Volunteer Details:
VD1DHR06
Position:
71
Length:
4
Derived variable: Total hours volunteered: Development and Housing
0001 : 1680
0000
9996
Coverage:
No hours
Valid skip
FREQ
580
7,645
6,499
=======
14,724
WTD
482,476
6,030,495
17,870,236
==========
24,383,207
Volunteers
Special Surveys Division
82
2000 National Survey of Giving, Volunteering and Participating - User Guide
Volunteer Details:
VD1DNE07
Position:
75
Length:
1
Derived variable: Number of volunteer events: Law, Advocacy and Politics
Allowed Min:
0 Allowed Max:
3
0
1
2
3
6
FREQ
7,839
364
21
1
6,499
=======
14,724
No events
1 event
2 events
3 events
Valid skip
Coverage:
WTD
6,198,482
301,710
11,577
1,203
17,870,236
==========
24,383,207
Volunteers
Volunteer Details:
VD1DHR07
Position:
76
Length:
4
Derived variable: Total hours volunteered: Law, Advocacy and Politics
0001 : 2600
0000
9996
Coverage:
FREQ
386
7,839
6,499
=======
14,724
No hours
Valid skip
WTD
314,489
6,198,482
17,870,236
==========
24,383,207
Volunteers
Volunteer Details:
VD1DNE08
Position:
80
Length:
1
Derived variable: Number of volunteer events: Philanthropic Intermediaries and Voluntarism Promotion
Allowed Min:
0 Allowed Max:
3
0
1
2
6
No events
1 event
2 events
Valid skip
Coverage:
FREQ
7,979
244
2
6,499
=======
14,724
WTD
6,288,548
223,387
1,036
17,870,236
==========
24,383,207
Volunteers
Special Surveys Division
83
2000 National Survey of Giving, Volunteering and Participating - User Guide
Volunteer Details:
VD1DHR08
Position:
81
Length:
4
Derived variable: Total hours volunteered: Philanthropic Intermediaries and Voluntarism Promotion
0001 : 0805
0000
9996
Coverage:
FREQ
246
7,979
6,499
=======
14,724
No hours
Valid skip
WTD
224,423
6,288,548
17,870,236
==========
24,383,207
Volunteers
Volunteer Details:
VD1DNE09
Position:
85
Length:
1
Derived variable: Number of volunteer events: International
Allowed Min:
0 Allowed Max:
3
0
1
2
6
FREQ
8,140
83
2
6,499
=======
14,724
No events
1 event
2 events
Valid skip
Coverage:
WTD
6,431,249
76,788
4,934
17,870,236
==========
24,383,207
Volunteers
Volunteer Details:
VD1DHR09
Position:
86
Length:
4
Derived variable: Total hours volunteered: International
0001 : 1008
0000
9996
Coverage:
No hours
Valid skip
FREQ
85
8,140
6,499
=======
14,724
WTD
81,722
6,431,249
17,870,236
==========
24,383,207
Volunteers
Special Surveys Division
84
2000 National Survey of Giving, Volunteering and Participating - User Guide
Volunteer Details:
VD1DNE10
Position:
90
Length:
1
Derived variable: Number of volunteer events: Religion
Allowed Min:
0 Allowed Max:
3
0
1
2
3
6
FREQ
6,423
1,682
113
7
6,499
=======
14,724
No events
1 event
2 events
3 events
Valid skip
Coverage:
WTD
5,166,395
1,255,349
85,720
5,507
17,870,236
==========
24,383,207
Volunteers
Volunteer Details:
VD1DHR10
Position:
91
Length:
4
Derived variable: Total hours volunteered: Religion
0001 : 2734
0000
9996
Coverage:
FREQ
1,802
6,423
6,499
=======
14,724
No hours
Valid skip
WTD
1,346,576
5,166,395
17,870,236
==========
24,383,207
Volunteers
Volunteer Details:
VD1DNE11
Position:
95
Length:
1
Derived variable: Number of volunteer events: Business and Professional Associations and Unions
Allowed Min:
0 Allowed Max:
3
0
1
2
6
No events
1 event
2 events
Valid skip
Coverage:
FREQ
7,945
261
19
6,499
=======
14,724
WTD
6,300,618
195,297
17,056
17,870,236
==========
24,383,207
Volunteers
Special Surveys Division
85
2000 National Survey of Giving, Volunteering and Participating - User Guide
Volunteer Details:
VD1DHR11
Position:
96
Length:
4
Derived variable: Total hours volunteered: Business and Professional Associations and Unions
0001 : 1100
0000
9996
Coverage:
FREQ
280
7,945
6,499
=======
14,724
No hours
Valid skip
WTD
212,353
6,300,618
17,870,236
==========
24,383,207
Volunteers
Volunteer Details:
VD1DNE12
Position:
100
Length:
1
Derived variable: Number of volunteer events: Not Elsewhere Classified
Allowed Min:
0 Allowed Max:
3
0
1
2
6
FREQ
8,105
115
5
6,499
=======
14,724
No events
1 event
2 events
Valid skip
Coverage:
WTD
6,408,492
98,863
5,616
17,870,236
==========
24,383,207
Volunteers
Volunteer Details:
VD1DHR12
Position:
101
Length:
4
Derived variable: Total hours volunteered: Not Elsewhere Classified
0001 : 2370
0000
9996
Coverage:
No hours
Valid skip
FREQ
120
8,105
6,499
=======
14,724
WTD
104,479
6,408,492
17,870,236
==========
24,383,207
Volunteers
Special Surveys Division
86
2000 National Survey of Giving, Volunteering and Participating - User Guide
Formal Volunteer Con'd: FV1_17
Position:
105
Length:
3
In the past 12 months, how many additional hours did you volunteer for the remaining organization(s)?
Allowed Min:
001
Allowed Max:
100
001 : 100
996
Coverage:
FREQ
561
14,163
=======
14,724
Valid skip
WTD
404,275
23,978,932
==========
24,383,207
Volunteers
Formal Volunteer Con'd: FV1_18
Position:
108
Length:
1
Over the past year, when did you do most of your volunteering?
1
2
3
4
5
6
7
8
9
FREQ
3,734
310
262
1,089
2,637
6,499
46
25
122
=======
14,724
On weekday(s) (Monday to Friday)
On Saturdays
On Sundays
Saturdays and Sundays
Mixture
Valid skip
Don't know
Refusal
Not stated
Coverage:
WTD
2,954,374
264,599
196,694
919,451
1,999,782
17,870,236
50,195
11,632
116,245
==========
24,383,207
Volunteers
Formal Volunteer Con'd: FV1_19
Position:
109
Length:
1
At what time of the day did you do most of your volunteering?
1
2
3
4
5
6
7
8
9
All day long
Morning
Afternoon
Evening
Varied
Valid skip
Don't know
Refusal
Not stated
Coverage:
FREQ
836
914
1,297
2,483
2,508
6,499
34
25
128
=======
14,724
WTD
681,566
756,315
1,056,378
1,929,066
1,916,316
17,870,236
40,625
13,876
118,829
==========
24,383,207
Volunteers
Special Surveys Division
87
2000 National Survey of Giving, Volunteering and Participating - User Guide
Reasons for Volunteering: RV1_02
Position:
110
Length:
1
The reason that you volunteer is: ... to help a cause in which you personally believe.
1
2
6
7
8
9
FREQ
7,706
334
6,499
6
25
154
=======
14,724
Agree
Disagree
Valid skip
Don't know
Refusal
Not stated
Coverage:
WTD
6,023,111
327,201
17,870,236
3,735
13,567
145,356
==========
24,383,207
Volunteers
Reasons for Volunteering: RV1_03
Position:
111
Length:
1
... because you have been personally affected or know someone who has been personally affected by the cause the
organization supports.
1
2
6
7
8
9
FREQ
5,688
2,323
6,499
32
24
158
=======
14,724
Agree
Disagree
Valid skip
Don't know
Refusal
Not stated
Coverage:
WTD
4,354,036
1,974,589
17,870,236
20,180
16,082
148,084
==========
24,383,207
Volunteers
Reasons for Volunteering: RV1_04
Position:
112
Length:
1
... because your friends volunteer.
1
2
6
7
8
9
Agree
Disagree
Valid skip
Don't know
Refusal
Not stated
Coverage:
FREQ
2,403
5,632
6,499
6
25
159
=======
14,724
WTD
1,917,204
4,427,657
17,870,236
3,982
15,263
148,865
==========
24,383,207
Volunteers
Special Surveys Division
88
2000 National Survey of Giving, Volunteering and Participating - User Guide
Reasons for Volunteering: RV1_05
Position:
113
Length:
1
... to improve your job opportunities.
1
2
6
7
8
9
FREQ
1,695
6,328
6,499
18
25
159
=======
14,724
Agree
Disagree
Valid skip
Don't know
Refusal
Not stated
Coverage:
WTD
1,438,375
4,899,838
17,870,236
10,630
15,263
148,865
==========
24,383,207
Volunteers
Reasons for Volunteering: RV1_06
Position:
114
Length:
1
The reason that you volunteer is: ... to fulfill religious obligations or beliefs.
1
2
6
7
8
9
FREQ
2,348
5,676
6,499
13
27
161
=======
14,724
Agree
Disagree
Valid skip
Don't know
Refusal
Not stated
Coverage:
WTD
1,675,002
4,658,363
17,870,236
13,970
16,148
149,488
==========
24,383,207
Volunteers
Reasons for Volunteering: RV1_07
Position:
115
Length:
1
... to explore your own strengths.
1
2
6
7
8
9
Agree
Disagree
Valid skip
Don't know
Refusal
Not stated
Coverage:
FREQ
4,685
3,316
6,499
35
26
163
=======
14,724
WTD
3,626,076
2,703,192
17,870,236
17,785
15,594
150,325
==========
24,383,207
Volunteers
Special Surveys Division
89
2000 National Survey of Giving, Volunteering and Participating - User Guide
Reasons for Volunteering: RV1_08
Position:
116
Length:
1
... to use your skills and experiences.
1
2
6
7
8
9
FREQ
6,565
1,464
6,499
8
25
163
=======
14,724
Agree
Disagree
Valid skip
Don't know
Refusal
Not stated
Coverage:
WTD
5,134,298
1,209,205
17,870,236
3,880
15,263
150,325
==========
24,383,207
Volunteers
Reasons for Volunteering: RV1_09
Position:
117
Length:
1
In the past 12 months, were you required to volunteer by your school, your employer or by government, for example, to earn
a high school credit or for a community service order, etc.?
1
2
6
7
8
9
FREQ
571
7,455
6,499
10
24
165
=======
14,724
Yes
No
Valid skip
Don't know
Refusal
Not stated
Coverage:
WTD
483,948
5,857,359
17,870,236
5,956
14,838
150,870
==========
24,383,207
Volunteers
Employer Support:
ES1_01
Position:
118
Length:
1
In the past 12 months, did you get any of the following types of support from your employer to help with your volunteer
activities: Did your employer give you: ... approval for use of facilities or equipment for your volunteer activities?
1
2
6
7
8
9
Yes
No
Valid skip
Don't know
Refusal
Not stated
Coverage:
FREQ
1,354
3,381
9,834
17
10
128
=======
14,724
WTD
1,062,480
2,917,453
20,258,614
14,059
7,461
123,139
==========
24,383,207
Volunteers who are employees
Special Surveys Division
90
2000 National Survey of Giving, Volunteering and Participating - User Guide
Employer Support:
ES1_02
Position:
119
Length:
1
... approval to take time off or the opportunity to spend some time doing volunteer work while on the job?
1
2
6
7
8
9
FREQ
1,330
3,395
9,834
23
13
129
=======
14,724
Yes
No
Valid skip
Don't know
Refusal
Not stated
Coverage:
WTD
1,045,173
2,928,476
20,258,614
16,221
9,116
125,606
==========
24,383,207
Volunteers who are employees
Employer Support:
ES1_03
Position:
120
Length:
1
... approval to change work hours to spend time volunteering?
1
2
6
7
8
9
FREQ
1,231
3,493
9,834
24
12
130
=======
14,724
Yes
No
Valid skip
Don't know
Refusal
Not stated
Coverage:
WTD
984,382
2,984,807
20,258,614
18,709
9,628
127,067
==========
24,383,207
Volunteers who are employees
Employer Support:
ES1_04
Position:
121
Length:
1
... recognition or a letter of thanks for your volunteer activities?
1
2
6
7
8
9
Yes
No
Valid skip
Don't know
Refusal
Not stated
Coverage:
FREQ
1,052
3,682
9,834
17
9
130
=======
14,724
WTD
857,611
3,118,250
20,258,614
14,458
7,207
127,067
==========
24,383,207
Volunteers who are employees
Special Surveys Division
91
2000 National Survey of Giving, Volunteering and Participating - User Guide
Employer Support:
ES1_05
Position:
122
Length:
1
Did you receive any other formal support from your employer for your volunteer activities?
1
2
6
7
8
9
FREQ
298
4,436
9,834
17
9
130
=======
14,724
Yes
No
Valid skip
Don't know
Refusal
Not stated
Coverage:
WTD
255,648
3,722,212
20,258,614
12,459
7,207
127,067
==========
24,383,207
Volunteers who are employees
Employer Support:
ES1_06A
Position:
123
Length:
1
What other type of formal support? - Donated prizes, gift certificates, food, etc.
1
2
6
7
9
FREQ
118
176
14,270
4
156
=======
14,724
Yes
No
Valid skip
Don't know
Not stated
Coverage:
WTD
95,067
158,213
23,980,826
2,368
146,733
==========
24,383,207
Respondents who answered ES1_05=1
Employer Support:
ES1_06B
Position:
124
Length:
1
What other type of formal support? - Donated t-shirts, company goods, etc.
1
2
6
7
9
Yes
No
Valid skip
Don't know
Not stated
Coverage:
FREQ
39
255
14,270
4
156
=======
14,724
WTD
30,529
222,751
23,980,826
2,368
146,733
==========
24,383,207
Respondents who answered ES1_05=1
Special Surveys Division
92
2000 National Survey of Giving, Volunteering and Participating - User Guide
Employer Support:
ES1_06C
Position:
125
Length:
1
What other type of formal support? - Donated financially to the organization
1
2
6
7
9
FREQ
99
195
14,270
4
156
=======
14,724
Yes
No
Valid skip
Don't know
Not stated
Coverage:
WTD
80,886
172,395
23,980,826
2,368
146,733
==========
24,383,207
Respondents who answered ES1_05=1
Employer Support:
ES1_06D
Position:
126
Length:
1
What other type of formal support? - Provided transportation
1
2
6
7
9
FREQ
21
273
14,270
4
156
=======
14,724
Yes
No
Valid skip
Don't know
Not stated
Coverage:
WTD
13,393
239,887
23,980,826
2,368
146,733
==========
24,383,207
Respondents who answered ES1_05=1
Employer Support:
ES1_06E
Position:
127
Length:
1
What other type of formal support? - Sponsored an event, paid entry fee, membership fee, etc.
1
2
6
7
9
Yes
No
Valid skip
Don't know
Not stated
Coverage:
FREQ
94
200
14,270
4
156
=======
14,724
WTD
85,861
167,419
23,980,826
2,368
146,733
==========
24,383,207
Respondents who answered ES1_05=1
Special Surveys Division
93
2000 National Survey of Giving, Volunteering and Participating - User Guide
Employer Support:
ES1_06F
Position:
128
Length:
1
What other type of formal support? - Other
1
2
6
7
9
FREQ
2
292
14,270
4
156
=======
14,724
Yes
No
Valid skip
Don't know
Not stated
Coverage:
WTD
514
252,767
23,980,826
2,368
146,733
==========
24,383,207
Respondents who answered ES1_05=1
Skills gained-Volunteer: SK1_01
Position:
129
Length:
1
Have your activities as a volunteer given you any new skills that you can apply directly to your job (or business)?
1
2
6
7
8
9
FREQ
2,168
3,522
8,848
7
9
170
=======
14,724
Yes
No
Valid skip
Don't know
Refusal
Not stated
Coverage:
WTD
1,787,489
2,984,809
19,449,659
4,956
9,729
146,565
==========
24,383,207
Volunteers who are employees, self-employed or in a family business
Skills gained-Volunteer: SK1_02
Position:
130
Length:
1
Have your volunteer activities provided you with: ... fundraising skills?
1
2
6
7
8
9
Yes
No
Valid skip
Don't know
Refusal
Not stated
Coverage:
FREQ
3,773
4,234
6,499
16
27
175
=======
14,724
WTD
2,849,500
3,474,920
17,870,236
10,545
16,820
161,186
==========
24,383,207
Volunteers
Special Surveys Division
94
2000 National Survey of Giving, Volunteering and Participating - User Guide
Skills gained-Volunteer: SK1_03
Position:
131
Length:
1
... technical or office skills, for example, first aid, coaching techniques, computer, how to do the books or catalogue in a
library, etc.?
1
2
6
7
8
9
FREQ
2,495
5,524
6,499
4
26
176
=======
14,724
Yes
No
Valid skip
Don't know
Refusal
Not stated
Coverage:
WTD
2,081,757
4,252,588
17,870,236
732
16,325
161,569
==========
24,383,207
Volunteers
Skills gained-Volunteer: SK1_04
Position:
132
Length:
1
... organizational skills or managerial skills, for example, how to organize people or money, to be a leader, to plan, to run an
organization, etc.?
1
2
6
7
8
9
FREQ
4,562
3,451
6,499
8
26
178
=======
14,724
Yes
No
Valid skip
Don't know
Refusal
Not stated
Coverage:
WTD
3,620,665
2,709,250
17,870,236
4,279
16,325
162,452
==========
24,383,207
Volunteers
Skills gained-Volunteer: SK1_05
Position:
133
Length:
1
Have your volunteer activities provided you with: ... increased knowledge, for example, about health, women's issues,
political issues, criminal justice, the environment, etc.?
1
2
6
7
8
9
Yes
No
Valid skip
Don't know
Refusal
Not stated
Coverage:
FREQ
5,118
2,892
6,499
8
28
179
=======
14,724
WTD
4,013,227
2,315,889
17,870,236
2,418
17,793
163,645
==========
24,383,207
Volunteers
Special Surveys Division
95
2000 National Survey of Giving, Volunteering and Participating - User Guide
Skills gained-Volunteer: SK1_06
Position:
134
Length:
1
... communication skills, for example, public speaking, writing, public relations, conducting meetings, etc.?
1
2
6
7
8
9
FREQ
5,414
2,598
6,499
3
28
182
=======
14,724
Yes
No
Valid skip
Don't know
Refusal
Not stated
Coverage:
WTD
4,281,777
2,047,740
17,870,236
680
16,994
165,780
==========
24,383,207
Volunteers
Skills gained-Volunteer: SK1_07
Position:
135
Length:
1
... interpersonal skills, for example, understand children or other people better, to motivate them, to deal with difficult
situations, confidence, compassion, patience, etc.?
1
2
6
7
8
9
FREQ
6,310
1,689
6,499
13
29
184
=======
14,724
Yes
No
Valid skip
Don't know
Refusal
Not stated
Coverage:
WTD
4,973,024
1,350,015
17,870,236
5,718
17,083
167,131
==========
24,383,207
Volunteers
Skills gained-Volunteer: SK1_08
Position:
136
Length:
1
... some other skill or knowledge?
1
2
6
7
8
9
Yes - Specify
No
Valid skip
Don't know
Refusal
Not stated
Coverage:
FREQ
6
7,990
6,499
16
28
185
=======
14,724
WTD
5,977
6,312,698
17,870,236
9,929
17,155
167,212
==========
24,383,207
Volunteers
Special Surveys Division
96
2000 National Survey of Giving, Volunteering and Participating - User Guide
Skills gained-Volunteer: SK1_09
Position:
137
Length:
1
Do you think your volunteer activities have helped your chances of success in your paid job (or business)?
1
2
6
7
8
9
FREQ
1,663
3,347
9,503
26
9
176
=======
14,724
Yes
No
Valid skip
Don't know
Refusal
Not stated
Coverage:
WTD
1,353,499
2,845,550
20,026,972
18,593
8,430
130,163
==========
24,383,207
Volunteers employed at work, absent from work or on temporary layoff
Skills gained-Volunteer: SK1_10
Position:
138
Length:
1
Do you think your volunteer activities will help your chances of finding a job?
1
2
6
7
9
FREQ
157
110
14,440
5
12
=======
14,724
Yes
No
Valid skip
Don't know
Not stated
Coverage:
WTD
125,888
78,429
24,166,290
2,044
10,555
==========
24,383,207
Volunteers seeking a job
Skills gained-Volunteer: SK1_11
Position:
139
Length:
1
Have your volunteer activities ever helped you to obtain employment?
1
2
6
7
8
9
Yes
No
Valid skip
Don't know
Refusal
Not stated
Coverage:
FREQ
1,109
6,860
6,499
39
28
189
=======
14,724
WTD
900,443
5,393,533
17,870,236
32,367
16,797
169,831
==========
24,383,207
Volunteers
Special Surveys Division
97
2000 National Survey of Giving, Volunteering and Participating - User Guide
Reasons - Not Volunteer:
NV1_02
Position:
140
Length:
1
The reason that you do not volunteer (more) is: ... because you feel that you have already made your contribution to
volunteering.
1
2
7
8
9
FREQ
3,968
9,660
92
105
899
=======
14,724
Agree
Disagree
Don't know
Refusal
Not stated
Coverage:
WTD
5,156,691
16,418,208
203,941
131,561
2,472,806
==========
24,383,207
All respondents
Reasons - Not Volunteer:
NV1_03
Position:
141
Length:
1
... because you do not have any extra time.
1
2
7
8
9
FREQ
9,473
4,180
44
101
926
=======
14,724
Agree
Disagree
Don't know
Refusal
Not stated
Coverage:
WTD
15,414,006
6,235,955
55,254
141,260
2,536,732
==========
24,383,207
All respondents
Reasons - Not Volunteer:
NV1_04
Position:
142
Length:
1
... because you have health problems or are physically unable.
1
2
7
8
9
Agree
Disagree
Don't know
Refusal
Not stated
Coverage:
FREQ
3,025
10,634
31
96
938
=======
14,724
WTD
4,682,968
16,969,545
39,126
137,671
2,553,898
==========
24,383,207
All respondents
Special Surveys Division
98
2000 National Survey of Giving, Volunteering and Participating - User Guide
Reasons - Not Volunteer:
NV1_05
Position:
143
Length:
1
... because no one you know has personally asked you.
1
2
7
8
9
FREQ
3,303
10,325
42
101
953
=======
14,724
Agree
Disagree
Don't know
Refusal
Not stated
Coverage:
WTD
6,645,618
14,925,921
65,948
140,973
2,604,747
==========
24,383,207
All respondents
Reasons - Not Volunteer:
NV1_06
Position:
144
Length:
1
The reason that you do not volunteer (more) is: ... because you do not know how to become involved.
1
2
7
8
9
FREQ
1,681
11,918
50
105
970
=======
14,724
Agree
Disagree
Don't know
Refusal
Not stated
Coverage:
WTD
3,601,512
17,908,223
82,080
146,760
2,644,633
==========
24,383,207
All respondents
Reasons - Not Volunteer:
NV1_07
Position:
145
Length:
1
... because of the financial cost of volunteering.
1
2
7
8
9
Agree
Disagree
Don't know
Refusal
Not stated
Coverage:
FREQ
2,191
11,373
71
105
984
=======
14,724
WTD
3,644,775
17,807,714
115,197
144,025
2,671,495
==========
24,383,207
All respondents
Special Surveys Division
99
2000 National Survey of Giving, Volunteering and Participating - User Guide
Reasons - Not Volunteer:
NV1_08
Position:
146
Length:
1
... because of concerns that you could be sued or taken to court due to volunteer activities.
1
2
7
8
9
FREQ
882
12,683
65
105
989
=======
14,724
Agree
Disagree
Don't know
Refusal
Not stated
Coverage:
WTD
1,428,466
20,016,202
102,249
151,744
2,684,546
==========
24,383,207
All respondents
Reasons - Not Volunteer:
NV1_09
Position:
147
Length:
1
... because you have no interest.
1
2
7
8
9
FREQ
2,578
10,991
61
102
992
=======
14,724
Agree
Disagree
Don't know
Refusal
Not stated
Coverage:
WTD
4,726,917
16,729,996
99,302
140,264
2,686,727
==========
24,383,207
All respondents
Reasons - Not Volunteer:
NV1_10
Position:
148
Length:
1
The reason that you do not volunteer (more) is: ... because you give money instead of time.
1
2
7
8
9
Agree
Disagree
Don't know
Refusal
Not stated
Coverage:
FREQ
4,157
9,375
77
115
1,000
=======
14,724
WTD
7,181,582
14,189,234
132,377
153,383
2,726,631
==========
24,383,207
All respondents
Special Surveys Division
100
2000 National Survey of Giving, Volunteering and Participating - User Guide
Reasons - Not Volunteer:
NV1_11
Position:
149
Length:
1
... because you are unwilling to make a year-round commitment.
1
2
7
8
9
FREQ
5,218
8,316
68
113
1,009
=======
14,724
Agree
Disagree
Don't know
Refusal
Not stated
Coverage:
WTD
9,076,939
12,298,998
106,877
148,847
2,751,547
==========
24,383,207
All respondents
Reasons - Not Volunteer:
NV1_12
Position:
150
Length:
1
... because you were dissatisfied with a previous volunteer experience.
1
2
7
8
9
FREQ
1,023
12,514
59
107
1,021
=======
14,724
Agree
Disagree
Don't know
Refusal
Not stated
Coverage:
WTD
1,708,516
19,635,223
116,792
137,822
2,784,856
==========
24,383,207
All respondents
Informal Volunteering:
IV1_02
Position:
151
Length:
1
In the past 12 months did you help anyone on your own: ... with housework such as cooking or cleaning?
1
2
7
8
9
Yes
No
Don't know
Refusal
Not stated
Coverage:
FREQ
5,594
7,854
21
118
1,137
=======
14,724
WTD
8,221,973
12,982,433
37,898
147,927
2,992,976
==========
24,383,207
All respondents
Special Surveys Division
101
2000 National Survey of Giving, Volunteering and Participating - User Guide
Informal Volunteering:
IV1_03
Position:
152
Length:
1
... with yard or maintenance work, such as gardening, painting or snow shovelling?
1
2
7
8
9
FREQ
5,639
7,806
19
116
1,144
=======
14,724
Yes
No
Don't know
Refusal
Not stated
Coverage:
WTD
7,954,069
13,234,765
31,328
145,885
3,017,160
==========
24,383,207
All respondents
Informal Volunteering:
IV1_04
Position:
153
Length:
1
... with shopping, or driving someone to appointments or stores?
1
2
7
8
9
FREQ
6,700
6,735
23
118
1,148
=======
14,724
Yes
No
Don't know
Refusal
Not stated
Coverage:
WTD
9,287,363
11,879,412
38,624
148,341
3,029,467
==========
24,383,207
All respondents
Informal Volunteering:
IV1_05
Position:
154
Length:
1
... by providing care or support to the sick or elderly?
1
2
7
8
9
Yes
No
Don't know
Refusal
Not stated
Coverage:
FREQ
5,108
8,327
20
119
1,150
=======
14,724
WTD
6,823,350
14,344,895
33,139
151,038
3,030,785
==========
24,383,207
All respondents
Special Surveys Division
102
2000 National Survey of Giving, Volunteering and Participating - User Guide
Informal Volunteering:
IV1_06
Position:
155
Length:
1
Was any of this care provided to someone recovering from a short-term illness, as a result of being discharged early from a
hospital?
1
2
6
7
8
9
FREQ
1,552
3,531
8,327
10
1
1,303
=======
14,724
Yes
No
Valid skip
Don't know
Refusal
Not stated
Coverage:
WTD
1,979,093
4,813,681
14,344,895
17,614
331
3,227,592
==========
24,383,207
Respondents who answered IV1_05=1
Informal Volunteering:
IV1_07
Position:
156
Length:
1
In the past 12 months did you help anyone on your own: ... by visiting the elderly? Remember, this is on your own, not for an
organization. Exclude help given to anyone living in your household.
1
2
7
8
9
FREQ
5,797
7,628
24
120
1,155
=======
14,724
Yes
No
Don't know
Refusal
Not stated
Coverage:
WTD
7,355,323
13,792,954
46,358
152,108
3,036,463
==========
24,383,207
All respondents
Informal Volunteering:
IV1_08
Position:
157
Length:
1
... by babysitting without being paid?
1
2
7
8
9
Yes
No
Don't know
Refusal
Not stated
Coverage:
FREQ
6,218
7,208
21
120
1,157
=======
14,724
WTD
8,297,356
12,852,651
43,412
152,108
3,037,680
==========
24,383,207
All respondents
Special Surveys Division
103
2000 National Survey of Giving, Volunteering and Participating - User Guide
Informal Volunteering:
IV1_09
Position:
158
Length:
1
... by writing letters for someone, solving problems, finding information or filling out forms?
1
2
7
8
9
FREQ
4,374
9,045
24
122
1,159
=======
14,724
Yes
No
Don't know
Refusal
Not stated
Coverage:
WTD
6,109,107
15,020,468
51,820
155,155
3,046,657
==========
24,383,207
All respondents
Informal Volunteering:
IV1_10
Position:
159
Length:
1
... by doing any unpaid teaching or coaching?
1
2
7
8
9
FREQ
2,591
10,829
21
121
1,162
=======
14,724
Yes
No
Don't know
Refusal
Not stated
Coverage:
WTD
3,223,587
17,907,543
43,965
154,271
3,053,842
==========
24,383,207
All respondents
Informal Volunteering:
IV1_11
Position:
160
Length:
1
In the past 12 months did you help anyone on your own: ... in the operation of a business or with farm work? Remember,
this is on your own, not for an organization. Exclude help given to anyone living in your household.
1
2
7
8
9
Yes
No
Don't know
Refusal
Not stated
Coverage:
FREQ
2,016
11,398
22
121
1,167
=======
14,724
WTD
2,486,089
18,636,738
46,678
154,271
3,059,431
==========
24,383,207
All respondents
Special Surveys Division
104
2000 National Survey of Giving, Volunteering and Participating - User Guide
Informal Volunteering:
IV1_12
Position:
161
Length:
1
In the past 12 months, not counting financial help, did you help in any other way on your own, not through an organization?
(Remember to exclude any help given to people who live with you and to exclude help already mentioned.)
1
2
7
8
9
FREQ
2,405
10,983
48
120
1,168
=======
14,724
Yes
No
Don't know
Refusal
Not stated
Coverage:
WTD
3,537,011
17,551,320
81,333
153,296
3,060,248
==========
24,383,207
All respondents
Informal Volunteering:
IV1_13
Position:
162
Length:
1
In what way?
1
Counseling or moral support (e.g. during a break-up or a
death)
Helped someone move
Baked or cooked food
Renovations e.g. built a deck, helped paint, etc.
Other - Specify
Valid skip
Don't know
Refusal
Not stated
2
3
4
5
6
7
8
9
Coverage:
FREQ
WTD
795
306
147
291
839
10,983
26
1
1,336
=======
14,724
1,131,688
490,552
199,077
372,676
1,289,671
17,551,320
53,002
345
3,294,877
==========
24,383,207
Respondents who answered IV1_12=1
Special Surveys Division
105
2000 National Survey of Giving, Volunteering and Participating - User Guide
Informal Volunteering:
IV1_14
Position:
163
Length:
1
Of the individuals you helped on your own, were any of them relatives who did not live with you?
1
2
6
7
8
9
FREQ
7,254
3,985
2,164
6
1
1,314
=======
14,724
Yes
No
Valid skip
Don't know
Refusal
Not stated
Coverage:
WTD
10,248,851
5,974,837
4,890,174
15,449
1,070
3,252,826
==========
24,383,207
Respondents who answered any one of IV1_02 to IV1_12=1
Informal Volunteering:
IV1_15
Position:
164
Length:
1
(Of the individuals you helped on your own,) were any of them not relatives?
1
2
6
7
8
9
FREQ
9,113
2,123
2,164
7
2
1,315
=======
14,724
Yes
No
Valid skip
Don't know
Refusal
Not stated
Coverage:
WTD
12,753,814
3,466,175
4,890,174
18,138
1,574
3,253,332
==========
24,383,207
Respondents who answered any one of IV1_02 to IV1_12=1
Informal Volunteering:
IV1FIV
Position:
165
Length:
1
Informal Volunteer flag
1
2
9
Yes
No
Not stated
FREQ
11,262
2,164
1,298
=======
14,724
WTD
16,265,487
4,890,174
3,227,546
==========
24,383,207
Coverage:
All respondents
Note: Answered "yes" to at least one of IV1_02 TO IV1_05, IV1_07 TO IV1_12
Special Surveys Division
106
2000 National Survey of Giving, Volunteering and Participating - User Guide
Financial Giving:
FG1_02
Position:
166
Length:
1
How are decisions made about financial giving in your household - do you or your spouse or partner each make your own
decisions about the charitable organizations to which you donate, make joint decisions, or is it a mixture of both?
1
2
3
6
7
8
9
FREQ
2,321
3,385
2,953
6,012
24
17
12
=======
14,724
Each decide on own
Joint decisions
Mixture
Valid skip
Don't know
Refusal
Not stated
WTD
4,507,313
5,830,549
4,615,274
9,314,554
56,693
44,050
14,774
==========
24,383,207
Coverage:
Respondents who are married or common-law
Note: It is assumed that decisions are 'on own' if not married or living common-law.
Financial Giving:
FG1_06
Position:
167
Length:
1
In the past 12 months, have you made a charitable donation: ... by responding to a request through the mail?
1
2
FREQ
4,310
10,414
=======
14,724
Yes
No
Coverage:
WTD
6,030,821
18,352,386
==========
24,383,207
All respondents
Financial Giving:
FG1DND06
Position:
168
Length:
2
Derived variable: Number of Donations: Request through the mail
Allowed Min:
00 Allowed Max:
55
01 : 55
00
96
No donations
Valid skip
Coverage:
FREQ
4,310
8,295
2,119
=======
14,724
WTD
6,030,821
13,004,858
5,347,528
==========
24,383,207
Givers
Special Surveys Division
107
2000 National Survey of Giving, Volunteering and Participating - User Guide
Financial Giving:
FG1DAD06
Position:
170
Length:
5
Derived variable: Amount of Donations: Request through the mail
00001 : 21675
00000
99996
Coverage:
FREQ
4,310
8,295
2,119
=======
14,724
None
Valid skip
WTD
6,030,821
13,004,858
5,347,528
==========
24,383,207
Givers
Financial Giving:
FG1_07
Position:
175
Length:
1
(In the past 12 months,) have you made a charitable donation: ... by paying to attend a charity event? (Do not include any
donations you have already mentioned.)
1
2
FREQ
3,637
11,087
=======
14,724
Yes
No
Coverage:
WTD
4,501,050
19,882,157
==========
24,383,207
All respondents
Financial Giving:
FG1DND07
Position:
176
Length:
2
Derived variable: Number of Donations: Paying to attend a charity event
Allowed Min:
00 Allowed Max:
55
01 : 24
00
96
No donations
Valid skip
Coverage:
FREQ
3,637
8,968
2,119
=======
14,724
WTD
4,501,050
14,534,629
5,347,528
==========
24,383,207
Givers
Special Surveys Division
108
2000 National Survey of Giving, Volunteering and Participating - User Guide
Financial Giving:
FG1DAD07
Position:
178
Length:
5
Derived variable: Amount of donations: Paying to attend a charity event
00001 : 05000
00000
99996
Coverage:
FREQ
3,637
8,968
2,119
=======
14,724
None
Valid skip
WTD
4,501,050
14,534,629
5,347,528
==========
24,383,207
Givers
Financial Giving:
FG1_08
Position:
183
Length:
1
(In the past 12 months,) have you made a charitable donation: ... by using payroll deductions? (Do not include any
donations you have already mentioned.)
1
2
6
FREQ
1,310
6,017
7,397
=======
14,724
Yes
No
Valid skip
Coverage:
WTD
2,042,469
10,950,399
11,390,339
==========
24,383,207
Respondents who are employees and employed at work or absent from work
Financial Giving:
FG1DND08
Position:
184
Length:
2
Derived variable: Number of Donations: Payroll deductions
Allowed Min:
00 Allowed Max:
55
01 : 08
00
96
No donations
Valid skip
Coverage:
FREQ
1,310
5,181
8,233
=======
14,724
WTD
2,042,469
8,485,231
13,855,508
==========
24,383,207
Givers who are employees and employed at work or absent from work
Special Surveys Division
109
2000 National Survey of Giving, Volunteering and Participating - User Guide
Financial Giving:
FG1DAD08
Position:
186
Length:
5
Derived variable: Amount of donations: Payroll deductions
00001 : 05000
00000
99996
Coverage:
FREQ
1,310
5,181
8,233
=======
14,724
None
Valid skip
WTD
2,042,469
8,485,231
13,855,508
==========
24,383,207
Givers who are employees and employed at work or absent from work
Financial Giving:
FG1_09
Position:
191
Length:
1
Is it possible to make charitable donations through payroll deductions at your place of work?
1
2
6
7
8
9
FREQ
1,898
3,341
8,707
647
47
84
=======
14,724
Yes
No
Valid skip
Don't know
Refusal
Not stated
Coverage:
WTD
3,000,944
6,617,482
13,432,808
1,059,874
129,866
142,233
==========
24,383,207
Respondents who answered FG1_08=2
Financial Giving:
FG1_10
Position:
192
Length:
1
(In the past 12 months,) have you made a charitable donation: ... by sponsoring someone in an event such as a
walk-a-thon? (Do not include any donations you have already mentioned.)
1
2
Yes
No
Coverage:
FREQ
7,097
7,627
=======
14,724
WTD
8,941,550
15,441,657
==========
24,383,207
All respondents
Special Surveys Division
110
2000 National Survey of Giving, Volunteering and Participating - User Guide
Financial Giving:
FG1DND10
Position:
193
Length:
2
Derived variable: Number of Donations: Sponsoring an event
Allowed Min:
00 Allowed Max:
55
01 : 12
00
96
FREQ
7,097
5,508
2,119
=======
14,724
No donations
Valid skip
Coverage:
WTD
8,941,551
10,094,129
5,347,528
==========
24,383,207
Givers
Financial Giving:
FG1DAD10
Position:
195
Length:
5
Derived variable: Amount of donations: Sponsoring an event
00001 : 01350
00000
99996
Coverage:
FREQ
7,097
5,508
2,119
=======
14,724
None
Valid skip
WTD
8,941,550
10,094,129
5,347,528
==========
24,383,207
Givers
Financial Giving:
FG1_11
Position:
200
Length:
1
In the past 12 months, have you made a charitable donation: ... that was 'in memoriam' or a donation in the name of
someone who has passed away? (Do not include any donations you have already mentioned.)
1
2
Yes
No
Coverage:
FREQ
3,935
10,789
=======
14,724
WTD
4,686,383
19,696,824
==========
24,383,207
All respondents
Special Surveys Division
111
2000 National Survey of Giving, Volunteering and Participating - User Guide
Financial Giving:
FG1DND11
Position:
201
Length:
2
Derived variable: Number of donations: In memoriam
Allowed Min:
01 Allowed Max:
55
01 : 09
00
96
FREQ
3,935
8,670
2,119
=======
14,724
No donations
Valid skip
Coverage:
WTD
4,686,383
14,349,297
5,347,528
==========
24,383,207
Givers
Financial Giving:
FG1DAD11
Position:
203
Length:
5
Derived variable: Amount of donations: In memoriam
00001 : 05000
00000
99996
Coverage:
FREQ
3,935
8,670
2,119
=======
14,724
None
Valid skip
WTD
4,686,383
14,349,297
5,347,528
==========
24,383,207
Givers
Financial Giving:
FG1_12
Position:
208
Length:
1
(In the past 12 months,) have you made a charitable donation: ... when asked by someone at work? (Do not include any
donations you have already mentioned.)
1
2
Yes
No
Coverage:
FREQ
2,283
12,441
=======
14,724
WTD
3,217,067
21,166,140
==========
24,383,207
All respondents
Special Surveys Division
112
2000 National Survey of Giving, Volunteering and Participating - User Guide
Financial Giving:
FG1DND12
Position:
209
Length:
2
Derived variable: Number of Donations: Asked by someone at work
Allowed Min:
00 Allowed Max:
55
01 : 05
00
96
FREQ
2,283
10,322
2,119
=======
14,724
No donations
Valid skip
Coverage:
WTD
3,217,067
15,818,612
5,347,528
==========
24,383,207
Givers
Financial Giving:
FG1DAD12
Position:
211
Length:
5
Derived variable: Amount of donations: Asked by someone at work
00001 : 01500
00000
99996
Coverage:
FREQ
2,283
10,322
2,119
=======
14,724
None
Valid skip
WTD
3,217,067
15,818,612
5,347,528
==========
24,383,207
Givers
Financial Giving:
FG1_13
Position:
216
Length:
1
(In the past 12 months, have you made a charitable donation:) ... when asked by someone doing door-to-door canvassing?
(Do not include any donations you have already mentioned.)
1
2
Yes
No
Coverage:
FREQ
5,851
8,873
=======
14,724
WTD
7,257,244
17,125,963
==========
24,383,207
All respondents
Special Surveys Division
113
2000 National Survey of Giving, Volunteering and Participating - User Guide
Financial Giving:
FG1DND13
Position:
217
Length:
2
Derived variable: Number of Donations: Door-to-door canvassing
Allowed Min:
01 Allowed Max:
55
01 : 11
00
96
FREQ
5,851
6,754
2,119
=======
14,724
No donations
Valid skip
Coverage:
WTD
7,257,244
11,778,435
5,347,528
==========
24,383,207
Givers
Financial Giving:
FG1DAD13
Position:
219
Length:
5
Derived variable: Amount of donations: Door-to-door canvassing
00001 : 03000
00000
99996
Coverage:
FREQ
5,851
6,754
2,119
=======
14,724
None
Valid skip
WTD
7,257,244
11,778,435
5,347,528
==========
24,383,207
Givers
Financial Giving:
FG1_14
Position:
224
Length:
1
(In the past 12 months, have you made a charitable donation:) ... when asked by someone canvassing for a charitable
organization at a shopping centre, on a street or street corner? (Do not include any donations you have already mentioned.)
1
2
Yes
No
Coverage:
FREQ
3,391
11,333
=======
14,724
WTD
5,144,845
19,238,362
==========
24,383,207
All respondents
Special Surveys Division
114
2000 National Survey of Giving, Volunteering and Participating - User Guide
Financial Giving:
FG1DND14
Position:
225
Length:
2
Derived variable: Number of Donations: Canvassing at shopping centre or street
Allowed Min:
00 Allowed Max:
55
01 : 09
00
96
FREQ
3,391
9,214
2,119
=======
14,724
No donations
Valid skip
Coverage:
WTD
5,144,845
13,890,834
5,347,528
==========
24,383,207
Givers
Financial Giving:
FG1DAD14
Position:
227
Length:
5
Derived variable: Amount of donations: Canvassing at shopping centre or street
00001 : 00650
00000
99996
Coverage:
FREQ
3,391
9,214
2,119
=======
14,724
None
Valid skip
WTD
5,144,845
13,890,834
5,347,528
==========
24,383,207
Givers
Financial Giving:
FG1_15
Position:
232
Length:
1
In the past 12 months, have you made a charitable donation: ... by responding to a telephone request? (Do not include any
donations you have already mentioned.)
1
2
Yes
No
Coverage:
FREQ
1,382
13,342
=======
14,724
WTD
1,793,014
22,590,193
==========
24,383,207
All respondents
Special Surveys Division
115
2000 National Survey of Giving, Volunteering and Participating - User Guide
Financial Giving:
FG1DND15
Position:
233
Length:
2
Derived variable: Number of Donations: Telephone Request
Allowed Min:
01 Allowed Max:
55
01 : 11
00
96
FREQ
1,382
11,223
2,119
=======
14,724
No donations
Valid skip
Coverage:
WTD
1,793,014
17,242,665
5,347,528
==========
24,383,207
Givers
Financial Giving:
FG1DAD15
Position:
235
Length:
5
Derived variable: Amount of donations: Telephone Request
00001 : 01500
00000
99996
Coverage:
FREQ
1,382
11,223
2,119
=======
14,724
None
Valid skip
WTD
1,793,014
17,242,665
5,347,528
==========
24,383,207
Givers
Financial Giving:
FG1_16
Position:
240
Length:
1
(In the past 12 months, have you made a charitable donation:) ... through a collection at a church, synagogue, mosque or
other place of worship? (Do not include any donations you have already mentioned.)
1
2
Yes
No
Coverage:
FREQ
5,623
9,101
=======
14,724
WTD
7,389,077
16,994,130
==========
24,383,207
All respondents
Special Surveys Division
116
2000 National Survey of Giving, Volunteering and Participating - User Guide
Financial Giving:
FG1DND16
Position:
241
Length:
2
Derived variable: Number of Donations: Place of worship
Allowed Min:
00 Allowed Max:
55
01 : 07
00
96
FREQ
5,623
6,982
2,119
=======
14,724
No donations
Valid skip
Coverage:
WTD
7,389,077
11,646,602
5,347,528
==========
24,383,207
Givers
Financial Giving:
FG1DAD16
Position:
243
Length:
5
Derived variable: Amount of donations: Place of worship
00001 : 13000
00000
99996
Coverage:
FREQ
5,623
6,982
2,119
=======
14,724
None
Valid skip
WTD
7,389,077
11,646,602
5,347,528
==========
24,383,207
Givers
Financial Giving:
FG1_17
Position:
248
Length:
1
(In the past 12 months, have you made a charitable donation:) ... by responding to a television or radio request or a
telethon? (Do not include any donations you have already mentioned.)
1
2
Yes
No
Coverage:
FREQ
1,210
13,514
=======
14,724
WTD
1,550,817
22,832,390
==========
24,383,207
All respondents
Special Surveys Division
117
2000 National Survey of Giving, Volunteering and Participating - User Guide
Financial Giving:
FG1DND17
Position:
249
Length:
2
Derived variable: Number of Donations: TV, Radio Request, Telethon
Allowed Min:
01 Allowed Max:
55
01 : 03
00
96
FREQ
1,210
11,395
2,119
=======
14,724
No donations
Valid skip
Coverage:
WTD
1,550,817
17,484,862
5,347,528
==========
24,383,207
Givers
Financial Giving:
FG1DAD17
Position:
251
Length:
5
Derived variable: Amount of donations: TV, Radio Request, Telethon
00001 : 02500
00000
99996
Coverage:
FREQ
1,210
11,395
2,119
=======
14,724
None
Valid skip
WTD
1,550,817
17,484,862
5,347,528
==========
24,383,207
Givers
Financial Giving:
FG1_18
Position:
256
Length:
1
(In the past 12 months have you made a charitable donation:) ... by approaching a non-profit or charitable organization on
your own? (Do not include any donations you have already mentioned.)
1
2
Yes
No
Coverage:
FREQ
907
13,817
=======
14,724
WTD
1,246,035
23,137,172
==========
24,383,207
All respondents
Special Surveys Division
118
2000 National Survey of Giving, Volunteering and Participating - User Guide
Financial Giving:
FG1DND18
Position:
257
Length:
2
Derived variable: Number of Donations: Approach organization on own
Allowed Min:
00 Allowed Max:
55
01 : 14
00
96
FREQ
907
11,698
2,119
=======
14,724
No donations
Valid skip
Coverage:
WTD
1,246,035
17,789,644
5,347,528
==========
24,383,207
Givers
Financial Giving:
FG1DAD18
Position:
259
Length:
5
Derived variable: Amount of Donations: Approach organization on own
00001 : 10150
00000
99996
Coverage:
FREQ
907
11,698
2,119
=======
14,724
None
Valid skip
WTD
1,246,035
17,789,644
5,347,528
==========
24,383,207
Givers
Financial Giving:
FG1_19
Position:
264
Length:
1
(In the past 12 months have you made a charitable donation:) ... by donating any stocks or stock options to a charitable or
non-profit organization? (Do not include any donations you have already mentioned.)
1
2
Yes
No
Coverage:
FREQ
29
14,695
=======
14,724
WTD
29,856
24,353,351
==========
24,383,207
All respondents
Special Surveys Division
119
2000 National Survey of Giving, Volunteering and Participating - User Guide
Financial Giving:
FG1DND19
Position:
265
Length:
2
Derived variable: Number of Donations: Stocks or stock options
Allowed Min:
01 Allowed Max:
55
01 : 01
00
96
FREQ
29
12,576
2,119
=======
14,724
No donations
Valid skip
Coverage:
WTD
29,856
19,005,823
5,347,528
==========
24,383,207
Givers
Financial Giving:
FG1DAD19
Position:
267
Length:
5
Derived variable: Amount of Donations: Stocks or stock options
00001 : 10000
00000
99996
Coverage:
FREQ
29
12,576
2,119
=======
14,724
None
Valid skip
WTD
29,856
19,005,823
5,347,528
==========
24,383,207
Givers
Financial Giving:
FG1_20
Position:
272
Length:
1
(In the past 12 months have you made a charitable donation:) ... through the internet? (Do not include any donations you
have already mentioned.)
1
2
Yes
No
Coverage:
FREQ
30
14,694
=======
14,724
WTD
42,713
24,340,494
==========
24,383,207
All respondents
Special Surveys Division
120
2000 National Survey of Giving, Volunteering and Participating - User Guide
Financial Giving:
FG1DND20
Position:
273
Length:
2
Derived variable: Number of Donations: Through the internet
Allowed Min:
00 Allowed Max:
55
01 : 01
00
96
FREQ
30
12,575
2,119
=======
14,724
No donations
Valid skip
Coverage:
WTD
42,713
18,992,966
5,347,528
==========
24,383,207
Givers
Financial Giving:
FG1DAD20
Position:
275
Length:
5
Derived variable: Amount of Donations: Through the internet
00001 : 00250
00000
99996
Coverage:
FREQ
30
12,575
2,119
=======
14,724
None
Valid skip
WTD
42,713
18,992,966
5,347,528
==========
24,383,207
Givers
Financial Giving:
FG1_21
Position:
280
Length:
1
In the past 12 months, are there any other methods in which you may have given money to a charitable or non-profit
organization? Do not include any donations you have already mentioned.
1
2
Yes
No
Coverage:
FREQ
630
14,094
=======
14,724
WTD
903,528
23,479,679
==========
24,383,207
All respondents
Special Surveys Division
121
2000 National Survey of Giving, Volunteering and Participating - User Guide
Financial Giving:
FG1DND21
Position:
281
Length:
2
Derived variable: Number of Donations: Other Solicitation Method
Allowed Min:
00 Allowed Max:
55
01 : 06
00
96
FREQ
630
11,975
2,119
=======
14,724
No donations
Valid skip
Coverage:
WTD
903,528
18,132,151
5,347,528
==========
24,383,207
Givers
Financial Giving:
FG1DAD21
Position:
283
Length:
5
Derived variable: Amount of Donations: Other Solicitation Method
00001 : 15500
00000
99996
Coverage:
FREQ
630
11,975
2,119
=======
14,724
None
Valid skip
WTD
903,528
18,132,151
5,347,528
==========
24,383,207
Givers
Financial Giving:
FG1FGIV
Position:
288
Length:
1
Giver Flag
1
2
Giver
Non-giver
FREQ
12,605
2,119
=======
14,724
WTD
19,035,679
5,347,528
==========
24,383,207
Coverage:
All respondents
Note: Answered at least one "Yes" in FG1_06 to FG1_08, FG1_10 to FG1_21
Special Surveys Division
122
2000 National Survey of Giving, Volunteering and Participating - User Guide
Giving Specifics:
GS1DNTOT
Position:
289
Length:
5
Derived variable: Total Number of donations
00001 : 00059
99996
Coverage:
FREQ
12,605
2,119
=======
14,724
Valid skip
WTD
19,035,679
5,347,528
==========
24,383,207
Givers
Giving Specifics:
GS1DATOT
Position:
294
Length:
5
Derived variable: Total amount of donations
00001 : 33485
99996
Coverage:
FREQ
12,605
2,119
=======
14,724
Valid skip
WTD
19,035,679
5,347,528
==========
24,383,207
Givers
Giving Specifics:
GS1DND01
Position:
299
Length:
2
Derived variable: Number of donations: Culture and Recreation
01 : 08
00
96
FREQ
2,717
9,888
2,119
=======
14,724
No donations
Valid skip
Coverage:
WTD
3,181,739
15,853,941
5,347,528
==========
24,383,207
Givers
Giving Specifics:
GS1DAD01
Position:
301
Length:
5
Derived variable: Amount of donations: Culture and Recreation
00001 : 02325
00000
99996
Coverage:
None
Valid skip
FREQ
2,717
9,888
2,119
=======
14,724
WTD
3,181,739
15,853,941
5,347,528
==========
24,383,207
Givers
Special Surveys Division
123
2000 National Survey of Giving, Volunteering and Participating - User Guide
Giving Specifics:
GS1DND02
Position:
306
Length:
2
Derived variable: Number of donations: Education and Research
01 : 12
00
96
FREQ
3,402
9,203
2,119
=======
14,724
No donations
Valid skip
Coverage:
WTD
4,549,460
14,486,219
5,347,528
==========
24,383,207
Givers
Giving Specifics:
GS1DAD02
Position:
308
Length:
5
Derived variable: Amount of donations: Education and Research
00001 : 02505
00000
99996
Coverage:
FREQ
3,402
9,203
2,119
=======
14,724
None
Valid skip
WTD
4,549,460
14,486,219
5,347,528
==========
24,383,207
Givers
Giving Specifics:
GS1DND03
Position:
313
Length:
2
Derived variable: Number of donations: Health
01 : 31
00
96
No donations
Valid skip
Coverage:
FREQ
9,607
2,998
2,119
=======
14,724
WTD
13,105,863
5,929,816
5,347,528
==========
24,383,207
Givers
Special Surveys Division
124
2000 National Survey of Giving, Volunteering and Participating - User Guide
Giving Specifics:
GS1DAD03
Position:
315
Length:
5
Derived variable: Amount of donations: Health
00001 : 10000
00000
99996
Coverage:
FREQ
9,607
2,998
2,119
=======
14,724
None
Valid skip
WTD
13,105,863
5,929,816
5,347,528
==========
24,383,207
Givers
Giving Specifics:
GS1DND04
Position:
320
Length:
2
Derived variable: Number of donations: Social Services
01 : 14
00
96
FREQ
6,526
6,079
2,119
=======
14,724
No donations
Valid skip
Coverage:
WTD
9,164,492
9,871,187
5,347,528
==========
24,383,207
Givers
Giving Specifics:
GS1DAD04
Position:
322
Length:
5
Derived variable: Amount of donations: Social Services
00001 : 05600
00000
99996
Coverage:
None
Valid skip
FREQ
6,526
6,079
2,119
=======
14,724
WTD
9,164,492
9,871,187
5,347,528
==========
24,383,207
Givers
Special Surveys Division
125
2000 National Survey of Giving, Volunteering and Participating - User Guide
Giving Specifics:
GS1DND05
Position:
327
Length:
2
Derived variable: Number of donations: Environment
01 : 11
00
96
FREQ
928
11,677
2,119
=======
14,724
No donations
Valid skip
Coverage:
WTD
1,228,772
17,806,907
5,347,528
==========
24,383,207
Givers
Giving Specifics:
GS1DAD05
Position:
329
Length:
5
Derived variable: Amount of donations: Environment
00001 : 07400
00000
99996
Coverage:
FREQ
928
11,677
2,119
=======
14,724
None
Valid skip
WTD
1,228,772
17,806,907
5,347,528
==========
24,383,207
Givers
Giving Specifics:
GS1DND06
Position:
334
Length:
2
Derived variable: Number of donations: Development and Housing
01 : 03
00
96
No donations
Valid skip
Coverage:
FREQ
276
12,329
2,119
=======
14,724
WTD
296,347
18,739,332
5,347,528
==========
24,383,207
Givers
Special Surveys Division
126
2000 National Survey of Giving, Volunteering and Participating - User Guide
Giving Specifics:
GS1DAD06
Position:
336
Length:
5
Derived variable: Amount of donations: Development and Housing
00001 : 02785
00000
99996
Coverage:
FREQ
276
12,329
2,119
=======
14,724
None
Valid skip
WTD
296,347
18,739,332
5,347,528
==========
24,383,207
Givers
Giving Specifics:
GS1DND07
Position:
341
Length:
2
Derived variable: Number of donations: Law, Advocacy and Politics
01 : 05
00
96
FREQ
806
11,799
2,119
=======
14,724
No donations
Valid skip
Coverage:
WTD
977,966
18,057,713
5,347,528
==========
24,383,207
Givers
Giving Specifics:
GS1DAD07
Position:
343
Length:
5
Derived variable: Amount of donations: Law, Advocacy and Politics
00001 : 06300
00000
99996
Coverage:
None
Valid skip
FREQ
806
11,799
2,119
=======
14,724
WTD
977,966
18,057,713
5,347,528
==========
24,383,207
Givers
Special Surveys Division
127
2000 National Survey of Giving, Volunteering and Participating - User Guide
Giving Specifics:
GS1DND08
Position:
348
Length:
2
Derived variable: Number of donations: Philanthropic Intermediaries and Voluntarism Promotion
01 : 03
00
96
FREQ
2,222
10,383
2,119
=======
14,724
No donations
Valid skip
Coverage:
WTD
3,471,682
15,563,997
5,347,528
==========
24,383,207
Givers
Giving Specifics:
GS1DAD08
Position:
350
Length:
5
Derived variable: Amount of donations: Philanthropic Intermediaries and Voluntarism Promotion
00001 : 10000
00000
99996
Coverage:
FREQ
2,222
10,383
2,119
=======
14,724
None
Valid skip
WTD
3,471,682
15,563,997
5,347,528
==========
24,383,207
Givers
Giving Specifics:
GS1DND09
Position:
355
Length:
2
Derived variable: Number of donations: International
01 : 07
00
96
No donations
Valid skip
Coverage:
FREQ
919
11,686
2,119
=======
14,724
WTD
1,207,776
17,827,903
5,347,528
==========
24,383,207
Givers
Special Surveys Division
128
2000 National Survey of Giving, Volunteering and Participating - User Guide
Giving Specifics:
GS1DAD09
Position:
357
Length:
5
Derived variable: Amount of donations: International
00001 : 04000
00000
99996
Coverage:
FREQ
919
11,686
2,119
=======
14,724
None
Valid skip
WTD
1,207,776
17,827,903
5,347,528
==========
24,383,207
Givers
Giving Specifics:
GS1DND10
Position:
362
Length:
2
Derived variable: Number of donations: Religion
01 : 10
00
96
FREQ
5,978
6,627
2,119
=======
14,724
No donations
Valid skip
Coverage:
WTD
7,806,233
11,229,446
5,347,528
==========
24,383,207
Givers
Giving Specifics:
GS1DAD10
Position:
364
Length:
5
Derived variable: Amount of donations: Religion
00001 : 13000
00000
99996
Coverage:
None
Valid skip
FREQ
5,978
6,627
2,119
=======
14,724
WTD
7,806,233
11,229,446
5,347,528
==========
24,383,207
Givers
Special Surveys Division
129
2000 National Survey of Giving, Volunteering and Participating - User Guide
Giving Specifics:
GS1DND11
Position:
369
Length:
2
Derived variable: Number of donations: Business and Professional Associations and Unions
01 : 02
00
96
FREQ
42
12,563
2,119
=======
14,724
No donations
Valid skip
Coverage:
WTD
73,287
18,962,392
5,347,528
==========
24,383,207
Givers
Giving Specifics:
GS1DAD11
Position:
371
Length:
5
Derived variable: Amount of donations: Business and Professional Associations and Unions
00005 : 05000
00000
99996
Coverage:
FREQ
42
12,563
2,119
=======
14,724
None
Valid skip
WTD
73,287
18,962,392
5,347,528
==========
24,383,207
Givers
Giving Specifics:
GS1DND12
Position:
376
Length:
2
Derived variable: Number of donations: Not Elsewhere Classified
01 : 03
00
96
No donations
Valid skip
Coverage:
FREQ
377
12,228
2,119
=======
14,724
WTD
497,908
18,537,771
5,347,528
==========
24,383,207
Givers
Special Surveys Division
130
2000 National Survey of Giving, Volunteering and Participating - User Guide
Giving Specifics:
GS1DAD12
Position:
378
Length:
5
Derived variable: Amount of donations: Not Elsewhere Classified
00001 : 03930
00000
99996
Coverage:
FREQ
377
12,228
2,119
=======
14,724
None
Valid skip
WTD
497,908
18,537,771
5,347,528
==========
24,383,207
Givers
Financial Giving con'd:
FG1_22
Position:
383
Length:
1
Will you or someone else in your household be claiming a tax credit for charitable contributions?
1
2
6
7
8
9
FREQ
6,377
5,844
2,119
273
27
84
=======
14,724
Yes
No
Valid skip
Don't know
Refusal
Not stated
Coverage:
WTD
8,366,738
10,042,573
5,347,528
448,462
43,413
134,493
==========
24,383,207
Givers
Financial Giving con'd:
FG1_23
Position:
384
Length:
1
Would you contribute more if the government gave you a better tax credit for your donations?
1
2
6
7
8
9
Yes
No
Valid skip
Don't know
Refusal
Not stated
Coverage:
FREQ
6,006
5,878
2,119
596
35
90
=======
14,724
WTD
8,848,001
9,077,279
5,347,528
895,870
63,505
151,024
==========
24,383,207
Givers
Special Surveys Division
131
2000 National Survey of Giving, Volunteering and Participating - User Guide
Financial Giving con'd:
FG1_24
Position:
385
Length:
1
Do you decide in advance the total amount of money you will donate to charitable organizations annually?
1
2
6
7
8
9
FREQ
2,483
9,941
2,119
54
33
94
=======
14,724
Yes
No
Valid skip
Don't know
Refusal
Not stated
Coverage:
WTD
3,366,185
15,375,170
5,347,528
74,262
60,885
159,176
==========
24,383,207
Givers
Financial Giving con'd:
FG1_25
Position:
386
Length:
1
For the majority of the money that you donate, do you decide in advance about which organizations you will give to or do
you make decisions in response to someone asking you for a donation?
1
2
3
6
7
8
9
FREQ
3,325
7,158
1,913
2,119
72
39
98
=======
14,724
Decide in advance
Respond to someone asking
Both
Valid skip
Don't know
Refusal
Not stated
Coverage:
WTD
4,653,784
11,352,423
2,655,625
5,347,528
125,694
79,660
168,494
==========
24,383,207
Givers
Financial Giving con'd:
FG1_26
Position:
387
Length:
1
Do you have a certain number of charities or non-profit organizations that you donate to regularly or do you vary the
organizations to which you donate?
1
2
6
7
8
9
Donate to certain organizations regularly
Vary the organizations
Valid skip
Don't know
Refusal
Not stated
Coverage:
FREQ
5,510
6,821
2,119
122
41
111
=======
14,724
WTD
7,558,326
10,932,157
5,347,528
253,383
95,359
196,455
==========
24,383,207
Givers
Special Surveys Division
132
2000 National Survey of Giving, Volunteering and Participating - User Guide
Reasons for Giving:
RG1_02
Position:
388
Length:
1
The reason that you make charitable donations is: ... because the government will give you a credit on your income taxes.
1
2
6
7
8
9
FREQ
1,631
10,747
2,119
56
29
142
=======
14,724
Agree
Disagree
Valid skip
Don't know
Refusal
Not stated
Coverage:
WTD
2,402,673
16,212,950
5,347,528
107,007
71,716
241,333
==========
24,383,207
Givers
Reasons for Giving:
RG1_03
Position:
389
Length:
1
... because you feel compassion towards people in need.
1
2
6
7
8
9
FREQ
11,836
568
2,119
29
28
144
=======
14,724
Agree
Disagree
Valid skip
Don't know
Refusal
Not stated
Coverage:
WTD
17,578,042
1,093,997
5,347,528
60,298
60,230
243,113
==========
24,383,207
Givers
Reasons for Giving:
RG1_04
Position:
390
Length:
1
... to fulfill religious obligations or beliefs.
1
2
6
7
8
9
Agree
Disagree
Valid skip
Don't know
Refusal
Not stated
Coverage:
FREQ
4,290
8,101
2,119
37
30
147
=======
14,724
WTD
5,748,311
12,915,345
5,347,528
61,094
64,831
246,098
==========
24,383,207
Givers
Special Surveys Division
133
2000 National Survey of Giving, Volunteering and Participating - User Guide
Reasons for Giving:
RG1_05
Position:
391
Length:
1
... to help a cause in which you personally believe.
1
2
6
7
8
9
FREQ
11,561
829
2,119
37
28
150
=======
14,724
Agree
Disagree
Valid skip
Don't know
Refusal
Not stated
Coverage:
WTD
16,875,929
1,753,490
5,347,528
80,384
59,964
265,912
==========
24,383,207
Givers
Reasons for Giving:
RG1_06
Position:
392
Length:
1
The reason that you make charitable donations is: ... because you feel you owe something to your community.
1
2
6
7
8
9
FREQ
7,763
4,598
2,119
62
30
152
=======
14,724
Agree
Disagree
Valid skip
Don't know
Refusal
Not stated
Coverage:
WTD
10,864,671
7,729,577
5,347,528
106,662
66,860
267,909
==========
24,383,207
Givers
Reasons for Giving:
RG1_07
Position:
393
Length:
1
... because you or someone you know has been personally affected by the cause the organization supports.
1
2
6
7
8
9
Agree
Disagree
Valid skip
Don't know
Refusal
Not stated
Coverage:
FREQ
9,282
3,096
2,119
46
29
152
=======
14,724
WTD
12,803,096
5,839,069
5,347,528
60,764
64,840
267,909
==========
24,383,207
Givers
Special Surveys Division
134
2000 National Survey of Giving, Volunteering and Participating - User Guide
Reasons for not Giving: NG1_02
Position:
394
Length:
1
The reason that you do not donate (more) is: ... because it is hard to find a cause worth supporting.
1
2
7
8
9
FREQ
1,801
12,550
88
53
232
=======
14,724
Agree
Disagree
Don't know
Refusal
Not stated
Coverage:
WTD
3,775,062
19,807,172
186,706
109,854
504,413
==========
24,383,207
All respondents
Reasons for not Giving: NG1_03
Position:
395
Length:
1
... because you want to save your money for your own future needs.
1
2
7
8
9
FREQ
7,042
7,321
67
55
239
=======
14,724
Agree
Disagree
Don't know
Refusal
Not stated
Coverage:
WTD
12,365,102
11,269,583
106,724
112,246
529,552
==========
24,383,207
All respondents
Reasons for not Giving: NG1_04
Position:
396
Length:
1
... because you do not know where to make a contribution.
1
2
7
8
9
Agree
Disagree
Don't know
Refusal
Not stated
Coverage:
FREQ
1,185
13,190
51
55
243
=======
14,724
WTD
2,502,734
21,151,544
72,588
123,946
532,395
==========
24,383,207
All respondents
Special Surveys Division
135
2000 National Survey of Giving, Volunteering and Participating - User Guide
Reasons for not Giving: NG1_05
Position:
397
Length:
1
... because you think the money will not be used efficiently.
1
2
7
8
9
FREQ
6,011
8,266
138
61
248
=======
14,724
Agree
Disagree
Don't know
Refusal
Not stated
Coverage:
WTD
10,323,933
13,135,334
250,499
119,557
553,884
==========
24,383,207
All respondents
Reasons for not Giving: NG1_06
Position:
398
Length:
1
The reason that you do not donate (more) is: ... because you would prefer to spend your money in other ways.
1
2
7
8
9
FREQ
6,435
7,867
107
63
252
=======
14,724
Agree
Disagree
Don't know
Refusal
Not stated
Coverage:
WTD
11,279,366
12,290,067
135,819
119,533
558,422
==========
24,383,207
All respondents
Reasons for not Giving: NG1_07
Position:
399
Length:
1
... because you give voluntary time instead of giving money.
1
2
7
8
9
Agree
Disagree
Don't know
Refusal
Not stated
Coverage:
FREQ
4,658
9,652
99
62
253
=======
14,724
WTD
6,074,775
17,478,040
140,776
134,964
554,653
==========
24,383,207
All respondents
Special Surveys Division
136
2000 National Survey of Giving, Volunteering and Participating - User Guide
Reasons for not Giving: NG1_08
Position:
400
Length:
1
... because you feel that you already give enough money directly to people on your own, not through an organization.
1
2
7
8
9
FREQ
4,687
9,571
140
67
259
=======
14,724
Agree
Disagree
Don't know
Refusal
Not stated
Coverage:
WTD
7,944,898
15,528,124
211,498
130,435
568,251
==========
24,383,207
All respondents
Reasons for not Giving: NG1_09
Position:
401
Length:
1
... because you do not like the way in which requests are made for contributions.
1
2
7
8
9
FREQ
6,523
7,765
111
62
263
=======
14,724
Agree
Disagree
Don't know
Refusal
Not stated
Coverage:
WTD
10,224,963
13,275,300
171,075
138,851
573,019
==========
24,383,207
All respondents
Reasons for not Giving: NG1_10
Position:
402
Length:
1
In general, do you think that the money used by charities on administrative and fundraising costs is ...?
1
2
3
7
8
9
About right
Too much
Could be higher
Don't know
Refusal
Not stated
Coverage:
FREQ
5,959
5,150
1,166
1,975
191
283
=======
14,724
WTD
9,761,203
8,371,154
2,055,138
3,158,138
406,289
631,285
==========
24,383,207
All respondents
Special Surveys Division
137
2000 National Survey of Giving, Volunteering and Participating - User Guide
Other Giving:
OG1_01
Position:
403
Length:
1
Now I have a few questions about other ways of making charitable contributions. In the past 12 months, did you buy any
charity-sponsored raffle or lottery tickets? (Do not include government sponsored lotteries such as Lotto 649).
1
2
7
8
9
FREQ
7,161
7,110
78
70
305
=======
14,724
Yes
No
Don't know
Refusal
Not stated
Coverage:
Other Giving:
WTD
10,134,193
13,287,081
138,634
153,766
669,533
==========
24,383,207
All respondents
OG1D02
Position:
404
Length:
4
Derived variable: Amount of donation for OG_Q02 - adjusted for joint giving.
Allowed Min:
0001
Allowed Max:
2400
0001 : 2400
9996
9999
Coverage:
Other Giving:
FREQ
6,488
7,110
1,126
=======
14,724
Valid skip
Not stated
WTD
9,314,628
13,287,081
1,781,498
==========
24,383,207
Respondents who answered OG1_01=1
OG1_03
Position:
408
Length:
1
Was this money spent by you personally or jointly by you and your spouse or partner?
1
2
6
7
8
9
Personally
Jointly
Valid skip
Don't know
Refusal
Not stated
Coverage:
FREQ
1,348
2,005
11,133
10
1
227
=======
14,724
WTD
2,125,579
2,830,617
18,917,563
8,159
2,538
498,751
==========
24,383,207
Respondents who answered OG1_01=1 and (FG1_02=2 or 3)
Special Surveys Division
138
2000 National Survey of Giving, Volunteering and Participating - User Guide
Other Giving:
OG1_04
Position:
409
Length:
1
(In the past 12 months,) did you attend a charity-sponsored bingo or casino? (Do not include any donations you have
already mentioned.)
1
2
7
8
9
FREQ
1,265
13,038
36
75
310
=======
14,724
Yes
No
Don't know
Refusal
Not stated
Coverage:
Other Giving:
WTD
1,749,462
21,738,142
50,743
169,210
675,649
==========
24,383,207
All respondents
OG1D05
Position:
410
Length:
4
Derived variable: Amount of donation for OG_Q05 - adjusted for joint giving.
Allowed Min:
0001
Allowed Max:
8000
0001 : 8000
9996
9999
Coverage:
Other Giving:
FREQ
1,096
13,038
590
=======
14,724
Valid skip
Not stated
WTD
1,578,928
21,738,142
1,066,137
==========
24,383,207
Respondents who answered OG1_04=1
OG1_06
Position:
414
Length:
1
Was this money spent by you personally or jointly by you and your spouse or partner?
1
2
6
7
9
Personally
Jointly
Valid skip
Don't know
Not stated
Coverage:
FREQ
302
259
13,965
4
194
=======
14,724
WTD
466,263
373,103
23,104,725
4,209
434,907
==========
24,383,207
Respondents who answered OG1_04=1 and (FG1_02=2 or 3)
Special Surveys Division
139
2000 National Survey of Giving, Volunteering and Participating - User Guide
Other Giving:
OG1_07
Position:
415
Length:
1
In the past 12 months, have you bought goods such as chocolate bars, apples, poppies, flowers, or coupon books, where
the proceeds go to a charitable or non-profit organization? (Do not include any purchases you have already mentioned.)
1
2
7
8
9
FREQ
10,883
3,418
42
70
311
=======
14,724
Yes
No
Don't know
Refusal
Not stated
Coverage:
Other Giving:
WTD
16,421,946
7,099,018
48,259
137,630
676,354
==========
24,383,207
All respondents
OG1_08
Position:
416
Length:
4
How much have you spent on these purchases? (Do not include any purchases you have already mentioned.)
Allowed Min:
0001
Allowed Max:
2000
0001 : 1500
9996
9997
9998
9999
Coverage:
Other Giving:
FREQ
9,829
3,418
919
135
423
=======
14,724
Valid skip
Don't know
Refusal
Not stated
WTD
15,075,465
7,099,018
1,142,401
204,080
862,244
==========
24,383,207
Respondents who answered OG1_07=1
OG1_09
Position:
420
Length:
1
(In the past 12 months,) did you make any contributions at a box located beside a cash register at a store check-out? (Do
not include any donations you have already mentioned.)
1
2
7
8
9
Yes
No
Don't know
Refusal
Not stated
Coverage:
FREQ
6,464
7,823
51
70
316
=======
14,724
WTD
9,652,161
13,834,640
67,219
140,870
688,318
==========
24,383,207
All respondents
Special Surveys Division
140
2000 National Survey of Giving, Volunteering and Participating - User Guide
Other Giving:
OG1_10
Position:
421
Length:
4
How much did you donate in this way in the past 12 months? (Do not include any donations you have already mentioned.)
Allowed Min:
0001
Allowed Max:
1000
0001 : 0520
9996
9997
9998
9999
Coverage:
Other Giving:
FREQ
5,243
7,823
1,109
112
437
=======
14,724
Valid skip
Don't know
Refusal
Not stated
WTD
7,999,665
13,834,640
1,496,266
156,229
896,407
==========
24,383,207
Respondents who answered OG1_09=1
OG1_11
Position:
425
Length:
1
Have you ever included, as part of your will, a donation to a charitable, religious or spiritual organization?
1
2
7
8
9
FREQ
806
13,444
48
102
324
=======
14,724
Yes
No
Don't know
Refusal
Not stated
Coverage:
Other Giving:
WTD
946,809
22,459,737
65,795
204,152
706,714
==========
24,383,207
All respondents
OG1_12
Position:
426
Length:
1
In the past 12 months, did you contribute any food to a charitable organization such as a food bank?
1
2
7
8
9
Yes
No
Don't know
Refusal
Not stated
Coverage:
FREQ
8,650
5,646
34
67
327
=======
14,724
WTD
12,753,957
10,739,643
50,220
131,376
708,010
==========
24,383,207
All respondents
Special Surveys Division
141
2000 National Survey of Giving, Volunteering and Participating - User Guide
Other Giving:
OG1_13
Position:
427
Length:
1
(In the past 12 months,) did you donate any clothing or household goods to a charitable or non-profit organization such as
Neighbourhood Services, the Salvation Army or St. Vincent de Paul?
1
2
7
8
9
FREQ
10,424
3,877
28
66
329
=======
14,724
Yes
No
Don't know
Refusal
Not stated
Coverage:
Other Giving:
WTD
16,338,676
7,172,412
31,414
130,904
709,802
==========
24,383,207
All respondents
OG1_14
Position:
428
Length:
1
(In the past 12 months,) did you give any money excluding loans, to the homeless or street people?
1
2
7
8
9
FREQ
2,474
11,822
29
68
331
=======
14,724
Yes
No
Don't know
Refusal
Not stated
Coverage:
Other Giving:
WTD
4,504,717
18,999,852
33,961
133,411
711,266
==========
24,383,207
All respondents
OG1_15
Position:
429
Length:
1
(In the past 12 months,) did you give any money excluding loans, to relatives, including children and parents who don't live
with you?
1
2
7
8
9
Yes
No
Don't know
Refusal
Not stated
Coverage:
FREQ
4,462
9,793
43
94
332
=======
14,724
WTD
6,510,910
16,909,940
66,341
181,781
714,236
==========
24,383,207
All respondents
Special Surveys Division
142
2000 National Survey of Giving, Volunteering and Participating - User Guide
Other Giving:
OG1_16
Position:
430
Length:
1
In the past 12 months, did you give any money to other individuals not already mentioned?
1
2
7
8
9
FREQ
1,239
13,034
42
76
333
=======
14,724
Yes
No
Don't know
Refusal
Not stated
Coverage:
Participating:
WTD
1,849,991
21,624,348
45,579
143,977
719,312
==========
24,383,207
All respondents
PA1_02
Position:
431
Length:
1
How frequently do you socialize: ... with parents or other relatives?
1
2
3
4
7
8
9
FREQ
7,762
3,417
2,475
509
62
101
398
=======
14,724
Every week
A few times a month
A few times a year
Not at all
Don't know
Refusal
Not stated
Coverage:
Participating:
WTD
11,839,929
6,092,632
4,267,418
1,076,572
82,835
185,528
838,293
==========
24,383,207
All respondents
PA1_03
Position:
432
Length:
1
... with friends who live outside the neighbourhood?
1
2
3
4
7
8
9
Every week
A few times a month
A few times a year
Not at all
Don't know
Refusal
Not stated
Coverage:
FREQ
4,984
5,077
3,048
1,043
69
100
403
=======
14,724
WTD
7,707,191
8,537,295
4,905,117
2,097,407
98,956
184,885
852,355
==========
24,383,207
All respondents
Special Surveys Division
143
2000 National Survey of Giving, Volunteering and Participating - User Guide
Participating:
PA1_04
Position:
433
Length:
1
How frequently do you spend time: ... with friends participating in sports or recreation activities?
1
2
3
4
7
8
9
FREQ
4,460
2,907
2,494
4,290
68
100
405
=======
14,724
Every week
A few times a month
A few times a year
Not at all
Don't know
Refusal
Not stated
Coverage:
Participating:
WTD
6,478,373
4,920,640
4,244,256
7,604,348
94,542
185,870
855,178
==========
24,383,207
All respondents
PA1_05
Position:
434
Length:
1
... watching family members participate in sports or recreation activities?
1
2
3
4
7
8
9
FREQ
2,727
2,375
3,097
5,941
71
107
406
=======
14,724
Every week
A few times a month
A few times a year
Not at all
Don't know
Refusal
Not stated
Coverage:
Participating:
WTD
3,972,433
3,750,382
4,901,524
10,587,662
94,674
217,409
859,123
==========
24,383,207
All respondents
PA1_07
Position:
435
Length:
1
Are you a member or participant in: ... a service club or fraternal association, such as the Kiwanis, Knights of Columbus,
Shriners or the Legion?
1
2
7
8
9
Yes
No
Don't know
Refusal
Not stated
Coverage:
FREQ
1,574
12,599
37
98
416
=======
14,724
WTD
1,773,625
21,474,012
63,518
189,069
882,983
==========
24,383,207
All respondents
Special Surveys Division
144
2000 National Survey of Giving, Volunteering and Participating - User Guide
Participating:
PA1_08
Position:
436
Length:
1
... a work-related organization such as a union or professional association?
1
2
7
8
9
FREQ
3,296
10,868
42
101
417
=======
14,724
Yes
No
Don't know
Refusal
Not stated
Coverage:
Participating:
WTD
4,776,304
18,445,072
71,653
206,974
883,204
==========
24,383,207
All respondents
PA1_09
Position:
437
Length:
1
... a political organization?
1
2
7
8
9
FREQ
694
13,472
36
105
417
=======
14,724
Yes
No
Don't know
Refusal
Not stated
Coverage:
Participating:
WTD
797,806
22,430,149
63,373
208,675
883,204
==========
24,383,207
All respondents
PA1_10
Position:
438
Length:
1
... a cultural, education, or hobby organization? (Theatre group, book club, bridge club, etc.)
1
2
7
8
9
Yes
No
Don't know
Refusal
Not stated
Coverage:
FREQ
1,845
12,327
35
99
418
=======
14,724
WTD
2,257,963
20,972,448
77,081
190,026
885,688
==========
24,383,207
All respondents
Special Surveys Division
145
2000 National Survey of Giving, Volunteering and Participating - User Guide
Participating:
PA1_11
Position:
439
Length:
1
Are you a member or participant in: ... a sports or recreation organization? (Baseball league, tennis club, golf club, etc.)
1
2
7
8
9
FREQ
3,266
10,906
34
99
419
=======
14,724
Yes
No
Don't know
Refusal
Not stated
Coverage:
Participating:
WTD
4,248,123
18,992,216
60,481
190,026
892,360
==========
24,383,207
All respondents
PA1_12
Position:
440
Length:
1
... a religious-affiliated group? (Youth group associated with a church, choir, etc.)
1
2
7
8
9
FREQ
2,625
11,544
35
99
421
=======
14,724
Yes
No
Don't know
Refusal
Not stated
Coverage:
Participating:
WTD
2,957,623
20,280,111
60,836
190,026
894,611
==========
24,383,207
All respondents
PA1_13
Position:
441
Length:
1
... a school group, a neighbourhood , civic or community association? For example, PTA or alumni, block parents or
neighbourhood watch, etc.
1
2
7
8
9
Yes
No
Don't know
Refusal
Not stated
Coverage:
FREQ
1,993
12,175
35
99
422
=======
14,724
WTD
2,218,413
21,015,181
59,438
190,026
900,149
==========
24,383,207
All respondents
Special Surveys Division
146
2000 National Survey of Giving, Volunteering and Participating - User Guide
Participating:
PA1_14
Position:
442
Length:
1
Do you belong to any other type of organization that you have not mentioned?
1
2
7
8
9
FREQ
376
13,787
38
99
424
=======
14,724
Yes
No
Don't know
Refusal
Not stated
Coverage:
Participating:
WTD
431,259
22,797,672
60,209
190,026
904,041
==========
24,383,207
All respondents
PA1_15A
Position:
443
Length:
1
Belong to other type of organization - Boy scouts, girl guides, etc.
1
2
6
7
8
9
FREQ
17
354
13,787
3
2
561
=======
14,724
Yes
No
Valid skip
Don't know
Refusal
Not stated
Coverage:
Participating:
WTD
9,175
413,380
22,797,672
8,333
371
1,154,276
==========
24,383,207
Respondents who answered PA1_14=1
PA1_15B
Position:
444
Length:
1
Belong to other type of organization - Cancer group, diabetes, lung, MS, MD, etc.
1
2
6
7
8
9
Yes
No
Valid skip
Don't know
Refusal
Not stated
Coverage:
FREQ
30
341
13,787
3
2
561
=======
14,724
WTD
50,354
372,200
22,797,672
8,333
371
1,154,276
==========
24,383,207
Respondents who answered PA1_14=1
Special Surveys Division
147
2000 National Survey of Giving, Volunteering and Participating - User Guide
Participating:
PA1_15C
Position:
445
Length:
1
Belong to other type of organization - Health spa or exercise club
1
2
6
7
8
9
FREQ
14
357
13,787
3
2
561
=======
14,724
Yes
No
Valid skip
Don't know
Refusal
Not stated
Coverage:
Participating:
WTD
15,530
407,024
22,797,672
8,333
371
1,154,276
==========
24,383,207
Respondents who answered PA1_14=1
PA1_15D
Position:
446
Length:
1
Belong to other type of organization - Self-help group such as AA
1
2
6
7
8
9
FREQ
15
356
13,787
3
2
561
=======
14,724
Yes
No
Valid skip
Don't know
Refusal
Not stated
Coverage:
Participating:
WTD
11,131
411,423
22,797,672
8,333
371
1,154,276
==========
24,383,207
Respondents who answered PA1_14=1
PA1_15E
Position:
447
Length:
1
Belong to other type of organization - Seniors' group
1
2
6
7
8
9
Yes
No
Valid skip
Don't know
Refusal
Not stated
Coverage:
FREQ
86
285
13,787
3
2
561
=======
14,724
WTD
91,188
331,366
22,797,672
8,333
371
1,154,276
==========
24,383,207
Respondents who answered PA1_14=1
Special Surveys Division
148
2000 National Survey of Giving, Volunteering and Participating - User Guide
Participating:
PA1_15F
Position:
448
Length:
1
Belong to other type of organization - Other
1
2
6
7
8
9
FREQ
218
153
13,787
3
2
561
=======
14,724
Yes
No
Valid skip
Don't know
Refusal
Not stated
Coverage:
WTD
254,981
167,573
22,797,672
8,333
371
1,154,276
==========
24,383,207
Respondents who answered PA1_14=1
Participating:
PA1FPAR
Position:
449
Length:
1
Civic Participation flag
1
2
9
FREQ
8,642
5,521
561
=======
14,724
Yes
No
Not stated
WTD
11,730,421
11,482,295
1,170,491
==========
24,383,207
Coverage:
All respondents
Note: Answered 'yes' to at least one of PA1_07 to PA1_14
Participating:
PA1_16
Position:
450
Length:
1
Did you vote in the last federal election?
1
2
6
7
8
9
Yes
No
Valid skip
Don't know
Refusal
Not stated
Coverage:
FREQ
10,827
2,677
582
114
111
413
=======
14,724
WTD
16,137,012
5,688,096
1,316,812
165,154
222,050
854,083
==========
24,383,207
Respondents aged 18 and over
Special Surveys Division
149
2000 National Survey of Giving, Volunteering and Participating - User Guide
Participating:
PA1_17
Position:
451
Length:
1
Did you vote in the last provincial election?
1
2
6
7
8
9
FREQ
10,705
2,791
582
124
109
413
=======
14,724
Yes
No
Valid skip
Don't know
Refusal
Not stated
Coverage:
Participating:
WTD
15,866,343
5,920,662
1,316,812
217,225
208,082
854,083
==========
24,383,207
Respondents aged 18 and over
PA1_18
Position:
452
Length:
1
Did you vote in the last municipal or local election?
1
2
6
7
8
9
FREQ
8,901
4,555
582
160
112
414
=======
14,724
Yes
No
Valid skip
Don't know
Refusal
Not stated
Coverage:
Participating:
WTD
13,132,432
8,596,352
1,316,812
245,083
235,059
857,468
==========
24,383,207
Respondents aged 18 and over
PA1_19
Position:
453
Length:
1
How frequently do you follow news and current affairs? (e.g. international, national, regional or local)
1
2
3
4
7
8
9
Daily
Several times each week
Several times each month
Rarely or never
Don't know
Refusal
Not stated
Coverage:
FREQ
9,883
2,723
675
865
41
105
432
=======
14,724
WTD
15,780,185
4,622,284
1,152,497
1,649,240
72,183
192,273
914,546
==========
24,383,207
All respondents
Special Surveys Division
150
2000 National Survey of Giving, Volunteering and Participating - User Guide
Participating:
PA1_20
Position:
454
Length:
1
About how many hours do you spend watching TV during a typical week?
1
2
3
4
7
8
9
FREQ
3,566
6,740
2,819
959
94
114
432
=======
14,724
Less than 5 hours
5 to 14 hours
15 to 29 hours
Over 30 hours
Don't know
Refusal
Not stated
Coverage:
WTD
5,928,158
10,742,584
4,752,931
1,650,532
185,372
209,084
914,546
==========
24,383,207
All respondents
Youth Exp. and Attitudes:
EA1_02
Position:
455
Length:
1
Did you participate in an organized team sport? (such as a baseball league, hockey league, etc.)
1
2
7
8
9
FREQ
9,530
4,517
72
144
461
=======
14,724
Yes
No
Don't know
Refusal
Not stated
Coverage:
WTD
15,087,783
7,845,072
134,884
318,351
997,117
==========
24,383,207
All respondents
Youth Exp. and Attitudes:
EA1_03
Position:
456
Length:
1
Did you belong to a youth group? (such as guides, scouts, a 4-H club, a choir)
1
2
7
8
9
Yes
No
Don't know
Refusal
Not stated
Coverage:
FREQ
7,850
6,201
70
141
462
=======
14,724
WTD
11,163,322
11,776,629
143,405
302,003
997,850
==========
24,383,207
All respondents
Special Surveys Division
151
2000 National Survey of Giving, Volunteering and Participating - User Guide
Youth Exp. and Attitudes:
EA1_04
Position:
457
Length:
1
Did you do some kind of volunteer work?
1
2
7
8
9
FREQ
6,758
7,137
213
152
464
=======
14,724
Yes
No
Don't know
Refusal
Not stated
Coverage:
WTD
10,103,030
12,589,430
361,520
327,266
1,001,962
==========
24,383,207
All respondents
Youth Exp. and Attitudes:
EA1_05
Position:
458
Length:
1
Did you personally see someone you admired helping others?
1
2
7
8
9
FREQ
8,284
5,511
308
155
466
=======
14,724
Yes
No
Don't know
Refusal
Not stated
Coverage:
WTD
11,961,350
10,605,286
485,839
326,041
1,004,691
==========
24,383,207
All respondents
Youth Exp. and Attitudes:
EA1_06
Position:
459
Length:
1
Did you go door-to-door to raise money for a cause or organization?
1
2
7
8
9
Yes
No
Don't know
Refusal
Not stated
Coverage:
FREQ
7,318
6,650
143
146
467
=======
14,724
WTD
10,891,189
11,963,354
217,751
306,068
1,004,846
==========
24,383,207
All respondents
Special Surveys Division
152
2000 National Survey of Giving, Volunteering and Participating - User Guide
Youth Exp. and Attitudes:
EA1_07
Position:
460
Length:
1
Were you helped in the past by others?
1
2
7
8
9
FREQ
7,738
6,218
151
150
467
=======
14,724
Yes
No
Don't know
Refusal
Not stated
Coverage:
WTD
11,291,178
11,505,642
261,475
320,066
1,004,846
==========
24,383,207
All respondents
Youth Exp. and Attitudes:
EA1_08
Position:
461
Length:
1
Were you active in student government?
1
2
7
8
9
FREQ
2,848
11,187
76
146
467
=======
14,724
Yes
No
Don't know
Refusal
Not stated
Coverage:
WTD
4,042,204
18,892,381
138,147
305,629
1,004,846
==========
24,383,207
All respondents
Youth Exp. and Attitudes:
EA1_09
Position:
462
Length:
1
Were you active in a religious organization?
1
2
7
8
9
Yes
No
Don't know
Refusal
Not stated
Coverage:
FREQ
5,023
9,013
71
148
469
=======
14,724
WTD
6,510,511
16,418,523
135,736
310,536
1,007,901
==========
24,383,207
All respondents
Special Surveys Division
153
2000 National Survey of Giving, Volunteering and Participating - User Guide
Youth Exp. and Attitudes:
EA1_10
Position:
463
Length:
1
Did one or both of your parents do volunteer work in the community?
1
2
7
8
9
FREQ
6,703
7,153
247
151
470
=======
14,724
Yes
No
Don't know
Refusal
Not stated
Coverage:
WTD
9,075,717
13,532,545
449,632
313,315
1,011,998
==========
24,383,207
All respondents
Youth Exp. and Attitudes:
EA1_12
Position:
464
Length:
1
Generally, charitable and voluntary organizations play a major role in making our communities better places to live.
1
2
7
8
9
FREQ
13,047
883
184
133
477
=======
14,724
Agree
Disagree
Don't know
Refusal
Not stated
Coverage:
WTD
20,628,213
2,052,493
402,381
267,487
1,032,632
==========
24,383,207
All respondents
Youth Exp. and Attitudes:
EA1_13
Position:
465
Length:
1
There seems to be so many organizations seeking donations for one cause or another, sometimes you don't feel like giving
to any organizations.
1
2
7
8
9
Agree
Disagree
Don't know
Refusal
Not stated
Coverage:
FREQ
8,713
5,279
121
132
479
=======
14,724
WTD
14,709,129
8,167,195
211,032
261,493
1,034,358
==========
24,383,207
All respondents
Special Surveys Division
154
2000 National Survey of Giving, Volunteering and Participating - User Guide
Youth Exp. and Attitudes:
EA1_14
Position:
466
Length:
1
Do you ever worry about not having enough money in the future?
1
2
7
8
9
FREQ
8,651
5,397
55
134
487
=======
14,724
Yes
No
Don't know
Refusal
Not stated
Coverage:
WTD
14,357,709
8,620,610
83,454
268,670
1,052,764
==========
24,383,207
All respondents
Youth Exp. and Attitudes:
EA1_15
Position:
467
Length:
1
Would you say that you worry ... ?
1
2
3
6
7
8
9
FREQ
1,882
3,472
3,278
5,397
17
2
676
=======
14,724
A Lot
A moderate amount
Only a little
Valid skip
Don't know
Refusal
Not stated
Coverage:
WTD
3,271,424
5,888,990
5,164,318
8,620,610
32,024
953
1,404,888
==========
24,383,207
Respondents who answered EA1_14=1
Youth Exp. and Attitudes:
EA1_16
Position:
468
Length:
1
Compared to this time last year, do you have more, less or the same amount of money left over after paying your bills?
1
2
3
7
8
9
More
Less
The same
Don't know
Refusal
Not stated
Coverage:
FREQ
3,040
5,203
5,494
305
190
492
=======
14,724
WTD
5,110,702
8,340,295
8,874,768
564,031
407,741
1,085,670
==========
24,383,207
All respondents
Special Surveys Division
155
2000 National Survey of Giving, Volunteering and Participating - User Guide
Youth Exp. and Attitudes:
EA1_17
Position:
469
Length:
1
In general, would you say that your health is ...?
1
2
3
4
5
7
8
9
FREQ
3,258
4,466
3,877
1,854
591
54
130
494
=======
14,724
Excellent
Very good
Good
Fair
Poor
Don't know
Refusal
Not stated
Coverage:
WTD
5,384,834
7,072,850
6,298,515
3,188,678
1,006,289
87,860
252,905
1,091,276
==========
24,383,207
All respondents
Youth Exp. and Attitudes:
EA1_18
Position:
470
Length:
1
How satisfied are you with your life in general?
1
2
3
4
7
8
9
Very satisfied
Somewhat satisfied
Somewhat dissatisfied
Very dissatisfied
Don't know
Refusal
Not stated
Coverage:
FREQ
6,837
6,246
733
187
80
145
496
=======
14,724
WTD
10,235,771
10,913,334
1,358,743
370,240
119,785
284,723
1,100,610
==========
24,383,207
All respondents
Special Surveys Division
156
2000 National Survey of Giving, Volunteering and Participating - User Guide
Youth Exp. and Attitudes:
EA1_19
Position:
471
Length:
1
How much control do you feel that you have in making decisions that affect your everyday activities?
1
2
3
4
7
8
9
FREQ
175
1,565
7,879
4,367
93
145
500
=======
14,724
No control
Control over few or some decisions
Control over most decisions
Control over all decisions
Don't know
Refusal
Not stated
Coverage:
WTD
410,623
3,055,264
12,670,280
6,685,314
181,395
271,589
1,108,742
==========
24,383,207
All respondents
Socio-demographics:
SD1G01
Position:
472
Length:
1
Grouped Variable: Religious affiliation
1
2
3
4
9
No religious affiliation
Roman Catholic
Protestant
Other
Not stated
Coverage:
FREQ
3,125
5,368
4,936
407
888
=======
14,724
WTD
5,848,261
9,617,539
5,796,655
1,296,315
1,824,437
==========
24,383,207
All respondents
Special Surveys Division
157
2000 National Survey of Giving, Volunteering and Participating - User Guide
Socio-demographics:
SD1_02
Position:
473
Length:
1
In the past 12 months, other than on special occasions (such as weddings, funerals or baptisms), how often have you
attended religious services or meetings?
1
2
3
4
5
6
7
8
9
FREQ
3,472
2,000
1,796
1,545
2,032
3,125
75
173
506
=======
14,724
At least once a week
At least once a month
At least 3 or 4 times
Only once or twice
Not at all
Valid skip
Don't know
Refusal
Not stated
Coverage:
WTD
4,242,900
2,907,573
2,959,293
2,838,697
4,011,405
5,848,261
129,621
326,850
1,118,606
==========
24,383,207
Respondents who did not answer SD1_01=1 (have no religious affiliation)
Socio-demographics:
SD1_03
Position:
474
Length:
1
Do you consider yourself to be ...?
1
2
3
4
7
8
9
FREQ
1,851
7,012
2,983
1,978
180
212
508
=======
14,724
Very religious
Somewhat religious
Not very religious
Not at all religious
Don't know
Refusal
Not stated
Coverage:
WTD
2,584,835
10,082,160
5,644,261
4,295,385
278,012
374,728
1,123,826
==========
24,383,207
All respondents
Socio-demographics:
SD1G05
Position:
475
Length:
1
Grouped Variable: Country of Birth
1
2
9
Canada
Outside Canada
Not stated
Coverage:
FREQ
12,560
1,481
683
=======
14,724
WTD
19,019,747
3,884,746
1,478,714
==========
24,383,207
All respondents
Special Surveys Division
158
2000 National Survey of Giving, Volunteering and Participating - User Guide
Demographic household:
SD1G09
Position:
476
Length:
1
Grouped Variable: Grouped length of time living in community
1
2
3
4
9
FREQ
1,574
1,512
1,518
9,419
701
=======
14,724
2 years or less
3 to 5 years
6 to 10 years
More than 10 years
Not stated
Coverage:
Income:
WTD
3,160,822
2,817,600
2,896,211
13,991,605
1,516,969
==========
24,383,207
All respondents
IN1G03
Position:
477
Length:
1
Grouped Variable: Household income group
1
2
3
4
5
FREQ
2,386
4,034
3,416
3,430
1,458
=======
14,724
Less than $20,000
$20,000 to less than $40,000
$40,000 to less than $60,000
$60,000 to less than $100,000
$100,000 and over
Coverage:
Income:
WTD
3,205,842
6,444,193
5,578,115
6,171,666
2,983,391
==========
24,383,207
All respondents
IN1G04
Position:
478
Length:
1
Grouped Variable: Personal income group
1
2
3
4
Less than $20,000
$20,000 to less than $40,000
$40,000 to less than $60,000
$60,000 and over
Coverage:
FREQ
6,207
4,665
2,365
1,487
=======
14,724
WTD
10,388,385
7,539,822
3,886,811
2,568,190
==========
24,383,207
All respondents
Special Surveys Division
159
2000 National Survey of Giving, Volunteering and Participating - User Guide
Labour force:
LF1GSTAT
Position:
479
Length:
1
Grouped Variable: Labour force status
1
2
3
FREQ
8,779
586
5,359
=======
14,724
Employed
Unemployed
Not in the labour force
Coverage:
Labour force:
WTD
15,337,312
987,222
8,058,672
==========
24,383,207
All respondents
LF1GCOWM
Position:
480
Length:
1
Grouped Variable: Class of worker
FREQ
Employee
8,351
Self-employed or working in a family business without pay 1,549
Valid skip
4,824
=======
14,724
1
2
6
Coverage:
Labour force:
WTD
14,669,576
2,506,038
7,207,593
==========
24,383,207
Current job or last job within previous 12 months
LF1GUHM
Position:
481
Length:
1
Grouped Variable: Grouped usual hours worked per week
1
2
3
4
6
Less than 30 hours
30 to less than 40 hours
40 to less than 50 hours
50 hours or more
Valid skip
Coverage:
FREQ
1,723
2,540
3,605
911
5,945
=======
14,724
WTD
3,037,389
4,238,958
6,596,785
1,464,180
9,045,895
==========
24,383,207
Currently employed only
Special Surveys Division
160
2000 National Survey of Giving, Volunteering and Participating - User Guide
Labour Force:
LF1_FTM
Position:
482
Length:
1
Full-time or part-time work schedule of main job
1
2
6
FREQ
7,056
1,723
5,945
=======
14,724
Full-time (30+ hours)
Part-time (<30 hours)
Valid skip
Coverage:
Labour force:
WTD
12,299,923
3,037,389
9,045,895
==========
24,383,207
Currently employed only
LF1GIC18
Position:
483
Length:
2
Grouped Variable: NAICS (18 groups)
01
02
03
04
05
06
07
08
09
10
11
12
13
14
15
16
17
18
96
Agriculture
Forestry, fishing, mining, oil and gas
Utilities
Construction
Manufacturing - durables
Manufacturing - nondurables
Wholesale trade
Retail trade
Transportation and warehousing
Finance, insurance and real estate and Leasing
Professional, scientific and technical
Management, administrative and other support
Educational services
Health care and social assistance
Information, culture and recreation
Accommodation and food services
Other services
Public administration
Valid skip
FREQ
349
308
94
464
659
564
284
1,085
471
543
549
355
816
1,244
479
549
498
589
4,824
=======
14,724
WTD
417,787
341,457
139,652
863,043
1,436,032
1,148,431
598,562
1,942,574
947,937
1,137,265
1,130,302
659,521
987,573
1,639,993
927,648
1,100,826
862,185
894,827
7,207,593
==========
24,383,207
Coverage:
Current job or last job within previous 12 months
Note: Based on North American Industry Classification System Canada, NAICS CANDA, 1997
Special Surveys Division
161
2000 National Survey of Giving, Volunteering and Participating - User Guide
Labour force:
LF1GOC10
Position:
485
Length:
2
Grouped Variable: Occupation at main job (current or in last year) (10 groups)
FREQ
Management Occupations
883
Business, Finance and Administrative Occupations
1,738
Natural and Applied Sciences and Related Occupations
586
Health Occupations
599
Occupations in Social Science, Education, Government
Service and Religion
888
Occupations in Art, Culture, Recreation and Sport
257
Sales and Service Occupations
2,442
Trades, Transport and Equipment Operators and Related
Occupations
1,253
Occupations Unique to Primary Industry
571
Occupations Unique to Processing, Manufacturing and
Utilities
683
Valid skip
4,824
=======
14,724
01
02
03
04
05
06
07
08
09
10
96
WTD
1,586,864
3,072,041
1,225,993
815,467
1,096,046
450,674
4,394,594
2,368,698
722,996
1,442,241
7,207,593
==========
24,383,207
Coverage:
Current job or last job within previous 12 months
Note: Based on 1991 Standard Occupational Classification (SOC)
Labour Force:
LF1_STU
Position:
487
Length:
1
Student status
1
2
3
6
FREQ
1,171
380
10,498
2,675
=======
14,724
Full-time student
Part-time student
Non-student
Valid skip
Coverage:
Variable:
WTD
2,661,431
720,171
17,382,391
3,619,215
==========
24,383,207
Respondents aged 15 to 64 years only
FINWGHT
Position:
488
Length:
10.4
Sampling weight - 4 decimal places e.g. 99999.9999
00052.0000 : 33787.0000
Coverage:
FREQ
14,724
=======
14,724
WTD
24,383,207
==========
24,383,207
All respondents
Special Surveys Division
162
VD File
2000 National Survey of Giving, Volunteering and Participating - User Guide
Volunteer Details:
MICRO_ID
Position:
1
Length:
5
Position:
6
Length:
1
Sequence number of record
Coverage:
Volunteers
Volunteer Details:
VD1DID
Derived variable: Sequence number of organization
1
2
3
FREQ
8,225
3,494
1,348
=======
13,067
1
2
3
Coverage:
WTD
6,512,971
2,659,549
968,804
==========
10,141,324
Volunteers
Volunteer Details:
VD1CICN2
Position:
7
Length:
2
The International Classification of Non-Profit Organizations: ICNPO - Revision 1, 1996 - 2 digits
01
02
03
04
05
06
07
08
09
10
11
12
Culture and recreation
Education and research
Health
Social services
Environment
Development and housing
Law Advocacy and Politics
Philanthropic Intermediaries and Voluntarism Promotion
International
Religion
Business and professional associations unions
Other (Not elsewhere classified)
FREQ
3,167
1,553
1,645
2,629
372
604
409
248
87
1,929
299
125
=======
13,067
WTD
2,351,255
1,324,483
1,271,551
1,987,033
281,479
502,123
328,471
225,460
86,656
1,443,310
229,410
110,095
==========
10,141,324
Coverage:
Volunteers
Note: See: International Classification of Non-Profit Organization: ICNPO - Revision 1, 1996 (Lester M. Salamon and Helmut K. Anheier)
Special Surveys Division
164
2000 National Survey of Giving, Volunteering and Participating - User Guide
Volunteer Details:
VD1_03A
Position:
9
Length:
1
Did you volunteer for this organization in October, 1999?
1
2
FREQ
7,794
5,273
=======
13,067
Yes
No
Coverage:
WTD
5,875,389
4,265,934
==========
10,141,324
Volunteers
Volunteer Details:
VD1_03B
Position:
10
Length:
1
Did you volunteer for this organization in November, 1999?
1
2
FREQ
7,623
5,444
=======
13,067
Yes
No
Coverage:
WTD
5,733,858
4,407,465
==========
10,141,324
Volunteers
Volunteer Details:
VD1_03C
Position:
11
Length:
1
Did you volunteer for this organization in December, 1999?
1
2
FREQ
7,594
5,473
=======
13,067
Yes
No
Coverage:
WTD
5,745,906
4,395,418
==========
10,141,324
Volunteers
Volunteer Details:
VD1_03D
Position:
12
Length:
1
Did you volunteer for this organization in January, 2000?
1
2
Yes
No
Coverage:
FREQ
7,291
5,776
=======
13,067
WTD
5,438,068
4,703,255
==========
10,141,324
Volunteers
Special Surveys Division
165
2000 National Survey of Giving, Volunteering and Participating - User Guide
Volunteer Details:
VD1_03E
Position:
13
Length:
1
Did you volunteer for this organization in February, 2000?
1
2
FREQ
7,505
5,562
=======
13,067
Yes
No
Coverage:
WTD
5,590,643
4,550,680
==========
10,141,324
Volunteers
Volunteer Details:
VD1_03F
Position:
14
Length:
1
Did you volunteer for this organization in March, 2000?
1
2
FREQ
7,587
5,480
=======
13,067
Yes
No
Coverage:
WTD
5,663,390
4,477,934
==========
10,141,324
Volunteers
Volunteer Details:
VD1_03G
Position:
15
Length:
1
Did you volunteer for this organization in April, 2000?
1
2
FREQ
7,542
5,525
=======
13,067
Yes
No
Coverage:
WTD
5,712,107
4,429,217
==========
10,141,324
Volunteers
Volunteer Details:
VD1_03H
Position:
16
Length:
1
Did you volunteer for this organization in May, 2000?
1
2
Yes
No
Coverage:
FREQ
7,379
5,688
=======
13,067
WTD
5,592,881
4,548,443
==========
10,141,324
Volunteers
Special Surveys Division
166
2000 National Survey of Giving, Volunteering and Participating - User Guide
Volunteer Details:
VD1_03I
Position:
17
Length:
1
Did you volunteer for this organization in June, 2000?
1
2
FREQ
7,115
5,952
=======
13,067
Yes
No
Coverage:
WTD
5,393,595
4,747,729
==========
10,141,324
Volunteers
Volunteer Details:
VD1_03J
Position:
18
Length:
1
Did you volunteer for this organization in July, 2000?
1
2
FREQ
5,837
7,230
=======
13,067
Yes
No
Coverage:
WTD
4,374,284
5,767,040
==========
10,141,324
Volunteers
Volunteer Details:
VD1_03K
Position:
19
Length:
1
Did you volunteer for this organization in August, 2000?
1
2
FREQ
5,922
7,145
=======
13,067
Yes
No
Coverage:
WTD
4,416,687
5,724,637
==========
10,141,324
Volunteers
Volunteer Details:
VD1_03L
Position:
20
Length:
1
Did you volunteer for this organization in September, 2000?
1
2
Yes
No
Coverage:
FREQ
7,424
5,643
=======
13,067
WTD
5,592,235
4,549,089
==========
10,141,324
Volunteers
Special Surveys Division
167
2000 National Survey of Giving, Volunteering and Participating - User Guide
Volunteer Details:
VD1_04
Position:
21
Length:
1
Did you usually volunteer about the same number of hours each week or did the time vary from week to week?
1
2
FREQ
6,687
6,380
=======
13,067
Same number of hours each week
Varied week to week
Coverage:
WTD
5,226,424
4,914,900
==========
10,141,324
Volunteers
Volunteer Details:
VD1_05A
Position:
22
Length:
3
How many hours did you volunteer for this organization in October, 1999?
Allowed Min:
000
Allowed Max:
200
001 : 200
000
996
Coverage:
FREQ
3,660
2,720
6,687
=======
13,067
No hours
Valid skip
WTD
2,758,935
2,155,965
5,226,424
==========
10,141,324
Volunteers who answered VD1_04=2
Volunteer Details:
VD1_05B
Position:
25
Length:
3
How many hours did you volunteer for this organization in November, 1999?
Allowed Min:
000
Allowed Max:
200
001 : 200
000
996
Coverage:
No hours
Valid skip
FREQ
3,560
2,820
6,687
=======
13,067
WTD
2,647,120
2,267,780
5,226,424
==========
10,141,324
Volunteers who answered VD1_04=2
Special Surveys Division
168
2000 National Survey of Giving, Volunteering and Participating - User Guide
Volunteer Details:
VD1_05C
Position:
28
Length:
3
How many hours did you volunteer for this organization in December, 1999?
Allowed Min:
000
Allowed Max:
200
001 : 200
000
996
Coverage:
FREQ
3,514
2,866
6,687
=======
13,067
No hours
Valid skip
WTD
2,642,265
2,272,635
5,226,424
==========
10,141,324
Volunteers who answered VD1_04=2
Volunteer Details:
VD1_05D
Position:
31
Length:
3
How many hours did you volunteer for this organization in January, 2000?
Allowed Min:
000
Allowed Max:
200
001 : 200
000
996
Coverage:
FREQ
3,346
3,034
6,687
=======
13,067
No hours
Valid skip
WTD
2,465,021
2,449,878
5,226,424
==========
10,141,324
Volunteers who answered VD1_04=2
Volunteer Details:
VD1_05E
Position:
34
Length:
3
How many hours did you volunteer for this organization in February, 2000?
Allowed Min:
000
Allowed Max:
200
001 : 200
000
996
Coverage:
No hours
Valid skip
FREQ
3,467
2,913
6,687
=======
13,067
WTD
2,565,535
2,349,365
5,226,424
==========
10,141,324
Volunteers who answered VD1_04=2
Special Surveys Division
169
2000 National Survey of Giving, Volunteering and Participating - User Guide
Volunteer Details:
VD1_05F
Position:
37
Length:
3
How many hours did you volunteer for this organization in March, 2000?
Allowed Min:
000
Allowed Max:
200
001 : 200
000
996
Coverage:
FREQ
3,509
2,871
6,687
=======
13,067
No hours
Valid skip
Volunteers who answered VD1_04=2
Volunteer Details:
VD1_05G
Position:
40
How many hours did you volunteer for this organization in April, 2000?
Allowed Min:
000
Allowed Max:
001 : 200
000
996
Coverage:
3
200
WTD
2,656,928
2,257,971
5,226,424
==========
10,141,324
Volunteers who answered VD1_04=2
VD1_05H
Position:
43
How many hours did you volunteer for this organization in May, 2000?
Allowed Min:
000
Allowed Max:
Coverage:
Length:
FREQ
3,510
2,870
6,687
=======
13,067
No hours
Valid skip
Volunteer Details:
001 : 200
000
996
WTD
2,585,942
2,328,958
5,226,424
==========
10,141,324
No hours
Valid skip
Length:
3
200
FREQ
3,451
2,929
6,687
=======
13,067
WTD
2,606,352
2,308,548
5,226,424
==========
10,141,324
Volunteers who answered VD1_04=2
Special Surveys Division
170
2000 National Survey of Giving, Volunteering and Participating - User Guide
Volunteer Details:
VD1_05I
Position:
46
How many hours did you volunteer for this organization in June, 2000?
Allowed Min:
000
Allowed Max:
001 : 200
000
996
Coverage:
3
200
FREQ
3,360
3,020
6,687
=======
13,067
No hours
Valid skip
WTD
2,541,375
2,373,525
5,226,424
==========
10,141,324
Volunteers who answered VD1_04=2
Volunteer Details:
VD1_05J
Position:
49
How many hours did you volunteer for this organization in July, 2000?
Allowed Min:
000
Allowed Max:
001 : 200
000
996
Coverage:
Length:
Length:
200
FREQ
2,722
3,658
6,687
=======
13,067
No hours
Valid skip
3
WTD
2,011,676
2,903,223
5,226,424
==========
10,141,324
Volunteers who answered VD1_04=2
Volunteer Details:
VD1_05K
Position:
52
Length:
3
How many hours did you volunteer for this organization in August, 2000?
Allowed Min:
000
Allowed Max:
200
001 : 200
000
996
Coverage:
No hours
Valid skip
FREQ
2,787
3,593
6,687
=======
13,067
WTD
2,064,760
2,850,140
5,226,424
==========
10,141,324
Volunteers who answered VD1_04=2
Special Surveys Division
171
2000 National Survey of Giving, Volunteering and Participating - User Guide
Volunteer Details:
VD1_05L
Position:
55
Length:
3
How many hours did you volunteer for this organization in September, 2000?
Allowed Min:
000
Allowed Max:
200
001 : 200
000
996
Coverage:
FREQ
3,556
2,824
6,687
=======
13,067
No hours
Valid skip
WTD
2,618,067
2,296,833
5,226,424
==========
10,141,324
Volunteers who answered VD1_04=2
Volunteer Details:
VD1_06
Position:
58
Length:
2
How many hours per week did you usually volunteer for this organization?
Allowed Min:
01 Allowed Max:
60
01 : 60
96
FREQ
6,687
6,380
=======
13,067
Valid skip
Coverage:
WTD
5,226,424
4,914,900
==========
10,141,324
Volunteers who answered VD1_04=1
Volunteer Details:
VD1_07
Position:
60
Length:
2
In the past 12 months, how many weeks did you volunteer this organization?
Allowed Min:
01 Allowed Max:
52
01 : 52
96
Valid skip
Coverage:
FREQ
6,687
6,380
=======
13,067
WTD
5,226,424
4,914,900
==========
10,141,324
Volunteers who answered VD1_04=1
Special Surveys Division
172
2000 National Survey of Giving, Volunteering and Participating - User Guide
Volunteer Details:
VD1_08
Position:
62
Length:
1
In addition to usual hours, people often volunteer for special events. Since October, 1999, did you spend any hours in
addition to what you have already reported for this organization?
1
2
6
FREQ
1,589
5,098
6,380
=======
13,067
Yes
No
Valid skip
Coverage:
Volunteers who answered VD1_04=1
Volunteer Details:
VD1_09
How many extra hours?
Allowed Min:
001
001 : 100
996
Coverage:
WTD
1,187,785
4,038,639
4,914,900
==========
10,141,324
Valid skip
Position:
63
Allowed Max:
Length:
3
100
FREQ
1,589
11,478
=======
13,067
WTD
1,187,785
8,953,539
==========
10,141,324
Volunteers who answered VD1_08=1
Special Surveys Division
173
2000 National Survey of Giving, Volunteering and Participating - User Guide
Volunteer Details:
VD1_10
Position:
66
Length:
2
How did you first become a volunteer for this organization?
01
02
03
04
05
06
07
08
09
10
11
12
97
98
99
Someone in the organization asked you
A friend/relative outside the organization asked you
Your boss or employer asked you
You responded to public appeal in newspaper/radio...
You were referred by a volunteer organization
You approached the organization yourself
You used the internet to match interests/skills with org.
Your child(ren) or spouse were involved in it
You were a member in the organization
You were nominated, appointed, elected, etc.
Other - Specify
You founded/established the organization
Don't know
Refusal
Not stated
Coverage:
FREQ
4,008
1,098
352
376
161
2,092
9
1,563
2,115
476
625
88
41
18
45
=======
13,067
WTD
3,032,721
938,695
292,102
270,303
147,710
1,640,867
3,831
1,239,365
1,537,980
359,604
531,330
58,458
33,702
11,394
43,261
==========
10,141,324
Volunteers
Volunteer Details:
VD1_11
Position:
68
Length:
1
How long have you been a volunteer for this organization?
1
2
3
4
5
7
8
9
Less than 1 year
1 to 2 years
3 to 5 years
6 to 10 years
More than 10 years
Don't know
Refusal
Not stated
Coverage:
FREQ
2,636
2,456
3,124
1,801
2,966
24
11
49
=======
13,067
WTD
2,299,635
1,972,711
2,460,048
1,307,606
2,026,921
18,888
5,171
50,344
==========
10,141,324
Volunteers
Special Surveys Division
174
2000 National Survey of Giving, Volunteering and Participating - User Guide
Volunteer Details:
VD1DHR
Position:
69
Length:
4
Derived Variable: Total hours volunteered
FREQ
13,067
=======
13,067
0001 : 3135
Coverage:
WTD
10,141,324
==========
10,141,324
Volunteers
Volunteer Details:
FINWGHT
Position:
73
Length:
10.4
Sampling weight - 4 decimal places e.g. 99999.9999
00052.0000 : 11597.0000
Coverage:
FREQ
13,067
=======
13,067
WTD
10,141,324
==========
10,141,324
Volunteers
Special Surveys Division
175
GS File
2000 National Survey of Giving, Volunteering and Participating - User Guide
Giving Specifics:
MICRO_ID
Position:
1
Length:
5
Position:
6
Length:
2
Sequence number of record
Coverage:
Givers
Giving Specifics:
GS1DSM
Derived Variable: Solicitation method
01
02
03
04
05
06
07
08
09
10
11
12
13
14
15
FREQ
8,686
4,370
1,428
8,862
5,253
2,630
9,725
4,135
1,788
6,193
1,322
1,087
29
30
742
=======
56,280
Mail
Charity event
Payroll deduction
Walkathon
In Memoriam
At work
Door-to-door
Shopping centre
Telephone
Church
TV, Radio etc.
On own
Stocks
Internet
Other
Coverage:
WTD
10,861,560
5,141,767
2,166,434
10,875,167
6,071,796
3,706,183
10,903,639
6,244,606
2,246,045
8,045,125
1,646,305
1,419,285
29,856
42,713
1,064,509
==========
70,464,987
Givers
Giving Specifics:
GS1DID
Position:
8
Length:
2
Derived variable: Sequence number of organization within solicitation method
FREQ
56,280
=======
56,280
01 : 55
Coverage:
WTD
70,464,987
==========
70,464,987
Givers
Special Surveys Division
177
2000 National Survey of Giving, Volunteering and Participating - User Guide
Giving Specifics:
GS1CICN2
Position:
10
Length:
2
The International Classification of Non-Profit Organizations: ICNPO - Revision 1, 1996 - 2 digits
01
02
03
04
05
06
07
08
09
10
11
12
Culture and recreation
Education and research
Health
Social services
Environment
Development and housing
Law Advocacy and Politics
Philanthropic Intermediaries and Voluntarism Promotion
International
Religion
Business and professional associations unions
Other (Not elsewhere classified)
FREQ
3,397
4,005
24,093
10,579
1,103
292
898
2,416
1,068
7,978
43
408
=======
56,280
WTD
3,853,157
5,354,652
28,867,453
13,868,414
1,446,042
308,357
1,054,002
3,825,865
1,364,621
9,907,162
76,053
539,209
==========
70,464,987
Coverage:
Givers
Note: See: International Classification of Non-Profit Organization: ICNPO - Revision 1, 1996 (Lester M. Salamon and Helmut K. Anheier)
Giving Specifics:
GS1D03
Position:
12
Length:
5
Derived variable: Amount of donation - adjusted for joint giving
FREQ
56,280
=======
56,280
00001 : 13000
Coverage:
WTD
70,464,987
==========
70,464,987
Givers
Giving Specifics:
GS1_04
Position:
17
Length:
1
Was this donation made by you personally or jointly by you and your spouse or partner?
1
2
6
7
8
9
Personally
Jointly
Valid skip
Don't know
Refusal
Not stated
Coverage:
FREQ
6,770
7,955
41,541
12
1
1
=======
56,280
WTD
8,822,611
9,700,366
51,920,727
10,448
934
9,901
==========
70,464,987
Givers who answered FG1_02=3 on MAIN file
Special Surveys Division
178
2000 National Survey of Giving, Volunteering and Participating - User Guide
Giving Specifics:
GS1_05
Position:
18
Length:
1
In the past 12 months did you make any other donations: ... (solicitation method)?
1
2
7
8
9
FREQ
14,657
37,297
172
16
4,138
=======
56,280
Yes
No
Don't know
Refusal
Not stated
Coverage:
WTD
15,690,489
48,799,335
199,942
23,207
5,752,014
==========
70,464,987
Givers
Giving Specifics:
FINWGHT
Position:
19
Length:
10.4
Sampling weight - 4 decimal places e.g. 99999.9999
00052.0000 : 33761.0000
Coverage:
FREQ
56,280
=======
56,280
WTD
70,464,987
==========
70,464,987
Givers
Special Surveys Division
179