1
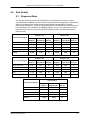
Public Use Microdata File User Guide Changes in Employment Survey Cohorts 1 to 10 January 1995 to September 1998 Changes in Employment Survey, Cohorts 1 to 10 – User Guide Table of Contents 1.0 Introduction ............................................................................................................................... 5 2.0 Background ............................................................................................................................... 7 3.0 Objectives ............................................................................................................................... 9 4.0 Concepts and Definitions............................................................................................................ 11 5.0 Survey Methodology.................................................................................................................... 13 5.1 Population Coverage......................................................................................................... 13 5.2 Sample Design.................................................................................................................. 13 5.3 Sample Size by Province .................................................................................................. 15 6.0 Data Collection ............................................................................................................................. 17 7.0 Data Processing ........................................................................................................................... 19 7.1 Data Capture..................................................................................................................... 19 7.2 Editing ............................................................................................................................. 19 7.3 Coding of Open-ended Questions .................................................................................... 20 7.4 Creation of Derived Variables ........................................................................................... 20 7.5 Weighting .......................................................................................................................... 20 7.6 Suppression of Confidential Information........................................................................... 21 8.0 Data Quality ............................................................................................................................. 23 8.1 Response Rates................................................................................................................ 23 8.2 Survey Errors .................................................................................................................... 24 8.2.1 The Frame............................................................................................................ 24 8.2.2 Data Collection..................................................................................................... 24 8.2.3 Data Processing................................................................................................... 25 8.2.4 Non-response....................................................................................................... 25 8.2.5 Measurement of Sampling Error .......................................................................... 25 9.0 Guidelines for Tabulation, Analysis and Release..................................................................... 26 9.1 Rounding Guidelines......................................................................................................... 26 9.2 Sample Weighting Guidelines for Tabulation.................................................................... 26 9.3 Categorical Estimates ....................................................................................................... 27 9.3.1 Tabulation of Categorical Estimates .................................................................... 27 9.4 Guidelines for Statistical Analysis ..................................................................................... 27 9.5 Coefficient of Variation Release Guidelines ..................................................................... 28 10.0 Variance Calculation.................................................................................................................... 31 10.1 Importance of the Variance............................................................................................... 31 10.2 Variance and Coefficient of Variation Calculation............................................................. 31 10.3 How to Use the Coefficient of Variation Extraction Module for Categorical Estimates..... 31 10.3.1 Examples of Using the Coefficient of Variation Extraction Module for Categorical Estimates ............................................................................................................. 32 10.4 How to Use the Coefficient of Variation Extraction Module to Obtain Confidence Limits. 35 10.4.1 Example of Using the Coefficient of Variation Extraction Module to Obtain Confidence Limits................................................................................................. 36 10.5 How to Use the Coefficient of Variation Extraction Module to Do a T-test ....................... 36 10.5.1 Example of Using the Coefficient of Variation Extraction Module to Do a T-test 37 10.6 Coefficient of Variation Extraction Module ........................................................................ 37 Special Surveys Division 3 Changes in Employment Survey, Cohorts 1 to 10 – User Guide 11.0 Weighting 12.0 Questionnaire ............................................................................................................................. 41 13.0 Record Layout with Univariate Frequencies ............................................................................. 43 4 ............................................................................................................................. 39 Special Surveys Division Changes in Employment Survey, Cohorts 1 to 10 – User Guide 1.0 Introduction The Changes in Employment Survey (CIES) was conducted by Statistics Canada with the cooperation and support of Human Resources Development Canada (HRDC), now called Human Resources and Social Development Canada. This survey of individuals who potentially had a change in their employment status, was modelled after a previously existing survey, the Canadian Out-of-Employment Panel Survey (COEP), but with changes in the sample design and content to allow a more complete picture of this population. This manual has been produced to facilitate the manipulation of the microdata file of the survey results. Any question about the data set or its use should be directed to: Statistics Canada Client Services Special Surveys Division Telephone: (613) 951-3321 or call toll-free 1 800 461-9050 Fax: (613) 951-4527 E-mail: [email protected] Human Resources and Social Development Canada Roger Hubley Strategic Policy and Planning EI Evaluations Telephone: (819) 953-8503 Fax: (819) 953-8868 E-mail: [email protected] Special Surveys Division 5 Changes in Employment Survey, Cohorts 1 to 10 – User Guide 2.0 Background The Macro Evaluation area of Human Resources Development Canada (HRDC) first conducted a panel survey on persons out of employment in 1993. The 1993 Canadian Out-of-Employment Panel Survey (COEP) was designed to evaluate the impact of Bill C-113 with respect to specific aspects of the Employment Insurance (EI) program, formerly called Unemployment Insurance (UI), as well as collecting information on topics such as job search, assets and debt, and utilization of Social Assistance. Two cohorts were interviewed three times in the year following their job separation. The 1995 COEP survey continued this work, with the intent of evaluating the impact of Bill C-17 which was passed into law on May 31, 1994. Two cohorts were interviewed twice in the year following their job separation. The Changes in Employment Survey (CIES) has a similar content to the two previous COEP surveys, but covers the complete ”Record of Employment” (ROE) population (i.e., no exclusions based on reason for issuing the ROE, and all dates were included). The new survey was designed to monitor and evaluate Bill C-12 which was introduced into legislation in part in July 1996, with the remainder coming into effect in January 1997. The scope of the survey covers ROEs from the 12 months prior to July 1996, the six months between the first and second set of changes, and the 12 months after Bill C-12 changes were complete. Special Surveys Division 7 Changes in Employment Survey, Cohorts 1 to 10 – User Guide 3.0 Objectives The primary objective of the Changes in Employment Survey (CIES) is to evaluate the impact of Bill C-12 on the Employment Insurance legislation and the degree to which program objectives have been achieved. The legislation was designed to better reward work effort, to ensure adequate benefits by targeting those most in need, to encourage job creation, and to improve the perception of “fairness”. Specific aspects of these objectives were addressed in the survey. In addition, the survey attempts to get a measure of the aggregate impact of the legislation. Secondary objectives of the survey include the continuation of the information collected in the 1993 and 1995 Canadian Out-of-Employment Panel Surveys. This includes collection of background demographics on the individual and the household, as well as information on job search activities and outcomes, assets and debts, expenditures, and utilization of Employment Insurance and Social Assistance. Special Surveys Division 9 Changes in Employment Survey, Cohorts 1 to 10 – User Guide 4.0 Concepts and Definitions This chapter outlines concepts and definitions of interest to the users. Users are referred to Chapter 12.0 of this document for a copy of the actual survey questionnaires used. Job Only “paid worker” jobs at which the respondent had worked for one week or longer were considered for this survey. Industry and Occupation The Changes in Employment Survey provides information about the occupation and industry attachment of employed persons. For these microdata files, these statistics are based on the 1980 Standard Occupational Classification and the 1980 Standard Industrial Classification. Full-time Employment A job is considered to be full-time if the person usually works 30 hours or more per week at this job. Part-time Employment A job is considered to be part-time if the person usually works less than 30 hours per week at this job. Employment Insurance Employment Insurance (EI), formerly called Unemployment Insurance (UI), is a federally run program which provides income to people who have recently had a job separation. The eligibility criteria and benefit amounts vary depending on the person’s province of residence, weeks of work, and pay rate, as well as other criteria. Social Assistance Social Assistance programs, which include welfare, are municipally run programs which provide income to households that have no other source of income. The eligibility criteria and benefit amounts vary depending on the circumstances of the household members. Only one member per household is allowed to receive welfare, and the amount received is for the entire household, not the individual. Record of Employment A Record of Employment (ROE) is one of the forms which is used by the federal government to help administer the Employment Insurance program. In order to apply for EI, a person must have a ROE form filled in by his/her former employer. The ROE form records the essential information required to determine the person’s eligibility and benefit rate under the EI rules. When the ROE form is completed by the employer, one copy is given to the former employee and another copy is sent to Human Resources Development Canada. Job separation A job separation is any reason for leaving a job (see definition of “Job”) which would result in a Record of Employment being issued. This includes quitting, being fired, being laid off, as well as taking unpaid leave (eg. extended sick leave, maternity leave, etc.), retiring, and periods without work because of labour disputes. On the ROE, the employer is required to select one of the categories provided to record the reason the job ended; an “Other” category is provided to cover any reason not specified in the list or if the employer is unsure as to the reason. Special Surveys Division 11 Changes in Employment Survey, Cohorts 1 to 10 – User Guide 5.0 Survey Methodology 5.1 Population Coverage The Changes in Employment Survey (CIES) was composed of a sample of individuals who: were representative of the civilian, non-institutionalized population 15 years of age or older in Canada’s 10 provinces and territories; had experienced at least one job separation between July 1st, 1995 and December 31st, 1997; and had been issued a Record of Employment (ROE) as a result of this job separation, regardless of the reason for the job separation. This 30 month sampling period was divided into quarters and a separate sample was selected in each reference quarter. The ROE database file from Human Resources Development Canada (HRDC) was used as a sampling frame for the CIES. This file is updated continually as ROE records are received. Since some employers may delay in submitting the forms to HRDC, the frame may not be complete at the time each quarterly sample was selected. Name and address information from the HRDC National Employment Service System (NESS) and Name & Address files supplement this sampling frame. 5.2 Sample Design The ROE records were unduplicated using the Social Insurance Number (SIN) of the individual. For the first CIES reference quarter (July 1st, 1995 to September 30th, 1995), the ROE records were also classified into two population strata (”new” target population): those who were only issued one ROE during the reference quarter; and those who were issued more than one ROE in the reference quarter. For persons issued more than one ROE in the reference quarter, the ROE with the highest insurable earnings and weeks worked was retained as the reference ROE in that population strata. For all subsequent CIES reference quarters (October 1st, 1995 to December 31st, 1997), the ROE records were classified into an extra population strata (“overlap” target population): those who had been issued at least one ROE in a previous reference quarter, only as early as July 1st, 1995. The records were then sorted by province and reason for job separation (within each of the three population strata). The Northwest Territories were combined with Quebec and the Yukon was combined with British Columbia for sampling purposes. Special Surveys Division 13 Changes in Employment Survey, Cohorts 1 to 10 – User Guide The reasons for job separation were grouped into three strata as shown in the table below. Code Reason for Job Separation A Shortage of work K Other C Return to school E Voluntary departure F Retirement G Pregnancy L Reached age 65 N Leave of absence B Labour dispute D Injury or illness H Work sharing J Apprenticeship M Dismissal Sampling sizes in each province were sufficient to yield estimates of approximately equal quality. Sample sizes were initially determined using design effects and response rates from the 1995 Canadian Out-of-Employment Panel Survey (COEP) and then from the first two CIES reference quarter results. Steps were taken to ensure that individuals selected for the 1995 COEP or other recent HRDC surveys were not interviewed again within two years. The sample was then selected from the ”new” and the ”overlap” target population, proportionately allocated to the design strata, using simple random sampling. The selected ”overlap sample” was next matched to all previous samples and duplicates were dropped from the ”overlap sample”. For the ”overlap” target population, the sample was augmented by the following factor: Factor = Overlap target population Overlap target population − Duplicates from previous samples Since reliable estimates were required to be produced semi-annually, the sample size was calculated using twice the size of the 1st quarter’s frame and then divided in half. Once this half of the two semi-annual samples was drawn, the required sample size to produce semi-annual estimates was recalculated by combining the frame sizes of both reference quarters. The 1st sample size was then subtracted from this value to obtain the required sample size for the 2nd reference quarter. Reliable estimates were also required at the annual level for 13 selected communities. The geographical boundaries for the communities were defined using postal codes provided by HRDC. After the first interview, survey respondents were reclassified to designated communities based on their responses as to where they were living in the month before the month that the ROE was issued. 14 Special Surveys Division Changes in Employment Survey, Cohorts 1 to 10 – User Guide Note that in the selection of the community and provincial samples, the following procedure was followed: first the community sample was drawn; and next the provincial sample was selected and pro-rated to the target population counts of the provinces less the community frame. 5.3 Sample Size by Province The following table shows the number of persons in the CIES sample for each of the cohort combinations by region. This table includes persons who were non-respondents to the CIES. Sample Size Provinces and Regions Cohorts 1&2 Cohorts 3&4 Cohorts 5&6 Cohorts 7&8 Cohorts 9 & 10 Atlantic Provinces 4,154 5,429 4,711 4,675 5,007 Quebec 1,584 2,449 2,249 2,159 1,968 Ontario 1,724 2,619 2,575 2,355 1,981 West 7,188 9,225 8,734 8,850 8,385 14,650 19,722 18,269 18,039 17,341 Canada Special Surveys Division 15 Changes in Employment Survey, Cohorts 1 to 10 – User Guide 6.0 Data Collection All interviews were conducted from Statistics Canada’s head office facilities in Ottawa using a computerassisted telephone interviewing (CATI) system. For each cohort, data collection was done in two phases, or waves. Only respondents to the first wave interview were contacted for the second wave interview. The dates for all 10 cohorts are given in the table below. An advance letter was mailed to all respondents approximately two weeks before the start of the collection period for each cohort. This letter explained the purpose of the survey, provided a toll-free telephone number to answer any questions respondents might have about the survey, and informed respondents that they will be contacted for an interview in the near future. A second letter was mailed to respondents just before the collection period for Wave 2 of each cohort. This letter was sent to those respondents who had completed an interview during Wave 1 and who had agreed to share their information with Human Resources Development Canada (HRDC). It reminded respondents about the purpose of the survey and informed them that they would be contacted shortly for a follow-up interview. All interviewers were given a training session designed to familiarize them with the purpose and concepts of the survey, the CATI questionnaire and basic telephone interview procedures. Interviewers attempted to contact all respondents in the official language of their choice. Participation in the survey was voluntary. If a respondent refused to provide some or all information requested, interviewers were instructed to make a second call in an attempt to obtain the information. If the respondent was temporarily away or there was some language or other difficulty preventing an interview, interviewers were instructed to call back at another time. Proxy responses on behalf of the respondents were not allowed. Collection Dates Showing Record of Employment (ROE) Job End Date Periods and Reference Periods for Cohorts 1 to 10 Cohort ROE Job End Date Periods Wave 1 Collection Dates Wave 1 Reference Period Wave 2 Collection Dates Wave 2 Reference Period 1 July - Sept. 1995 July 1996 Jan. 1995 - July 1996 March 1997 July 1996 - March 1997 2 Oct. - Dec. 1995 Sept. 1996 April 1995 - Sept. 1996 June 1997 Oct. 1996 - June 1997 3 Jan.- March 1996 Nov. 1996 July 1995 - Nov. 1996 Oct. 1997 Nov.1996 - Oct. 1997 4 April - June 1996 Feb. 1997 Oct. 1995 - Feb. 1997 Dec. 1997 Feb. 1997 - Dec. 1997 5 July - Sept. 1996 May 1997 Jan. 1996 - May 1997 March 1998 June 1997 - March 1998 6 Oct. - Dec. 1996 Sept. 1997 April 1996 - Sept. 1997 June 1998 Sept. 1997 - June 1998 7 Jan.- March 1997 Nov. 1997 July 1996 - Nov. 1997 Oct. 1998 Nov. 1997 - Oct. 1998 8 April - June 1997 Feb. 1998 Oct. 1996 - Feb. 1998 Dec. 1998 Feb. 1998 - Dec. 1998 9 July - Sept. 1997 May 1998 Jan. 1997 - May 1998 March 1999 May 1998 - March 1999 10 Oct. - Dec. 1997 Sept. 1998 April 1997 - Sept. 1998 June 1999 Sept. 1998 - June 1999 Special Surveys Division 17 Changes in Employment Survey, Cohorts 1 to 10 – User Guide 7.0 Data Processing The main output of the Changes in Employment Survey (CIES) is a “clean” microdata file. This chapter presents a brief summary of the processing steps involved in producing this file. 7.1 Data Capture Responses to survey questions are captured directly by the interviewer at the time of the interview using a computer-assisted telephone interview (CATI) questionnaire. The CATI questionnaire reduces processing time and costs associated with data entry, transcription errors and data transmission. Some editing is done directly at the time of the interview. Where the information entered is out of range (too large or small) of expected values, or inconsistent with the previous entries, the interviewer is prompted, through message screens on the computer, to modify the information. However, for some questions interviewers have the option of bypassing the edits, and of skipping questions if the respondent does not know the answer or refuses to answer. Therefore, the response data are subjected to further edit and imputation processes once they arrive in head office. 7.2 Editing The first stage of survey processing was to replace the collection non-response codes with the standardized code set used by Special Surveys Division. In most questions, a response of “Refused” or “Don’t know” was permitted if the respondent was unable to provide an estimate, or was unable or unwilling to answer the question. The second stage of survey processing was to assign specific codes to unanswered questions to indicate whether or not the respondent was eligible to answer the question (see the table below for the codes). The “Valid skip” code is assigned if the person does not belong in the target population for that question. A “Not stated” code is assigned if: a. it is uncertain whether the person belongs to the target population for the question or b. the person belongs to the target population for the question, but the question was not answered. A type a. “Not stated” situation occurs when a respondent answers “Don’t know” or “Refused” to a question which is used to determine if a subsequent question should be asked; to ensure that the interview flows well, this subsequent question will usually be skipped since it is uncertain if it is applicable or not. A type b. “Not stated” situation occurs when a specification or programming error associated with the collection application causes a question to be missed for some portion of the target population. Non-response Type Non-response Codes What this means: Valid skip 6, 96, 996, etc. Based on responses to previous questions, this question does not apply to the respondent Don’t know 7, 97, 997, etc. Respondent was asked the question and replied “Don’t know” Refused 8, 98, 998, etc. Respondent was asked this question and replied “Refused” 9, 99, 999, etc. Respondent was not asked the question because of a “Don’t know” or “Refused” response to a previous question which determines whether or not the current question applies; it is unknown whether the respondent was in the target population for this question. Not stated Special Surveys Division 19 Changes in Employment Survey, Cohorts 1 to 10 – User Guide Note that the specific values of the non-response codes depend on the length of the variable. For example, an item which was coded as “Not stated” is indicated by a code "9". For a variable that is two-digits long the code is “99", for a three-digit variable "999", etc. 7.3 Coding of Open-ended Questions A number of data items on the CATI questionnaire were recorded in an open-ended format. Some of these were subsequently coded. In order to obtain the industry and occupation information for each job held by the respondent in the reference periods, the questionnaire collected information on the name of the employer, the kind of business, industry or service the employer was in, the kind of work done and the usual duties or responsibilities of the respondent in the job This information was used to assign industry codes to each job using the 1980 version of Statistics Canada's Standard Industrial Classification (SIC). Occupation codes were assigned using the 1980 version of Statistics Canada's Standard Occupational Classification (SOC). The information on the name of the employer, etc. was first put through the automated coding system developed for use by the Labour Force Survey. Where a match to the database of descriptions was obtained, the appropriate 1980 SIC code and/or 1980 SOC code was assigned. The remaining partially coded or uncoded records were coded manually by a staff of experienced coders. All coded records were then linked to the survey data file. Similarly, responses to the ethnic origin and visible minority questions are recorded by interviewers during the interview, and then put through an automatic coding system. The remaining partially coded or uncoded records were coded manually by a staff of experienced coders. All coded records were then linked to the survey data file. 7.4 Creation of Derived Variables A number of data items on the microdata files have been derived or grouped by combining items on the questionnaire in order to facilitate data analysis. These variables are identified by the letter “D” or “G” in the third character of the variable name. Users should consult the five files containing the record layouts with univariate counts, referenced in Chapter 13.0 of this guide, for more details. 7.5 Weighting The principle behind estimation in a probability sample such as the CIES is that each person in the sample “represents”, besides himself or herself, several other persons not in the sample. For example, in a simple random 2% sample of the population, each person in the sample represents 50 persons in the population. The weighting phase is a step which calculates, for each record, what this number is. This weight appears on the public use microdata file, and must be used to derive meaningful estimates from the survey. For example if the number of individuals working in a permanent job before their change in employment is to be estimated, it is done by selecting the records referring to those individuals in the sample with that characteristic and summing the weights entered on those records. Details of the method used to calculate these weights are presented in Chapter 11.0. 20 Special Surveys Division Changes in Employment Survey, Cohorts 1 to 10 – User Guide 7.6 Suppression of Confidential Information It should be noted that the “Public Use” Microdata Files (PUMF) may differ from the survey “master” files held by Statistics Canada. These differences usually are the result of actions taken to protect the anonymity of individual survey respondents. Below is a list of the actions taken to protect the identity of the CIES respondents. Reduction of geographic identifiers – Any information referring to a respondent’s address or the address of their employment was excluded from the PUMF. The public use microdata files do not contain any geographic indicators below the region level. Removal of direct identifiers – Any information referring directly to a respondent’s name was excluded from the PUMF. Removal of variables containing sensitive information – Any variables containing information of a personal or sensitive nature that would have aided in the identification of survey respondents were removed. Removal of duplicate information – In situations where a variable on the master file contained the same information as another variable on the master file, only one of these variables was retained on the PUMF. An effort was made to keep as many of the variables that were derived during processing, from information obtained from original survey questions. Reduction of numerous household variables – The survey master file contains multiple variables for each member of the respondent’s household. This information was reduced by deriving new variables to take their place on the PUMF. Collapse of variable categories – Variable categories were grouped together to allow a more concentrated set of information on the public use microdata file. This also helped to limit the amount of information that could be gained on a specific respondent to aid in the identification of that respondent. Some of the variables that were grouped include: respondent age, marital status, household composition, and highest level of education. As well, industry and occupation variables were collapsed to include only the major classification groupings. Capping of variables – Quantitative variables were capped. Many of the categorical variables that were collapsed were also capped. Suppression of data – Certain combinations of variables were rare within the sample and population. To reduce the risk of respondent identification due to these rare characteristics, specific variable values were suppressed. Special Surveys Division 21 Changes in Employment Survey, Cohorts 1 to 10 – User Guide 8.0 Data Quality 8.1 Response Rates The Changes in Employment Survey (CIES) public use microdata files contain only those respondents who completed a minimum portion of the questionnaire and also gave permission to share their responses with Human Resources Development Canada (HRDC), Strategic Monitoring and Evaluation. However, respondents who did not complete the minimum portion of the questionnaire were included in the weighting strategy. As such, it is important to know the response rate for each of the semi-annual CIES reference periods. The table below lists the response rates. Cohorts 1 & 2 Provinces and Regions Number Sampled Cohorts 3 & 4 Number of Response Respondents Rate (%) Number Sampled Number of Response Respondents Rate (%) Atlantic Provinces 4,154 2,210 53 5,429 3,021 56 Quebec 1,584 752 47 2,449 1,172 48 Ontario 1,724 758 44 2,619 1,179 45 West 7,188 3,010 42 9,225 4,115 45 14,650 6,730 46 19,722 9,487 48 Canada Cohorts 5 & 6 Provinces and Regions Number Sampled Cohorts 7 & 8 Number of Response Respondents Rate (%) Number Sampled Number of Response Respondents Rate (%) Atlantic Provinces 4,711 2,757 59 4,675 2,378 51 Quebec 2,249 1,190 53 2,159 1,027 48 Ontario 2,575 1,256 49 2,355 1,007 43 West 8,734 3,968 45 8,850 3,301 37 18,269 9,171 50 18,039 7,713 43 Canada Cohorts 9 & 10 Provinces and Regions Atlantic Provinces Number Sampled Number of Respondents Response Rate (%) 5,007 2,874 Quebec 1,968 1,105 56 Ontario 1,981 996 50 West 8,385 3,944 47 17,341 8,919 51 Canada Special Surveys Division 57 23 Changes in Employment Survey, Cohorts 1 to 10 – User Guide 8.2 Survey Errors The estimates derived from this survey are based on a sample of persons. Somewhat different estimates might have been obtained if a complete census had been taken using the same questionnaire, interviewers, supervisors, processing methods, etc. as those actually used in the survey. The difference between the estimates obtained from the sample and those resulting from a complete count taken under similar conditions, is called the sampling error of the estimate. Errors which are not related to sampling may occur at almost every phase of a survey operation. Interviewers may misunderstand instructions, respondents may make errors in answering questions, the answers may be incorrectly entered on the questionnaire and errors may be introduced in the processing and tabulation of the data. These are all examples of non-sampling errors. Over a large number of observations, randomly occurring errors will have little effect on estimates derived from the survey. However, errors occurring systematically will contribute to biases in the survey estimates. Considerable time and effort was made to reduce non-sampling errors in the survey. Quality assurance measures were implemented at each step of the data collection and processing cycle to monitor the quality of the data. These measures include the use of highly skilled interviewers, extensive training of interviewers with respect to the survey procedures and questionnaire, observation of interviewers to detect problems of questionnaire design or misunderstanding of instructions, procedures to ensure that data capture errors were minimized and coding and edit quality checks to verify the processing logic. 8.2.1 The Frame The Record of Employment (ROE) administrative file was used as a sampling frame; this file is updated continually as ROE records are received. Since some employers may delay in submitting the forms to HRDC, the frame may not be complete at the time the sample is selected on a quarterly basis. Weights are adjusted according to the latest up-to-date frame. Nonetheless, if late reporters have different characteristics than the earlier ones, a bias might be introduced. Some variables on the sampling frame may play a critical role with respect to the software application used in the survey. For example, in a computer-assisted telephone interview (CATI) application, each record must have an accurate province code. Moreover, it requires accurate coding of the time zone field corresponding to province and each of the telephone number fields. Such analysis of the sampling frame provides important feedback on the quality of the frame used in the survey. 8.2.2 Data Collection Interviewer training for the CIES consisted of reading the Interviewer’s Manual, practicing with the CIES training cases on the computer, and discussing any questions with senior interviewers before the start of the survey. A description of the background and objectives of the survey was provided, as well as a glossary of terms and a set of questions and answers. A summary table of the Collection Dates Showing Record of Employment (ROE) Job End Date Periods and Reference Periods for Cohorts 1 to 10 is provided in Chapter 6.0 of this document. 24 Special Surveys Division Changes in Employment Survey, Cohorts 1 to 10 – User Guide 8.2.3 Data Processing Data processing of the CIES was done in a number of steps including verification, coding, editing, imputation, estimation, confidentiality, etc. At each step a picture of the output files is taken and an easy verification can be made comparing files at the current and previous step. This greatly improved the data processing stage. 8.2.4 Non-response A major source of non-sampling errors in surveys is the effect of non-response on the survey results. The extent of non-response varies from partial non-response (failure to answer just one or some questions) to total non-response. Total non-response occurred because the interviewer was either unable to contact the respondent, no member of the household was able to provide the information, or the respondent refused to participate in the survey. Total non-response was handled by adjusting the weight of individuals who responded to the survey to compensate for those who did not respond. In most cases, partial non-response to the survey occurred when the respondent did not understand or misinterpreted a question, refused to answer a question, or could not recall the requested information. 8.2.5 Measurement of Sampling Error Since it is an unavoidable fact that estimates from a sample survey are subject to sampling error, sound statistical practice calls for researchers to provide users with some indication of the magnitude of this sampling error. This section of the documentation outlines the measures of sampling error which Statistics Canada commonly uses and which it urges users producing estimates from this microdata file to use also. The basis for measuring the potential size of sampling errors is the standard error of the estimates derived from survey results. However, because of the large variety of estimates that can be produced from a survey, the standard error of an estimate is usually expressed relative to the estimate to which it pertains. This resulting measure, known as the coefficient of variation (CV) of an estimate, is obtained by dividing the standard error of the estimate by the estimate itself and is expressed as a percentage of the estimate. For example, suppose that, based upon the survey results, one estimates that 35.48% of Canadians who had a change in employment between July and December 1995 had medical benefits in their job (variable E1QB23) and this estimate is found to have a standard error of 0.0095. Then the coefficient of variation of the estimate is calculated as: ⎛ 0 . 0095 ⎞ ⎜ ⎟ X 100 % = 2 .67 % ⎝ 0 . 3548 ⎠ There is more information on the calculation of coefficients of variation in Chapter 10.0. Special Surveys Division 25 Changes in Employment Survey, Cohorts 1 to 10 – User Guide 9.0 Guidelines for Tabulation, Analysis and Release This chapter of the documentation outlines the guidelines to be adhered to by users tabulating, analyzing, publishing or otherwise releasing any data derived from the survey microdata files. With the aid of these guidelines, users of microdata should be able to produce the same figures as those produced by Statistics Canada and, at the same time, will be able to develop currently unpublished figures in a manner consistent with these established guidelines. 9.1 Rounding Guidelines In order that estimates for publication or other release derived from these microdata files correspond to those produced by Statistics Canada, users are urged to adhere to the following guidelines regarding the rounding of such estimates: a) Estimates in the main body of a statistical table are to be rounded to the nearest hundred units using the normal rounding technique. In normal rounding, if the first or only digit to be dropped is 0 to 4, the last digit to be retained is not changed. If the first or only digit to be dropped is 5 to 9, the last digit to be retained is raised by one. For example, in normal rounding to the nearest 100, if the last two digits are between 00 and 49, they are changed to 00 and the preceding digit (the hundreds digit) is left unchanged. If the last digits are between 50 and 99 they are changed to 00 and the preceding digit is incremented by 1. b) Marginal sub-totals and totals in statistical tables are to be derived from their corresponding unrounded components and then are to be rounded themselves to the nearest 100 units using normal rounding. c) Averages, proportions, rates and percentages are to be computed from unrounded components (i.e. numerators and/or denominators) and then are to be rounded themselves to one decimal using normal rounding. In normal rounding to a single digit, if the final or only digit to be dropped is 0 to 4, the last digit to be retained is not changed. If the first or only digit to be dropped is 5 to 9, the last digit to be retained is increased by 1. d) Sums and differences of aggregates (or ratio) are to be derived from their corresponding unrounded components and then are to be rounded themselves to the nearest 100 units (or the nearest one decimal) using normal rounding. e) In instances where, due to technical or other limitations, a rounding technique other than normal rounding is used resulting in estimates to be published or otherwise released which differ from corresponding estimates published by Statistics Canada, users are urged to note the reason for such differences in the publication or release document(s). f) 9.2 Under no circumstances are unrounded estimates to be published or otherwise released by users. Unrounded estimates imply greater precision than actually exists. Sample Weighting Guidelines for Tabulation The sample design used for the Changes in Employment Survey (CIES) was not self-weighting. When producing simple estimates, including the production of ordinary statistical tables, users must apply the proper sampling weight. If proper weights are not used, the estimates derived from the microdata files cannot be considered to be representative of the survey population, and will not correspond to those produced by Statistics Canada. 26 Special Surveys Division Changes in Employment Survey, Cohorts 1 to 10 – User Guide Users should also note that some software packages may not allow the generation of estimates that exactly match those available from Statistics Canada, because of their treatment of the weight field. 9.3 Categorical Estimates Before discussing how the CIES data can be tabulated and analyzed, it is useful to describe the type of point estimates of population characteristics which can be generated from the microdata file for the CIES. Categorical estimates are estimates of the number, or percentage of the surveyed population possessing certain characteristics or falling into some defined category. The number of persons who did any volunteer or community work to improve their employment opportunities at any time after [Record of Employment (ROE) date] or the proportion of persons who did this on a mostly part-time basis are examples of such estimates. An estimate of the number of persons possessing a certain characteristic may also be referred to as an estimate of an aggregate. Examples of Categorical Questions Q: R: Did you do any volunteer or community work SPECIFICALLY to improve your EMPLOYMENT OPPORTUNITIES at any time after [ROE date]? Yes / No Q: R: Was this (volunteer/community work) mostly full-time or part-time? Full-time / Part-time 9.3.1 Tabulation of Categorical Estimates Estimates of the number of people with a certain characteristic can be obtained from the microdata file by summing the final weights of all records possessing the characteristic(s) of interest. Proportions and ratios of the form Xˆ / Yˆ are obtained by: a) summing the final weights of records having the characteristic of interest for the numerator ( Xˆ ), b) summing the final weights of records having the characteristic of interest for the denominator ( Yˆ ), then c) dividing estimate a) by estimate b) ( Xˆ 9.4 / Yˆ ). Guidelines for Statistical Analysis The CIES is based upon a complex sample design, with stratification, multiple stages of selection, and unequal probabilities of selection of respondents. Using data from such complex surveys presents problems to analysts because the survey design and the selection probabilities affect the estimation and variance calculation procedures that should be used. In order for survey estimates and analyses to be free from bias, the survey weights must be used. While many analysis procedures found in statistical packages allow weights to be used, the meaning or definition of the weight in these procedures may differ from that which is appropriate in a sample survey framework, with the result that while in many cases the estimates produced by the packages are correct, the variances that are calculated are poor. Approximate variances for simple estimates such as totals, proportions and ratios (for qualitative variables) can be derived using the accompanying Coefficient of Variation Extraction Module for pre-determined variables. Special Surveys Division 27 Changes in Employment Survey, Cohorts 1 to 10 – User Guide For other analysis techniques (for example linear regression, logistic regression and analysis of variance), a method exists which can make the variances calculated by the standard packages more meaningful, by incorporating the unequal probabilities of selection. The method rescales the weights so that there is an average weight of 1. For example, suppose that analysis of all male respondents is required. The steps to rescale the weights are as follows: 1) select all respondents from the file who reported P1GF2 = male; 2) calculate the AVERAGE weight for these records by summing the original person weights from the microdata file for these records and then dividing by the number of respondents who reported P1GF2 = male; 3) for each of these respondents, calculate a RESCALED weight equal to the original person weight divided by the AVERAGE weight; 4) perform the analysis for these respondents using the RESCALED weight. However, because the stratification and clustering of the sample’s design are still not taken into account, the variance estimates calculated in this way are likely to be under-estimates. The calculation of more precise variance estimates requires detailed knowledge of the design of the survey. Such detail cannot be given in this microdata file because of confidentiality. Variances that take the complete sample design into account can be calculated for many statistics by Statistics Canada on a cost-recovery basis 9.5 Coefficient of Variation Release Guidelines Before releasing and/or publishing any estimates from the CIES, users should first determine the quality level of the estimate. The quality levels are acceptable, marginal and unacceptable. Data quality is affected by both sampling and non-sampling errors as discussed in Chapter 8.0. However for this purpose, the quality level of an estimate will be determined only on the basis of sampling error as reflected by the coefficient of variation as shown in the table below. Nonetheless users should be sure to read Chapter 8.0 to be more fully aware of the quality characteristics of these data. First, the number of respondents who contribute to the calculation of the estimate should be determined. If this number is less than 30, the weighted estimate should be considered to be of unacceptable quality For weighted estimates based on sample sizes of 30 or more, users should determine the coefficient of variation of the estimate and follow the guidelines below. These quality level guidelines should be applied to rounded weighted estimates. All estimates can be considered releasable. However, those of marginal or unacceptable quality level must be accompanied by a warning to caution subsequent users. 28 Special Surveys Division Changes in Employment Survey, Cohorts 1 to 10 – User Guide Quality Level Guidelines Quality Level of Estimate Guidelines 1) Acceptable Estimates have a sample size of 30 or more, and low coefficients of variation in the range of 0.0% to 16.5%. No warning is required. 2) Marginal Estimates have a sample size of 30 or more, and high coefficients of variation in the range of 16.6% to 33.3%. Estimates should be flagged with the letter M (or some similar identifier). They should be accompanied by a warning to caution subsequent users about the high levels of error, associated with the estimates. 3) Unacceptable Estimates have a sample size of less than 30, or very high coefficients of variation in excess of 33.3%. Statistics Canada recommends not to release estimates of unacceptable quality. However, if the user chooses to do so then estimates should be flagged with the letter U (or some similar identifier) and the following warning should accompany the estimates: “Please be warned that these estimates [flagged with the letter U] do not meet Statistics Canada’s quality standards. Conclusions based on these data will be unreliable, and most likely invalid.” Special Surveys Division 29 Changes in Employment Survey, Cohorts 1 to 10 – User Guide 10.0 Variance Calculation The Changes in Employment Survey (CIES) is a probabilistic survey i.e. a sample has been selected to represent the target population. A given variability is inherent in any random selection. This variability is known as the sampling error, as described in Chapter 8.0. In addition, adjustments have been made to take into account the non-response. The measure of this variability is known as the variance. This chapter explains why it is important to calculate the variance and presents the tool to do so. 10.1 Importance of the Variance The variance of an estimate is a good indicator of the quality of the estimate. A high variance estimate is considered unreliable. In order to quantify a large variance, a relative measure of the variability is used, namely the coefficient of variation (CV). The coefficient of variation is defined as the ratio of the square root of the variance over the estimate. The square root of the variance is also known as a standard deviation. The coefficient of variation, as opposed to the variance, allows the analyst to compare estimates of different magnitudes along the same scale. As a result, it is possible to assess the quality of any estimate with the CV. Also, the variance or the CV is required for statistical tests such as hypothesis tests, which determine if two estimates are statistically different. Consequently, variance or CV calculation is mandatory. 10.2 Variance and Coefficient of Variation Calculation The CIES sample has been drawn in such a way that it is possible to use tools developed by Statistics Canada to obtain precise variance estimates for pre-determined variables. A database has been created with these estimates. The Coefficient of Variation Extraction Module (CVEM) is a user-friendly way of accessing the data. Variance estimates are available for totals and proportions. More details are available in the CVEM User Guide. 10.3 How to Use the Coefficient of Variation Extraction Module for Categorical Estimates The following rules should enable the user to determine the approximate coefficients of variation from the CVEM for estimates of the number, proportion or percentage of the surveyed population possessing a certain characteristic and for ratios and differences between such estimates. Rule 1: Estimates of Numbers of Persons Possessing a Characteristic (Aggregates) The coefficient of variation is directly available from the CVEM by choosing Size as the estimator for pre-determined variables. Rule 2: Estimates of Proportions or Percentages of Persons Possessing a Characteristic The coefficient of variation is directly available from the CVEM by choosing Ratio as the estimator for pre-determined variables. Rule 3: Estimates of Differences Between Aggregates or Percentages The standard error of a difference between two estimates is approximately equal to the square root of the sum of squares of each standard error considered separately. That is, the standard ( ) error of a difference dˆ = Xˆ 1 − Xˆ 2 is: Special Surveys Division 31 Changes in Employment Survey, Cohorts 1 to 10 – User Guide σ dˆ (Xˆ 1α 1 )2 + (Xˆ 2α 2 )2 where Xˆ 1 is estimate 1, Xˆ 2 is estimate 2, and α 1 and α 2 are the coefficients of variation of Xˆ 1 and Xˆ 2 respectively. The coefficient of variation of dˆ is given by σdˆ / dˆ . This formula is accurate for the difference between separate and uncorrelated characteristics, but is only approximate otherwise. Rule 4: Estimates of Ratios In the case where the numerator is a subset of the denominator, the ratio should be converted to a percentage and Rule 2 applied. This would apply, for example, to the case where the denominator is the number of employees who had a change in employment and the numerator is the number of permanent employees who had a change in employment in the reference period. In the case where the numerator is not a subset of the denominator, as for example, the ratio of the number of permanent employees who had a change in employment as compared to the number of seasonal employees who had a change in employment the standard error of the ratio of the estimates is approximately equal to the square root of the sum of squares of each coefficient of variation considered separately multiplied by Rˆ . That is, the standard error of a ( ) ratio Rˆ = Xˆ 1 / Xˆ 2 is: σ Rˆ = Rˆ α12 + α 2 2 where α1 and α2 are the coefficients of variation of Xˆ 1 and Xˆ 2 respectively. The coefficient of variation of Rˆ is given by σ Rˆ / Rˆ . The formula will tend to overstate the error if Xˆ 1 and Xˆ 2 are positively correlated and understate the error if Xˆ 1 and Xˆ 2 are negatively correlated. Rule 5: Estimates of Differences of Ratios In this case, Rules 3 and 4 are combined. The CVs for the two ratios are first determined using Rule 4, and then the CV of their difference is found using Rule 3. 10.3.1 Examples of Using the Coefficient of Variation Extraction Module for Categorical Estimates The following examples based on Cohorts 1 and 2 of the CIES are included to assist users in applying the foregoing rules. Example 1: Estimates of Numbers of Persons Possessing a Characteristic (Aggregates) The user should refer to Example 1 in the CVEM User Guide. Example 2: Estimates of Proportions or Percentages of Persons Possessing a Characteristic The user should refer to Example 2 in the CVEM User Guide. 32 Special Surveys Division Changes in Employment Survey, Cohorts 1 to 10 – User Guide Example 3: Estimates of Differences Between Aggregates or Percentages Suppose that a user estimates that 37.3% of male employees who had a change in employment had medical benefits in their job and 32.9% of female employees who had a change in employment had medical benefits in their job. How does the user determine the coefficient of variation of the difference between these two estimates? 1) Using the Ratio estimator in the CVEM in the same manner as described in Example 2 in the CVEM User Guide gives the CV of the estimate for men as 3.3%, and the CV of the estimate for women as 4.6%. ( ) 2) Using Rule 3, the standard error of a difference dˆ = Xˆ 1 − Xˆ 2 is: σ dˆ = (Xˆ α ) + (Xˆ α ) 2 1 1 2 2 2 where Xˆ 1 is estimate 1 (men), Xˆ 2 is estimate 2 (women), and α1 and α2 are the coefficients of variation of Xˆ 1 and Xˆ 2 respectively. That is, the standard error of the difference σ dˆ = = dˆ = 0.373 – 0.329 = 0.044 is: [(0.373)(0.033)]2 + [(0.329 )(0.046 )]2 (0.000152 ) + (0.000229 ) = 0.020 3) The coefficient of variation of dˆ is given by σ dˆ / dˆ = 0.020 / 0.044 = 0.455 4) So the approximate coefficient of variation of the difference between the estimates is 45.5%. The difference between the estimates is considered unacceptable and Statistics Canada recommends this estimate not be released. However, should the user choose to do so, the estimate should be flagged with the letter U (or some similar identifier) and be accompanied by a warning to caution subsequent users about the high levels of error associated with the estimate. Example 4: Estimates of Ratios Suppose that the user estimates that 565,638 male employees who had a change in employment had medical benefits in their job and 361,818 female employees who had a change in employment had medical benefits in their job. The user is interested in comparing the estimate of women versus that of men in the form of a ratio. How does the user determine the coefficient of variation of this estimate? 1) First of all, this estimate is a ratio estimate, where the numerator of the estimate ( Xˆ 1 ) is the number of female employees who had a change in employment and medical benefits in their job. The denominator of the estimate ( Xˆ 2 ) is the number of male employees who had a change in employment and medical benefits in their job. 2) Refer to the Size estimator in the CVEM. Special Surveys Division 33 Changes in Employment Survey, Cohorts 1 to 10 – User Guide 3) The numerator of this ratio estimate is 361,818. Using the CVEM, the coefficient of variation for this estimate is 4.7%. 4) The denominator of this ratio estimate is 565,638. Using the CVEM, the coefficient of variation for this estimate is 3.4%. 5) So the approximate coefficient of variation of the ratio estimate is given by Rule 4, which is: α Rˆ = α 1 2 + α 2 2 where is: α1 and α2 α Rˆ = are the coefficients of variation of Xˆ 1 and Xˆ 2 respectively. That (0.047 )2 + (0.034 )2 = 0 .002209 + 0 .001156 = 0 .058 6) The obtained ratio of female employees versus male employees who had a change in employment and medical benefits in their job is 361,818 / 565,638 which is 0.64 (to be rounded according to the rounding guidelines in Section 9.1). The coefficient of variation of this estimate is 5.8%, which makes the estimate releasable with no qualifications. Example 5: Estimates of Differences of Ratios Suppose that the user estimates that the ratio of female employees to male employees who had a change in employment and medical benefits in their job is 0.64 while it is 0.62 for female employees to male employees with a dental plan. The user is interested in comparing the two ratios to see if there is a statistical difference between them. How does the user determine the coefficient of variation of the difference? 1) First calculate the approximate coefficient of variation for the medical benefits ratio ( Rˆ 1 ) and the dental plan ratio ( Rˆ 2 ) as in Example 4. The approximate CV for the medical benefits ratio is 5.8% and 6.1% for the dental plan ratio. 2) Using Rule 3, the standard error of a difference ( dˆ = Rˆ1 − Rˆ 2 ) is: σ dˆ = where α1 and α2 (Rˆ α ) + (Rˆ α ) 2 1 1 2 2 2 are the coefficients of variation of Rˆ 1 and Rˆ 2 respectively. That is, the standard error of the difference σ dˆ = = dˆ = 0.64 – 0.62 = 0.02 is: [(0.64 )(0.058)]2 + [(0.62 )(0.061)]2 (0.001378 ) + (0.001430 ) = 0.053 34 Special Surveys Division Changes in Employment Survey, Cohorts 1 to 10 – User Guide 3) The coefficient of variation of dˆ is given by σ dˆ / dˆ = 0.053 / 0.02 = 2.65. 4) So the approximate coefficient of variation of the difference between the estimates is 265%. The difference between the estimates is considered unacceptable and Statistics Canada recommends this estimate not be released. However, should the user choose to do so, the estimate should be flagged with the letter U (or some similar identifier) and be accompanied by a warning to caution subsequent users about the high levels of error, associated with the estimate. 10.4 How to Use the Coefficient of Variation Extraction Module to Obtain Confidence Limits Although coefficients of variation are widely used, a more intuitively meaningful measure of sampling error is the confidence interval of an estimate. A confidence interval constitutes a statement on the level of confidence that the true value for the population lies within a specified range of values. For example a 95% confidence interval can be described as follows: If sampling of the population is repeated indefinitely, each sample leading to a new confidence interval for an estimate, then in 95% of the samples the interval will cover the true population value. Using the standard error of an estimate, confidence intervals for estimates may be obtained under the assumption that under repeated sampling of the population, the various estimates obtained for a population characteristic are normally distributed about the true population value. Under this assumption, the chances are about 68 out of 100 that the difference between a sample estimate and the true population value would be less than one standard error, about 95 out of 100 that the difference would be less than two standard errors, and about 99 out of 100 that the difference would be less than three standard errors. These different degrees of confidence are referred to as the confidence levels. Confidence intervals for an estimate, Xˆ , are generally expressed as two numbers, one ( ) below the estimate and one above the estimate, as Xˆ − k , Xˆ + k where k is determined depending upon the level of confidence desired and the sampling error of the estimate. Confidence intervals for an estimate can be calculated directly from the CVEM by first determining the coefficient of variation of the estimate Xˆ (or the standard error), and then using the following formulas to convert to a confidence interval ( CI xˆ ). Using the coefficient of variation Using the standard error Where α xˆ ( CI xˆ = Xˆ − tXˆ α xˆ , Xˆ + tXˆ α xˆ ( CI xˆ = Xˆ − tσˆ xˆ , Xˆ + tσˆ xˆ is the determined coefficient of variation of Xˆ and ). ). σˆ xˆ is the determined standard error of Xˆ , and t t t t Special Surveys Division = 1 if a 68% confidence interval is desired; = 1.6 if a 90% confidence interval is desired; = 2 if a 95% confidence interval is desired; = 2.6 if a 99% confidence interval is desired. 35 Changes in Employment Survey, Cohorts 1 to 10 – User Guide Note: Release guidelines which apply to the estimate also apply to the confidence interval. For example, if the estimate is not releasable, then the confidence interval is not releasable either. 10.4.1 Example of Using the Coefficient of Variation Extraction Module to Obtain Confidence Limits A 95% confidence interval for the estimated ratio of female employees to male employees who had a change in employment and medical benefits in their job (from Example 4, Section 10.3.1) would be calculated as follows: Xˆ = 0.64 t = 2 α xˆ = 5.8% (0.058 expressed as a proportion) is the coefficient of variation of this estimate as determined from the tables. CI xˆ = {0.64 – (2) (0.64) (0.058), 0.64 + (2) (0.64) (0.058)} CI xˆ = {0.64 – 0.07, 0.64 + 0.07} CI xˆ = {0.57, 0.71} With 95% confidence it can be said that the ratio of female employees to male employees who had a change in employment and medical benefits in their job is between 0.57 and 0.71. 10.5 How to Use the Coefficient of Variation Extraction Module to Do a T-test Standard errors may also be used to perform hypothesis testing, a procedure for distinguishing between population parameters using sample estimates. The sample estimates can be numbers, averages, percentages, ratios, etc. Tests may be performed at various levels of significance, where a level of significance is the probability of concluding that the characteristics are different when, in fact, they are identical. Let Xˆ 1 and Xˆ 2 be sample estimates for two characteristics of interest. Let the standard error on the difference Xˆ 1 − Xˆ 2 be If t = Xˆ 1 − Xˆ 2 σ dˆ σ dˆ . is between -2 and 2, then no conclusion about the difference between the characteristics is justified at the 5% level of significance. If however, this ratio is smaller than -2 or larger than +2, the observed difference is significant at the 0.05 level. That is to say that the difference between the estimates is significant. 36 Special Surveys Division Changes in Employment Survey, Cohorts 1 to 10 – User Guide 10.5.1 Example of Using the Coefficient of Variation Extraction Module to Do a T-test Let us suppose that the user wishes to test, at 5% level of significance, the hypothesis that there is no difference between the proportion of male employees who had a change in employment and medical benefits in their job and the proportion of female employees who had a change in employment and medical benefits in their job. From Example 3, Section 10.3.1, the standard error of the difference between these two estimates was found to be 0.020. Hence, t= Xˆ 1 − Xˆ 2 σ dˆ = 0.373 − 0.329 0.044 = = 2.2 0.020 0.020 Since t = 2.2 is greater than 2, it must be concluded that there is a significant difference between the two estimates at the 0.05 level of significance. 10.6 Coefficient of Variation Extraction Module The file CVEM - MECV.xls contains the Coefficient of Variation Extraction Module (CVEM). The five database files listed below are required to be in the same directory as the CVEM - MECV.xls file. tab_C0102.xls tab_C0304.xls tab_C0506.xls tab_C0708.xls tab_C0910.xls The file CIES_Cohort1to10_UgE_CVEM.pdf contains the User Guide for the CVEM. Special Surveys Division 37 Changes in Employment Survey, Cohorts 1 to 10 – User Guide 11.0 Weighting The final weight included on each Changes in Employment Survey (CIES) public use microdata file (PUMF) record is a combined weight based on the weights from each individual CIES reference quarter. All records on the file represent CIES respondents who gave permission to share their data with Human Resources Development Canada (HRDC) and, as such, all records have a positive, non-zero weight. The weights are based on whether a respondent was part of the community sample or the provincial sample but the weight calculations for both are done using the same principles. Here are the steps taken to produce the final survey weights: Identification and classification of survey respondents. A person is classified as a respondent if he/she completes a specific portion of the questionnaire. Of those people, only those who gave permission to share their responses with HRDC are considered respondents with regards to weighting. Adjustment of sampling weights for non-response. Calibration of weights. This calibration accounts for the fact that the frame may not be complete at the time each quarterly sample is selected. Adjustment of weights based on domain group. A single Social Insurance Number (SIN), semi-annual frame file is created and all SINs are divided into domains. The domain groups account for the duplication of SINs on the frame files for each reference quarter and represent one of the three following possibilities: the SIN is only on the frame for CIES reference Quarter 1, the SIN is only on the frame for reference Quarter 2, or the SIN is on both frames. Combined calibration of weights. This calibration accounts for the difference in size between the semi-annual frame files (single record per SIN) and the semi-annual sampling frames. This is the final weight that appears on the PUMF. The final weight must be used to derive meaningful estimates from the survey. For example, if the number of individuals whose job ended due to a layoff during the past 12 months is to be estimated, it is done by selecting the records referring to those individuals in the sample with that characteristic and summing the weights entered on those records. Users of these files should note that a key concept with regards to the combined cohort estimates and the individual cohort estimates, is that, for the CIES, the unit of analysis is the person, not the job separation. For individual cohorts, the CIES estimates represented the number of people who experienced at least one job separation within a given three month period. For combined cohorts, the counts represented the number of people who experienced a job separation within a given six month period. The total number of people who experienced at least one job separation in a six month period is not the same as the sum of the number of people who experienced a job separation in the first cohort plus the number of people who experienced a job separation in the second cohort; the number of people who experience job separations in consecutive cohorts is significant. This “overlap” was determined by matching the CIES frame files provided by Human Resources Development Canada for the cohorts being combined. When the frame files for the combined cohorts were brought together, the removal of duplicates resulted in decreases in the file sizes and in the total weighted counts. This decrease in total weighted counts represents those people who experienced job separations in both three month periods. Special Surveys Division 39 Changes in Employment Survey, Cohorts 1 to 10 – User Guide 12.0 Questionnaire The Changes in Employment Survey (CIES) questionnaires that were used to collect the information for the CIES underwent a number of minor revisions over the various collection periods for the survey. The three files referenced below contain the three versions of the English questionnaire. CIES_C01_W1_QuestE.pdf CIES_C02 to 04_W1_QuestE.pdf CIES_C05 to 10_W1_QuestE.pdf Special Surveys Division 41 Changes in Employment Survey, Cohorts 1 to 10 – User Guide 13.0 Record Layout with Univariate Frequencies Consult the five files referenced below containing the record layouts with univariate counts for the microdata files created for the Changes in Employment Survey (CIES). CIES1995_C0102_W1_CdBk.pdf CIES_Jan-June_1996_C0304_W1_CdBk.pdf CIES_July-Dec_1996_C0506_W1_CdBk.pdf CIES_Jan-June_1997_C0708_W1_CdBk.pdf CIES_July-Dec_1997_C0910_W1_CdBk.pdf Special Surveys Division 43