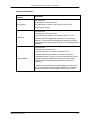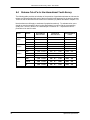
1
Microdata User Guide
International Youth Survey
2006
International Youth Survey, 2006 – User Guide
Table of Contents
1.0
Introduction
............................................................................................................................... 5
2.0
Background
............................................................................................................................... 7
3.0
Objectives
............................................................................................................................... 9
4.0
Concepts and Definitions............................................................................................................ 11
5.0
Survey Methodology.................................................................................................................... 13
5.1
Population Coverage......................................................................................................... 13
5.2
Sample Design.................................................................................................................. 13
5.2.1 Stratification ......................................................................................................... 13
5.2.2 Sample Selection ................................................................................................. 13
5.2.3 Sample Size and Allocation ................................................................................. 13
6.0
Data Collection ............................................................................................................................. 15
6.1
Questionnaire Design ....................................................................................................... 15
6.2
Field Operations................................................................................................................ 15
7.0
Data Processing ........................................................................................................................... 19
7.1
Data Capture..................................................................................................................... 19
7.2
Editing ............................................................................................................................. 19
7.3
Coding of Open-ended Questions .................................................................................... 19
7.4
Creation of Derived Variables ........................................................................................... 19
7.5
Weighting .......................................................................................................................... 21
7.6
Suppression of Confidential Information ........................................................................... 21
8.0
Data Quality
............................................................................................................................. 23
8.1
Response Rates................................................................................................................ 23
8.2
Survey Errors .................................................................................................................... 23
8.2.1 The Frame............................................................................................................ 24
8.2.2 Data Collection.................................................................................................................. 24
8.2.3 Data Processing................................................................................................................ 24
8.2.4 Non-response.................................................................................................................... 25
8.2.5 Measurement of Sampling Error ....................................................................................... 25
9.0
Guidelines for Tabulation, Analysis and Release..................................................................... 27
9.1
Rounding Guidelines......................................................................................................... 27
9.2
Sample Weighting Guidelines for Tabulation.................................................................... 27
9.3
Definitions of Types of Estimates: Categorical and Quantitative...................................... 28
9.3.1 Categorical Estimates .......................................................................................... 28
9.3.2 Quantitative Estimates ......................................................................................... 28
9.3.3 Tabulation of Categorical Estimates .................................................................... 29
9.3.4 Tabulation of Quantitative Estimates ................................................................... 29
9.4
Guidelines for Statistical Analysis ..................................................................................... 29
9.5
Coefficient of Variation Release Guidelines ..................................................................... 30
9.6
Release Cut-off’s for the International Youth Survey........................................................ 32
Special Surveys Division
3
International Youth Survey, 2006 – User Guide
10.0
Approximate Sampling Variability Tables ................................................................................. 33
10.1
How to Use the Coefficient of Variation Tables for Categorical Estimates....................... 33
10.1.1 Examples of Using the Coefficient of Variation Tables for Categorical
Estimates ............................................................................................................. 35
10.2
How to Use the Coefficient of Variation Tables to Obtain Confidence Limits................... 38
10.2.1 Example of Using the Coefficient of Variation Tables to Obtain Confidence
Limits.................................................................................................................... 39
10.3
How to Use the Coefficient of Variation Tables to Do a T-test ......................................... 40
10.3.1 Example of Using the Coefficient of Variation Tables to Do a T-test................... 40
10.4
Coefficients of Variation for Quantitative Estimates.......................................................... 40
10.5
Coefficient of Variation Tables .......................................................................................... 41
11.0
Weighting
12.0
Questionnaire ............................................................................................................................. 47
13.0
Record Layout with Univariate Frequencies ............................................................................. 49
4
............................................................................................................................. 43
Special Surveys Division
International Youth Survey, 2006 – User Guide
1.0
Introduction
The International Youth Survey (IYS) was conducted by Statistics Canada in the spring of 2006 with the
cooperation and support of the National Crime Prevention Centre (NCPC) a division of the Department of
Public Safety and Emergency Preparedness Canada. This manual has been produced to facilitate the
manipulation of the microdata file of the survey results.
Any question about the data set or its use should be directed to:
Statistics Canada
Client Services
Special Surveys Division
Telephone: 613-951-3321 or call toll-free 1-800-461-9050
Fax: 613-951-4527
E-mail: [email protected]
Public Safety and Emergency Preparedness Canada
Lucie Léonard
National Crime Prevention Centre
22 Queen Street, 12th Floor
Ottawa, Ontario
K1A 0P8
Telephone: 613-957-6362
Fax: 613-941-9013
E-mail: [email protected]
Special Surveys Division
5
International Youth Survey, 2006 – User Guide
2.0
Background
There has always been a serious interest among researchers, policymakers, educators and the general
public about youth behaviour and especially about youth misbehaviour. Statistics on youth delinquency
based on data from police sources refer only to reported acts of mischief or crime. Police and court
statistics represent a very small fraction of misbehaving youth and contain very little information about the
family or personal situation of the youth. To study misbehaviour in the context of relationships or bonds
with parents, school, and friends, youth needs to be interviewed directly.
The International Self-report Delinquency Study (ISRD), was initiated by the Research and
Documentation Center of the Dutch Ministry of Justice and first conducted in 1992 in 13 European
countries and the state of Nebraska in the United States. The study analyzed and interpreted data
illuminating the linkages among delinquency, age, gender and various risk factors. Selected measures of
family and school-based social control were employed to further explore those relationships. The role of
peers and leisure activities in the behaviour of youth was also examined. Due to a significant interest in
the findings which emerged from the first study, it was decided to conduct a second ISRD (ISRD-2) in
2006.
The National Crime Prevention Centre of the federal Department of Public Safety and Emergency
Preparedness Canada sponsored the Canadian participation in the second round of the international
study which again examined the behaviour and misbehaviour of students in grades 7 to 9, but this time in
about 30 countries, mainly in Europe.
For the Canadian portion of the study, named after the title of the survey’s questionnaire the International
Youth Survey (IYS), the value of its findings was enhanced by concentrating the sample within one large
urban centre where survey data could be examined together with other data, such as local census and
crime data at the neighbourhood level. The city of Toronto was chosen as the most suitable urban area
where Statistics Canada could conduct the survey and on which the analysis of results could focus.
Special Surveys Division
7
International Youth Survey, 2006 – User Guide
3.0
Objectives
The International Youth Survey (IYS) provides comprehensive information about the misbehaviour of
young people and addresses important questions related to risk and protective factors for misbehaviour,
and how schools and communities can assist high risk children to develop pro-social behaviours and
positive school outcomes.
The survey collected information on the following topics:
•
•
•
•
•
•
•
•
•
•
Family background and family bonds;
Friendships and spare time activities;
Attachment to school and the neighbourhood;
Commitment to school measured by self-reported performance and attendance;
Personal and family traumatic experiences;
Use of alcohol and drugs;
The incidence of various kinds of delinquent behaviour (e.g. vandalism, theft, violence, illegal
use of the internet);
Beliefs concerning the violent behaviour of young people;
Self-reported impulsivity, ability to control anger, penchant for risky behaviour; and
Time devoted to paid and voluntary work.
By using almost the same questionnaire and data collection method as other countries, the IYS makes
possible comparisons of the prevalence of types of youth misbehaviour in industrialized countries and
examination of cross national variability in correlates of self-reported delinquent behaviour.
Special Surveys Division
9
International Youth Survey, 2006 – User Guide
4.0
Concepts and Definitions
This chapter outlines concepts and definitions of interest to the users. Users are referred to Chapter 12.0
of this document for a copy of the actual survey questionnaire used.
Delinquent behaviours – All behaviours in violation of the Criminal Code of Canada perpetrated by
youth aged 12 to 17. Note that drinking alcohol, smoking, and using drugs, although covered by the
survey are not treated as delinquent behaviour but as risk factors.
Victimization – An act that exploits or treats someone unfairly. In the International Youth Survey (IYS)
three kinds of victimization are explored:
•
•
•
Violent victimization that is robbery, theft or attempted theft in which the perpetrator had a
weapon or there was violence or the threat of violence against the victim. Violent victimization
also includes physical assault as in an attack (victim hit, slapped, grabbed, knocked down, or
beaten), a face-to-face threat of physical harm, or an incident with a weapon present.
Theft or attempted theft of personal property such as money, credit cards, clothing, jewellery, a
purse or a wallet (unlike robbery, the perpetrator does not confront the victim).
Bullying
Truancy – A deliberate absence(s) from school on the part of a student without the knowledge and
consent of a parent.
Definitions within questions - The IYS questionnaire includes a few definitions within questions where
respondents may need clarification or direction. Two examples of definitions or examples of concepts
found within the survey questionnaire are found below:
•
•
Question 15.4 - You were bullied at school (other students humiliated you or made fun of you, hit
or kicked you, or excluded you from their group)?
Question 70 – Have you ever done any ‘hacking’ (breaking through security into a website or a
computer account)?
Types of delinquency - The largest block of questions in the survey (Question 48 to Question 71) asks
about delinquent acts done by respondents and/or their friends. There are three types of delinquency that
these questions refer to:
•
•
•
violent offences,
property offences and,
offences related to the internet. Additionally, a specific delinquent activity, namely selling drugs or
acting as a middleman is covered here.
Violent offences include acts of physical violence as well as acts that are associated with potential
physical violence. Five questions ask about this type of delinquency and refer to snatching a purse or
something else from a person, carrying a weapon, threatening someone with a weapon or beating them
to get money, participation in a group fight, and beating up or hurting someone.
Property offences include theft of personal property, theft from stores, break and enter, damaging of
public or private property, and setting a fire.
Internet offences include downloading files without required payment, breaking through security into a
website or a computer account, sending harassing messages, sending pornography.
Special Surveys Division
11
International Youth Survey, 2006 – User Guide
5.0
Survey Methodology
The International Youth Survey (IYS) was administered in the city of Toronto to a sample of students in
grades 7 to 9. Youths attending public schools in the Toronto District School Board (TDSB) or private
schools in the Toronto Metropolitan Area in April and May 2006 were surveyed.
5.1
Population Coverage
The target population consists of students in grades 7, 8, and 9 attending a public school
belonging to the Toronto District School Board or private school in the Toronto Metropolitan Area,
at the time of collection. This represents roughly 60,000 youths. It is important to note that the
Toronto Catholic School Board declined to participate in this study, so are not part of the target
population and are not represented in the sample. It is estimated that students attending Catholic
schools represent approximately 25% of the student population in the Toronto Metropolitan Area.
Also, youths who have dropped out of school or for other reasons are not enrolled in schools, are
also not part of the target population. Young persons attending special schools were excluded
from the target population.
The population surveyed differs very slightly from the target population. Students enrolled in small
schools, in which enrolment counts for the entire grade is 10 or less, were excluded from
selection. This represents less than 0.5% of students in the target population, although the
proportion was higher in private schools than in the public board (3% versus less than 1%).
5.2
Sample Design
5.2.1
Stratification
Three variables were considered for stratification: grade, geographic area, and type of
school (public/private). Stratification using the three levels would have yielded strata that
were too small (with correspondingly high sampling fractions) therefore users were
consulted to identify the most important domains of interest for analysis. Based on
feedback, it was decided to stratify by grade and two geographic areas, yielding six
strata. The geographic areas were based on postal codes and were split in such a way
as to ensure, as much as possible, equal student populations. Sampling was done
independently in each stratum, meaning that some schools were selected more than
once, for different grades.
5.2.2
Sample Selection
In each stratum, schools were selected systematically with probability proportional to
size, with the size measure being the school enrolment count for the grade of interest.
Selection of classes was accomplished in the field by the Statistics Canada interviewer
who randomly selected one class in the desired grade. This translated into a final sample
of 210 classes in 176 schools being selected.
5.2.3
Sample Size and Allocation
The sample was allocated to the six strata using proportional allocation. It was calculated
that a sample size of 3,150 responding students was needed to yield a coefficient of
variation of 16.5% or less within each estimation domain based on a minimum proportion
of 12%. This sample size was then inflated to account for non-response. Based on
stratum population sizes the number of students required in each stratum was calculated,
from which the number of classes to select was estimated.
Special Surveys Division
13
Bernie
International Youth Survey, 2006 – User Guide
6.0
Data Collection
Data collection for the International Youth Survey took place in public and private schools in the city of
Toronto during the months of April and May, 2006. Interviews were conducted under the voluntary
provisions of the Statistics Act. Active parental consent was required from a student’s parents/guardians
before the student could participate in the survey. Finally, students did have the final option of not
completing the survey when it was being distributed by the interviewers at the beginning of the classroom
session.
6.1
Questionnaire Design
The Steering Group of the international study produced an English version of the draft
questionnaire (based to a large extent on the instrument used for the first study in 1992). This
draft was translated and tested in most of the participating countries by the research teams in the
school setting in the spring and early summer of 2005.
Before having the questionnaire pre-tested, the Statistics Canada (STC) team made a few
modifications to the instrument balancing between the need to preserve the original and the need
to make it read and look more appropriate for Canadian respondents.
A pre-test of the questionnaire was conducted in August 2005 by a market research company.
There were 34 participants recruited to represent grades 7 to 9, boys and girls, students with
English or French as the language of instruction, residents in or outside the urban area of OttawaGatineau, and average, above average and below average students (self-reported).
The participants were divided into six groups (boys and girls were interviewed separately). Each
group session lasted approximately two hours. First, participants listened to an explanation of
how the actual survey would be carried out in schools, next, they completed the paper
questionnaire, and finally, they presented their comments and answered the moderator’s probing
questions.
Based on the comments of the STC team and the results of the pre-test some revisions to the
international draft were suggested. They were presented during the discussion of the survey
instrument at an international meeting in 2005.
The final English draft of the questionnaire distributed by the international Steering Group
incorporated most of the STC recommendations, but not all of them.
This version required grammar and language edits, as well as minor modifications to the wording
and format of items to conform to STC standards. Once again, the questionnaire was tested, this
time informally, with a small group of Ottawa-Gatineau area students. Some further changes were
made; however, the scope of the changes had to be limited to preserve comparability of results.
6.2
Field Operations
Survey activities in schools were conducted from February to May 2006. They included mailing
an introductory letter to the sampled public and private schools in Toronto, selecting the classes
to participate in the survey and conducting classroom sessions during which students completed
paper questionnaires. These collection activities were preceded by a lengthy school board
approval process which began in September 2005.
Special Surveys Division
15
International Youth Survey, 2006 – User Guide
The following is a summary of the data collection process:
First Contact with School
Soon after the regional office mailed the introductory letters to the selected schools in
February 2006, interviewers telephoned each school to establish contact and obtain
collaboration from the principal or administrator.
If the school principal or administrator refused to participate the school was not replaced.
However, every effort was made to try and convert the principal or administrator to allow the
school to participate in the survey.
First Visit to School
Upon arrival at the school, the interviewer introduced himself/herself to the principal and
briefly outlined the collection activities. A labelled Classroom Selection Form was used to
control the collection activities. The form identified the grade that was selected for the
survey. If the school had more than one class for the grade selected, the interviewer used
the selection grid on the label to randomly select one of the classrooms.
The interviewer listed the name and, if known, the gender of each student in the selected
class. For each student the interviewer prepared a package to take home containing an
introductory letter and Parental Consent Form as well as a letter specifically intended for the
selected student. Due to the large number of new immigrants residing in Toronto a multilingual information sheet was also included for those parents who could have difficulty
communicating in either English or French.
The principal or class teacher was asked to distribute and control the receipt of the completed
Parental Consent Forms. The interviewer explained that he/she would return to the school at
a specified time and date to retrieve the completed consent forms.
Second Visit to School
During the second visit, the interviewer picked up the completed Parental Consent Forms and
scheduled an appointment for the classroom session.
The class teacher or other school contact was asked to distribute a reminder notice to
parents together with a copy of Parental Consent Form to students who did not return the
completed forms.
Unfortunately, the Toronto District School Board did not give approval to provide the parents’
telephone numbers. Consequently, the only way to follow-up the collection of these forms
was through the school administration. If consent forms were not signed by the parents and
returned by the students then the students could not participate in the survey.
Classroom Session (Third Visit to School)
The interviewer prepared a questionnaire for each eligible child. On the cover page of the
questionnaire the interviewer transcribed from the Classroom Selection Form the student’s
identification number composed of the school number, grade and an arbitrarily assigned
student number. The student's name was not written on the questionnaire to maintain
anonymity. The students’ names were only written on envelopes in which questionnaires
were given to students. The completed questionnaires were collected separately from the
envelopes.
Once in the classroom, the interviewer followed the process presented below:
• Introduced himself/herself to the students.
• Explained the purpose of the survey.
• Asked the teacher to distribute the envelopes and complimentary mechanical
pencils to the students.
16
Special Surveys Division
International Youth Survey, 2006 – User Guide
•
•
•
•
•
Read aloud the introduction on the front of the questionnaire.
Completed a few previously determined questions with the students to show
them how to make different types of entries.
Told students to feel free to raise their hand to ask questions quietly.
First gathered the envelopes with the students’ names on them and later
collected the completed questionnaires placing them in the Versapak (a locked
and secure soft-sided bag) for transport.
Thanked the students and the teacher for their co-operation and support.
The classroom sessions, on average, lasted approximately 40 to 50 minutes. Teachers were
asked to remain in the classroom, but not to circulate among the students to protect the
privacy and confidentiality of all students taking part in the survey.
Interviewers had to complete the Classroom Selection Form with the following information:
• Number of classes for the selected grade being surveyed
• Number of students in all classes for the selected grade
• Number of students in the selected classroom, number of boys/girls
• Number of students who did or did not return the Parental Consent Form
• Number of Parental Consent Forms returned with or without written parental
consent
Some of this information was used for the calculation of response and non-response rates.
There was also an area on the Classroom Selection Form where information specifically
requested by the international coordinating body was entered. The information collected in
this section of the form included:
• Type of school staff present (homeroom teacher, subject teacher or other)
• Gender of staff present
• Number of observers present (from 0 to 2 in total)
• Number of students absent that day
• Duration of classroom session in minutes from start to finish
Special Surveys Division
17
International Youth Survey, 2006 – User Guide
7.0
Data Processing
The main output of the International Youth Survey (IYS) is a “clean” microdata file. This chapter presents
a brief summary of the processing steps involved in producing this file.
7.1
Data Capture
All the IYS questionnaires were data captured using a digital imaging process at Statistics
Canada’s head office in Ottawa. In addition to this, the text responses that is “Other - Specify”
responses were keyed in as they were not be recognized by the digital imaging process. The
student identification numbers were verified 100% to avoid any keying errors. The quality of the
data capture task was checked by a random verification process of almost 20% of the records.
The error rate was below 1%.
7.2
Editing
The International Youth Survey questionnaire was designed with very few skip patterns. It was
felt that skips might not be correctly followed by the young respondents.
The survey team made the decision to edit the questionnaire using both a “top-down” and
“bottom-up” approach. To accomplish this task, flows had to be determined before the edit
programs could be written.
The first type of error treated were errors in the questionnaire flow, where questions which did not
apply to the respondent (and should therefore not have been answered) were found to contain
answers. In this case a computer edit automatically eliminated superfluous data by following the
flow of the questionnaire implied by answers to previous, and in some cases, subsequent
questions.
The second type of error treated involved a lack of information in questions which should have
been answered. For this type of error, a non-response or “not-stated” code was assigned to the
item.
The following standard Statistics Canada codes are used on the file:
6, 96, 996, etc. = Valid skip
7, 97, 997, etc. = Don't know
8, 98, 998, etc. = Refused
9, 99, 999, etc. = Not stated
7.3
Coding of Open-ended Questions
There were eight partially open-ended questions in the IYS questionnaire that contained a list of
answer categories that included a “Specify” or “Other – Specify” write-in category. For example,
question 3.1 asks respondents to specify which country they were born in if they were not born in
Canada. In that case, a standardized code set of Country of Birth was used to code the legible
answers that the respondents provided on the questionnaire.
7.4
Creation of Derived Variables
A number of data items on the microdata file have been derived by combining items on the
questionnaire in order to facilitate data analysis. For each derived variable, there is a note in the
codebook stating which survey questions were used to derive the variable and, if scores were
Special Surveys Division
19
International Youth Survey, 2006 – User Guide
calculated, how the scoring was done. The derived variables are found on the record layout
following the IYS questions that were part of their derivation.
There are two types of derived variables found on the file. Derived variables created using more
than one question or item are referred to as regular derived variables and are identified by
variable names beginning with a “D”. Derived variables created when a question has its
responses collapsed or grouped into fewer categories are identified by variable names beginning
with a “G” for “grouped”.
Examples of derived and grouped variables are presented below:
Variable Name: DYOTHSES
Questions used: Q11 Do you have a room of your own?
Q12 Do you have a computer at home that you are allowed to use?
Q13 Do you own a cell phone?
Q14 Does your family own a car?
Description: This derived variable combines four ”Yes/No” questions into one variable to
present an approximate measurement of the social-economic status (SES) of the student’s
household. The response categories created for the derived variable were:
1 Own/Have access to none, 1 or 2 items
2 Own/Have access to 3 or 4 items
9 Not stated
Variable Name: DVICTSCR
Questions used: Q15 Thinking back over the past 12 months, did any of the following
happen to you?
Q15_1A
Q15_2A
Q15_3A
Q15_4A
Someone wanted you to give him/her money…
Someone hit you violently…
Something was stolen from you…
You were bullied at school…
Description: This derived variable is a victimisation score indicating the number of kinds of
victimisation experienced by respondent in the past 12 months. It is the sum of the “Yes”
answers to the four questions listed above. The values range from 0 to 4.
Variable Name: G17
Question used: Q17 How do you usually get along with the woman you live with (your
mother or stepmother)?
Description: This grouped variable uses only the responses from Q17. The original response
categories and values were:
1 I get along just fine
2 I get along rather well
3 I don’t get along so well
4 I don’t get along at all
Response categories 1 and 2 were kept while categories 3 and 4 were grouped to create the
new grouped response
3 I don’t get along so well/at all
20
Special Surveys Division
International Youth Survey, 2006 – User Guide
7.5
Weighting
The principle behind estimation in a probability sample is that each person in the sample
“represents”, besides him or herself, several other persons not in the sample. For example, in a
simple random 2% sample of the population, each person in the sample represents 50 persons in
the population.
The weighting phase is a step which calculates, for each record, what this number is. This weight
appears on the microdata file, and must be used to derive meaningful estimates from the survey.
For example, if the number of students in grade 8 who ever had beer, coolers or wine (Q49) is to
be estimated, it is done by selecting the records referring to those individuals in the sample with
that characteristic and summing the weights entered on those records.
Details of the method used to calculate these weights are presented in Chapter 11.0.
7.6
Suppression of Confidential Information
It should be noted that the “Public Use” Microdata Files (PUMF) may differ from the survey
“master” files held by Statistics Canada. These differences usually are the result of actions taken
to protect the anonymity of individual survey respondents. The most common actions are the
suppression of file variables, grouping values into wider categories, and coding specific values for
individual records into the “not stated” category. Users requiring access to information excluded
from the microdata files may purchase custom tabulations. Estimates generated will be released
to the user, subject to meeting the guidelines for analysis and release outlined in Chapter 9.0 of
this document.
The survey master file includes several variables that were removed from the IYS PUMF as they
could potentially identify respondents. These include the respondent’s age, immigrant status,
country of birth, family composition, language spoken at home, parents’ employment status and
repetition of grade.
An example of grouping values is the student’s age which is asked at the onset of each of the
misbehaviour questions (questions 49 to 71). The student’s age was grouped into “Less than 10
years old” and “10 years old and older”.
For certain variables that were susceptible to identifying individuals, the PUMF was treated with
local suppression, that is, some of the values in the master file may have been coded as “not
stated” on the PUMF. There were 55 such suppressions affecting 12 variables.
Special Surveys Division
21
International Youth Survey, 2006 – User Guide
8.0
Data Quality
8.1
Response Rates
The following table summarizes the response rates to the International Youth Survey (IYS).
Overall
Student
Number of
Selected
Class
Responding
Students in Responding Response Response
Classes
Response
Classes
Rate ***
Rate **
Responding Students
Rate * (%)
(In-scope)
(%)
(%)
Classes
Grade
Grade 7
70
62
88.6
1,640
1,207
73.6
65.2
Grade 8
69
58
84.1
1,519
1,148
75.6
63.5
Grade 9
66
57
86.4
1,338
935
69.9
60.4
205
177
86.3
4,497
3,290
73.2
63.2
Total
Note:
Out of 210 selected classes, 5 were determined to be out-of-scope, meaning that the
school did not contain the grade for which it had been selected.
*
The class response rate is the number of responding classes as a percentage of the
number of in-scope selected classes.
**
The student response rate is the number of responding students as a percentage of the
number of students in responding classes.
***
The overall response rate is the class response rate multiplied by the student response
rate.
8.2
Survey Errors
The estimates derived from this survey are based on a sample of students. Somewhat different
estimates might have been obtained if a complete census had been taken using the same
questionnaire, interviewers, supervisors, processing methods, etc. as those actually used in the
survey. The difference between the estimates obtained from the sample and those resulting from
a complete count taken under similar conditions, is called the sampling error of the estimate.
Errors which are not related to sampling may occur at almost every phase of a survey operation.
Interviewers may misunderstand instructions, respondents may make errors in answering
questions, the answers may be incorrectly entered on the questionnaire and errors may be
introduced in the processing and tabulation of the data. These are all examples of non-sampling
errors.
Over a large number of observations, randomly occurring errors will have little effect on estimates
derived from the survey. However, errors occurring systematically will contribute to biases in the
survey estimates. Considerable time and effort were taken to reduce non-sampling errors in the
survey. Quality assurance measures were implemented at each step of the data collection and
processing cycle to monitor the quality of the data. These measures include the use of highly
skilled interviewers, extensive training of interviewers with respect to the survey procedures and
questionnaire, observation of interviewers to detect problems of questionnaire design or
misunderstanding of instructions, procedures to ensure that data capture errors were minimized,
and coding and edit quality checks to verify the processing logic.
Special Surveys Division
23
International Youth Survey, 2006 – User Guide
8.2.1
The Frame
For public schools, the Toronto District School Board (TDSB) provided Statistics Canada
(STC) with two administrative files from which the sampling frame was created. The first
file contained enrolment counts by grade for middle schools, containing grades 7 and 8.
Based on the source and timeliness, the frame was considered to be of better quality
than any other source available. The second file provided enrolment counts by age for
high schools. Since there were no counts by grade from the high school file, age was
used as a proxy for grade 9. For private schools, there was no “board” from which to
obtain up-to-date, quality information, therefore STC created a frame through current
available public sources and information from older existing STC frames.
The public school data was provided by the TDSB in the fall of 2006 for the current
school year and therefore reflected the most up-to-date information possible. Information
for grades 7 and 8 were considered to be of high quality. The information for grade 9
although not as high a quality, was still considered to be very good. Of the 185 classes
selected from public schools, 5 were determined to be out-of-scope in the field (meaning
that the school did not contain the grade for which it was selected) while none of the 25
classes selected from among the private schools were out-of-scope.
8.2.2
Data Collection
Only experienced Statistics Canada interviewers worked on this survey. Interviewer
training consisted of reading the Interviewer’s Manual and to ensure that they were
familiar with the concepts and procedures of the IYS all of the interviewers and senior
interviewers were given a one day classroom training session at the regional office in
Toronto in March 2006. The training included presentations and exercises by head office
staff.
During the data collection senior interviewers were responsible for supporting and
monitoring their interviewers. Project team members travelled to Toronto to observe
several classroom sessions. In almost all of the observed sessions both the interviewers
and the teachers behaved as expected.
At the beginning of the classroom session interviewers explained the purpose of the
survey and its confidential nature. They made it clear that students’ answers would be
protected and would not be shown to anybody at school, or to parents. The completed
questionnaires were placed in a special Statistics Canada versapak and taken out of the
school by the interviewer.
Most students behaved well and diligently completed the questionnaire. They wanted to
give accurate answers and asked for clarification when they were not sure how to
interpret a question or when they needed help with English (one third of respondents
were born outside Canada). In some sessions students were sitting too close to each
other and some did not respect the privacy of their neighbours.
The classroom sessions ran from the end of March 2006 to mid-May 2006.
8.2.3
Data Processing
The IYS questionnaires were data captured using a digital imagining process. The
student identification numbers were verified 100%, while 20% of the survey responses
were randomly selected for verification. The error rate was below 1%. For a record that
was not completely blank to be kept on the file it needed to have responses to four of five
24
Special Surveys Division
International Youth Survey, 2006 – User Guide
specific questions i.e., Q6, Q16, Q44, Q50, and Q55. Only 55 records did not meet this
condition.
Given that the questionnaire was designed as a self-complete instrument for young
respondents there were no explicit skip patterns. In some questions, there was a graphic
indication – an arrow pointing to a question that needed to be answered as a follow-up to
a specific response. During the editing process a bottom-up approach was used if the
original question was not answered and the follow-up question had an answer.
To preserve the original answers for the international comparisons, no consistency edits
were performed and outliers were not removed.
8.2.4
Non-response
A major source of non-sampling errors in surveys is the effect of non-response on the
survey results. The extent of non-response varies from partial non-response (failure to
answer just one or some questions) to total non-response.
There were two broad levels of non-response throughout the survey. First, some degree
of non-response was observed at the school level (expressed as responding classes in
the table in Section 8.1). This was mainly due to the principal not giving consent for the
survey, but in a few cases arose after classroom selection had taken place but no
students were surveyed. The second component of non-response relates to the students.
The response rate at the student level is derived based on the number of eligible
students recorded on the Classroom Selection Form in each of the participating classes.
Student non-response can be attributed to several factors: parental consent not being
obtained, student refused to participate, student was absent on the day of collection, or
the completed questionnaire did not contain sufficient information to be considered valid.
Total non-response was handled by adjusting the weight of individuals who responded to
the survey to compensate for those who did not respond.
In most cases, partial non-response to the survey occurred when the respondent did not
understand or misinterpreted a question, refused to answer a question, or could not recall
the requested information. In a self-complete paper and pencil survey some of the item
non-response results from insufficient attention or interest in the task.
The following three questions had a high level of non-response (i.e., Don’t know and Not
stated answers):
• Q36 People often differ with regard to their origin, their religion and their beliefs. Do
your parents approve of you having friends who belong to a different ethnic
group? 14%
• Q46 How much education do you think you will get? 10%
• Q71.1 Have you ever downloaded music or films from the Internet? Did you think it
was illegal (pirated)? 27%
8.2.5
Measurement of Sampling Error
Since it is an unavoidable fact that estimates from a sample survey are subject to
sampling error, sound statistical practice calls for researchers to provide users with some
indication of the magnitude of this sampling error. This section of the documentation
outlines the measures of sampling error which Statistics Canada commonly uses and
which it urges users producing estimates from this microdata file to use also.
Special Surveys Division
25
International Youth Survey, 2006 – User Guide
The basis for measuring the potential size of sampling errors is the standard error of the
estimates derived from survey results.
However, because of the large variety of estimates that can be produced from a survey,
the standard error of an estimate is usually expressed relative to the estimate to which it
pertains. This resulting measure, known as the coefficient of variation (CV) of an
estimate, is obtained by dividing the standard error of the estimate by the estimate itself
and is expressed as a percentage of the estimate.
For example, suppose that, based upon the survey results, one estimates that 8.0% of
students in grades 7 to 9 have smoked a whole cigarette, and this estimate is found to
have a standard error of 0.006. Then the coefficient of variation of the estimate is
calculated as:
⎛ 0 . 006 ⎞
⎜
⎟ X 100 % = 7 . 5 %
⎝ 0 . 080 ⎠
There is more information on the calculation of coefficients of variation in Chapter 10.0.
26
Special Surveys Division
International Youth Survey, 2006 – User Guide
9.0
Guidelines for Tabulation, Analysis and Release
This chapter of the documentation outlines the guidelines to be adhered to by users tabulating, analyzing,
publishing or otherwise releasing any data derived from the survey microdata files. With the aid of these
guidelines, users of microdata should be able to produce the same figures as those produced by
Statistics Canada and, at the same time, will be able to develop currently unpublished figures in a manner
consistent with these established guidelines.
9.1
Rounding Guidelines
In order that estimates for publication or other release derived from these microdata files
correspond to those produced by Statistics Canada, users are urged to adhere to the following
guidelines regarding the rounding of such estimates:
a) Estimates in the main body of a statistical table are to be rounded to the nearest hundred
units using the normal rounding technique. In normal rounding, if the first or only digit to
be dropped is 0 to 4, the last digit to be retained is not changed. If the first or only digit to
be dropped is 5 to 9, the last digit to be retained is raised by one. For example, in normal
rounding to the nearest 100, if the last two digits are between 00 and 49, they are
changed to 00 and the preceding digit (the hundreds digit) is left unchanged. If the last
digits are between 50 and 99 they are changed to 00 and the preceding digit is
incremented by 1.
b) Marginal sub-totals and totals in statistical tables are to be derived from their
corresponding unrounded components and then are to be rounded themselves to the
nearest 100 units using normal rounding.
c) Averages, proportions, rates and percentages are to be computed from unrounded
components (i.e. numerators and/or denominators) and then are to be rounded
themselves to one decimal using normal rounding. In normal rounding to a single digit, if
the final or only digit to be dropped is 0 to 4, the last digit to be retained is not changed. If
the first or only digit to be dropped is 5 to 9, the last digit to be retained is increased by 1.
d) Sums and differences of aggregates (or ratios) are to be derived from their corresponding
unrounded components and then are to be rounded themselves to the nearest 100 units
(or the nearest one decimal) using normal rounding.
e) In instances where, due to technical or other limitations, a rounding technique other than
normal rounding is used resulting in estimates to be published or otherwise released
which differ from corresponding estimates published by Statistics Canada, users are
urged to note the reason for such differences in the publication or release document(s).
f)
9.2
Under no circumstances are unrounded estimates to be published or otherwise released
by users. Unrounded estimates imply greater precision than actually exists.
Sample Weighting Guidelines for Tabulation
The sample design used for the International Youth Survey (IYS) was not self-weighting. When
producing simple estimates including the production of ordinary statistical tables, users must
apply the proper survey weights.
If proper weights are not used, the estimates derived from the microdata files cannot be
considered to be representative of the survey population, and will not correspond to those
produced by Statistics Canada.
Special Surveys Division
27
International Youth Survey, 2006 – User Guide
Users should also note that some software packages may not allow the generation of estimates
that exactly match those available from Statistics Canada, because of their treatment of the
weight field.
9.3
Definitions of Types of Estimates: Categorical and
Quantitative
Before discussing how the International Youth Survey data can be tabulated and analyzed, it is
useful to describe the two main types of point estimates of population characteristics which can
be generated from the microdata file for the IYS.
9.3.1
Categorical Estimates
Categorical estimates are estimates of the number, or percentage of the surveyed
population possessing certain characteristics or falling into some defined category. The
number of students who ever had beer, coolers or wine or a proportion of students who
usually like school a lot are examples of such estimates. An estimate of the number of
persons possessing a certain characteristic may also be referred to as an estimate of an
aggregate.
Examples of Categorical Questions:
Q:
R:
Have you ever had beer, coolers or wine?
Yes / No
Q:
R:
Do you usually like school?
I like it a lot / I like it fairly well / I do not like it very much / I do not like it
at all
9.3.2
Quantitative Estimates
Quantitative estimates are estimates of totals or of means, medians and other measures
of central tendency of quantities based upon some or all of the members of the surveyed
population. They also specifically involve estimates of the form
Xˆ / Yˆ where X̂ is an
estimate of surveyed population quantity total and Yˆ is an estimate of the number of
persons in the surveyed population contributing to that total quantity.
An example of a quantitative estimate is the average number of friends who have stolen
something from a store. The numerator is an estimate of the total number of friends who
have stolen something from a store and its denominator is the number of students
reporting having friends who have stolen something from a store.
Examples of Quantitative Questions:
Q:
R:
Do you have any friends who have stolen something from a store?
|_|_| friends
Q:
Have you ever had beer, coolers or wine? Did you drink this during the
last 4 weeks?
|_|_| times
R:
28
Special Surveys Division
International Youth Survey, 2006 – User Guide
9.3.3
Tabulation of Categorical Estimates
Estimates of the number of people with a certain characteristic can be obtained from the
microdata file by summing the final weights of all records possessing the characteristic(s)
of interest. Proportions and ratios of the form
Xˆ / Yˆ are obtained by:
a) summing the final weights of records having the characteristic of interest for the
( )
denominator (Yˆ ) , then
numerator X̂ ,
b) summing the final weights of records having the characteristic of interest for the
(
)
c) divide estimate a) by estimate b) Xˆ / Yˆ .
9.3.4
Tabulation of Quantitative Estimates
Estimates of quantities can be obtained from the microdata file by multiplying the value of
the variable of interest by the final weight for each record, then summing this quantity
over all records of interest. For example, to obtain an estimate of the total number of
times students drank beer, coolers or wine during the last 4 weeks multiply the value
reported in question Q49_3A (number of times drank beer, coolers or wine during the last
4 weeks) by the final weight for the record, then sum this value over all records with
Q49_3A < 21.
Xˆ / Yˆ , the numerator ( X̂ ) is calculated as for
a quantitative estimate and the denominator ( Yˆ ) is calculated as for a categorical
To obtain a weighted average of the form
estimate. For example, to estimate the average number of times students drank beer,
coolers or wine during the last 4 weeks,
a) estimate the total number of times students drank beer, coolers or wine during
the last 4 weeks ( X̂ ) as described above,
b) estimate the number of students ( Yˆ ) in this category by summing the final
weights of all records with Q49_3A < 21, then
c) divide estimate a) by estimate b) ( Xˆ
9.4
/ Yˆ ).
Guidelines for Statistical Analysis
The IYS is based upon a complex sample design, with stratification, multiple stages of selection,
and unequal probabilities of selection of respondents. Using data from such complex surveys
presents problems to analysts because the survey design and the selection probabilities affect
the estimation and variance calculation procedures that should be used. In order for survey
estimates and analyses to be free from bias, the survey weights must be used.
While many analysis procedures found in statistical packages allow weights to be used, the
meaning or definition of the weight in these procedures may differ from that which is appropriate
in a sample survey framework, with the result that while in many cases the estimates produced by
the packages are correct, the variances that are calculated are poor. Approximate variances for
simple estimates such as totals, proportions and ratios (for qualitative variables) can be derived
using the accompanying Approximate Sampling Variability Tables.
For other analysis techniques (for example linear regression, logistic regression and analysis of
variance), a method exists which can make the variances calculated by the standard packages
Special Surveys Division
29
International Youth Survey, 2006 – User Guide
more meaningful, by incorporating the unequal probabilities of selection. The method rescales
the weights so that there is an average weight of 1.
For example, suppose that analysis of all male students is required. The steps to rescale the
weights are as follows:
1) select all students from the file who reported Q01 = men;
2) calculate the AVERAGE weight for these records by summing the original student
weights from the microdata file for these records and then dividing by the number of
students who reported Q01 = men;
3) for each of these students, calculate a RESCALED weight equal to the original student
weight divided by the AVERAGE weight;
4) perform the analysis for these students using the RESCALED weight.
However, because the stratification and clustering of the sample’s design are still not taken into
account, the variance estimates calculated in this way are likely to be under-estimates.
The calculation of more precise variance estimates requires detailed knowledge of the design of
the survey. Such detail cannot be given in this microdata file because of confidentiality.
Variances that take the complete sample design into account can be calculated for many
statistics by Statistics Canada on a cost-recovery basis
9.5
Coefficient of Variation Release Guidelines
Before releasing and/or publishing any estimates from the IYS users should first determine the
quality level of the estimate. The quality levels are acceptable, marginal and unacceptable. Data
quality is affected by both sampling and non-sampling errors as discussed in Chapter 8.0.
However for this purpose, the quality level of an estimate will be determined only on the basis of
sampling error as reflected by the coefficient of variation as shown in the table below.
Nonetheless users should be sure to read Chapter 8.0 to be more fully aware of the quality
characteristics of these data.
First, the number of respondents who contribute to the calculation of the estimate should be
determined. If this number is less than 30, the weighted estimate should be considered to be of
unacceptable quality.
For weighted estimates based on sample sizes of 30 or more, users should determine the
coefficient of variation of the estimate and follow the guidelines below. These quality level
guidelines should be applied to rounded weighted estimates.
All estimates can be considered releasable. However, those of marginal or unacceptable quality
level must be accompanied by a warning to caution subsequent users.
30
Special Surveys Division
International Youth Survey, 2006 – User Guide
Quality Level Guidelines
Quality Level of
Estimate
1) Acceptable
Guidelines
Estimates have
a sample size of 30 or more, and
low coefficients of variation in the range of 0.0% to 16.5%.
No warning is required.
Estimates have
a sample size of 30 or more, and
high coefficients of variation in the range of 16.6% to 33.3%.
2) Marginal
Estimates should be flagged with the letter E (or some similar
identifier). They should be accompanied by a warning to caution
subsequent users about the high levels of error, associated with the
estimates.
Estimates have
a sample size of less than 30, or
very high coefficients of variation in excess of 33.3%.
3) Unacceptable
Statistics Canada recommends not to release estimates of
unacceptable quality. However, if the user chooses to do so then
estimates should be flagged with the letter F (or some similar
identifier) and the following warning should accompany the
estimates:
“Please be warned that these estimates [flagged with the letter F]
do not meet Statistics Canada’s quality standards. Conclusions
based on these data will be unreliable, and most likely invalid.”
Special Surveys Division
31
International Youth Survey, 2006 – User Guide
9.6
Release Cut-off’s for the International Youth Survey
The following table provides an indication of the precision of population estimates as it shows the
release cut-offs associated with each of the three quality levels presented in the previous section.
These cut-offs are derived from the coefficient of variation (CV) tables discussed in Chapter 10.0.
Note that these cut-offs apply to estimates of population totals only. To estimate ratios, users
should not use the numerator value (nor the denominator) in order to find the corresponding
quality level. Rule 4 in Section 10.1 and Example 4 in Section 10.1.1 explains the correct
procedure to be used for ratios.
Grade
Grade 7
Grade 8
Grade 9
Total
32
Gender
Acceptable CV
0.0% to 16.5%
Marginal CV
16.6% to 33.3%
Unacceptable CV
> 33.3%
Male
900
& over
250
to <
900
under
250
Female
850
& over
200
to <
850
under
200
All
1,000
& over
250
to <
1,000
under
250
Male
1,100
& over
300
to <
1,100
under
300
850
& over
200
to <
850
under
200
All
1,150
& over
300
to <
1,150
under
300
Male
1,400
& over
400
to <
1,400
under
400
Female
1,150
& over
300
to <
1,150
under
300
All
1,500
& over
400
to <
1,500
under
400
Male
1,150
& over
300
to <
1,150
under
300
Female
1,000
& over
250
to <
1,000
under
250
All
1,250
& over
300
to <
1,250
under
300
Female
Special Surveys Division
International Youth Survey, 2006 – User Guide
10.0 Approximate Sampling Variability Tables
In order to supply coefficients of variation (CV) which would be applicable to a wide variety of categorical
estimates produced from this microdata file and which could be readily accessed by the user, a set of
Approximate Sampling Variability Tables has been produced. These CV tables allow the user to obtain
an approximate coefficient of variation based on the size of the estimate calculated from the survey data.
The coefficients of variation are derived using the variance formula for simple random sampling and
incorporating a factor which reflects the multi-stage, clustered nature of the sample design. This factor,
known as the design effect, was determined by first calculating design effects for a wide range of
characteristics and then choosing from among these a conservative value (usually the 75th percentile) to
be used in the CV tables which would then apply to the entire set of characteristics.
The table below shows the conservative value of the design effects as well as sample sizes and
population counts by province which were used to produce the Approximate Sampling Variability Tables
for the International Youth Survey (IYS).
Grade
Gender
Grade 7
Grade 8
Grade 9
Total
Design Effect
Sample Size
553
Population
Male
1.48
10,176
Female
1.68
654
9,905
All
1.73
1,207
20,081
Male
1.67
550
10,741
Female
1.55
598
9,549
All
1.85
1,148
20,290
Male
1.83
449
10,697
Female
1.74
486
9,845
All
1.98
935
20,541
Male
1.63
1,552
31,613
Female
1.69
1,738
29,299
All
1.87
3,290
60,912
All coefficients of variation in the Approximate Sampling Variability Tables are approximate and,
therefore, unofficial. Estimates of actual variance for specific variables may be obtained from Statistics
Canada on a cost-recovery basis. Since the approximate CV is conservative, the use of actual variance
estimates may cause the estimate to be switched from one quality level to another. For instance a
marginal estimate could become acceptable based on the exact CV calculation.
Remember:
If the number of observations on which an estimate is based is less than 30, the weighted
estimate is most likely unacceptable and Statistics Canada recommends not to release
such an estimate, regardless of the value of the coefficient of variation.
10.1 How to Use the Coefficient of Variation Tables for
Categorical Estimates
The following rules should enable the user to determine the approximate coefficients of variation
from the Approximate Sampling Variability Tables for estimates of the number, proportion or
percentage of the surveyed population possessing a certain characteristic and for ratios and
differences between such estimates.
Special Surveys Division
33
International Youth Survey, 2006 – User Guide
Rule 1:
Estimates of Numbers of Persons Possessing a Characteristic (Aggregates)
The coefficient of variation depends only on the size of the estimate itself. On the Approximate
Sampling Variability Table for the appropriate geographic area, locate the estimated number in
the left-most column of the table (headed “Numerator of Percentage”) and follow the asterisks (if
any) across to the first figure encountered. This figure is the approximate coefficient of variation.
Rule 2:
Estimates of Proportions or Percentages of Persons Possessing a Characteristic
The coefficient of variation of an estimated proportion or percentage depends on both the size of
the proportion or percentage and the size of the total upon which the proportion or percentage is
based. Estimated proportions or percentages are relatively more reliable than the corresponding
estimates of the numerator of the proportion or percentage, when the proportion or percentage is
based upon a sub-group of the population. For example, the proportion of students who usually
like school a lot is more reliable than the estimated number of students who usually like school a
lot. (Note that in the tables the coefficients of variation decline in value reading from left to right).
When the proportion or percentage is based upon the total population of the geographic area
covered by the table, the CV of the proportion or percentage is the same as the CV of the
numerator of the proportion or percentage. In this case, Rule 1 can be used.
When the proportion or percentage is based upon a subset of the total population (e.g. those in a
particular sex or grade) reference should be made to the proportion or percentage (across the top
of the table) and to the numerator of the proportion or percentage (down the left side of the table).
The intersection of the appropriate row and column gives the coefficient of variation.
Rule 3:
Estimates of Differences Between Aggregates or Percentages
The standard error of a difference between two estimates is approximately equal to the square
root of the sum of squares of each standard error considered separately. That is, the standard
(
)
error of a difference dˆ = Xˆ 1 − Xˆ 2 is:
σ
dˆ
(Xˆ 1α 1 )2 + (Xˆ 2α 2 )2
where X̂ 1 is estimate 1, X̂ 2 is estimate 2, and α
1
and α
2
are the coefficients of variation of
X̂ 1 and X̂ 2 respectively. The coefficient of variation of d̂ is given by σdˆ / dˆ . This formula is
accurate for the difference between separate and uncorrelated characteristics, but is only
approximate otherwise.
Rule 4:
Estimates of Ratios
In the case where the numerator is a subset of the denominator, the ratio should be converted to
a percentage and Rule 2 applied. This would apply, for example, to the case where the
denominator is the number of students and the numerator is the number of students who ever
had beer, coolers or wine.
In the case where the numerator is not a subset of the denominator, as for example, the ratio of
the number of students who ever had beer, coolers or wine as compared to the number of
students who ever had hard liquor (gin, rum, vodka, whisky) on its own or mixed, the standard
error of the ratio of the estimates is approximately equal to the square root of the sum of squares
34
Special Surveys Division
International Youth Survey, 2006 – User Guide
of each coefficient of variation considered separately multiplied by R̂ . That is, the standard error
(
)
of a ratio Rˆ = Xˆ 1 / Xˆ 2 is:
σ Rˆ = Rˆ α12 + α 2 2
where
α1
and
α2
are the coefficients of variation of X̂ 1 and X̂ 2 respectively. The coefficient of
variation of R̂ is given by
σ Rˆ / Rˆ .
The formula will tend to overstate the error if X̂ 1 and X̂ 2 are
positively correlated and understate the error if X̂ 1 and X̂ 2 are negatively correlated.
Rule 5:
Estimates of Differences of Ratios
In this case, Rules 3 and 4 are combined. The CVs for the two ratios are first determined using
Rule 4, and then the CV of their difference is found using Rule 3.
10.1.1
Examples of Using the Coefficient of Variation
Tables for Categorical Estimates
The following examples based on the IYS are included to assist users in applying the
foregoing rules.
Example 1:
Estimates of Numbers of Persons Possessing a Characteristic
(Aggregates)
Suppose that a user estimates that 24,364 students in grades 7 to 9 have ever had beer,
coolers or wine. How does the user determine the coefficient of variation of this
estimate?
1) Refer to the coefficient of variation table for Toronto.
2) The estimated aggregate 24,364 does not appear in the left-hand column (the
“Numerator of Percentage” column), so it is necessary to use the figure closest to it,
namely 25,000.
3) The coefficient of variation for an estimated aggregate is found by referring to the first
non-asterisk entry on that row, namely, 2.6%.
4) So the approximate coefficient of variation of the estimate is 2.6%. The finding that
24,364 (to be rounded according to the rounding guidelines in Section 9.1) students
in grades 7 to 9 have ever had beer, coolers or wine is publishable with no
qualifications.
Example 2:
Estimates of Proportions or Percentages of Persons Possessing a
Characteristic
Suppose that the user estimates that 11,663 / 29,299 = 39.8% of female students have
ever had beer, coolers or wine. How does the user determine the coefficient of variation
of this estimate?
In this example, the user could use the coefficient of variation table for Female Students
and follow the same procedure as in Example 1. The CV table for Toronto is used to
illustrate the method for using a percentage and numerator portion at the same time.
1) Refer to the coefficient of variation table for Toronto.
Special Surveys Division
35
International Youth Survey, 2006 – User Guide
2) Because the estimate is a percentage which is based on a subset of the total
population (i.e., female students who have ever had beer, coolers or wine), it is
necessary to use both the percentage (39.8%) and the numerator portion of the
percentage (11,663) in determining the coefficient of variation.
3) The numerator, 11,663 does not appear in the left-hand column (the “Numerator of
Percentage” column) so it is necessary to use the figure closest to it, namely 12,500.
Similarly, the percentage estimate does not appear as any of the column headings,
so it is necessary to use the percentage closest to it, 40.0%.
4) The figure at the intersection of the row and column used, namely 4.0% is the
coefficient of variation to be used.
5) So the approximate coefficient of variation of the estimate is 4.0%. The finding that
39.8% of female students have ever had beer, coolers or wine can be published with
no qualifications.
Example 3:
Estimates of Differences Between Aggregates or Percentages
Suppose that a user estimates that 14,041 / 29,299 = 47.9% of female students
volunteered in the last four weeks, while 12,658 / 31,613 = 40.0% of male students
volunteered. How does the user determine the coefficient of variation of the difference
between these two estimates?
1) Using the Toronto coefficient of variation table in the same manner as described in
Example 2 gives the CV of the estimate for female students as 3.3%, and the CV of
the estimate for male students as 4.0%.
(
)
2) Using Rule 3, the standard error of a difference dˆ = Xˆ 1 − Xˆ 2 is:
σ dˆ =
(Xˆ α ) + (Xˆ α )
2
1
1
2
2
2
where X̂ 1 is estimate 1 (female students), X̂ 2 is estimate 2 (male students), and
α1
and
α2
are the coefficients of variation of X̂ 1 and X̂ 2 respectively.
That is, the standard error of the difference
σ dˆ =
=
d̂ = 0.479 – 0.400 = -0.079 is:
[(0.479 )(0.033 )]2 + [(0.400 )(0.040 )]2
(0.000250 ) + (0.000256 )
= 0 .022
3) The coefficient of variation of
d̂ is given by σ dˆ / dˆ = 0.022 / 0.079 = 0.278
4) So the approximate coefficient of variation of the difference between the estimates is
27.8%. The difference between the estimates is considered marginal and Statistics
Canada recommends this estimate not be released. However, should the user
choose to do so, the estimate should be flagged with the letter E (or some similar
identifier) and be accompanied by a warning to caution subsequent users about the
high levels of error associated with the estimate.
36
Special Surveys Division
International Youth Survey, 2006 – User Guide
Example 4:
Estimates of Ratios
Suppose that the user estimates that 2,749 female students and 3,023 male students
tried beer, coolers or wine for the first time when they were less than 10 years old. The
user is interested in comparing the estimate of female students versus that of male
students in the form of a ratio. How does the user determine the coefficient of variation of
this estimate?
1) First of all, this estimate is a ratio estimate, where the numerator of the estimate ( X̂ 1 )
is the number of female students who tried beer, coolers or wine for the first time
when they were less than 10 years old. The denominator of the estimate ( X̂ 2 ) is the
number of male students who tried beer, coolers or wine for the first time when they
were less than 10 years old.
2) For the female students refer to the coefficient of variation table for Female Students.
For the male students refer to the coefficient of variation table for Male Students
3) The numerator of this ratio estimate is 2,749. The figure closest to it in the coefficient
of variation table for Female Students is 2,500. The coefficient of variation for this
estimate is found by referring to the first non-asterisk entry on that row, namely 9.8%.
4) The denominator of this ratio estimate is 3,023. The figure closest to it in the
coefficient of variation table for Male Students is 3,000. The coefficient of variation
for this estimate is found by referring to the first non-asterisk entry on that row,
namely, 9.7%
5) So the approximate coefficient of variation of the ratio estimate is given by Rule 4,
which is:
α Rˆ = α 1 2 + α 2 2
where α 1 and
That is:
α2
α Rˆ =
are the coefficients of variation of X̂ 1 and X̂ 2 respectively.
(0.098)2 + (0.097 )2
= 0.0096 + 0.0094
= 0.138
6) The obtained ratio of female students versus male students who tried beer, coolers or
wine for the first time when they were less than 10 years old is 2,749 / 3,023 which is
0.91 (to be rounded according to the rounding guidelines in Section 9.1). The
coefficient of variation of this estimate is 13.8%, which makes the estimate releasable
with no qualifications.
Special Surveys Division
37
International Youth Survey, 2006 – User Guide
Example 5:
Estimates of Differences of Ratios
Suppose that the user estimates that the ratio of female students to male students who
ever had beer, coolers or wine is 1.050 for students in grade 8 and 0.919 for students in
grade 9. The user is interested in comparing the two ratios to see if there is a statistical
difference between them. How does the user determine the coefficient of variation of the
difference?
1) First calculate the approximate coefficient of variation for the grade 8 ratio ( R̂1 ) using
the coefficient of variation table for Grade 8, All Students, and the grade 9 ratio ( R̂2 )
using the coefficient of variation table for Grade 9, All Students as in Example 4. The
approximate CV for the grade 8 ratio is 8.7% and 8.8% for grade 9.
2) Using Rule 3, the standard error of a difference ( dˆ = Rˆ1 − Rˆ 2 ) is:
σ dˆ =
where
α1
and
α2
(Rˆ α ) + (Rˆ α )
2
1
1
2
2
2
are the coefficients of variation of R̂1 and R̂2 respectively. That
is, the standard error of the difference
σ dˆ =
=
d̂ = 1.050 – 0.919 = 0.131 is:
[(1.0501 )(0.0870 )]2 + [(0.9187 )(0.0884 )]2
(0.0083 ) + (0.0066 )
= 0.122
3) The coefficient of variation of
d̂ is given by σ dˆ / dˆ = 0.122 / 0.131 = 0.931.
4) So the approximate coefficient of variation of the difference between the estimates is
93.1%. The difference between the estimates is considered unacceptable and
Statistics Canada recommends this estimate not be released. However, should the
user choose to do so, the estimate should be flagged with the letter F (or some
similar identifier) and be accompanied by a warning to caution subsequent users
about the high levels of error, associated with the estimate.
10.2 How to Use the Coefficient of Variation Tables to Obtain
Confidence Limits
Although coefficients of variation are widely used, a more intuitively meaningful measure of
sampling error is the confidence interval of an estimate. A confidence interval constitutes a
statement on the level of confidence that the true value for the population lies within a specified
range of values. For example a 95% confidence interval can be described as follows:
If sampling of the population is repeated indefinitely, each sample leading to a new
confidence interval for an estimate, then in 95% of the samples the interval will cover the
true population value.
Using the standard error of an estimate, confidence intervals for estimates may be
obtained under the assumption that under repeated sampling of the population, the
various estimates obtained for a population characteristic are normally distributed about
the true population value. Under this assumption, the chances are about 68 out of 100
38
Special Surveys Division
International Youth Survey, 2006 – User Guide
that the difference between a sample estimate and the true population value would be
less than one standard error, about 95 out of 100 that the difference would be less than
two standard errors, and about 99 out of 100 that the difference would be less than three
standard errors. These different degrees of confidence are referred to as the confidence
levels.
Confidence intervals for an estimate, X̂ , are generally expressed as two numbers, one
(
)
below the estimate and one above the estimate, as Xˆ − k , Xˆ + k where k is
determined depending upon the level of confidence desired and the sampling error of the
estimate.
Confidence intervals for an estimate can be calculated directly from the Approximate
Sampling Variability Tables by first determining from the appropriate table the coefficient
of variation of the estimate X̂ , and then using the following formula to convert to a
confidence interval ( CI xˆ ):
(
CI xˆ = Xˆ − tXˆ α xˆ , Xˆ + tXˆ α xˆ
)
where α x̂ is the determined coefficient of variation of X̂ , and
t
t
t
t
Note:
= 1 if a 68% confidence interval is desired;
= 1.6 if a 90% confidence interval is desired;
= 2 if a 95% confidence interval is desired;
= 2.6 if a 99% confidence interval is desired.
Release guidelines which apply to the estimate also apply to the confidence
interval. For example, if the estimate is not releasable, then the confidence
interval is not releasable either.
10.2.1
Example of Using the Coefficient of Variation
Tables to Obtain Confidence Limits
A 95% confidence interval for the estimated proportion of female students who ever had
beer, coolers or wine (from Example 2, Section 10.1.1) would be calculated as follows:
X̂ =
39.8% (or expressed as a proportion 0.398)
t
=
2
α x̂
=
4.0% (0.040 expressed as a proportion) is the coefficient of variation of
this estimate as determined from the tables.
CI xˆ = {0.398 – (2) (0.398) (0.040), 0.398 + (2) (0.398) (0.040)}
CI xˆ = {0.398 – 0.032, 0.398 + 0.032}
CI xˆ = {0.366, 0.430}
With 95% confidence it can be said that between 36.6% and 43.0% of female students
have ever had beer, coolers or wine.
Special Surveys Division
39
International Youth Survey, 2006 – User Guide
10.3 How to Use the Coefficient of Variation Tables to Do a
T-test
Standard errors may also be used to perform hypothesis testing, a procedure for distinguishing
between population parameters using sample estimates. The sample estimates can be numbers,
averages, percentages, ratios, etc. Tests may be performed at various levels of significance,
where a level of significance is the probability of concluding that the characteristics are different
when, in fact, they are identical.
Let X̂ 1 and X̂ 2 be sample estimates for two characteristics of interest. Let the standard error on
the difference Xˆ 1 − Xˆ 2 be
If t =
Xˆ 1 − Xˆ 2
σ dˆ
σ d̂ .
is between -2 and 2, then no conclusion about the difference between the
characteristics is justified at the 5% level of significance. If however, this ratio is smaller than -2
or larger than +2, the observed difference is significant at the 0.05 level. That is to say that the
difference between the estimates is significant.
10.3.1
Example of Using the Coefficient of Variation
Tables to Do a T-test.
Let us suppose that the user wishes to test, at 5% level of significance, the hypothesis
that there is no difference between the proportion of female students and the proportion
of male students who volunteered in the last four weeks. From Example 3, Section
10.1.1, the standard error of the difference between these two estimates was found to be
0.022. Hence,
t=
Xˆ 1 − Xˆ 2
σ dˆ
=
0.479 − 0.400 0.079
=
= 3.59
0.022
0.022
Since t = 3.59 is greater than 2, it must be concluded that there is a significant difference
between the two estimates at the 0.05 level of significance.
10.4 Coefficients of Variation for Quantitative Estimates
For quantitative estimates, special tables would have to be produced to determine their sampling
error. Since most of the variables for the IYS are primarily categorical in nature, this has not been
done.
As a general rule, however, the coefficient of variation of a quantitative total will be larger than the
coefficient of variation of the corresponding category estimate (i.e., the estimate of the number of
persons contributing to the quantitative estimate). If the corresponding category estimate is not
releasable, the quantitative estimate will not be either. For example, the coefficient of variation of
the total number of friends who have stolen something from a store would be greater than the
coefficient of variation of the corresponding proportion of students with one or more friends who
have stolen something from a store. Hence, if the coefficient of variation of the proportion is
unacceptable (making the proportion not releasable), then the coefficient of variation of the
corresponding quantitative estimate will also be unacceptable (making the quantitative estimate
not releasable).
40
Special Surveys Division
International Youth Survey, 2006 – User Guide
Coefficients of variation of such estimates can be derived as required for a specific estimate using
a technique known as pseudo replication. This involves dividing the records on the microdata
files into subgroups (or replicates) and determining the variation in the estimate from replicate to
replicate. Users wishing to derive coefficients of variation for quantitative estimates may contact
Statistics Canada for advice on the allocation of records to appropriate replicates and the
formulae to be used in these calculations.
10.5 Coefficient of Variation Tables
Refer to IYS2006_CVTabsE.pdf for the coefficient of variation tables.
Special Surveys Division
41
International Youth Survey, 2006 – User Guide
11.0 Weighting
Statistical weights were placed on each record to represent the number of sampled persons that the
record represents. The weighting for the International Youth Survey consisted of several steps which are
described in the following paragraphs.
1. Initial sampling weight (school weight)
The first step is to calculate the initial weight ( Weight1 ) for each selected unit (school-grade). For
a given unit, this is equal to the inverse of the probability of selection within the stratum. This
probability is proportional to the number of students at the school for the given grade. Because
sampling at this level was done using probability proportional to size, some large schools needed
to be placed in separate take-all strata. These schools had an initial sampling weight of 1.
2. Removal of out-of-scope schools
During collection, 5 schools were found to be out-of-scope (meaning that they did not contain the
grade for which they had been selected). These schools were dropped. The weights of the inscope schools were not adjusted, hence
Weight2 = Weight1
3. Adjustment for the non-response at the school level
Among the originally selected school-grade units, some non-response was observed. Nonresponse at the school level can be due to several factors such as school refusals or the inability
to complete the interview within the allotted collection period.
The school level non-response adjustment was calculated differently depending on whether the
school-grade belonged to a take-some stratum or a take-all stratum. This is because the design
weights reflect school sizes for schools in take-some strata, but are all equal (regardless of
school size) for schools in take-all strata.
•
Units in take-some strata
For units belonging to strata
adjschool _ nr =
•
h in grade g the adjustment is defined as:
number of in − scope schools in strata h for grade g
number of responding schools in strata h for grade g
Units in take-all strata
For units belonging to strata
adjschool _ nr =
h in grade g the adjustment is defined as:
∑Weight 2 for responding schools + ∑Weight 2 for non − responding schools
∑Weight 2 for responding schools
And the resulting weight after this step is Weight3 = Weight 2 * adj school _ nr
Special Surveys Division
43
International Youth Survey, 2006 – User Guide
4. Adjustment for the selection of a class (class weight)
This adjustment relates to the second stage of sampling, when a class is selected at random from
all the classes of the same grade in the selected school. Since only one class is selected per
school-grade, the adjustment consists in multiplying the weight obtained from the preceding stage
by the total number of classes in the school for this grade. This number is obtained from the
Classroom Selection Form.
Weight 4 (class weight ) = Weight 3 * number of classes
5. Adjustment for class non-response
This adjustment takes care of the non-response at the class level. A non-response at the class
level is defined as any cases where the number of classes is known (and is positive) but for which
there are no responding students. The adjustment factor is defined as:
adjclass _ nr =
∑Weight 4 for responding classes + ∑Weight4 for non − responding classes
∑Weight4 for responding classes
The resulting weight for this step is Weight5 = Weight 4 * adj class _ nr
Note: Since all the students in the selected classes are surveyed, this step also provides the
student weight.
6. Adjustment for student non-response
This adjustment is intended to compensate for non-response at the student level. The main
reasons for this type of non-response are: parental consent was not obtained, the student refused
to participate or the student was not in class on the day of collection. The adjustment consists of
multiplying the weight resulting from the previous step by the following ratio:
adj
student _ nr
=
number of eligible students in the selected class
number of responding students in the selected class
Thus resulting in Weight6 = Weight5 * adj student _ nr
7. Post-stratification adjustment
The sampling weights for students attending public schools are adjusted to agree with the
enrolment counts for certain groupings (post-strata). The enrolment counts were provided by the
Toronto District School Board at the end of collection for grade-sex post-strata. The ratio of the
actual number of students in a given post-stratum to the number estimated by the sampling
design for the same post-stratum represents the adjustment.
For units belonging to post-stratum p , the post-stratification adjustment is defined as:
adj post _ strata =
enrolment totals for post − stratum p
∑ Weight
5
for records in post − stratum p
For the private schools, no such counts were obtained, so the adjustment factor is simply 1.
44
Special Surveys Division
International Youth Survey, 2006 – User Guide
The final sampling weight attached to each record is the product of the adjusted student weight
multiplied by adj post _ strata i.e., WTPP = Weight 6 * adj post _ strata .
8. An additional step to prevent disclosure
For the public use microdata file (PUMF), to prevent disclosure of school related information,
weights on some records have been randomly perturbed (fewer than 2%). The impact of this step
on the distribution of weights by grade and sex is negligible.
Special Surveys Division
45
International Youth Survey, 2006 – User Guide
12.0 Questionnaire
The International Youth Survey (IYS) questionnaire was used in 2006 to collect the information for the
Canadian portion of the international survey. The file IYS2006_QuestE.pdf contains the English
questionnaire.
Special Surveys Division
47
International Youth Survey, 2006 – User Guide
13.0 Record Layout with Univariate Frequencies
See IYS2006_CdBk.pdf for the record layout with univariate counts.
Special Surveys Division
49