1
User Guide to the Fiscal Arrangements Model
Without prejudice
Fiscal Arrangements Model User Guide
June 21, 2003
Table of Contents
Overview: ....................................................................................................................................... 1
User Guide: ................................................................................................................................. 1
Minimum Requirements: ............................................................................................................. 1
Model Structure............................................................................................................................. 3
Representation of Revenue Side................................................................................................ 3
Representation of the Expenditure Side..................................................................................... 4
First Nation Government Budget ................................................................................................ 6
The Spreadsheet Structure.......................................................................................................... 7
Running the model ...................................................................................................................... 8
Running the model ...................................................................................................................... 9
Options Sheet .......................................................................................................................... 9
Input OSR Options Sheet........................................................................................................... 10
Input Data Sheet.......................................................................................................................... 12
Capital Transfer and Loans....................................................................................................... 13
Own Source Revenue ............................................................................................................... 15
Demographics ........................................................................................................................... 18
Tax............................................................................................................................................. 21
Funding...................................................................................................................................... 28
Adjusters................................................................................................................................ 30
Expenditures ............................................................................................................................. 32
Health..................................................................................................................................... 32
Social ..................................................................................................................................... 34
Education............................................................................................................................... 36
Capital.................................................................................................................................... 38
Government ........................................................................................................................... 39
Economic Development ........................................................................................................ 44
Results Sheets ............................................................................................................................ 47
Results Budget Sheet ............................................................................................................... 47
Results Revenues Sheet........................................................................................................... 50
Results Expenditures Sheet...................................................................................................... 52
Results Tax and Employment Sheet ........................................................................................ 55
Without prejudice
i
Fiscal Arrangements Model User Guide
June 21, 2003
Overview:
General:
This model has been produced as an illustrative tool for use by the Parties at negotiation tables in
the BCTC Process. The model can be used to analyze a wide range of fiscal options for a given
community profile, taking into account various economic development scenarios.
This fiscal model was developed by a modeling consultant with the participation of the Department of
Indian Affairs and Northern Development, British Columbia and the First Nations Summit as part of
the work of the Fiscal Relations Working Group.
Disclaimer:
The fiscal model and the copyright to the model are owned by British Columbia. However, as
agreed to by the Fiscal Relations Working Group, the model cannot be modified without the written
consent of Canada, British Columbia and the First Nations Summit.
The results produced by the model are for illustrative purposes only, and use of the model is entirely
voluntary. British Columbia, Canada, and the First Nations Summit make no representation as to the
accuracy or reliability of the model and are not liable for any decisions taken or agreements entered
into by First Nations based on model outputs or projections.
The model includes procedures for estimating First Nation tax revenues. While those procedures
use some of the same parameters used by the federal Department of Finance, the methodologies
and data inputs differ. Consequently, the estimates that are produced by the model will differ from
those calculated by the Department of Finance. The Department of Finance is prepared to work with
interested First Nations in British Columbia to produce more accurate estimates of potential First
Nation tax revenues, which could possibly be used with other outputs from the model. Canada does
not use this model for estimating First Nation tax revenues.
User Guide:
The purpose of this user guide is threefold:
•
First, this guide provides users of the fiscal model with the instructions on how to execute the
model and identifies all the options and parameters available for manipulation
•
Secondly, the guide documents the data sources and data inputs that the model requires. Data
can be broadly classified into two groups:
a) variables and information specific to a particular FN or FN profile and,
b) variables and data of a generic nature
•
Third, the guide provides overviews of the methodologies used within the model that are not
directly accessible to the model user.
Minimum Requirements:
The model was created in MS Excel 2000 on an IBM compatible computer under a Win XP
operating system and has been tested in a Windows 95 and Window 98 environment. Some of the
macros contained in the model may not operate properly in any version lower then Excel 7, but will
work on all higher versions.
Without prejudice
1
Fiscal Arrangements Model User Guide
June 21, 2003
The user model is approximately 4 megabytes in size and the user is advised to ensure that
sufficient room exists on their computer prior to making or saving versions of the model or its output.
The user model contains several macros; users should enable macros when using this
model.
Without prejudice
2
Fiscal Arrangements Model User Guide
June 21, 2003
Model Structure
The model is organized into two major components as follows:
• First Nation revenues
• First Nation expenditures
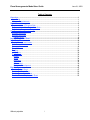
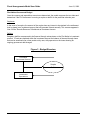
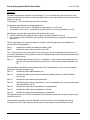
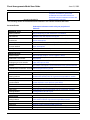
Representation of Revenue Side
First Nation Government revenues are the sum of three main components:
a) Own source revenue –revenue the FN receives through resource extraction, taxation, fees,
charges, investments, commercial activities and other sources excluding transfers.
b) Funding transfers - the model assumes the existence of a funding agreement between
Canada, BC and the First Nation that sets out current and future funding levels for agreed
upon programs and services
c) Other transfers –transfers from other governments for activities outside of a funding
agreement (e.g. implementation, training and resource rehabilitation funding)
Figure 1 - Revenue Structure
Final Agreement
components
Demographic and
employment characteristics
Investments
Charges
Fees
Resource
Other revenues
Funding from
BC for “agreed
upon” program
and services
Tax agreements
Own Source
Revenue
Funding
Transfer
First Nation
Government Revenue
Without prejudice
Funding from
Canada “agreed
upon” program
and services
Other
Transfers
3
Fiscal Arrangements Model User Guide
June 21, 2003
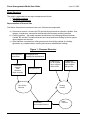
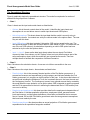
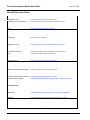
Representation of the Expenditure Side
FN government expenditures are modelled for 5 major categories:
• Education;
• Health;
• Social;
• Capital; and
• Government Services.
Within each of these categories, the model provides the flexibility for adjustment to program
expenditures over time; for example price drivers (inflation) and/or a volume driver (population
growth).
Figure 2 - Expenditure Structure
Demographic and employment
characteristics
Education
Price drivers
Government
Health
Services
Social
Services
Capital &
Housing
First Nation Government
Expenditures
Without prejudice
4
Fiscal Arrangements Model User Guide
June 21, 2003
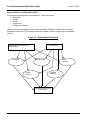
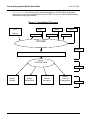
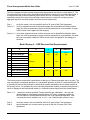
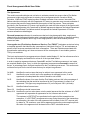
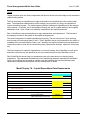
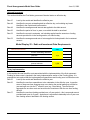
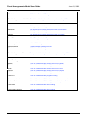
Overview of Outputs used in FRWG Model
Legend
Financial Links
The demographics of the First Nation
influence both demand for program
expenditures and supply of tax revenues.
Demographics
Influences
Outputs used in
Model Evaluation
REVENUES
EXPENDITURES
Other Sources
of OSR
Tax
Revenues
Gross
Transfer
Minus 3. FN OSR
Committed to AUPS
Net
Transfer
Agreed-Upon
Programs &
Services
(AUPS)
Total FN
OSR
Other
NAUPS
Inclusion Rates &
Phase-In
FN OSR
Committed to
AUPS
Net OSR
Total Revenues
Total Expenditures
Surplus/Deficit
In addition to capital payments, 50%
of interest income is returned to the
settlement trust.
Deficit
Surplus
Debt
The investment account receives surpluses and
absorbs deficits where possible. If there is a surplus
in the account at the end of the year it is invested.
The income that is generated by the investment of
surplus forms OSR for the First Nation in the
following year and is subject to inclusion rates
depending on the fiscal option.
Without prejudice
Settlement Trust
Investment
Account
5
Fiscal Arrangements Model User Guide
June 21, 2003
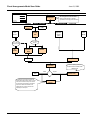
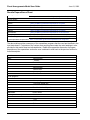
First Nation Government Budget
Once the revenue and expenditure amounts are determined, the model compares the two sides and
determines if the FN Government is running a surplus or deficit for the particular calendar year.
Surpluses:
In the event of a surplus, the amount of the surplus less any interest to be retained in the settlement
trust is placed in an investment account that will generate interest annually. This revenue appears in
Line 8 of the "Results Revenues" Worksheet as Investment Income.
Deficits:
Budgetary deficits are assumed to be financed through a draw down on the First Nation’s investment
account. If funds are depleted within the investment account the balance is financed through loans
that can be amortized over a time period set by user; with payments on the loans showing as
ongoing government debt charges.
Figure 3 - Budget Structure
First Nation
Government Revenue
Surplus
Deficit
First Nation
Government
Expenditures
Without prejudice
6
Fiscal Arrangements Model User Guide
June 21, 2003
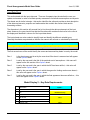
The Spreadsheet Structure
Figure 4 graphically depicts the spreadsheet structure. The model is comprised of a number of
sheets that are grouped into 3 classes.
•
Class 1
Class 1 sheets are the input and control sheets as listed below:
-
Options: this is the main control sheet of the model. It identifies the input sheets and
assumptions in use and allows users to switch input sheets and OSR options.
-
Active Assumptions: This sheet shows the input data that the model is currently using to
generate the results. Its contents are set by the choices made in the options sheet. The user
may not edit this sheet
-
Input OSR options: this sheet contains 6 alternative OSR regimes as set by the user. The
user specifies phase in rates and inclusion rates for each stream of OSR. The model will use
one of the six OSR options in its calculations depending on which OSR option has been
selected on by the user the Options sheet.
-
Input 1 – Input 6: these are the data input sheets where the user inputs First Nation
community data. Once chosen, on the "Options" sheet, an input sheet becomes part of the
active assumptions sheet, which the model will use to generate the results. There are
multiple sheets to facilitate the comparison of different scenarios.
• Class 2
Class 2 sheets are the calculation sheets – these are not visible or accessible to the user.
• Class 3
Class 3 sheets are the output sheets - these sheets are listed below:
-
Results budget: this is the summary financial position of the First Nation government - it
summarizes revenues and expenditures by major category and indicates whether the First
Nation government is in a surplus or deficit position for the year. It also shows the balance of
several funds including the Settlement Trust, the Investment Account, the Loan Account and
the Contingency Account. The Contingency account is an optional account that is created by
the model when the user wished to run an option where OSR is targeted to specific programs
and the FN is responsible for the risk in achieving the determined level of OSR and any cost
over-runs in delivery.
-
Results tax and employment: this sheet provides detail on the employment characteristics of
the First Nation. It includes population projections, employment levels, personal income
levels and sources, social program dependency information and identifies the tax revenue
flow to Canada, BC and the First Nation government under the tax agreement assumptions
that have been made by the user.
-
Results expenditures: this sheet provides an annual projection of First Nation government
expenditures for all expenditure categories modelled.
Without prejudice
7
Fiscal Arrangements Model User Guide
-
June 21, 2003
Results revenues: this sheet provides annual information on all First Nation government
revenues by source and calculates the amount of OSR, if any, that is used to offset funding
transfers from other governments.
Figure 4 - Spreadsheet Structure
Input 1
OSR
Options
Input 2
Input 4
Input 5
Input 3
Input 6
OPTIONS
Class 1
Active Assumptions
MODEL
CALCULATIONS
Class 2
Results
Budget
Without prejudice
Results
Expenditures
Results
Revenues
Results
Tax and
Employment
Class 3
8
Fiscal Arrangements Model User Guide
June 21, 2003
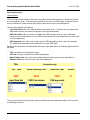
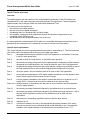
Running the model
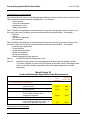
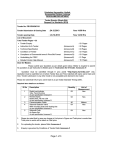
Options Sheet
This is the main control sheet in which the user makes choices and decisions on which set of inputs
to run through the model. The sheet also provides for the choice of OSR inputs. In addition there is
an error indicator to inform the user if any serious input errors exist in the assumptions.
The user must identify the following:
- Input Data Sheet: this is the data sheet the user wishes to run – note the user may rename the
data sheets and the new names will appear in this box automatically.
-
OSR Calculation: this is a choice on whether the OSR inclusion amount is to be calculated
based on annual calculations, or if the OSR inclusion amount is to be determined only at the start
of a fiscal agreement
-
OSR Approach: this is the name of the series of OSR assumptions to be used in the analysis.
The names and assumptions are contained in the input OSR sheet.
Based on the information contained within the chosen input data sheet, the following parameters will
be shown.
-
Title: description of the input data sheet
AIP Year: the year of the AIP was ratified by all parties
-
Base Funding Year: this is the year in which the base funding amounts are negotiated on.
Effective Year: this is the first year of the Final Agreement
Illustration only
Title
AIP Year
Base Funding Year
Effective Year
Errors
2002
2003
2003
0
Input Data Set
OSR Calculation
OSR approach
1
1
3
The errors area will identify any major input error that have been made and contains a link to assist
in identifying the errors.
Without prejudice
9
Fiscal Arrangements Model User Guide
June 21, 2003
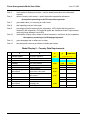
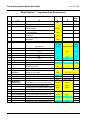
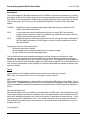
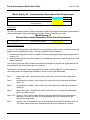
Input OSR Options Sheet
The input OSR options sheet stores up to six, user specified sets of alternative OSR assumptions
that the user can choose from in the options sheet under “OSR Approach”. Note that the values
provided in the spreadsheet are for illustrative purposes only.
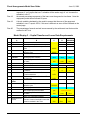
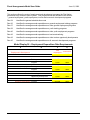
The OSR treatment input requirements are listed in model display 1 (see following page). The line
references refer to the rows in the display and identified in column A of the input data sheets.
Row 1
this row identifies the first 20 years of the Final Agreement.
Row 2
column A is a label set by the user that identifies the OSR regime identified by the block
of rows and columns. This name is automatically picked up and displayed in the options
sheet under OSR Approaches.
Row 2
columns C-V, identifies the OSR phase in schedule, in percent – a value of 0% means
that 0% of the calculated applicable OSR will be applied against the funding transfer
while a value of 100% implies that the full amount of applicable OSR will be applies
against the funding transfer. Applicable OSR is the amount of OSR determined by the
product of OSR and inclusion rate that is to be taken into account when determining the
transfer to a First Nation government.
Row 3
columns C-V, identifies the contingency rate by year for the projection period. This rate
is applied against the calculated amount of applicable OSR and the resulting amount is
deducted from the OSR offset amount and is transferred into the Contingency account.
Rows 4 - 11 identify the inclusion to be applied against the particular sources of OSR identified in
the corresponding column B for the year identified in row 2. The inclusion rate will
range from 0 – 100% and denotes the percentage of the revenue from the particular
OSR revenue source that will be considered as applicable OSR. The sources of OSR
are defined as follows:
Commercial/Investment:
-
income accruing to the First Nation government from the return on investment of their nonsettlement trust investments, including the investment and contingency accounts.
-
Investment income generated through invested surplus would also be included here.
Settlement Trust:
-
income accruing to the First Nation government from the return on investment of the cash portion
of the capital transfer. It is assumed that these funds are held in a non-taxable settlement trust.
Income earned by the settlement trust is dependent on the data inputs in the Cash and Loans
section of the input sheet.
Resources:
-
revenues from resource activities.
Fees and Charges:
-
revenues accruing to the First Nation government from the imposition of fees and charges.
Values follow from what the user places in the OSR input section of the assumptions sheets.
Without prejudice
10
Fiscal Arrangements Model User Guide
June 21, 2003
Property tax:
-
revenues accruing to the First Nation government from the collection of property tax on all
classes of property on TSL or under a tax agreement with BC. Both the local and provincial
portions of property tax can be modelled.
-
The user inputs all assessed values and mill rates for any particular community modelled.
All other tax revenues:
revenues accruing to the First Nation government from the collection of all non-property related
direct taxes or tax revenues transferred to the First Nation government under a tax agreement
with either Canada or BC or both. Values are determined by the taxes generated by residents
and assumptions on tax agreements between the parties.
-
Corporate transfers:
First Nation corporation profits transferred from the corporate entity to the First Nation
government. Profits are assumed not to be subject to OSR inclusion until they are transferred to
the First Nation government. Values are calculated based on the profitability of the enterprises
and assumptions on the portion of profits transferred to the First Nation government
-
All other sources:
-
other sources of OSR not included in the above categories (e.g. lease revenues).
-
Values are input by the user within the OSR input section of the assumptions sheets.
Model Display 1 – OSR Data Requirements
A
B
C
D
E
F AND ON
1
2
3
4
Phase in schedule - general
Contingency rate
Inclusion rate - Commercial/Investment
7%
0%
50%
13%
0%
50%
20%
0%
50%
27%
0%
50%
Inclusion rate - Settlement Trust
Inclusion rate -Resources
Inclusion rate -Fees & Charges
Inclusion rate - Property Tax
Inclusion rate - all other tax revenue
Inclusion rate -corporate transfers
Inclusion rate - all other sources
50%
50%
50%
50%
50%
50%
50%
50%
50%
50%
50%
50%
50%
50%
50%
50%
50%
50%
50%
50%
50%
50%
50%
50%
50%
50%
50%
50%
1
2 Option name
3
4
5
6
7
8
9
10
11
Without prejudice
11
Fiscal Arrangements Model User Guide
June 21, 2003
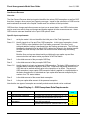
Input Data Sheet
This section deals with the input data sets. There are 6 separate input sheets that the user can
update and rename in order to facilitate speedy assessment of alternative assumptions and impacts.
The sheets are all similar in design - this section identifies the cells and provides a short description
of the data requirements, purposes and mathematics that underlie the sections’ data and/or
forecasting routines.
The discussion in this section will proceed line by line through the data requirements of the input
sheet. However, the user should note that the line references contained herein refer to the rows in
the display and identified in column A of the input data sheets.
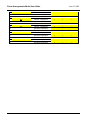
The input sheets are colour coded to simplify input and identify the different variable types.
Generally the sheets are protected so that the user cannot edit cells set or calculated by the model
Light blue cells are set or calculated by the model
Yellow cells identify user inputs
Grey cells are fixed and can not be changed – these usually refer to years or titles
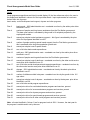
The first several rows of the model identify the names and assumed key dates in use by the model:
Row 1
is the sheet name and is set by the user when/if the sheet is renamed and will appear
on the Options sheet.
Row 3
is set by the user and is the title of the particular set of assumptions – this name will
appear on the title section of the Options sheet
Row 5
is set by the user and is the year in which the AIP has been ratified; – this value will
appear on the Options sheet.
Row 6
is set by the user and is the year in which the agreed-to funding numbers are based; –
this value will appear on the Options sheet.
Row 7
is set by the user and is the year in which the final agreement becomes effective; – this
value will appear on the Options sheet.
Model Display 2 – Key Date Requirements
1
2
3
4
5
Sheet name
Title
input 1
Illustration only
Year of AIP
2002
6
Base year of funding amount
2003
7
Effective Year
2005
Without prejudice
12
Fiscal Arrangements Model User Guide
June 21, 2003
Capital Transfer and Loans
Overview
The capital transfer and loans portion of the model identifies the transfer to the First Nation from
Canada and BC of the cash component associated with the Final Agreement. The model places
capital transfers into a category within the model called Settlement Trust.
The main inputs to this section are:
• the amount of the capital transfer;
• the rate of return on capital transferred,
• outstanding loans to Canada and BC at effective date,
• the schedule of payments of the capital transfer and the schedule of repayments of any
negotiation loans if different; and
• any distribution and/or expected transfers out of the fund.
It is assumed that the capital transfer will be held in a non-taxable settlement trust and that income
generated by the settlement trust is treated as own source revenue to the First Nation.
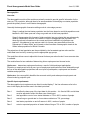
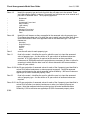
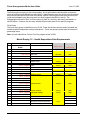
Specific Input requirements
The Capital transfer and Loans input requirements are listed in model display 3. The line references
refer to the rows in the display and not the rows in the data input sheet.
Row 1
the capital transfer amount identified in the Final Agreement, in real dollars, in the year,
in which it was agreed upon
Row 2
the year in which the cash amount, in real dollars was agreed to.
Row 3
the annual percentage interest rate for the capital transfer component in effect between
the agreed upon date identified in line 2 and the effective year of the Final Agreement.
Row 4
the annual percentage interest rate the capital transfer component post-effective year of
the final agreement and in effect until the capital transfer component is fully paid.
Row 6
set by the model - this row identifies the first 20 years of the Final Agreement.
Row 7
the annual percentage payout of the capital transfer component over the agreed to time
frame. Note the pay out period cannot exceed 20 years.
Row 8
A check variable calculated by the model to ensure that the sum of payments in row 7
equals 100%, if it does not an error will be indicated on the options sheet.
Rows 10-11 identifies annual (in accordance with the years in row 6) transfers and disbursements
from the capital transfer.
Row 12
the annual percentage interest rate earned by the settlement trust in nominal terms.
Row 13
the annual percentage interest rate earned by the settlement trust in real terms – this is
the rate used to determine income from the settlement trust for OSR inclusion
calculations.
Row 15
total amount of outstanding negotiation loans on effective date, dollars
Row 16
repeats of line 6
Row 17
a decision is made by the user on the appropriate repayment schedule of the loans –
the user can choose to use a schedule similar to that identified in row 7 (the payment
schedule of the capital transfer) or the schedule the user specifies in row 17. A
Without prejudice
13
Fiscal Arrangements Model User Guide
June 21, 2003
response of “yes” implies that row 7 schedule will be used a reply of “no” chooses the
schedule in row 17.
Row 18
the annual percentage repayment of the loans over the agreed to time frame. Note the
repayment period cannot exceed 20 years.
Row 19
A check variable calculated by the model to ensure that the sum of the repayment
schedule in row 17 equals 100%, if this sum is different an error will be indicated on the
control page
Row 20
The percentage of annual nominal income earned by the settlement trust that must be
retained in the Trust
Model Display 3 – Capital Transfer and Loans Data Requirements
1
2
3
2006
2007
10%
10%
10%
Capital Transfer
Cash amount in real dollars
Base year of capital amount
Agreed upon rate of return pre effective
year
Agreed upon rate of return post
effective year
1,000,000
2000
Gross payment schedule
Input % payments schedule, must sum
to 100%
Sum of % payments schedule
Payment
schedule
8
9
10
11
12
13
4.00%
4.00%
100%
Distributions
0
0
0
Transfers
Nominal rate of return on Settlement
Trust investments
Real rate of return on Settlement Trust
investments
0
0
0
2006
2007
4.0%
2.0%
Negotiation
Loans
15
Total outstanding loan amount on
effective year
16
17
Gross payment schedule
18
19
20
2005
C
7
14
E
ONWARDS
B
4
5
6
D
A
Settlement trust
income
Without prejudice
100,000
2005
Use Capital payment schedule
Input % payments schedule, must sum
to 100%
Sum of % payments schedule
yes
10%
100%
Percent of annual nominal income that
must be retained in the Trust
50%
Input yes or no
10%
50%
10%
50%
14
Fiscal Arrangements Model User Guide
June 21, 2003
Own Source Revenue
Overview
The Own Source Revenue data input section identifies the various OSR exemptions as well as OSR
from fees, charges, other sources and Forestry resources. Inputs for the calculation of OSR from tax
and investments are made in the Capital Transfer and Tax sections of the input sheet.
OSR from fees, charges and other sources are input on an annual basis – two OSR inclusion rates
may be used; one rate for fees and charges and another against all other revenue sources – these
OSR inclusion rates are identified in the “input OSR options” sheet.
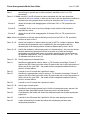
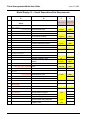
Specific Input requirements
Row 1
set by the model - this row identifies the initial year of the Final Agreement
Rows 2 -3
identify inputs for a Cap and Floor OSR exemption. In this type of exemption, a basic
floor of OSR is to be available to the First Nation government; if the floor is not
achieved addition funding is transferred from the funding governments. The OSR cap
identifies the threshold level at which OSR is taken into account in the funding transfer.
All OSR less than the cap is not taken into account when determining the funding
transfer.
Both the floor and cap are determined by multiplying the per capita cap and floor
amounts but the total status Indian population of the First Nation
Row 2
is the dollar amount of the per capita OSR Cap
Row 3
is the dollar amount of the per capita OSR Floor
Rows 5 -6
identify inputs for a basic and personal OSR exemption. The basic OSR exemption is a
constant dollar exemption applied to total OSR. It therefore represents the amount of
OSR that can be earned annually prior to the imposition of an offset. The personal
OSR exemption is a per capita OSR exemption which is applied in a similar fashion to
the basic exemption but is calculated as a per capita dollar amount multiplied by the
number of on TSL status Indians.
Row 5
is the dollar amount of the annual basic exemption
Row 6
is the per capita dollar amount of the personal exemption
Note that the two types of exemption are mutually exclusive and should not be combined
Model Display 4 – OSR Exemptions Data Requirements
1
2
2005
Cap and floor exemption
3
5
Basic and Personal
exemption
6
Without prejudice
Per capita OSR exempt cap $/status (on+off TSL)
0
Per capita OSR floor $/status (on+off TSL)
0
Basic OSR exemption $
0
Personal OSR exemption $/status Indian on TSL
0
15
Fiscal Arrangements Model User Guide
June 21, 2003
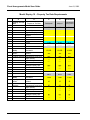
The fees, charges and other revenue sources data requirements are listed in model display 5. The
line references refer to the rows in the display and identified in column A of the input data sheets. It
is assumed that the revenues identified in this section are net of collection costs. The user may
specifically identify the name of the particular revenue source in column B or simply input an
aggregate figure for fees and charges and other sources respectively
Row 1
set by the model - this row identifies the first 20 years of the Final Agreement
Rows 2 -7
up to six separate sources of fees and charges can be identified and listed in these
rows, the units are assumed to be net revenues expressed in current dollars. A single
OSR inclusion rate is applied to this category.
Rows 9 -11 up to three separate sources of other revenues can be identified and listed in these
rows, the units are assumed to be net revenues expressed in current dollars. As noted
the user may specify a different OSR inclusion rate to be applied to this category of
revenues.
Model Display 5 – OSR Revenue Data Requirements
A
B
C
D
E ONWARDS
2005
2006
2007
fee1
100
100
100
fee2
fee3
charge 1
charge 2
charge 3
200
300
100
200
300
200
300
100
200
300
200
300
100
200
300
500
5,000
50,000
500
5,000
50,000
500
5,000
50,000
1
2
3
4
5
6
7
8
9
Fees and Charges
Other sources of OSR
10
11
other
other
other -lease
The forestry section begins with a specification of the type of Forestry enterprise that is in place. The
user may specify a stumpage approach or a corporation approach in which it is assumed that the FN
is operating its own forestry enterprise. Note that the forestry calculations do not model volatility in
the forestry sector. For example they do not include the potential volatility in demand for timber as a
result of changes in the international market (i.e. softwood lumber dispute with the United States).
Rows 1 – 2
identify the method by which Forestry activities are undertaken. – the user can
choose between a Stumpage approach where a 3rd party is charged royalties by
the First Nation to harvest forest resources and a FN corporation approach. Row
1 requires the choice variable “yes” or “no” – row 2 indicates the inverse of row 1
Row 3
set by the model - this row identifies the first 20 years of the Final Agreement
Row 4
annual allowable cut in cubic meters by year for the first 20 years of the Final
Agreement.
Without prejudice
16
Fiscal Arrangements Model User Guide
June 21, 2003
Row 5
cubic meters of timber per hectare – used to determine hectares to be harvested
annually
Row 6
timber inventory cubic meters – used to determine depreciation allowance
Assumptions pertaining to the FN corporation approach:
Row 7
gross sales value (i.e. revenue) per cubic meter
Row 8
total operating cost per cubic meter
Row 9
percentage of profits retained by the corporation, 100% implies that all revenue is
retained by the corporation, 0% implies all profits are transferred to the FN government,
value may range between 0 and 100%
Row 10
reforestation cost per cubic meters of timber harvested, a cost borne by the corporation
Assumptions pertaining to the Stumpage Approach:
Row 11
gross stumpage rate in dollars per cu meter
Row 12
fees and permit revenue per hectare in dollars per hectare
Model Display 6 – Forestry Data Requirements
A
1
2
3
4
B
C
Forestry option
Stumpage Approach
FN Corporation Approach
yes
no
2005
Forestry
AAC (cubic meters)
3,000
5
cu meters/hectare
20.00
6
7
Timber inventory
100,000
FN corporate approach
assumptions
8
9
10
11
Stumpage approach
assumptions
12
Without prejudice
Sales value /cubic meter
Labour and logging costs per
cubic meters
Retained earnings - by corp.
Reforestation cost /m3
10.00
50.0%
1.00
Stumpage rate
10.00
Fees and permits per hectare
20.00
D
E ONWARDS
Input yes or no
Proceed
2006
2007
3,000
3,000
20.00
17
Fiscal Arrangements Model User Guide
June 21, 2003
Demographics
Overview
The demographic module of the model was primarily created to provide specific information for the
status on TSL population, although there is an accommodation for identifying non-status population
growth the primary focus in on the status demographic.
Generally the demographic forecast modeling works in a two-stage process:
Stage 1 predicts the total status population into the future based on an initial population count
based on a 2001 base year and a long run growth rate in this base population.
Stage 2 disaggregates this forecast of total population into age cohorts that are subsequently
used by various other routines in the model. In order to disaggregate the population in to
these age cohorts information on the current and future breakdown of population was
required. A breakdown by age and sex ratio’s for futures years was obtained from the
Department Of Indian Affairs, and is based on their forecasts of demographic trends in the
Status Indian population for British Columbia.
The projections of total population are then multiplied by the forecasted age/sex ratios and the
cohort data is arrived at by summing over the appropriate age groups.
The model then allows users to adjust this forecast for base year cohort levels if more accurate data
is available.
The model allows for two methods of determining future employment and income levels.
Option one - determines employment levels as a result of initial and target participation.
Projection on employment levels by sex, type of employment and location are then obtained through
the use of the demographic projections and user inputs of participation, employment and location
variables and projections.
Option two - the user explicitly identifies the economic activity and subsequent employment and
income levels by projection year.
Specific Input requirements
The demographic input requirements are listed in model display 7. the line references refer to the
rows in the display and not the rows in the data input sheet.
Row 1
identifies the base year of the input data for this section – It is fixed at 2001 and all data
must be adjusted to reflect this base year of data input
Row 2
total population count of non- status residents on TSL in 2001, number of people
Row 3
annual long run growth rate in of non-status residents on TSL, percentage
Row 4
total status population on and off reserve in 2001, number of people
Row 5
actual or expected proportion of status Indians living on TSL in 2001, number of people
Without prejudice
18
Fiscal Arrangements Model User Guide
Row 6
June 21, 2003
annual long run growth rate of status residents, identified on line 5, on TSL,
percentage
Rows 9 -14 Note: columns C and E will show the value associated with the input data sheet
selected in the Options sheet, in order for the user to alter the population numbers as
outlined here, the input data sheet must first be selected in the Options sheet
Column C
shows the models initial disaggregation of the base 2001 on TSL population into
cohorts
Column D
is available for the user to input any changes to the model’s initial forecast of
population by cohort,
Column E
shows the model’s final disaggregation of the base 2001 on TSL population into
cohorts
Note: there is a restriction on the age cohorts that they must sum to the 2001 on TSL population
number as input on row 5
Rows 15 -16
identify net migration of status Indians by year on/off TSL, number of persons. Note:
the actual annual population count is adjusted by the net migration after the
determination of the total population forecast as determined by rows 5 and 6
Rows 18 -19
identify the method by which employment is to be determined – the user can choose
between determining employment levels as a result of an initial and a target
participation and employment rate or by explicitly identifying the year and quantum
on additional employment. Row 18 requires the choice variable “yes” or “no” – row
19 indicates the inverse of row 18.
Rows 21 - 24
identify employment characteristics.
Row 21
identifies the participation rate for status on TSL females, percentage. Column D
requires the 2001 base level while column E requires the user to input a projection of
these rates for the year 2025 – the model will then interpolate between these two
points in a linear fashion.
Row 22
is similar to row 21 except that it pertains to males
Row 23
identifies the unemployment rate for status on TSL females, percentage. Column D
requires the 2001 base level while column E requires the user to input a projection of
these rates for the year 2025 – the model will then interpolate between these two
points in a linear fashion.
Row 24
is similar to row 21 except that it pertains to males
Rows 27- 30
identify type of employment
Row 27
identifies the initial and projected level of full-time female employment, percent- the
model will then interpolate between these two points in a linear fashion.
Row 28
is calculated by the model and shows the subsequent part-time female employment
projections.
Row 29
is similar to row 28 except that it pertains to full time male employment rates
Row 30
is also calculated by the model and shows the subsequent part-time male
employment projections.
Without prejudice
19
Fiscal Arrangements Model User Guide
June 21, 2003
Model Display 7 – Population Data Requirements
A
B
1
2
C
D
E
ONWA
RDS
2001
Population
3
4
5
6
Total non-status population on TSL
Annual long run growth in non-status on
TSP population
Total status population on plus off reserve
- mid year value
Total status population on reserve - mid
year value
Annual long run growth rate for status
Population
7
8
age cohorts
10
2.00%
1000
500
3.00%
final
Raw model
model
results user adjustment results
9
0-4
50
50
50
10
5-14
103
100
100
11
15-65
323
300
300
12
65+
23
50
50
13
Total
500
500
500
Year
Net migration (impacts after application of
LR annual gr rate)
2001
2002
2003
0
0
0
14
15
16
17
18 Employment
projections
19
Based on user targets
Based on economic development projects
20
21
22 Employment
Participation rate female status Indian
Characteristics
23
Participation rate male status Indian
24
Unemployment rate female status Indian
25
Unemployment rate male status Indian
26
27 Type of employment % employed females, employed full time
28
29
30
Without prejudice
% employed females, employed part time
% employed males, employed full time
% employed males, employed part time
yes
Input yes or no
no
2001
2025 target
51.9%
51.9%
64.9%
22.4%
34.5%
2001
64.9%
22.4%
34.5%
2025 target
32.5%
32.5%
67.5%
26.0%
74.0%
67.5%
26.0%
74.0%
20
Fiscal Arrangements Model User Guide
June 21, 2003
Tax
Overview
The model includes procedures for estimating First Nation tax revenues. It is important to note that
these estimates will differ from estimates produced by the Department of Finance. While the FRWG
model provides a ballpark estimate of tax revenue, interested First Nations should work directly with
the Department of Finance to generate more accurate estimates of the revenues that would be
associated with the exercise of their tax powers. Tax sharing arrangements with Canada will be
bilateral agreements between the federal Department of Finance and individual First Nations and will
incorporate the federal Department of Finance revenue estimation methodologies.
A matrix is set out in the model to enable the user to specify the type of tax agreement that may exist
between the First Nation and British Columbia or Canada, the year it commences and the
percentage of tax revenues received by the First Nation government under the tax agreement.
The tax input requirements are listed in model display 8, the line references refer to the rows in the
display and identified in column A of the input data sheets.
Row 1
title line for rows 2 and 3
Row 2
column C number of years that an exemption on transactions taxes is in place – note
this variable only influences GST and PST calculations
Row 2
column D percentage of transactions tax capacity exempted during the exemption
period
Row 3
column C number of years that an exemption on personal income taxes is in place
Row 3
column D percentage of income tax capacity exempted during the exemption period
Row 6
identifies the year for the values in rows 2-4
Rows 6-8
annual value of taxes collected or provided to the First Nation government under a tax
agreement for Tobacco, Fuel and Alcohol respectively, annual dollars.
Row 10
percentage of expenditures made on goods and services subject to the PST and GST
Row 11
the provincial sales tax rate (PST), percent – currently 7.5%
Row 13
the GST rate, percent – currently 7%
Model Display 8 – Tax Data Requirements
A
B
C
Length of
exemption (years)
D
% tax
exempted
Transactions Taxes
8
50%
Income taxes
12
50%
1
2
Tax Exemptions
3
4
5
6
2001 estimated value
Sales Tax income
7
Without prejudice
Tobacco annual $
1,000
Fuel annual $
2,000
21
Fiscal Arrangements Model User Guide
8
June 21, 2003
Alcohol annual $
9
10
3,000
% Expenditures on PST/GST
G&S
BC Provincial Sales Tax PST rate
GST
GST/FNST rate
11
12
50%
7.5%
7%
Additional Tax Revenues
The model allows for a tax agreement between Canada and the First Nation in the area of personal
income tax that includes income tax paid by all residents on TSL. The demographic and
employment portions of the model calculate the portion of income tax payable by on TSL status
members; the tax payable by other residents is an exogenous input as follows.
Row 1
fixed in the model – identifies the year for which the user is to input the estimated value
of any personal income tax transfer.
Row 2
the annual dollar value of the non-status residents component of personal income tax
agreement between Canada and the First Nation government.
As a default the model also calculates the value of the FNST bases on the simplified approached as
developed by department of Finance. However, in some cases the actual amount of the FNST
agreed to will be known and the user may want to input data that supercedes the results of the
simplified approach. Row 3 provides the flexibility to overwrite the model calculations of the FNST.
Row 3
the amount of FNST estimated to be transferred to the First Nation Government under
a FNST agreement with Canada this value replaces the FNST value calculated by the
model.
Model Display 9 – Additional Tax Revenues
1
2
PIT agreement
3
FNST
PIT transfer from non-Status TSL
residents (annual $)
FNST, annual , $/year - default is
simplified approach
2001
2002
2003
0
0
0
0
0
0
Property Tax
The property tax input requirements are listed in model display 10, the line references refer to the
rows in the display and identified in column A of the input data sheets.
Property taxes are calculated for 9 different categories of land and up to 5 separate mill rates. In
addition, property tax calculations are made for 2 distinct owners on TSL, status Indians and nonmember residents. The distinction is made in order to allow for separate modeling of property tax
types (i.e. local vs. provincial portions of property tax, and member vs. non-member tax payers).,
This section is limited to the issue of mill rate and land assessment values - section 3 deals with the
timing and existence of agreements that cover the different components of property tax flows.
.
Without prejudice
22
Fiscal Arrangements Model User Guide
Rows 1-3
-
Rows 4-8
-
June 21, 2003
identify the property type and units for which the mill rates are to be entered. There
are 9 rate classes noted in columns C through K and mill rates are to be entered as $
per $000 of assessed value. The 9 property types are:
Residential
Utilities1
Unmanaged Forest Land
Major Industry
Light Industry
Business
Managed Forest Land
Recreation Non-Profit
Farm
identify the mill classes as they are applied to the assessed value by property type.
Five classes have been set up to allow the user to easily input the value. Note a zero
should be entered if there is no applicable rate for that class and type. The 5 mill
classes are:
Municipal
Regional Dist (H)
Hospital
School
Other
Row 9
sums the mill rates for each property type.
Row 11
fixed in the model – identifies the year for which the user is to input the assessed
value of property type – for this section a 35 year outlook of assessed values are
required. A 35 year projection is required as this section as does population,
commences in 2001and therefore the projections are necessary in order to allow for
scenarios in which effective date is set at a future data and to still accommodate a
further 20 year outlook..
Rows 12-20 the 35-year projection of assessed values for each of the 9 property types identified in
column B for status landowners or status property tax payers. Note that assessed
values must be input as the actual assessed values divided by 1,000 as mill rates are
applied per $1,000 of assessed property value..
Row 22
fixed in the model – identifies the year for which the user is to input the assessed
value of property type – for this section a 35 year outlook of assessed values are
required.
Rows 22-31 the 35-year projection of assessed values for each of the 9 property types identified in
column B for all other (non-status) landowners or other (non-status) property tax
payers. Note that assessed values must be input as the actual assessed values
divided by 1,000 as mill rates are applied per $1,000 of assessed property value.
$’000
Without prejudice
23
Fiscal Arrangements Model User Guide
June 21, 2003
Model Display 10 – Property Tax Data Requirements
1
A
B
C
D
E ONWARDS
Property Tax mill
rates
Purpose of Tax Rate
Residential
{1}
$/1000
5.73
0.55
0.69
4.29
Utilities1
{2}
$/1000
42.22
2.58
2.40
15.00
Unmanaged
Forest Land
{3}
$/1000
14.80
1.34
3.96
12.00
0.39
2.84
1.09
11.64
65.03
33.19
2001
2002
2003
10,000
10,000
10,000
100
200
300
400
500
600
700
800
100
200
300
400
500
600
700
800
100
200
300
400
500
600
700
800
2001
2002
2003
1,000
1,000
1,000
10
10
10
20
30
40
50
60
70
80
20
30
40
50
60
70
80
20
30
40
50
60
70
80
2
3
4
5
6
7
8
9
10
11
12
13
14
15
16
17
18
19
20
21
22
23
24
25
26
27
28
Municipal
Regional Dist (H)
Hospital
School
Other
TOTAL
Assessed values
Residential
($'000)
Property owned or
Utilities1
leased
by status residents Unmanaged Forest Land
Major Industry
Light Industry
Business
Managed Forest Land
Recreation Non-Profit
Farm
Assessed values
($'000)
Residential
Property owned or
leased
Utilities1
by non-status
Unmanaged Forest Land
residents
Major Industry
Light Industry
Business
29
Managed Forest Land
30
31
Recreation Non-Profit
Farm
Without prejudice
24
Fiscal Arrangements Model User Guide
June 21, 2003
Homeowners Grant
The Home Owners Grant (HOG) input requirements are listed in model display 11, the line
references refer to the rows in the display and identified in column A of the input data sheets.
The following assumptions deals with the application of the HOG to residential taxpayers – the
default assumption is that the government who is receiving provincial (“school tax”) portion of
property taxes is funding the HOG program.
Row 32
identifies the number of homes that qualify for the HOG by ownership as noted by the
column headers in row 33
Row 33
the percentage of homes, by ownership type, identified in row 34 that have an
assessed value less that that noted in column C of row 35
Row 34
identifies the number of homes that qualify for the HOG by ownership as noted by the
column headers in row 33
Row 35
column C – this value is calculated by the model and is based in the minimum assed
value required to qualify to receive the HOG
Row 35
the percentage of homes, by ownership type, identified in row 34 that have an
assessed value less that that noted in column C of row 35. These homes fall under the
lower threshold for the HOG and do not qualify
Row 36
column C – this value is calculated by the model and is based in the minimum assed
value required to receive the full value of the HOG
Row 36
identifies the percentage of homes, by ownership as noted by the column headers in
row 33, that have an assessed value that falls between the floor (row 35 column C) to
start receiving the HOG and the floor (row 36 column C) that receive the full value of
the HOG. In other words this is the percent of homes that receive a partial HOG
Row 37
the annual dollar value of the home owners grant (HOG)
Model Display 11 – Home Owners Grant (HOG) Data Requirements
32
A
B
C
D
Property
owned or
leased by
status Indians
E
Property
owned or
leased by
others
200
1
30,077
10%
0%
81,522
40%
0%
470
470
33
Home Owners Grant
34
35
36
37
Without prejudice
total residential units that
may qualify for HOG
%not receiving HOG i.e.
whose assessed value is
less than
% receiving partial amount
i.e. those whose value are
between
value of HOG (individual)
25
Fiscal Arrangements Model User Guide
June 21, 2003
Tax Agreements
The model uses methodologies set out below to estimate potential tax revenue that a First Nation
government might receive pursuant to entering into a tax agreement with Canada or British
Columbia. While the FRWG model provides a ballpark estimate of tax revenue, interested First
Nations should work directly with the Department of Finance to generate more accurate estimates of
the revenues that would be associated with the exercise of their tax powers. These estimates
provided by the Department of Finance could possibly be used with other outputs of the fiscal model.
Tax sharing arrangements with Canada will be bilateral agreements between the federal Department
of Finance and individual First Nations and will incorporate the federal Department of Finance
revenue estimation methodologies.
Personal income tax estimates for members are derived using demographic data, employment
characteristics (including participation rates), assumptions about the proportion of members working
full time or part time positions and in high or low wage positions, and current federal personal
income tax rates.
Consumption tax (First Nations Goods and Services Tax “FNGST”) estimates are derived using
a simplified approach that identifies the consumption of individuals living on TSL and estimates an
amount of tax revenues associated with their consumption. There are limitations associated with
this estimation methodology as it does not account for the consumption of non-durable goods on
TSL by non-residents.
The input requirements for tax agreements are listed in model display 12, the line references refer to
the rows in the display and identified in column A of the input data sheets.
In order to model an agreement between Canada/BC and the First Nation government, two inputs
are required, first the year, if any, in which the agreement commences and second the amount of
the tax, in percentage terms, that gets transferred to the First Nation government. This section sets
out these two inputs for the various taxes that may be subject to agreement.
Col A&B
identifies the various taxes that may be subject to an agreement in this model
Col C
identifies the year in which such a tax agreement is assumed to occur; if no tax
agreement is contemplated this number should be set to 9999
Col D
identifies the share of tax room that the First Nation receives; this is the percentage of
the calculated tax that would be transferred to the FN government in extent of an
agreement. This figure may range between 0% (no funds) and 100% (all funds).
Row 2-3
identifies federal income taxes
Rows 5-6
identifies provincial income taxes
Rows 8-12 identifies the various sales taxes; note the model assumes that the existence of a FNST
agreement will supercede all agreements for fuel, tobacco and alcohol.
The treatment of GST/FNST are predicated on the period of the transactions tax
exemption - If a GST/FNST tax agreement occurs during the period of the transactions
tax exemption, the value of the tax agreement will be based on the GST revenue paid
by status on TSL members, once the tax agreement enters the post exemption period –
the value of the agreement will be based on the FNST calculated amount.
Without prejudice
26
Fiscal Arrangements Model User Guide
June 21, 2003
Rows 14-17 identifies the school and non-school portions of property tax paid by status and all other
residents on TSL.
Model Display 12 – Tax Agreement Data Requirements
A
B
1
Tax room or coordination agreements
C
Year agreement
commences
D
Transfer
Rate
2
Federal income tax
3
4
5
Personal income
Corporate Income
2016
9999
95%
95%
Provincial income tax
6
7
8
Personal income
Corporate Income
9999
9999
95%
95%
Sales tax
FNST/GST
2012
95%
PST
Tobacco
Fuel
Alcohol
9999
2002
2002
2002
95%
95%
95%
95%
2003
100%
2003
100%
2003
100%
9999
100%
9
10
11
12
13
14
Property Tax
15
16
17
Without prejudice
Rural/Munic component
status residents
School component status residents
Rural/Munic component
all other residents
School component
all other residents
27
Fiscal Arrangements Model User Guide
June 21, 2003
Funding
Overview
The funding portion of the model identifies the funding transfer to the First Nation from BC and
Canada associated with the following types of funding, by major program area:
• funding amount for Agreed upon programs and services
• funding amounts for implementation – both one-time and 5 year
• funding amounts for programs and services outside of the final Agreement
The main inputs to this section are the agreed to funding amounts in dollars or the year in which the
funds are agreed to.
Specific Input requirements
The funding input requirements are listed in model display 13. The line references refer to the rows
in the display and identified in column A of the input data sheets.
Rows 2 through 10 identify the agreed to funding amounts, typically contained in a Fiscal Financing
Agreement or other similar fiscal agreement. The model identifies 5 funding categories for both
Canada and BC and allows the user to set funding amounts for future FFA agreements.
Column C identifies the funding amounts for Canada on the agreed to funding year Column D
identified the BC amounts also in the agreed to funding year as noted in row 2. Columns E and F
identify the same funding categories for the second FFA, columns G and H identify the funding
amounts for the third FFA while columns I and J identify the same for the fourth FFA.
The default calculation is for effective date funding amounts by apply the pre effective date adjusters
to the agreed to funding amounts identified in column D and E and escalating those values to
effective date, post effective date funding amounts are determined by applying the post effective
date adjusters to the effective date funding amount.
If the user wishes to manually input different funding amounts to be contained in future FFA’ s then
columns E through J allows the user to input data which ill supersede the models calculation for that
year and the adjusters will be applied to this new number from that point on.
Note that the agreed upon values for future FFA’s are required to be in the dollars for that future
year.
Row 2
set by the model – this is the year in which the funding for agreed-upon programs and
services was agreed to.
Row 3
denotes the Canada and BC columns for the input of the subsequent funding amounts.
Row 4
Canada and BC funding amount for Health
Row 5
Canada and BC funding amount for Education
Row 6
Canada and BC funding amount for Social
Row 7
Canada and BC funding amount for Capital Assets
Row 8
Canada and BC funding amount for Government
Without prejudice
28
Fiscal Arrangements Model User Guide
June 21, 2003
Row 9
sum of rows 4 through 8
Row 10
identifies an option in which the user specifies a total Canada funding amount rather
than funding by individual component. Values in this cell greater than 100 will
supercede the component approach. This funding option has specific universal preand post-adjusters associated with it – as identified in line 10 of the adjusted matrix
below. Note this option only applies to funding from Canada.
Row 12
Canada and BC one time funding amount for Laws
Row 13
Canada and BC one time funding amount for Training
Row 14
Canada and BC one time funding amount for all other implementation costs
Row 16
Canada and BC annual for each of 5 years funding for resources
Row 17
Canada and BC annual for each of 5 years funding for training
Row 18
Canada and BC annual for each of 5 years funding for all other one time ongoing
funding
Rows 20-26 funding for non final agreement funding amounts – the user may input the funding
organization for reference and note ant associated funding amounts, line 26 is by
default all other funding agencies not noted in lines 20-25
Model Display 13 – Funding Data Requirements
A
B
1 Agreed upon funding amount by program area
2
Base year for funding amount
C
D onwards
2003
2003
Canada
BC
Health
Education
Social
Capital
Government
1,000,000
1,000,000
1,000,000
1,000,000
1,000,000
125,000
125,000
125,000
0
125,000
Total
5,000,000
500,000
3
4
5
6
7
8
9
10
Single block amount
(Canada only)
11 Treaty related
12 One Time - Implementation
13
14
15
16 One time - 5 year - per annum
17
Without prejudice
Total Block Approach (supercedes component approach
if non zero)
0
Laws
Training
Other
Canada
1,000,000
0
0
BC
100,000
0
0
Resource
Training
0
0
0
0
29
Fiscal Arrangements Model User Guide
18
19
20 Other non-FA funding
21
other
22
23
June 21, 2003
0
0
Canada
BC
100,000
0
FRBC - replanting
0
100,000
Ministry Of Health
100,000
0
24
Health Canada
100,000
0
25
26
Ec-dev
all other
100,000
0
0
0
Organization
DFO - shell fish
Adjusters
The adjusters component of the funding portion of the model identifies the annual adjustments made
to the agreed upon funding amounts. Two periods of adjustments are considered – the period from
the agreed up data to effective day and the period post effective day. Two types of adjusters are
considered; price and volume.
Adjusters are applied multiplicatively to the funding amounts in a compounding manner in order to
escalate the initial funding amounts to determine the funding amount for every future year of the
projection period.
Specific Input requirements
The funding input requirements are listed in model display 14. The line references refer to the rows
in the display and identified in column A of the input data sheets.
Rows 1-5
identifies Canada’s adjuster matrix for the program and services identified in column B.
column C identifies the price and volume adjuster in percentage terms in effect over the
per effective date period.
column D identifies the price and volume adjuster in percentage terms in effect over
the post effective date period.
Row 6
identifies Canada’s adjuster for the single block amount funding option.
column C identifies the price and volume adjuster in percentage terms in effect over the
per effective date period.
column D identifies the price and volume adjuster in percentage terms in effect over
the post effective date period.
Rows 10-14 Identifies BC’s adjuster matrix for the program and services identified in column B.
column C identifies the price and volume adjuster in percentage terms in effect over the
per effective date period.
column D identifies the price and volume adjuster in percentage terms in effect over
the post effective date period.
Model Display 14 – Adjusters Data Requirements
Without prejudice
30
Fiscal Arrangements Model User Guide
A
B
Funding Adjusters
1
2
3
4
5
6
8
C
D
Pre effective date
Post effective date
Canada adjuster matrix
Price
Volume
Price
Volume
Health
Education
Social
Capital
Government
UNIVERSAL - Single block
approach only
1.0%
1.0%
1.0%
1.0%
1.0%
2.0%
2.0%
2.0%
2.0%
2.0%
1.0%
1.0%
1.0%
1.0%
1.0%
2.0%
2.0%
2.0%
2.0%
2.0%
1.0%
2.0%
1.0%
2.0%
BC adjuster matrix
9
10
11
12
13
14
June 21, 2003
Pre effective date
Post effective date
Price
Volume
Price
Volume
Health
Education
Social
1.0%
1.0%
1.0%
2.0%
2.0%
2.0%
1.0%
1.0%
1.0%
2.0%
2.0%
2.0%
Capital
Government
1.0%
1.0%
2.0%
2.0%
1.0%
1.0%
2.0%
2.0%
Without prejudice
31
Fiscal Arrangements Model User Guide
June 21, 2003
Expenditures
This section deals with the data requirements for First Nation Government expenditures. A working
assumption is that the First Nation may choose to assume program and service responsibilities at a
future date. To accommodate that flexibility the input data sheets have been constructed as follows.
The line references refer to the rows in the display and identified in column A of the input data
sheets.
Col A&B
identifies the various program and program inputs that may be included as a First
Nation Government expenditure.
Col C
in most cases this column identifies that initial year or years 2001 (as indicated)
program costs. However in some circumstances (e.g. education) this column will also
include initial levels for economic drivers.
identifies the years in which the program and service is being assumed or delivered by
the First Nation government. If the program or service is never assumed this column
may be left blank.
Col D
The general format for units are as follows
- all financial inputs are in dollars
- all demographic inputs (students, patients) are in number of people
- all price drivers are in annual percentage growth
The user will note that most expenditures categories include at least one reference to “other
programs” in some cases the user has the ability to input several explicit programs and program
titles, in other circumstances the user is limited to a single input. The category of other programs is
used so as to keep the list of possible programs and services manageable. It is recommend that the
user sums the expenditures on the programs not explicitly listed under the respective category and
input the estimate.
Health
Input requirements for Health expenditures have been broken down into 4 groups:
MSP costs, non-insured health costs, local programs, and price drivers.
MSP costs
MSP costs are disaggregated into administration costs and the MSP premium costs. Rows 2 and 3
respectively. The administration price driver in row 25 escalates administrative costs while premium
costs are escalated by the growth in population and the price driver for MSP premiums identified in
line 26.
Non-insured health costs
Non-insured health costs are modelled in a similar fashion as MSP costs. Row 6 identifies the noninsured administration costs and is escalated by the same administration driver identified in row 25,
while row 6 identifies the patient costs, which is also grown by population and a price driver – in this
case the price driver is identified in row 27. Line 9 allows the user to input a value for all other noninsured health costs and the price driver allows for non-insured health costs identified in row 27 to
escalate over time
Local programs
Without prejudice
32
Fiscal Arrangements Model User Guide
June 21, 2003
The final program grouping is the local programs; this is split between administration costs and a
series of program costs that the user may specify. Administration costs are inputted and forecasted
as previously indicated for MSP and non-insured. Specific local program costs are summed by the
model and escalated using the price driver for other programs identified in row 28. The
disaggregation allowed in lines 14-23 are solely for ease of user entry and are all forecasted in a
similar fashion. However the user may indicate different start years for the specific programs.
Price drivers
The fourth input group is identified in rows 25-28. These are the price drivers used to escalate the
individual health components are discussed above. These are annual nominal rates of increase in
percentage terms.
Note: all costs identified in Column C are for program levels in 2001.
Model Display 15 – Health Expenditure Data Requirements
A
B
Cost in 2001
Health
1
2
3
5
6
7
8
9
11
12
13
14
15
16
17
18
19
20
21
22
23
25
26
27
28
C
D
Year P&S
commences
MSP
Administration Administration costs
MSP transfer MSP cost
Non-Insured Health
Administration Administration costs
Patient costs
Other programs Cost
Local programs
Administration
input names for reference
Other programs Brighter futures
Other programs Drug and Alcohol
Other programs Aids program
Other programs Wellness
Other programs Health careers
Other programs Prenatal
Other programs Community health rep
Other programs Family violence
Other programs Aboriginal healing
Other programs All other
Price Drivers
annual admin increases
Without prejudice
10,000
1,000,000
2005
2005
10,000
10,000
2005
2005
10,000
2005
1,000
2005
10,000
10,000
10,000
10,000
10,000
10,000
10,000
10,000
10,000
10,000
1.0%
2005
2005
2005
2005
2005
2005
2005
2005
2005
2005
annual MSP increases
annual non-insured increases
1.0%
1.0%
annual local program increases
1.0%
33
Fiscal Arrangements Model User Guide
June 21, 2003
Social
Social programs expenditures are listed in model display 16, the line references refer to the rows in
the display and identified in column A of the input data sheets. Input requirements for have been
broken down into 4 groups:
basic needs, social development and support; daycare and other programs.
Row 2
basic needs – 2001 administration cost – escalated over time by the admin price driver
identified in row 27.
Row 4
numbers of people receiving income assistance from the First Nation government.
This base year number is escalated by the growth in IA recipients projected by the
employment module
Row 5
annual per recipient social assistance payment – this figure is escalated by the price
driver for IA programs identified in row 27
Row 8
number of people receiving special needs support from the First Nation government –
this is escalated at the long-term population growth rate.
Row 9
annual per recipient cost of special needs
Row 10
sum of all other basic needs expenditures
Row 13
adult care - 2001 administration costs – escalated over time by the admin price driver
identified in row 27.
Row 14
numbers of people receiving adult care from the First Nation government
Row 15
annual per recipient cost of adult care – escalated over time by the other social service
costs price driver identified in row 31.
Row 17
sum of all other social development and support expenditures – escalated over time by
the other social service costs price driver identified in row 31
Row 20
daycare - 2001 administration costs – escalated over time by the admin price driver
identified in row 27.
Row 21
number of children enrolled in daycare - escalated over time by the growth in the 0-5
age cohort
Row 22
annual per recipient cost of daycare – escalated over time by the daycare price driver
identified in row 29.
Row 25
sum of all other social program expenditures
Row 27
annual price driver for social administrative programs and services, percent
Row 28
annual price driver for income assistance programs and services, percent
Row 29
annual price driver for daycare programs and services, percent
Row 30
annual price driver for special needs programs and services, percent
Row 31
annual price driver for all other social programs and services, percent
Note: all costs identified in Column C are for program levels in 2001. However, the start year for
the program is variable and is set by the user.
Without prejudice
34
Fiscal Arrangements Model User Guide
June 21, 2003
Model Display 16 – Social Expenditure Data Requirements
A
B
C
D
Cost in 2001
Year P&S
commences
10,000
2005
100
5,000
2005
Social
1
Basic Needs
2
3
Administration Administration costs
4
5
6
Income Assistance Recipients
IA per person (annual)
7
8
Special needs Enrollment
Cost per individual (annual)
20
5,000
2005
10,000
2005
1,000
20
2005
5,000
2005
100,000
2005
1,000
2005
Enrollment
other programs Cost per individual (annual)
10
5,000
2005
other programs Cost
1,000
2005
9
10
11
12
Other basic needs programs Cost
Soc dev & Support
13
14
15
16
17
18
19
Adult Care Administration costs
Number of adults in care
Cost per in care adult (excluding
admin)
Other Soc. Dev. programs Cost
Daycare
20
21
Administration Administration costs
22
23
24
Other social
25
26
27
Price Drivers
28
29
30
31
Without prejudice
Annual admin increases
IA benefits growth rate
Daycare cost growth rate
Special needs cost growth rate
Long term growth rate in other
program costs
1.0%
1.0%
1.0%
1.0%
1.0%
35
Fiscal Arrangements Model User Guide
June 21, 2003
Education
Education expenditures are listed in model display 17, the line references refer to the rows in the
display and identified in column A of the input data sheets. Input requirements for have been broken
down into 4 groups:
kindergarten, 1-12, post secondary and other education.
Kindergarten expenditures are disaggregated into:
• administration costs in row 2 - escalated by a price driver in row 27; and
• per student costs in row 5 – escalated by the price driver for k-12 levy identified in row 28.
Kindergarten costs are then projected by the model as the sum of:
1. summing administrative costs plus the number of students identified in row 4;
2. the per student cost multiplied by the enrollment and escalated by the growth in the population
age cohort
The next grouping is for students in grades 1 through 12 these expenditures are modelled in a
similar fashion to kindergarten.
Row 8
identifies the number of students enrolled in 2001
Row 9
identifies the per student annual levy for 2001
The 1-12 annual levy is then the product of the annual levy (which is projected to grow at the k-12
price driver identified in row 28) and the number of students being paid for (which is projected by the
growth in that age cohort).
Row 11
identifies other annual costs for 1-12 education – these costs are projected to grow at
the rate of the age cohort and the price driver for other program costs identified in row
30.
Post secondary expenditures are modeled as the sum of administrative costs, tuition and student
allowances and other program costs.
Row 15
identifies the 2001 administrative cost
Row 16
identifies the base number of post secondary students paid for by the First Nation
government
Row 17
identifies the per student annual allowance
Row 18
identifies the per student annual tuition. – this is escalated by the post secondary price
driver identified in row 29
Row 20
identifies the total annual expenditures on transportation
Row 21
identifies the total annual expenditures on shelter
Row 22
identifies the total annual expenditures on graduation
The expenditures in rows 20-22 are escalated by the long-term growth rate for other program costs
identified in row 30.
Other education program costs are identified in row 25 and are an annual dollar value that is
increased over time by the long-term growth rate for other program costs identified in row 30.
Without prejudice
36
Fiscal Arrangements Model User Guide
June 21, 2003
Note: all costs and students identified in Column C are for program levels in 2001. However, the
start year for the program is variable.
Model Display 17 – Education Expenditure Data Requirements
A
B
Education
1
2
3
Kindergarten
Administration Administration costs
4
Enrollment
other costs Per student variable cost
5
6
7
8
9
10
11
12
13
14
15
16
24
25
26
27
D
Cost in 2001
Year P&S
commences
10,000
2005
20
1,000
2005
80
5,000
2005
100,000
2005
100,000
2005
10,000
2005
1-12
Tuition Enrollment in 1-12
1-12 - per student school board levy
other costs 1-12 other costs - total annual
Other programs Cost
Post Secondary
Administration Administration costs
Number of students
17
18
19
20
21
22
23
C
allowance Per student annual allowance
tuition Per student annual tuition
Other programs Transportation
Other programs Shelter
Other programs Graduation
Other Education
Other programs Cost
Price Drivers
28
29
30
Without prejudice
50
10,000
1,000
2005
2005
1,000
1,000
1,000
2005
2005
2005
20,000
2005
Annual admin increases
Growth in K-12 levy
Growth in per student post secondary
allowance & tuition
1.0%
1.5%
Long term growth rate in other program costs
1.5%
1.5%
37
Fiscal Arrangements Model User Guide
June 21, 2003
Capital
Capital is broken down into three components and the user should note the linkage to the associated
capital funding section
The first component is expenditures for major maintenance and replacement of the existing asset
base. The expenditure characteristics of this category are by nature very lumpy as replacement
occurs at discrete intervals. The model assumes that the funding and expenditures on this category
will be smooth. Practically, this is accomplished through the use of a capital authority and a capital
stabilization fund. Such a fund is not explicitly modeled here but implicitly assumed.
Row 2 identifies the annual expenditure on major maintenance and replacement. The forecast of
this category is linked to the growth in the capital funding amount.
The second component of capital expenditures is housing. The user can input a 5-year and long
term forecast of new housing starts in row 5. Row 6 identifies the per unit construction cost (which is
escalated at the construction price index), row 7 identifies the required infrastructure increase above
construction costs to cover all non-construction costs (infrastructure hookups, expansion, site survey
etc).
The final component to capital is expenditures on new non-housing; this is identified in row 8 and is
assumed to increase at a rate identified by the new construction price index identified in row 10.
Row 9 identifies the annual long run maintenance cost to the annual new non-housing asset
expenditure. This represents the additional cost of maintaining the asset expenditures identified in
line 8 over its lifetime and is based on a similar logic that underlies the major maintenance and
replacement expenditures associated with the existing stock of assets.
Model Display 18 – Capital Expenditure Data Requirements
1
2
3
4
5
6
7
8
9
A
Capital
B
C
2005
1,000,000
D
2006
2
Existing
MM and replacement
New Housing
Housing projections - 20 years
Unit cost
Infrastructure markup
1
100,000
5.0%
Annual expenditure
Annual long-run maintenance
cost on asset base
New construction price index
100,000
New non-housing
10
Without prejudice
100.0%
2.0%
38
Fiscal Arrangements Model User Guide
June 21, 2003
Government
The government expenditure section is broken down into the following groupings
• General government
• Local services
• Protection of persons and property
• Recreational and culture
• Land and resource management
• Employment and development
The final 2 groups are special cases:
• Debt and investment
- Debt and investment outlines the First Nation government’s initial financial position
excluding negotiation loans
• Treaty implementation
- Treaty implementation costs are specific to the costs of implementing the Final
Agreement and are assumed to be short run in nature.
General Government
General government expenditures are administration costs, which are input in dollars on row 2.
There is flexibility to indicate what year the admin program starts in. Generally admin is ongoing and
the recommendation is to input costs and the year consistent with the first effective year.
Model Display 19 – General Government Exp. Data Requirements
A
1
2
B
Government
General Government
Administration
C
Cost in year
P&S
commences
D
Year P&S
commences
500,000
2005
Local Services
This section contains inputs for local services:
• row 5 identifies costs and timing for waste disposal;
• row 7 identifies costs and timing for snow removal and road maintenance;
All other local service costs should be summed and inputted in row 9.
Model Display 20 – Local Services Expenditure Data Requirements
4
5
6
7
8
9
Local Services
garbage pickup/disposal
Cost in year
P&S
commences
10,000
snow removal/road maintenance
10,000
2005
Other programs
10,000
2005
Year P&S
commences
2005
Protection of persons and property
Without prejudice
39
Fiscal Arrangements Model User Guide
June 21, 2003
This group covers costs associated with the protection of people and property
Row 12
total annual cost of policing services and the year in which these costs are first borne
by the First Nation government
Row 14
total annual cost of local firefighting costs and the year in which these costs are first
borne by the First Nation government,
Row 15
total annual cost of forest fire firefighting services and the year in which these costs are
first borne by the First Nation government – note these costs may be included in row 14
in which case the user would input a 0 cost in row 15.
Row 17
allows the user to input another category of related costs and timing
Row 18
is a catch all for those program costs not explicitly identified in rows 12 through 17.
Model Display 21
Protection of People and Property Expenditure Data Requirements
11
Protection of persons and property
12
13
14
15
16
17
18
19
Policing
Firefighting Local
Forests
Other programs Input major program name
All others
Cost in year
P&S
Commences
10,000
Year P&S
commences
2005
10,000
25,000
2005
2005
10,000
1,000
2010
2010
Recreation and Culture
Recreation and cultural programs are those offered outside the regular school curriculum and does
not include any investments in major capital. This section has two categories of input:
Row 22
allows the identification of a specific program; their initial costs and the year in which
the program commences.
Row 23
is a catch all for all other recreation and cultural programs and the years they start.
Model Display 22
Recreation and Culture Expenditure Data Requirements
20
Recreation and Culture
21
22
23
Without prejudice
Programs Input major program name
All others
Cost in year
P&S
Commences
Year P&S
commences
10,000
1,000
2005
2005
40
Fiscal Arrangements Model User Guide
June 21, 2003
Land and Resource Management
Row 26 identifies the costs of conducting general landowner functions and the year in which the First
Nation government assumes those responsibilities – for example:
- Improvements
- Survey and title transfer
- Assessment control
- Safety and protection
Row 27 identifies the additional costs associated with general municipal government functions and
the year in which the First Nation government assumes those responsibilities – for example:
- Planning
- Zoning
- Sub division approvals
- Fire protection
Row 29 identifies the additional costs associated with general provincial government functions and
the year in which the First Nation government assumes those responsibilities – for example:
- Land titling and registration
- Forest practices
- Environmental protection
- Wildlife management
- Mining and quarrying
- Waste management plans approval
Row 31
identifies annual fish management costs
Row 32
identifies the per hectare forest management cost associated with logging activities.
This value is applied as a cost to the First Nation government under a stumpage regime
and as a cost to the forestry corporation under the corporate approach to forestry
exploitation.
Model Display 23
Land and Resources Expenditure Data Requirements
24
25
26
27
29
31
32
Land and Resource management
Office functions e.g.: survey and title
transfer functions
Municipal type functions e.g.: planning,
zoning, approvals
Provincial type functions e.g.: land titling,
environmental protection waste
management approvals
Fish Management costs
Forest Management costs - a Gov't cost
under a stumpage approach, a corp. cost
under a corp. approach - $/hectare
cost in year
P&S
commences
Year P&S
commences
10,000
2005
10,000
2005
10,000
10,000
2005
2005
100
2005
Employment and Development
Without prejudice
41
Fiscal Arrangements Model User Guide
June 21, 2003
This section outlines the costs of employment and development programs the First Nation
government may choose to have in place. Four program areas are included in this section:
- general employment, youth employment, tourism and economic development programs
Row 34
identifies the general administration costs
Row 36
identifies the average annual expenditures on general employment training programs
Row 37
identifies the average annual expenditures on other general employment programs
Row 39
identifies the average annual expenditures on youth training programs
Row 40
identifies the average annual expenditures on other youth employment programs
Row 42
identifies the average annual expenditures on tourism advertizing
Row 43
identifies the average annual expenditures on other tourism opportunity developments
Row 45
identifies the average annual expenditures on all economic development programs
Model Display 24 – Employment Expenditure Data Requirements
A
B
33
Employment & Development
34
Administration
C
Cost in year
P&S
commences
D
Year P&S
commences
100,000
2005
35
36
general employment Training
2,000
2005
37
Program
2,000
2005
39
youth programs Training
2,000
2005
40
Program
2,000
2005
5,000
2005
5,000
2005
200,000
2005
38
41
42
Tourism Advertising
43
Opportunity development
44
45
Economic development Program
Without prejudice
42
Fiscal Arrangements Model User Guide
June 21, 2003
Debt and Investment
This section identifies the First Nation government financial status on effective day.
Row 47
is set by the model and identifies the effective year.
Row 48
identifies the current outstanding debt on effective day, not including any loans
identifies in the Capital and Loans section.
Row 49
identifies the average annual interest rate applied to the debt amount.
Row 50
identifies the period of time, in years, over which the debt is amortized.
Row 52
identifies the current investments, not including capital transfer amounts or funding
amounts provided for in the funding section, on effective day.
Row 53
identifies the average annual rate of return applied to funds placed in the investment
account.
Model Display 25 – Debt and Investment Data Requirements
47
Debt and Investments
2005
48
Current outstanding debt load
49
50
51
52
53
-
Loan rate
Period of amortization
7.0%
10
Current investments: initial
account balances
Rate of return
1,000
7.0%
Treaty Implementation
In this section the user identifies costs associated with the implementation of the final agreement.
Funding for these costs is inputted in the treaty implementation section of the Funding group. It is
expected but not required that the implementation expenditures and funding sum to similar amounts.
Row 55
is set by the model and identifies the effective year
Row 56
identifies the one-time expenditures to be undertaken in the effective year. In practice
some of these one time expenses may occur during the period leading up to effective
year and spill over into the 2nd effective year (e.g., law making). The user should
aggregate the one time costs and ensure some consistence with the one time funding
amount.
Row 57
identifies the one-time funding provided over a 5-year period – this is an annual amount
provided each year for 5 years. Again there is a practical relationship to the 5-year one
time funding amount identified in the funding section.
Without prejudice
43
Fiscal Arrangements Model User Guide
June 21, 2003
Model Display 26 – Implementation Expenditure Data Requirements
55
56
57
Treaty Implementation
2005
One-time expenses
One-time 5 year ongoing annual amount
1,100,000
-
Price Driver
The entire government section, with the exception of debt and investment and treaty implementation
costs are assumed to have an identical price driver – which is identified in row 59.
Model Display 27
General Government Expenditure Driver Data Requirements
59 Price Drivers
General price pressure
2.0%
Economic Development
In row 18 of the Demographic input section the user is asked to make a choice on how the model will
determine future employment levels. The user is asked to choose between:
1. determining employment levels as a result of initial and target participation and employment rate
levels; or by
2. explicitly identifying the year and quantum of any additional employment explicitly gained by First
Nation members.
This section of the input sheet is where the economic development projects and employment levels
associated with the second option are to be inputted.
The economic development input requirements are listed in model display 28, the line references
refer to the rows in the display and identified in column A of the input data sheets.
Row 1
fixed in the model – identifies the year for which the user has input the employment
levels
Row 2
calculated by the model – as the sum of the new net full time employees identified in
rows 7-34
Row 3
calculated by the model – as the sum of the new net part time employees identified in
rows 8-35
Row 6
fixed in the model – identifies the year for which the user is to input the employment
gains by numbers of jobs.
Rows 7-34 column A “title” name or other identifier associated with the economic development
opportunity or project for which the corresponding new net full and part time job
numbers are associated.
Row 7
column C-AK : the number of new net incremental full time jobs for members of the on
TSL status Indian labour force associated with the project identified in column A.
Without prejudice
44
Fiscal Arrangements Model User Guide
Row 8
June 21, 2003
column C-AK : the number of new net part time jobs for members of the on TSL status
Indian labour force associated with the project identified in column A on the previous
row.
Rows 10– 35 have identical input requirements as in rows 7 and 8. These additional rows are
provided so that the user can explicitly identify up to 10 different projects and
opportunities.
However what is used in the calculations within the calculations of model are the summed
values determined in rows 2 and 3.
The new employment levels determined here are added to the employment levels determined by the
model based on the historical participation and unemployment rates. Therefore what these cells
represent are net new jobs associated with the projects over and above the status quo. For
example a new project that employs 10 people full time in year 1 and only 5 people full time in the
second and subsequent years would be inputted as 10 in the first cell and 5 in each subsequent cell.
Since the model adds these new jobs to the status quo employment levels it is important that the
user identify all jobs associated with new employment opportunities.
Model Display 28
Economic Development Employment Data Requirements
A
B
C
D
E ONWARDS
2001
2002
2003
Economic Development
1
2
full time - employees
10
10
10
3
4
5
part time -employees
10
10
10
2001
2002
2003
Economic development projects
6
7
8
9
10
11
12
13
14
15
16
17
18
19
20
21
Without prejudice
title
full time - employees
part time -employees
1
1
1
1
1
1
title
full time - employees
part time -employees
1
1
1
1
1
1
title
full time - employees
part time -employees
1
1
1
1
1
1
title
full time - employees
part time -employees
1
1
1
1
1
1
title
full time - employees
part time -employees
1
1
1
1
1
1
45
Fiscal Arrangements Model User Guide
22
23
24
25
26
27
28
29
30
31
32
33
34
35
Without prejudice
title
June 21, 2003
full time - employees
1
1
1
part time -employees
1
1
1
full time - employees
1
1
1
part time -employees
1
1
1
title
full time - employees
part time -employees
1
1
1
1
1
1
title
full time - employees
part time -employees
1
1
1
1
1
1
title
full time - employees
part time -employees
1
1
1
1
1
1
title
46
Fiscal Arrangements Model User Guide
June 21, 2003
Results Sheets
This section shows the contents of the four results sheets and provides an explanation of the
contents of each cell.
Results Budget Sheet
Scenario description:
Effective year:
OSR model:
Revenues
current dollars
test 1
2003
FFO 15 yr 50%
From active assumptions sheet
From active assumptions sheet
From options sheet
Subsequent columns contain a 20 year
projection of revenues and costs
Canada gross transfer amounts
Projection of Canada’s gross transfer
BC gross transfer amounts
Projection of BC’s gross transfer
Gross Agreed Upon Funding Amount Sum of Canada’s and BC’s gross transfers
OSR offset amount
Total agreed upon P&S funding
transfer
Discretionary OSR
Total OSR all sources
Transfer from Contingency Account
Other transfers including
implementation
Amount of revenue transferred in from the
Contingency account
Other funding amounts including
implementation
Total Revenue
Sum of the net transfer, total OSR and other
funding amounts
Contingency OSR
Health
Education
Social
Capital
Government
Treaty Implementation
Debt servicing cost
Total Expenditures
Without prejudice
The net funding transfer
Amount of OSR taken into account in the
funding transfer
Amount of OSR set aside into a contingency
account
Amount of OSR not taken into account in the
funding transfer
Amount of OSR from all sources
OSR offset amount
Expenditures
current dollars
Amount of OSR taken into account in the
funding transfer
First Nation government expenditures
On all health programs
On all Education Programs
On all Social programs
On Capital and Housing
On all Government programs
On implementation
On servicing existing and new government
debt
Sum of all First Nation government
expenditures
47
Fiscal Arrangements Model User Guide
Annual surplus/deficit
June 21, 2003
Total revenue less total expenditures,
surpluses are added to government
investment accounts while deficits are
deducted from the investment account and
then borrowed if required.
This following shows the transactions and balances in the various accounts and funds
Accounts/Funds
Subsequent columns contain a 20 year projection of
balances
Settlement Trust
Starting balance
Income retained
Annual beginning of year Settlement Trust balance
Additions to the Trust for a particular year – generally will
reflect the net cash transfer for that year
Distributions from the Settlement Trust - as identified in
Active Assumptions
Total annual income generated by the Settlement Trust
Income retained by the trust as specified in line 20 of the
input assumptions
Closing
Closing balance at end of year
Net additions
Distributions
Income generated
Balancing flows
Annual surplus
Settlement Trust transfer
Contingency account transfer
Additional Contingency account
transfer
Annual budget surplus – will be negative if deficit
Income retained by the trust as specified in line 20 of the input
assumptions
OSR transferred to the Contingency account as specified on line 3 of
input OSR options sheet
Additional transfers to the Contingency account resulting when the
per annum OSR option is chosen and OSR in any year exceeds the
Transferred to Investment Account Annual surplus less ST portion
Investment account
Starting balance
Balancing account transfer
Loans required to cover
previous deficit
Withdrawals
Income
OSR offset
Closing balance
Annual beginning of year Investment account balance –
include value noted in line 52 of government expenditure section
Amount transferred from balancing account if negative
Loans required to cover previous years deficit
Amount transferred from balancing account if positive
Income generated by the investment account
OSR inclusion amount associated with the Investment Account
Closing balance at end of year
Loan account
Starting balance
New loans
Repayment
Interest
Closing
Without prejudice
Annual beginning of year Loan account balance – include
value noted in line 48 of government expenditure section
New loans required to cover previous years deficits
Amount of loan repayment made in that year
Amount of interest accumulated by the outstanding loans in that year
Closing balance at end of year
48
Fiscal Arrangements Model User Guide
Contingency Account
Opening balance
Additions (contingency portion)
Actual OSR in excess of FFA OSR
Actual OSR under FFA OSR
FFA OSR in excess of AUPS
FFA OSR under AUPS
Income
Total Transfers to Revenue
Closing balance
Without prejudice
June 21, 2003
The contingency account will only exist if the user inputs non-zero
values into the contingency rate - line 3 of the input OSR options
sheet. Under this regime, a portion of the annual OSR offset amount
is not used to decrease the Funding transfer but rather is transferred
to a contingency account, which in turn is used to balance any
shortfalls between the available OSR and the revenue required to
provided agreed-upon program and services (AUPS) which are to be
directly funded by the amount of OSR.
Balance at start of year
Contingency portion of OSR from revenue
Amount by which actual OSR exceeds OSR determined under the
per FFA OSR calculation chosen on the Options sheet
Amount by which actual OSR falls short of OSR determined under
the per FFA OSR calculation chosen on the Options sheet
Amount by which OSR determined under the OSR calculation chosen
on the Options sheet exceeds the cost of assumed programs and
services
Amount by which OSR determined under the OSR calculation chosen
on the Options sheet falls short of the cost of assumed programs and
services
Income generated by the contingency account
Total amount of revenue transferred from the contingency account to
revenues in any year. This transfer accounts for any shortfall in either
OSR levels or costs of AUPS.
Closing balance at end of year
49
Fiscal Arrangements Model User Guide
June 21, 2003
Results Revenues Sheet
OSR Source
Settlement Trust
Transfers from FN business
Investment income
Contingency Account income
Tax
Fees and charges
Resources
Other Sources
Total OSR
Subsequent columns contain a 20 year projection of revenues
Annual income from the settlement trust
Annual transfers from First Nation corporation profits
Annual income from the First Nation government investments
Annual income from the Contingency Account
Annual tax transfer and tax collected
Annual revenues from fees and charges
Annual revenues from resources (e.g. stumpage)
Annual revenues from all other sources
Sum of the OSR sources
Offset amounts
Settlement Trust
Transfers from FN business
OSR offset amount from the settlement trust income
OSR offset amount from corporate transfers
Investment income
Contingency Account
Tax
Fees and charges
Resources
Other Sources
Total Potential OSR
OSR offset amount from investment income
OSR offset amount from Contingency account income
OSR offset amount from tax revenues
OSR offset amount from fees and charges
OSR offset amount from resource revenues
OSR offset amount from other revenues
Sum of the OSR offset amounts
Impact of Floor and cap
Basic and personal exemptions
Impact of floor and cap exemptions
Impact of basic and personal exemptions
OSR offset amount
Transfer to Contingency account
Net OSR Offset amount
OSR post exemptions
OSR transferred to contingency account
OSR post exemptions and transfers to the Contingency account
Transfer Funding
current dollars
CANADA
Health
Canada agreed upon funding transfer amount for Health
Education
Canada agreed upon funding transfer amount for Education
Local
Canada agreed upon funding transfer amount for Local
Capital
Canada agreed upon funding transfer amount for Capital
Social
Canada agreed upon funding transfer amount for Social
Total FFA
Total Canada agreed to funding amounts
Non-treaty related
Other federal funding
Without prejudice
50
Fiscal Arrangements Model User Guide
Implementation
Implementation funding from Canada
Total other
Total Other Federal Funding
June 21, 2003
Total funding amount CANADA Total federal funding from all sources prior to taking OSR into Account
British Columbia
Health
BC agreed upon funding transfer amount for Health
Education
BC agreed upon funding transfer amount for Education
Local
BC agreed upon funding transfer amount for Local
Capital
BC agreed upon funding transfer amount for Capital
Social
BC agreed upon funding transfer amount for Social
Total FFA
Total BC agreed to funding amounts
Non-treaty related
Other BC funding
Implementation
Implementation funding from BC
Total other
Total Other BC Funding
Total funding amount BC
Total provincial funding from all sources prior to taking OSR into account
Total Funding
Health
Sum of Canada and BC funding amount for Health
Education
Sum of Canada and BC funding amount for Education
Local
Sum of Canada and BC funding amount for Local
Capital
Sum of Canada and BC funding amount for Capital
Social
Sum of Canada and BC funding amount for Social
Total FFA
Sum of Canada and BC program funding
Non-treaty related
Sum of Canada and BC funding amount for non treaty related
Implementation
Sum of Canada and BC funding amount for implementation
Total other
Sum of Canada and BC other funding
Total funding amount
Sum of Canada and BC other funding
Without prejudice
51
Fiscal Arrangements Model User Guide
June 21, 2003
Results Expenditures Sheet
Total Expenditures
Subsequent columns contain a 20 year projection of expenditures
current dollars
Health
Education
Social
Capital
Government
Treaty Implementation
Debt servicing cost
Total First Nation government expenditures on Health
Total First Nation government expenditures on Education
Total First Nation government expenditures on Social
Total First Nation government expenditures on Capital
Total First Nation government expenditures on Government
Total First Nation government expenditures on treaty implementation
Total First Nation government expenditures on debt servicing
Total Expenditure Requirements Sum of First Nation government expenditures on Programs
The above table provides a summary of the expenditure programs that the user has identified in the
input data sheets. Projections of the various costs and programs under the main headings in also
provided in this results sheet as indicated below. Rather than repeat the discussion of program
descriptions of the expenditure section the user is advised to refer back to the previous section for
further description.
Health
current dollars
MSP
Administration
Transfer
Total MSP
Non-Insured Health
Administration
Patient costs
Other programs
Total non-insured
Local programs
Administration
Other programs
Total Local Health care
Total Health Care Expenditures
Education
current dollars
Kindergarten/nursery school
Admin
Variable cost
Total
K-12
Tuition
Other costs
Without prejudice
52
Fiscal Arrangements Model User Guide
June 21, 2003
Other programs
Total
Post Secondary
Admin
Annual allowance
Variable
Transportation
Shelter
Graduation
Total
Other Education
Total
Total Education Expenditures
Social Services
current dollars
Basic Needs
Admin
Income Assistance
Special needs
Other basic needs programs
Total
Soc dev & Support
Adult Care - admin
Adult Care - variable
Other Soc. Dev. programs
Total
Daycare
Admin
Variable
Total
Other social
Total
Total Social Services Expenditures
Capital
current dollars
Major Maintenance and replacement - existing capital assets
Total expenditure on MM and replacement of existing stock
Housing
Without prejudice
Number of units constructed
Finished cost per unit (turn key)
53
Fiscal Arrangements Model User Guide
June 21, 2003
Expenditure on housing
New housing related infrastructure
Maintenance on new infrastructure
Additional Capital
New non housing related infrastructure
Maintenance on new infrastructure
Total
Total capital expenditures
General Government
current dollars
General Government
Local Services
Protection of persons and property
Recreation and Culture
Land and Resource management
Employment & Development
Total General Government Expenditures
Treaty Implementation
current dollars
One-time expenses
One-time 5 year ongoing - annual amount
Total Implementation Expenditures
Without prejudice
54
Fiscal Arrangements Model User Guide
June 21, 2003
Results Tax and Employment Sheet
Total status population
Total employable population
Total labour force
Subsequent columns contain a 20 year projection of the
following tax and employment parameters
Total on TSL status population
On TSL Status population of employable age and availability
On TSL Status labour force
Total full time employment
Total part time employment
Total
Total on TSL full time employed status Indians
Total on TSL part time employed status Indians
Total on TSL employed status Indians
Employment
Income from all sources
Gross wage income
Social Assistance transfer
EI transfer
Total BC family bonus
Total PST credit
Total GST credit
Total CCTC credit
OAS GIS
Total Gross wage income – on TSL status Indians
Total SA income – on TSL status Indians
Total EI income – on TSL status Indians
Total family bonus income – on TSL status Indians
Total PST credits – on TSL status Indians
Total GST credits – on TSL status Indians
Total Canada child tax credits – on TSL status Indians
Total old age security and guaranteed income supplement
income – on TSL status Indians
Total income
Sum of income from all sources
Property Tax
Rural/Munic component - status
residents
School component - status residents
Rural/Munic component all other
residents
School component- all other residents
Total
Total property tax from status Indians excluding the provincial
portion or “school” tax
Total provincial portion or “school” tax from status Indians
Total property tax from all other residents excluding school tax
Total provincial portion or “school” tax from all other residents
Total property tax from all residents
Tax Revenues to Governments
Canada
GST/FNST
PIT
CIT
Tobacco
Fuel
Alcohol
Total
Without prejudice
GST/FNST tax receipts
Personal income tax receipts
Corporate income tax receipts
Tobacco tax – only included if a tax agreement exists
Fuel tax – only included if a tax agreement exists
Alcohol tax – only included if a tax agreement exists
Sum of Canada tax revenues
55
Fiscal Arrangements Model User Guide
BC
PST
PIT
CIT
BC sales tax
BC personal income tax from on TSL status
BC corporate tax from First Nation corps
Municipal/rural
School
Total
BC share of non school property tax
BC share of school tax
Sum of BC tax revenues
June 21, 2003
GST/FNST
PST
PIT Canada
PIT BC
Tobacco
Fuel
Alcohol
Munic/rural
School
Total
Revenues to First Nation Government (FNG) through tax
agreements or direct taxation
GST/FNST tax receipts
BC sales tax
Canada personal income tax receipts
BC personal income tax from on TSL status
Tobacco tax – only included if a tax agreement exists
Fuel tax – only included if a tax agreement exists
Alcohol tax – only included if a tax agreement exists
share of non school property tax
share of school tax
Sum of FNG tax revenues
Total tax
Sum of Canada, BC and FNG tax revenues
Canada share
BC share
FN share
Canada’s share of total tax revenues modeled
BC’s share of total tax revenues modeled
FN Govts share of total tax revenues modeled
FN
Without prejudice
56