1
USER'S GUIDE FOR FIDME-PC:
FORESTRY INVESTMENT DECISIONS
MADE EASY ON PERSONAL COMPUTERS
B. PayandehandD.R. Dukesi
Natural Resources Canada
Canadian Forest Service - Ontario
Great Lakes Forestry Centre
1994
Information Report O-X-434
'Summer student, Wilfrid Launer University, Waterloo. Ontario
This report is printed on recycled paper.
Canadian Cataloguing in Publication Data
Payandeh, Bijiin
User's quide forFIDME-PC: forestry investment decisions made easy on personal com pule rs
(Information report: ISSN 0832-7122 ; O-X-134)
Includes an abstract in French.
Includes bibliographical references.
ISBN0-662-22190-7
Cat. no. Fo46-I4/434E
I. Forests and forestry - Economic aspects - Computer programs - Handbooks, manuals, etc.
I.Dukcs, D.R. {Darren R.)
II. Great Lakes Forestry Centre.
III. Title.
IV. Forestry investment decisions made easy on personal computers.
V. Series: Information report (Great Lakes Forestry Centre); O-X-434.
SD387.M33P39 1994
634.9'21O285369
C94-980173-9
©Minister of Supply and Services Canada 1994
Catalogue No. Fo 46-14/434E
ISBN 0-662-22190-7
ISSN 0832-7122
Copies of this publication are available at no charge from:
Communications Services
Natural Resources Canada
Canadian Forest Service - Ontario
Great Lakes Forestry Centre
P.O. Box 490
Sault Ste. Marie, Ontario
P6A 5M7
Microfiche copies of this publication may be purchased from:
Micro Media lne.
Place du Portage
165, Hotel-dc-Ville
Hull! Quebec J8X 3X2
Payandeh, B.; Dukes, D.R. 1994. Users' guide (or FIDM - PC: Forestry Investment
Decisions Made Easy on Personal Computers. Natural Resources Canada,
Canadian Forest Service - Ontario, Sault Ste. Marie, Ontario. Int. Rep. O17 p. + appendixes.
ABSTRACT
FIDME- PC is a personal computerprogram developed to assist (orest managers
in evaluating and screening investment alternatives with ease and maximum
precision. Up to four investment alternatives can be compared using one of the four
following economic criteria:
1) Cost-effectiveness
2) Benefit/cost ratio
3) Present net worth
4) Internal rate of return
The input estimates for the model can be expressed as either point orsubjective
probability estimates. Simulated results will provide the probability of one investment
differing from others. The forest manager can therefore choose, with a known
degree of confidence, between investment alternatives.
demonstrated by several examples.
Model applications are
This instruction manual includes a brief description of the system requirements,
contents of the distribution diskette, installation of the program, and setup with the
user system peripherals. It also contains four input file examples, with a step-bystep running of the first example, input file creation, editing, and appending of the
input data files. Output of the four examples is also included.
RESUME
FIDME- PC estun logiciel pour ordinateur personnel; il a eteconcu pour aider
les gestionnaires de forets a evaluer et a examiner les projets d'investissement
avec facilite et un maximum de precision. II peut aider a comparer jusqu'a quatre
projets suivant Tun des quatre criteres economiques suivants:
1) Rentabilite
2) Rapport coul/avantages
3) Valeur nette actualisee
4) Taux de rendement interne
Les previsions entrees dans le modele peuvent etre exprimees en estimations
ponctuelles ou en estimations subjectives de probability.
Les resultats de la
simulation indiqueront la probabilite d'un investissement par rapport aux autres.
Le gestionnaire pourra doncchoisir, avec une certaineconfiance, entre des projets
d'investissement. Les applications du modele sontilluslres par plusieursexemples.
Le present guide de I'utilisateur comprend une breve description de la
configuration du systeme, du contenu de la disquette de distribution, de la facon
d'installer le logiciel et de son interaction avec les peripheriques du systeme de
i'utilisateur.
II contient egalement quatre exemples de fichier d'entree {et une
explication, pas a pas, du premier exemple), des explications sur la creaiion et la
modification de fichiers et sur I'addition de fichiers de donnees d'entree.
resultats des quatre exemples sont egalement joints.
Les
TABLE of CONTENTS
INTRODUCTION
1
GETTING STARTED: SYSTEM REQUIREMENTS
1
THE DISTRIBUTION DISKETTE
1
INSTALLATION
On a Hard Disk
2
On a Floppy Disk
2
SETTING UP FIDME-PC FOR PERIPHERALS
3
What You Need to Know if You Have a Plotter
3
What You Need to Know to Print Out the Results
3
EXAMPLE RUNS
A.
Using Existing Input Files
B.
Output Options: Graphics Output to Screen, Plotters,
and Printers
C.
4
7
Creating New Data Files via Interactive Mode
10
D.
Editing Existing Files
13
E.
Appending Files
14
PROGRAM STRUCTURE
16
SUMMARY AND CONCLUSIONS
16
ACKNOWLEDGMENTS
17
BIBLIOGRAPHY
17
APPENDIXES
APPENDIX 1:
19
Required and optimal categories for
each economic criterion
APPENDIX 2:
Input/output file conventions
APPENDIX 3:
Printing LaserJet and plotter files
APPENDIX 4:
Common or possible error types
APPENDIX 5:
Output of example runs
INTRODUCTION
Most Forest investments are long-term by nature and thus subject to risk and
uncertainty. In the case of forest renewal investments in particular, it is essential
thai they are chosen from the most promising alternatives possible. To evaluate
and screen out investment alternatives with greater ease and accuracy, forest
managers need a technique that not only enables them to prcdiet the costs and rates
of return but also indicates the likelihood of these predictions being achieved.
FIDME - PC (Forest Investment Decisions Made Easy on Personal Computers) is
a program designed for foresters with access to an IBM PC compatible computer.
The program is a tool to accurately evaluate the relative economic feasibility of
various forestry investments. FIDME - PC comes with four typical examples to
demonstrate the utilities and features of this program. These examples, combined
with a user-friendly method to create specific models, make FIDMR - PC a highly
versatile investment analyzer.
The objective of this manual is to provide the user with a complete description and
tutorial on how to use FIDME - PC's powerful investment-modeling techniques.
A list of additional literature is provided in the bibliography for users interested in
a more in-depth understanding of investment analysis under risk and uncertainty.
GETTING STARTED: SYSTEM REQUIREMENTS
To install and run FIDME - PC successfully, a computer system is needed with the
following hardware:
I)
A personal computer that is IBM AT or XT compatible (uses an 80x86 or
8088x8086 processor)
§,
„
•
,
2)
coprocessor will increase
3)
64QK q{
4)
Qae
5)
D0S
Addition of an 80x87 math
execution speed noiiceably,
but is not essential.
A graphics adapter and monitor supporting an EGA, VGA, or SVGA graphics
,
r
card
^
*
c
r
instal]ed
jnch
2-0orhi
fl
drfve
her
THE DISTRIBUTION DISKETTE
The distribution diskette, a 5-1/4 inch double sided/double density (DS/DD) 360 -
Kb floppy diskette, contains the following files:
FIDMKPC.EXE The FIDME - PC main executable file
FIDSETUP.EXE The setup executable file to configure serial port communication
with an HP plotter and to select the printer port
FIDMEPC.INI The setup ASCII text file containing the serial port configuration
and the parallel port selection. Editing this file with an external editor other than
FIDSETUP.EXE is mil recommended. If this file is edited directly with some
program other than FIDSETUP.EXE, errors can occur. If this happens, delete the
file FIDMEPC.INI and run FIDSETUP.EXE. FIDMEPC.INI will be recreated
with default settings.
Can. For. Serv., Inf. Rep. O-X-434
EXAMPLE{i).DAT Four example data files are included to illustrate each of the
four economic criteria available and various other features of FIDME - PC. The
first three examples will run on an AT or XT in under 10 minutes (using an 80386/
33 with a math coprocessor, the simulation time is under 3 minutes). It might take
several hours., however, to run EXAMPLE4.DAT on an AT or XT (using an 80386/
33 with a math coprocessor, the simulation time is within 20 minutes).
EX(i).OUT The results or output files of the above four examples
INSTALLATION
On a Hard Disk
To install FIDME - PC on a hard disk, it is recommended that a separate directory
be created. With the DOS MKDIR command any name can be used for this
directory; this example uses, F1DME.
At the DOS prompt type:
You can replace "C" with any
valid hard drive on your
nikdir c:\Hdme and press <ENTER>.
system;
Place the FIDME - PC distribution diskette into drive "A" and type:
To install FIDME-PC on a
different drive or subdirectory,
copy a:*.* e:\fidme and press <ENTER>.
the copy command must be
modified accordingly.
This copies all of the files on disk A to the subdirectory "FIDME" on drive "C".
On a Floppy Disk
If the distribution diskette must
be inserted into "8" and the
blank diskette into "A", make
the appropriate changes in this
command line.
Plate the FIDME - PC distribution diskette into "A" drive and a newly-formatted
diskette into "B" drive.
At the DOS prompt type:
copy a:*.* b: and press <ENTER>.
II your system has only one
floppy drive ("A"), place the
distribution diskette into the
drive and type the same copy
command as given in this
section. DOS will start
copying. Whenever DOS refers
to drive NB", use drive "A".
Can. For. Serv., Inf. Rep. O-X-434
SETTING UP FIDME - PC FOR PERIPHERALS
To set up FIDME - PC for use with a plotter and printer, the setup program should
be executed. To do this, change to the drive and directory thai contains your
installed version of FIDME - PC.
At the DOS prompt enter:
fids e tup
Make the appropriate selections on the setup menu for your system.
Some
technical knowledge is required if using a printer or plotter, so be sure to have the
plotter manual onhand or someone nearby who can assist you wilh choosing the
correct settings.
What You Need to Know if You Have a Plotter
Serial port: acceptable serial ports are Coml to Com4
Baud rate: acceptable baud rates are: 110, 150, 300, 600, 1200, 4800, 9600
Parity: acceptable parities arc even, odd, none
Data bits: acceptable data bits are 7, 8
Stop bits: acceptable stop bits are I, 2
If you have an HP 7475A plotter attached to your system, you can plot graphs with
FIDME - PC (.vet Section B). If you have a plotter that uses the HPGL language,
FIDME - PC can plot graphs with it (see Section B).
What You Need to Know to Print Out the Results
Parallel ports: acceptable parallel ports Lptl to Lpt3.
FIDME - PC can plot graphs on all versions of the HP LaserJet III or IV Laser
printer. It can also plot graphs on an HP LaserJet Up or IIp+ with an installed
HPGL/2 cartridge and I megabyte of memory {see Section B).
Can. For. Seiv., Inf. Rep. O-X-434
EXAMPLE RUNS
A. Using Existing Input Files
To demonstrate the applications of FIDMG - PC, a simple example is used to
compare the cost-effectiveness of planting versus seeding jack pine (Piiuis
banksiana Lamb) to produce pulp wood.
1) Change the working directory to FIDME (or the one containing the installed
version of F1DMG-PC).
Next run FIDME - PC by typing:
fidmepe and pressing <ENTER>, at the DOS prompt.
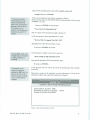
2) After a moment of initialization, the title screen should be displayed. As
indicated on the bottom of the title screen, pressing any key will continue to the first
menu.
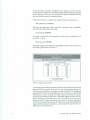
3) The main selection screen is now displayed. It should look similar to Figure 1,
which is a prompt to:
"Enter Name of Output Summary File..."
At this prompt enter the name of a file for which FIDME - PC is waiting to write
the summary of output and expected results. For the first example, type:
example! and press <ENTER>. A prompt will appear to:
"Enter Name of Data Input File...."
This file should be created to contain details of economic criteria; number of
investment alternatives to be compared; rotation ages; and initial, annual, periodic,
and final costs and returns.
Natural Resources Canada -Ontario Region
:
FH)ME~PC -•:/:
';
INPUT SECTION: FILE SELECTION AND MODE
Enter Name of Output Summary File ...
EXAMPLE 1 .OUT
Enter Name of Data Input File ...
EXAMPLEl .DAT
Input Mode Selection
0 - Create new input file
1 - Use or revise existing input file
Your choice?
Figure I. Main selection screen.
Can. For. Serv., Inf. Rep. O-
Again, for this example lype the name of (he supplied example file:
example! and press <ENTER>.
To correct any mistakes in
entering file names, press
<ESC> and follow the red
options menu at the bottom of
the screen. Press "Q" to quit, "R" to restart, or "C" to
continue. If no mistakes were
involved so far, press "C" to
continue.
4) The screen should now look like Ihe one shown in Figure 1.
Because the data input file EXAMPLEl .DAT has been provided with each copy
ofFIDMO-PC, lype:
1 and press <ENTER> at the prompt to:
"Use or Revise Existing Input File".
(The "0" option will be described in detail in Section C).
5) The next prompt is about appending files. It reads:
"Do You Wish To Append This File? (V/N)"
Appending files will be discussed later, so type:
N and press <ENTER> to proceed.
Pressing <ESC> for (5) or (6)
wilt again give you the options
of quitting, restarting, or
continuing.
6) The question of whether to edit a file is posed as:
"Do You Wish To Edit This File? (Y/N)"
Since the edit operation will be discussed later, type:
N and press <ENTER>.
The simulation can be
stopped if necessary by
pressing the <ESC> key. This
will give trie option of (R) to
restart the program (from [3]),
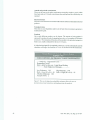
7) The program will now read the daia from the existing input file and begin
processing.
During the execution of the simulation, run time information is written to ihe
information window and continuously Updated as in Figure 2.
or (C) to continue with the
simulation.
FIDME-PC
OUTPUT: RUN TIME INFORMATION
ANALYSIS #1: PLANT J. PINE
Percentage of Iterations Completed:
Number of Iterations Abandoned:
Figure 2, Run lime information screen.
Can. For. Serv., Int. Rep. O-X-434
19.67%
8) The percentage of iterations completed for each analysis is given so that the
amount of time to completion can be estimated. The number of iterations abandoned
are also displayed to show how many trials failed to produce acceptable stocking
and were therefore regarded as complete failures.
9) Once the simulation is complete, the computer beeps to alert the user to:
"Press any Key to Continue".
This clears the information window and gives a prompt to enter a probability
interval for the tabular output. By typing:
5 and pressing <ENTER>
the output is displayed in two consecutive screens with 21 probability levels
(0-100%).
Typing:
10 and pressing <ENTER>
will display a single screen table with 11 probability levels (0-100%). Using 10 as
an example yields results as in Figure 3.
Natural Resources Canada - Ontario Region
FIDME-PC
OUTPUT: RESULTS OF ANALYSES
Figure 3. Tubular output screen.
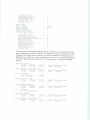
A detailed description and interpretation of tabular output is found in Payandeli and
Basham (1992). For example, the second row of the output indicates that there is
a 10% chance that the future cost of pulpwood will exceed S106.72/rrt3 for planting
jack pine, and SI 13.48/mJ for seeding jack pine. Conversely, there is a 90% chance
that the future cost per m' of pulpwood would he equal to or less than these figures
for planting and seeding jack pine. Row 3 of the table indicates that there is a 20%
chance that future cost of pulpwood /m3 will exceed S88.98 from the jack pine
plantation and $94.78 from seeded jack pine. Conversely, it indicates that there is
an 80% chance that the future cost per m! will be between $33.86 and $88.98 for
pulpwood from the jack pine plantation, and between $35.70 and $94.79Vm3 for
pulpwood from seeded jack pine.
Can. For. Serv., Inf. Rep. O-X-434
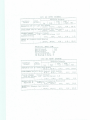
10) After viewing the tabular results the screen should look like that in Figure 4
This is the output options menu, which is the same for all simulation runs For
specific instructions on how to use the output options menu, see Section B.
When ready to enter your own input file data, type;
R and press <ENTER> to restart the program.
Natural Resources Canada - Ontario Region
FIDME-PC
OUTPUT: TABULAR/GRAPHICAL SUMMARIES
Output Graph lo (enter selection)
1)
2)
3)
Colour Monitor
Hard Copy
Summary File EX AMPLE I.OUT
P) Print Summary File
R) Restart Simulation
Q) Quit Now
Figure 4. Output options menu.
B. Output Options: Graphics Output to Screen,
Plotters, and Printers
A feature of FIDME-PC is its capability to plot graphs of the output to the monitor
screen, an HP plotter (Hewlett Packard), oraLaserJei printer. Agraphofthe output
can also be plotted to an ASCII text file. If necessary, refer to the section "Setlin^
up FIDME - PC for Peripherals".
Complete Section A and the screen should look like Figure 4. Options are
explained below.
Color Monitor
If you type:
1 and press <ENTER>
FIDME - PC will produce a culor coded graph of the tabular output that was just
viewed on the monitor screen. This option is a quick way of comparing alternative
investmenls. Once viewing the graph is completed, press any key to return to the
output options menu.
Hard Copy
If you have access lo an HP LaserJet printer or plotter, type:
2 and press <ENTER>.
Can. For. Sen/., Inf. Rep. O-X-434
This option can be used to print or write to a file that can be directly printed at a
later date. See "Hard Copy: The Hard Copy Option" below for discussion on (his
option.
Summary File EXAMFLE1.OUT
Choose this option by typing:
3 and pressing <ENTER>.
A graph of the tabular output will be written to the output summary file chosen at
the program run. This graph can be viewed on the screen or printed from the DOS
environment by using the DOS type or print command.
Print Summary File
Choose this option by typing and pressing P<ENTER>. It will print the output
summary file on the printer on the port specified using the FIDSETUP program.
To print the graph choose option 3 before choosing this option. This will add the
graph to the end of the output summary file before printing.
Restart Simulation
This option (R) will restart FIDMli - PC from the main selection screen.
Quit Now
This option (Q) will quit running FiDME-PC.
The above options are simple and straightforward, with the exception of Option 2,
which is described below. Press <ESC> to pause and optionally stop the printing
at any point.
Hard Copy: The Hard Copy Option
Unlike (he other options, the hard copy option does not produce immediate results.
In this option press <ESC> to return to the previous menu screen. You now have
the following three options of where you may plot the graph.
1. File
Selecting the tile option F provides two secondary options of what type of file to
plot to: an HP LaserJet file, or an HP plotter file.
(Press <ESC> at this point to return to the previous menu.)
After the proper output format is chosen, FIDME - PC then gives a prompt for a
file name. Enter a valid file name.
To exit the plotting press <ESC>.
Can. For. Sen/., Inf. Rep. O-X-434
Otherwise press any key to continue with a valid lilt: name. If the file name already
exists, FIDME - PC prompts the user asking if they wish to overwrite the file.
Choose:
N lo reenter another file name,
Y to overwrite the previous file,
or press <ESC> to exit the plotting routine at this point.
See Appendix 3 for information on how tn print graphs irom the files created by
tills option,
2. HP LaserJet
To ensure compatibility wiih a
plotterotherthananHP
7475A, this option should
always be used.
Choose option L to plot a graph to an HP LaserJet printer. (&•<?"Setting upHDME
- PC for Peripherals" far valid HP LaserJet models.) With this option, you can
choose plotting onto the default port (selected via FIDSETUP.HXE) or tn a new
port.
Press <ESC> to exit the plotting routine if desired.
Whether the default port or another is chosen, follow the instructions on thescreen
and continue. When all trie plot information has been sent to the printer, a message
that the plot is complete will he displayed on the screen.
To terminate or pause the plotting, press <ESC> and wait a Tew seconds for a
response. The option to terminate the ploi or resume plotting will appear.
3. HP Plotter
Choose the option P to plot a graph of the output to an HP 7475A plotter.
(Press <ESC> to return to the previous menu ifyou don't want to use this option.)
The default communication parameters are displayed on the top of the screen as
they were set when FIDSETUP.EXE was executed. To change these parameters,
follow the instructions on the screen, [fat any time (except while entering the baud
rate) you wish to cancel your changes to the default settings, press <ESC>.
[fthe default settings arc suitable, follow the instructions on the screen tocontinue.
[f plotting whs not cancelled the complete plot message will appear when the
computer is finished .sending the information to the plotter.
Cancelling the Plotting
FIDME- PC has only been
tasted with an HP 7475A
To pause or cancel the plotting for any reason, press <ESC> and wait for a
response. There should be no errors during plotting, but should one occur and the
computer is not responding, or the plotter is shut off in the middle uf the plotting,
plotter connected to its serial
port. II should, however, work
press the combination <CTRL-ErVP> to immediately terminate the plotting.
with other plotters that use the
Shutting off the plotter while printing is not recommended because in some eases
HPGL language and are
connected to the serial port.
Can. For. Sen/., tnl Rep, O-X-434
the computer will only respond to the keyboard if the plotter is on.
C. Creating New Data Files via Interactive Mode
1) Repeat Sections A-l to A-3, but instead of entering EXAMPLE I in Section A-3,
enter:
myfile for the output summary file, and data input file.
It is recommended that these files have the same name i.e., MYFILE.OUT and
MYFILE.DAT, to keep your directory organized.
2) The screen should now look like Figure I, except that EXAMPLE I has been
replaced with MYFILE. Respond now to the prompt at the bottom of the screen
by typing:
0 and pressing <ENTER> to activate FIDME - PC's interactive input
routines.
3) A series of screens prompting for analysis or alternative investments and their
associated costs/returns will follow. The prompts are logical, self-explanatory, and
easy to follow. Part 5 below gives a detailed summary of allowable input ranges
and their meanings.
4) Entering xxx at any time during the creation of the input data file will abort the
file creation and restart the program. If an error has been made (e.g., a percentage
value was entered incorrectly) having to abort the Tile creation can be avoided by
continuing to enter the data. When the simulation starts,
press <ESC>R to restart the program.
Reenter the file name that had been previously entered, and use the editor to correct
the mistakes (see "Editing Existing Files, Section D").
5) Specific input variables and data type descriptions for FIDME-PC's interactive
mode.
Run Identification
Less than 21 characters in length describing the simulation run.
Number of iterations
An integer between I and 500 used to set the number of times FIDME - PC is
required lo simulate the alternative investments involved and their associated
calculations.
Number of analyses
Number of alternative investments to be compared in each run.
Random number seed
An integer from -32768 to 32767. with an optimal range between 688 to 2R465.
used to generate a sequence of uniformly distributed random numbers.
See Appendix 3 for the
•
required and optimal inputs
for each of the four economic
criteria.
10
Economic criteria
An integer code between 1 and 4 indicating which of the four economic criteria is
to be used for the analysis. Descriptions of these options are given on the screen.
Note that when two input fields with different economic criteria are appended,
FIDMH - PC uses the economic criteria of the original input file.
Can. For. Sen/., Inf. Rep. O-X-434
Analysis title
Less than 15 characters giving a specific title to each analysis (e.g., Plant J. Pine).
Interest rate
An integer between 0 and 20 giving the rate of interest (e.g., 6 = 6% or 0.06).
Inflation rate
An integer between 0 and 20 giving Ihe rate of inflation (e.g., 6 = 6% or 0.06).
Rotation period
An integer indicating the number of years from stand establishment to final
harvest, which is less than the years to termination given the rotation age (e.g., if
years to termination are 180 and rotation age is 60, then there will be three rotations
before termination).
Years to termination
An integer giving the number of years until the forest stand is liquidated or
converted lo other use. It is best if this number is a multiple of the rotation period.
Lag from preparation to establishment
An integer indicating the number of years between site preparation and the
establishment of a sland (e.g., number of years between shear blading and
planting). This is usually less than 5 years.
Years from establishment to survey
An integer number indicating the number of years between stand establishment
(i.e., planting or seeding) and regeneration survey to determine whether stand
establishment was successful. This is also usually under 5 years.
Costs and returns
The number of possible costs/returns for a particular type available in an analysis
is indicated in parentheses with the prompting of the name of the cost/return (e.g..
Initial Cost 10-3]). Once the number of each cost/return is specified, the program
will give a prompt for the type of estimate and for the amount of the cosi/return.
All costs/returns can be expressed by either point estimate or subjective probability
estimates. A point estimate requires only one integer estimate, while a subjective
probability estimate requires a low, a high, and a minimum estimate, as well as a
probability (entered in percent formal) of the cost/return being lower than the low
estimate and a probability of the cost/return being lower than the high estimate.
Cost/return labels
Less than 75 characters describing the specific cost or return (e.g., planting black
spruce containers @ 1000 seedlings/ha).
Use Ontario stocking standards
These are the default
standards used by F1DME-PC
when you answer "Y" in the
above prompts are as follows:
Ontario stocking standards
Level for success -
0.6500
Level for failure-
0.-1500
Can. For. Serv., Inf. Rep. O-X.-434
To define a level of stand establishment other lhan the default (Ontario stocking
standards), enter Nat this prompt. If you answered "N" to this prompt, you will be
asked to enter ihe expected stocking. If a sland or plantation does not meet stocking
standards, it will be considered a failure. FIDME-PC will regenerate it up to three
times before it rescarifies if necessary. If the site does not produce a satisfactory
stock according lo the stocking standards, then that site will be abandoned.
11
Annual and periodic costs/returns
These are the same as the other costs/returns except they require a year in which
ihey begin ;md end. Periodic costs/returns also need an interval at which they are
repeated.
Final ens(/rt:turn
These are costs and returns associated with rotation end but not included in the final
products.
Terminal return
This refers to asset liquidation and/or sale of land when investment operation is
terminated for good.
Products
Up to eight different products can be chosen. The amount of c;ich product is
expressed in number of units of output/unit area (e.g., m3or number of Christmas
trees/acre). The estimation of the price of the product is the price/unit output in a
future year, usually estimated for the next 5-10 years.
6) After the data input file is completely entered, it is saved automatically and the
simulation will begin. See Sections A-7 to A-10 for the rest of the instructions.
Natural Resources Canada - Ontario Region:
FIDME-PC
COST, RETURN, OR PRODUCT INPUT ESTIMATES
-Analysis I: Preparation Costs Preparation Cost #i
Enter a label for this cost: Light Shear Blading
- Enter Subjective Estimates -
Low Estimates:
I 10
Prob. <Low (10 = 0.1): 10
Absolute Minimum: 100
Accept? (Y/N):
High Estimate:
140
Prob. < High (90-0.9):
95
y
Figure 5. The use of subjective probability emulates allows the user to
incorporate persona! experience and judgment into the analysis.
12
Can. For. Serv,, Inf. Rep. O-X-^34
0. Editing Existing Files
1) Before running FIDME - PC, make a copy of the example files to practice
editing. To back up the Hies, type at the DOS prompt:
copy example?.dat *.edt and press <ENTER>
2) Replace "example I" withcxamplel.edt when entering thedatainput file name,
and follow the instructions in Section A-l to A-6.
3) In response to: "Do You Wish To Edit This File? (Y/N)"
type Y and press <ENTER>.
4} After a moment of initialization, the top portion of EXAMPLE I .EDT (which
was originally EXAMPLE1 .DAT and was renamed for editing purposes) is on the
screen ready to be edited.
5) FIDME - PC's editor displays the location of the end-of-line carriage return by
displaying a "T\ BHd designates the end of the file with a © .
The line number being edited, along with the column, are displayed in the upper
left border of the screen. The bottom of the screen shows how to save and run, save
and return, and return (abort) a file. Use the arrow keys to move the cursor around
on the screen. When editing, it is important not to change the format of the file; only
change numbers or titles that you entered.
If order or format is changed (e.g.,
numeric to alphanumeric, integer to real) FIDME - PC will abort or produce
unreliable results.
To reduce chances of errors while editing, FIDME - PC does not allow the user to
delete characters or insert lines. Characters can be deleted by overwriting or use of
the space bar.
6) To begin, the first input file change is the preparation cost label for Analysis 1.
Using <PgDn> and the arrow keys, move the cursor to line 50, and change:
"Light Shear Blading" on that line to Heavy Shear Blading.
The next line (line 53) also appears but is not read by FIDME-PC. Next, on line
52 change:
110.0000 to 250.0000
140.0000 to 320.0000
100.0000 to 230.0000
The rest of the line is left as is.
7) See Appendix 2 for a summary of ihe different parts of the data (*.DAT) files.
Can. For. Sen/., inf. Rep. O-X-434
13
If mistakes have occurred
(such as entering fetters
8) Now that site preparation cost has been changed, continue with the simulation.
To return to the main selection screen and save any changes:
where numbers should have
hold down the <ALT> key and press W simultaneously.
been, or values that were out
of range), an error message
will be displayed instead of
To return to the main selection screen and disregard all changes:
the simulation. Refer to
press <ALT>X
Appendix D for an explanation
of the error.
To save changes and begin the simulation:
press <CTRL>C.
In this example we will proceed with the simulation and press <CTRL>C.
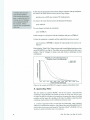
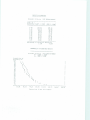
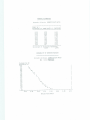
9) After the simulation is complete and the output tables have been viewed:
type 1 and press <ENTER> to display the output graph on the screen as in
Figure 6.
Notice that the "Plant J. Pine" future cost per unit is much higher than the previous
run of EXAMPLE 1 (see Fig. 6). The ediior can be a powerful tool to allow you to
perform "what if" changes in various costs and returns to determine the best
combinations.
Figure 6. An example o/FIDME-PC's graphics output for EXAMPLEI.OAT.
E. Appending Files
This new feature was added to FIDME - PC for two reasons:
small data files
containing a single alternative investment are easier 10 create, edit, and test, and;
the larger the data tile with three or four analyses, the greater the chance of making
mistakes and the longer the simulation will take. In addition, small data files
containing single analysis can be combined in numerous ways.
1)
In order to append two files, Iwo data files are needed that, when combined,
will have no more than four analyses. OncoflhesefilescanbeEXAMPLEl.DAT,
and the other must be one created using the "Interactive Mode" of F1DME- PC (see
Sections A and B) with either one or two analyses.
14
Can. For. Serv., Inf. Rep. O-X-434
2) Stan FIDME -PC and at the prompt: "Enter Name of Output Summary File" type:
appendexp and at the prompt: "Enter Name of Data Input File" type:
examplel.
3) Respond to the input mode selection by typing:
1 to "Use or Revise Existing Input File".
4) You are now given the prompt:
"Do You Wish to Append this File? (Y/N)"
Respond to this question by typing:
Y and pressing <ENTER>.
6) The screen now looks similar to the one in Figure 5 (except for the menu at the
bottom of the figure). Enter the full name of the file being appended to
EXAMPLE!.AIJP (including extension if it is other than .DAT). If you have
completed Section C, type:
my file
If you have not completed that section, use EX AMPLE2.
If a file name is entered that docs not exist or is invalid, FIDME - PC says so and
gives a prompt to press any key to reenter the file name or type:
X to cancel the append operation.
If the two files appended have
different economic criteria,
FIDME-PC will say which
criterion v/i!l be used for the
combined file. To carry out
the analysis with another
criterion, edit the combined
file and change its criterion.
7) Assuming that the combination of the two files does not exceed lour analyses,
FIDME - PC will notify you that the append operation is complete.
The file
appended to EXAMPLE1.DAT has been copied to the same name with a .BAC
extension.
You are now given three choices:
Enter the editor
Run the analysis
Return to file menu
8) From this point, any operation can be performed.
Can. For. Serv., Inf. Rep. O-X-434
15
PROGRAM STRUCTURE
Turbo Pascal (Borland International Inc., Scotis Valley, California) was the
programming environment chosen for the FIDME - PC prototype because of its
increasing popularity among programmers in forestry, its extensive libraries of
graphics and text manipulation routines, and its ability lo compile large programs
wilh ease.
As a first step toward the development of a prototype, the existing model FIDME
was convened from FORTRAN under the VAX/VMS environment into Turbo
Pascal under the MS DOS operating system. Corresponding runs of bo Mi programs,
each receiving identical input, were used to compare accuracy and optimized
through the elimination of redundancies and implementation of data structures not
available under a FORTRAN environment.
New, desirable features of the program are the generation ofX-Y plots on EGA/
VGA monitors, on the Hewlett Packard HP 7475A plotter, on the HP LaserJet III
and IV series printers (series II is also supported with proper memory and
cartridges), and to tiles for later output to LaserJet printers or other models of HP
plotters using the HPGL language.
SUMMARY AND CONCLUSIONS
FIDME - PC is a user-friendly simulation model that will assist forest managers,
policy makers, and administrators to make rational economic decisions bused on
personal experience and known facts. With the aid of this decision-making model,
forest managers can choose a forest management system wilh ihe best chance of
being the most economical or, alternatively, the management system that has the
best chance of producing wood at the lowest future cost/unit volume.
Up to four investment alternatives can be compared using any one of four
economic criteria;
Cost effectiveness
Benefit/cost ratio
•
Present net worth
Internal rate of return
Application of subjective probability estimates by FIDME - PC serves three
objectives: it serves as a built-in mechanism to adjust for risk and uncertainty
associated with the long-term investments under consideration; it provides a
simple method of using limited data augmented by personal experience or
judgements about future outcomes of a given set of conditions; and it allows
incorporation of variability and associated probability with the results.
Can. For. Sen/., inf. Rep. O-X^t34
ACKNOWLEDGMENTS
The authors thank J. Field and D. Basham of Natural Resources Canada, Canadian
Forest Service - Ontario; M. Punch of the Ontario Lottery Corporation; and S.
Rossi, a student from the University of Western Omario, for their programming
contributions in developing FIDME-PC.
BIBLIOGRAPHY
Olson, J.T.; Lundgren, A.L.; Rose, D. 1979. Equations for estimating stand
establishment, release and thinning costs in the Lake States. USDA For. Serv.,
North Central For. Exp. Stn., St. Paul, Minn. Res. Paper NC-163.
Payandeh, B. 1988, Economic evaluation of forest drainage and fertilization in
northern Ontario peatlands via an investment decision model. New For. 3:144-160.
Payandeh, B.; Basham, D.T.; Haig, R.A. 1991. Forestry investment decisions
made easy on personal computers. (FIDMEPC). For. Can., Ont. Region. Frontline
Note No.3.
Payandeh. B.; Basham, D.T. 1992. "FIDMHPC": forestry investment decisions
made easy on personal computers. Int. J. Model Simul. VoI.I3{2):72-76.
Payandeh, B.; Field, J.E. 1985. FIDME: Forestry Investment Decisions Made
Basy. Can. For. Serv., Great Lakes For. Cent., Sault Ste. Marie, Ont. Inf. Rep.
0-X-364.
Payandeh, B.; Haig, R.A. 1994. Using an investment decision model to evaluate
drainage and fertilization of pealland black spruce. Natural Resources Canada,
Can. For. Serv., Ont. Region. (In press).
Can. For. Serv., Inf. Rep. O-X-434
17
APPENDIX 1. Required and optimal categories for each economic
criterion
APPENDIX 2.
1)
Input/output file conventions
Entering File Names
When a file name is entered into FIDME-PC, the program looks tor a three-letter file name
extension. If this extension is not present, FIDME-PC will attach the extension OUT onto the
output summary file and .DAT onto the input data file. If the nwnu entered is longer lhan eight
characters, FIDME-PC will take only the first eight characters as the first part of the file name.
If the name entered has a period (.) in it, the first three characters after the period will be the
extension; otherwise FIDME-PC will append the appropriate extension onto it.
If an invalid file name has been entered (e.g., one with symbols such as "I", "'?", or "•"), the
program will rcprompt you for both file names.
2)
File Types
FIDME-PC uses ASCII text files for its DAT and .OUT files, both of which can be edited
with an ASCII editor or the editor supplied with FIDME-PC.
It is strongly re commended that
users »io not edit the .DAT files with any editor other than the one included with FIDME-PC,
because the addition of new lines can cause the file to become unreadable for analysis by
FIDME-PC.
3)
Data File Organization
The Data (.DAT) files are organized into three basic sections.
First is the Global Variable Section. This is illustrated using EXAMPLEI.DAT.
This section
contains the following important data that arc common to all the simulation runs:
First
Example
Number of Iterations
Number of Analyses
Random Seed
Economic Criterion
-
300
2
1334
1
The next section is the Analysis Specific Section. This is where the title and specific numbers
of costs and returns are specified. This section begins with Analysis I.
PLANT
J.
Rate of
PINE
Interest
-
Bate of.Inflation
Rotation Period
Yeats to Termination
Lag
From
Yeats
Prep
From
To
-
Estab
Prep.to
-
Survey
6.0000
1.0000
70
10
0
-
2
Initial Costs [0-3)
Preparation Costs (0-3]
Establishment Costs (0-3)
-
0
1
1
Level of Establishment
Annual Costs (0-9)
-
Yes
0
Specified
Periodic Costs [0-3}
Liquidation Costs (0-31
Annual
Returns
(0-S)
Periodic Returns 10-8)
Final Returns (0-8]
Terminal Returns
Products
SEED J.
PINE
Rate
Interest
of
Rate
of
Rotation
Years
(0-31
(0-S)
6, 0000
Tnflation
1. 0000
70
Period
to
Termination
Lag
From Prep To Estati
Yrs
From
Prep
to
7D
0
Survey
Initial Costs
2
(0-3}
Preparation Costs
0
(0-3)
1
Establishment Costs [0-3}
Level of Establishment Specified
Annual
Costs
Annual
Returns
1
Yes
(0-B)
0
Periodic Costs (0-S)
Liquidation Costs [0-31
1
0
[0-81
0
Periodic Returns (0-8)
Final Returns (0-91
Terminal Returns (0-3)
Products
0
0
0
(0-8)
1
The Ihird section, the Cost/Return Estimates Section, contains the costs and returns for ill] the
analyses, beginning with those of Analysis I To determine the order of costs/returns, the file
is organized in the same order in which the cost/returns are declared in the second section of
the data file (i.e., initial costs, if any: situ preparation costs if any, etc.). Note that the numbers
in the left column specify the estimate type: 0 - point estimate, I = subjective probability
estimate.
Light
ohear
Low
1
Bidding
Est.
High Est.
110.0000
Manual
Planting
Low Est.
250.0000
1
Ontario
140.0000
@
High
Standards
Level for Success Level for Failure -
0.4000
level
High Est.
0.9500
Pulpwood (Cubic Meter/ha)
Low Est.
High Est.
1
0
200.0000
Heavy 3hear
300.0000
of
Price
Prob Lo
0.0500
Prob High Absolute Minimum
0.9500
20.0000
0.6500
0.4500
Prob
Low
0.1000
Prob High Absolute Minimum
0.9000
0.J500
Prob Low
O.0500
0.9000
Prob Low
0.1000
0.5500
Prob Low
0.10Q0
Prob High Absolute Minimum
0.5000
20.0000
Prob High Absolute Minimum
150.0000
Forecast
Blading
Low Est.
250.0000
Aerial Seeding @
1
Prob High Absolute Minimum
0.3500
100.0000
0.0000
Year
1
Low
0.1000
Seed!ings/ha
Est.
350.0000
Exported stocking
Low Est.
1
1000
Prob
Low Est.
30.0000
'High Est.
320.0000
2O0OQ0 Seeds/ha
High Est.
fiO.0000
Prob High Absolute Minimum
230.0000
Ontario Standards
Level
for
Level
for Failure -
Expected stocking
Low
1
Est.
High
Prob
Est.
Low
0. 1000
0.9500
High Est.
300.0000
Beginning in Year
Ending in Year
Duration of Period -
1
0.4500
and Commercial Thinning Cost
Low Est.
75.0000
Pulpvraod
0.6500
-
level
0.2000
Precommercial
1
Success
Prob Low
0.0500
High
150.0000
250.0000
Est.
0.0000
Year of
Price
0.8000
0.0000
Pcob High Absolute Minimum
0.8000
50.0000
15
30
20
(Cubic Meter/ha)
Low Est.
Prob High Absolute Minimum
Forecast -
0
Pcob Low
Prob High Absolute Minimum
0. 1000
0.9500
120.0000
APPENDIX 3: Printing LaserJet and plotter files
1) HP LaserJet files: (use PCL5 and HPGU2 Commands)
■Make sure that the LaserJet being used is a version III or IV (all models are supported, i.e.,
IIIp, Illsi, IVp, IVsi, etc.). If it is a version II, refer io the section Selling up FIDME-PC for
Peripherals in this manual.
LaserJet files can be printed directly to a LaserJet printer with the DOS PRINT command For
example, assume EXAMPLE I ,LJ3 is a file to be printed (see Example Runs, Section B for
details on printing to files.) This Tile would be printed by typing:
print examplel.lj3
at the DOS prompt.
The print command could then ask for a printer port, so be sure to know
which port the LaserJet is on before trying to print.
2)
HP Plotter files (use HPGL Commands)
Make sure the plotter uses ihe HPGL language. Using a plotter file is complicated and involves
the use of DOS MODE command (refer to MS DOS user's manual for help on the MODE-
Configuring Serial Ports command). Mode must be used first to set the serial port to
communicate with the plotter. This means that the user must know the baud rate, parity, data
bits, and stop bits settings of the plotter. Then (assuming the plotter is on Com2, and the file
created using FIDME-PC's "Hard Copy"-"File" option is named EXAMPLE I.PLT), the file
can be copied to the serial port.
At the DOS prompt, type:
copy examplel.plt cum2
When the file is finished plotting, DOS will report that one file was copied. This method is
recommended if the plotter connected to the system is over a network, or if the plotter is not
an HP 7475A.
APPENDIX 4: Common or possible error types
Before using the data file specified in Example Runs, Section A to run the simulation,
HOME-PC checks the file to determine whether its data are valid. If FIDME-PC finds that the
data file contains bad data, it will provide an error message. Be sure to read the error message
and the analysis to which it refers, along with the title of the cost or return that generated the
error. These messages are classified in two types: ERROR I and ERROR 2. In both instances,
FIDME-PC returns to the editor on the line where the error occurred in order to fix the error.
Refer to Example Runs, Section C-5 for a detailed listing of all limits and requirements for the
input data.
ERROR 1: Message 1
Message 2
Press any Key to enter the editor
Generating a number that is out of range (e.g., using the editor to set iterations to 700) will
cause this error. Message 1 will give the value of the number that is out of range and then tell
the user what the number represents. If the error is not in Section 1 of the data file,
FIDME-PC will also display which analysis number it is in. For errors occurring in Section 3,
Message 2 will display the label of the cost or return in which the error occurred. Upon
entering the editor, the cursor will be positioned on the line where the error occurred.
ERROR 1: Message 1
Message 2
Press any key to enter the editor.
This type of error is generated by an illegal number reference. This error is somewhat more
serious and vague than Error 1. It is generated when FIDME-PC encounters data that it can
not read. For example, the error will occur if a real (.decimal) number is entered in place of an
integer number. Message I will display which number is invalid (e.g., invalid interest rate).
For errors occurring in Section 3, Message 2 will display the label of the cost or return where
the error occurred. Upon entering the editor, the cursor will be positioned on the line where the
error occurred.
APPENDIX 5: Output of example runs
- FFFFFFFF
FFFFFFFF
FF
mill
nun
DDDDDDD
DDDDDDDD
FF
ii
ii
FF
DD
DD
ii
DD
FFFFFFF
FFFFFFF
FF
FF
FF
ii
ii
DD
DD
DD
DD
DD
DD
DD
ii
ii
ii
FF
iiiiii
FF
iiiiii
MM
MM
MKM
DD
DD
DD
DD
DD
DD
DDDDDDDD
DDDDDDD
EEEEEEEE
EEF.EEtlEE
MMM
MMMM
MMMM
MM MMMM
MM
MM
MM
MM
MM
MM
KM
EF.
EE
MM
EEEEF.EE
EEEEEEE
MM
MM
MM
MM
MM
EE
EE
EEEEEEEE
EEEEEEEE
MM
MM
FP
pp
PP
PP
ppppppppp
EE
MM
MM
MM
FPPPPPPP
PPPPPPPPP
PP
PP
IBM Compatible Personal
Developed by B.
PP
cc
PP
Computers
Payanoeh and J.
Programmed by D. Basharn, M.
and D.
Dukes
Punch,
Fiwld
S.
Rossi
at Canadian Forest Service-Ontario
Sault
Ste.
RUN IDENTIFICATION:
Number
of
Iterations:
Number of Analyses:
Random
Seed:
Economic Criteria:
Input Data rile:
Output Summary:
ANALYSIS
Rate of
#1
Marie,
Ontario
First Example
300
2
1334
COST EFFECTIVENESS
EXAMPLEL.DAT
EXAI-IPLE1 .OiJT
PLANT
Interest
Rate of Inflation
Rotation Petiod
Years To Termination
Lag From Prep To Estab
Yrs Frcai Prep To Survey
PINE
cc
cc
PP
PP
cc
cc
PPPPPPFP
PP
...Forestry Investment Decisions Made Easy.,
on
ccccccc
ccccccccc
cc
cc
cc
cc
cc
ccccccccc
ccccccc
•
COSTS
I
Category
RETURN
Point
+
lEstimate
I
I
ESTIMATES
Subjective
I
I
Cost/Return
AND
High
Low
Estimates
[
Prob.
I
<
Prob.
<
Low
Min
High
preparation cost »l-> Light shear Jladinq
100.D0
ESTABLISHMENT cost *l-> Kaaut^PUntin, i^QOB
I STOCKING STANDARD
-^Ontario Standards
Level For Success:
0.65
Level
(Expected Storing:
tor Failure!
^^
1 PRODUCT t*l-> Pulpwood
I Amount:
10.00
^
0.4.
{
I
I
200.00
300.00
I
SEED J.
Rate of Interest
Rate of Inflation
Rotation Period
: 6-00
: 1.00
:~?0
Yrs From Prep To Survey
:2
COSTS
I
AND
RETURN
0.90
150.00
ESTIMATES
Point
I Estimate
Category
0.05
:70
:0
Subjective
I
0.35
PINE
Yeats To Termination
Lag From Prep To Estab
Cost/Return
0.90
(Cubic Meter/ha)
ANALYSIS #2
[
0.10
Estimates
Prob.
|
Low -
I
<
High
Lou
I
I
Prob.
<■-
I PREPARATION COST il-» Heavy Shear Blading
0.95
I ESTABLISHMENT COST il-> Aerial Seeding 8 200000 Seeds/ha
I
30.00
[STOCKING STANDARD
Level
■ed
I
60.00
->Ontario Standards
For Sue-ess:
Stocking:
I
0.65
Level
|
0.20
High
I
For
Failure:
I
0.95
0.10
I
I
230.00
0.90
20.00
0.80
0.05
0.45
I
0.10
[PERIODIC COST #!-> precorarnercial and Commercial Thinning Cost
^
Banning: 15
Ending: M
^nf
tv,L.flM
I PRODUCT
I Amount:
II->
Pulpwood
|
(Cubic Mster/ha]
I
150.00
I
250.0 0
I
0. 10
0.95
I
120.00
I
I
RESULTS OF ANALYSIS
Economic Criteria:
Percentage of
COST EFFECTIVES;
Iterations Abandoned:
1.338
B.DO
PROBABILITY OF EXPECTED RESULTS
Economic Criteria:
i~>
S->
33.36
56.03
78.20
PLANT
SEED J.
100.36
Future Cost
COST EFFECTIVENESS
J.
(S
PINE
PINE
122.53
per Unit
144.70
Output)
166.37
189.04~
...Forestry
on
Investment Decisions Made Easy...
IBM Compatible
Developed by B.
Personal
Computers
Payandeh and J.
Programmed by D. Basharn,
and D.
M.
DuKes
Punch,
Field
S.
Rossi
at Canadian Forest Service-Ontario
Sault
RON
Ste.
IDENTIFICATION:
Marie,
SECOND EXAMPLE
Number of Iterations:
Number of Analyses:
Random
300
2
35
Seed:
BENEFIT/COST
Economic Criteria:
Input
Data
Output
ANALYSIS
Rate
of
File:
EXAMPLE:.DAT
Sumrury:
EXAMPLE2.OUT
til
J.P.
BARE ROOT
Interest
Rate of Inflation
Rotation
Years
Lag
Yrs
Ontario
Period
To Termination
From Prep To Estab
From Prep To Survey
00
00
RATIO
COSTS
Cost/Return
Category
AND
RETURN
Subjective Estimates
! Point
I Eat imate
Low
ANALYSIS
Rate
of
«2
J.P.
High
Interest
From Prep To Survey
COSTS
[
I
Cost/Return
Category
I Point
[Estimate
#!-> Light
RETURN
I
Prcb.
I
<
Prob.
< High
Low
Min
6.00
l.OO
70
70
0
ESTIMATES
Subjective Estimates
Low
PREPARATION COST
AND
I
CONTAINER
Rate of Inflation
Rotation Period
Years To Termination
Lag From Prep To Estab
Yes
ESTIMATES
High
Shear Blading
Prcb.
< Low
|
i
Prob.
< Hign
Min
RESULTS OF ANALYSIS
Economic Criteria:
Percentage of
BENEFIT/COST RATIO
Iterations
0.00*
PROBABILITY
Abandoned:
1.67*
OF EXPECTED RESULTS
Economic Criteria:
BENEFIT/COST RATIO
*->
J.
E>.
BARE
S->
J.
P.
CONTAINER
ROOT
+
+
+
3.06
Beni£it/Cost
Patio
3.58
4.11
.Forestry Investment Decisions Made Easy.,
on
IBM Compatible
Personal
Computers
Developed by 3. Payandeh and J. Field
Programmed by D. Basham, M. Punch, S. Rossi
and D.
ar
Dukes
Canadian Forest Service-Ontario
Sault Ste. Marie, Ontario
RUN IDENTIFICATION:
THIRD EXAMPLE
Number of Iterations:
300
Number of Analyses:
Random
3
Seed:
965
Economic Criteria:
PRESENT NET WORTH
Input Data File:
Output Summary:
ANALYSIS
Rate of
Race of
#1
J.p.
EXAMPLE3.DAT
EXAMPLES.OUT
BARE
Interest
Inflation
ROOT
:
:
6 00
1. 00
Rotation Period
:70
Lag
From Prep To Estab
:0
Yrs
From
Years
To
Termination
Prep
To Survey
:70
;2
COSTS
;ost/Return
Category
y
*
AND
RETURN
I
I
I
Point
ESTIMATES
Subjective Estimates
*
+
[Estimate I
I
'
I
Low
I
I
High
?"*■
I
< Low
PREPARATION COST il-> Light Shear Blading
P™ \
|
< High
0.95
0. 10
Mm
I
100.00
I
I
ESTABLISHMENT COST ll-> Manual planting yO0O SeedHngs/ha
ISTOCKING STANDARD
-^Ontario Standards
Level Foe Success;
0.65
Level Foe Failure:
ANALYSIS
Rate
of
12
B.E.
BARE
ROOT
6.00
Interest
1.00
Rate of Inflation
Rotation Period
Years To Termination
Lag
Yrs
From Prep To
Fcom Prep To
COSTS
I
Cost/Return
Category
0.45
90
90
Estab
Survey
AND
0
2
RETURN
ESTIMATES
Subjective Estimates
I
I Point
lEstimate
tI
I
I
High
Low
PREPARATION COST #!--■ Light Shear Blading
I
110.00
I
140.00
|
I
Prob.
'• Low
0.10
I
1
I
Prob.
Min
< High
1.95
I
100.00
i
ANALYSIS Hi
W.S,
CONTAINER
Kate of Interest
Rate of Inflation
Rotation Period
g.oo
1.00
Years To Termination
Lag
Yrs
From Prep To Estab
Fcom Prep To Survey
COSTS
I Cost/Return
AND
RETURN
\ Point
Category
ESTIMATES
Subjective Estimates
lEstimate
I
_==^
PREPARATION COST Sl-> Heavy Shea. Blading"
1
'
"=
[STOCKING STAT^.RD
1
I
Prob.
|
• _^f *___(___< High |
I.J.I0.-00 |
320-00 I
".IS I
|
^30.00 ,
0.10 ,
Min
———=™=,
0.95 |
230.00 !
0.90 |
130.00 !
0.05 i
0.95 |
0.40 |
6°-00 '
°'10 '
0-30 I
25.00 I
i_Jf!?l-!L'. 35°'D0 '
°"10 '
°-90 I 250-"0 !
0.10 [
0.90 t
ESTABLISHMENT COST &;-;■ Planting sTlOOQ Co""
I
Prob.
l«;« [
—Ontario Standards
+
*
+
]
0.45
{.
1
3
1
'
Ending; 10
0-45 I
^95 <
Interval:
l^.ll^.l
IPRODUCT 41-, Pulpwood (Cubic Metec/hai
I Amount:
1
}
-
}
IPri-rer S/Unit Output, Yeat of Toreoast: IS
'1-0G i
2
""
"""+
&-U0 |
*
*"
'
+
l
'
2.00 I
RESULTS OF ANALYSIS
Economic Criteria:
PRESENT NET WORTH
Erob. o£ I
Exceeding I J . P. J3AREJW0T I B^j___BARE ROOTIW.S.
CONTAINERI
1244.27
670.47
694.53
359.77
261.24
568.34
201. 14
115.55
57.06
319.51
481.29
385.29
245.06
149.78
15.60
-66.81
70.55
-156.82
-245.75
-18.23
-333.12
-529.74
Percentage of Iterations Abandoned:
1.33%
0.00*
5.67%
PROBABILITY OF EXPECTED RESULTS
Economic Criteria:
((->
S->
l->
J.P.
B.3.
W.S.
PRESENT NET WORTH
BARE BOOT
BARE ROOT
CONTAINER
Probability O£
Exceeding
100+
95+
90*
85+
80 +
75 +
[S3
S
#
%
#«
#*
It
70 +
*
65+
60 +
55+
50+
9 5+
40 +
35 +
30+
s
s
s
*
%
*
%
I
25+
20 +
*
Present Met Worth
i
i
(S per Unit Area)
m
mm
MMM
MMM
MMMM
MMMM
MM MMMM MM
MM
MM
MM
MM
MM
MM
MM
MM
MM
MM
MM
MM
MM
MM
MM
MM
MM
EEEEEEEE
EEEEEEEE
EE
EE
EE
EEEEEEE
EEEEEEE
EE
EE
EE
EEEEEEEE
EEEEEEEE
--.Forestry Investment Decisions Made Easy!"
on IBM Compatible Personal Computers
Developed by B. Payandeh and J. Field
Programed by D. Basham, M. Punch, 5. Rossi
and D.
Dukes
at Canadian Forest Service-Ontario
Sault Ste. Marie, Ontario
RUN IDENTIFICATION:
Number of Iterations:
Number of Analyses:
Random Seed:
Economic Criteria:
Input Data File:
Output Summary:
FOURTH EXAMPLE
50 0
3
1235
INTERNAL RATE OF RETURN
EXAMPLE4 . DAT
EXAMPLE4.QUT
ANALYSIS tl
Rate
of
J-P- BABE ROOT
6.00
Interest
1.00
Rate of Inflation
Rotation Period
Years To Termination
70
TO
0
Lag From Prep To Estab
Yrs
From Prep To Survey
COSTS
I
I
I
"i
'
Cost/Return
I
Category
AND
RETURN
_
Point
Intimate
ESTIMATES
pCob.
<
Low
Lou
= IHITIAl"cOSt"'si-> Land Market Value IS/hal
I
100.0
mi=_==m=_=_,I, |
subjective Estimates
I
I
Prob.
,
<
High
(
I
,
Min
,
!
,
[preparation cost U-> Light Shear BUding
i
0_g6 {
100_00 ,
;7^'^ Root idlings
idlings/ha
;^i^";":;"^r;Uti;7^000'^,S
350.00
0. -15
JExpeeted Stocking:
q ^ ^
yAL COST #!-> Property tax,
Beginning:
1
etc.
Ending: 10
4.0
Q>g5
;
Q_10
(
0_90
|
0.35
(S/ha/yeac)
I
+
t
„
.ERioDIc"o5T"#i:>"precommercial and Commercial Thinning cost S/ha
_. i=
p^rflr,nInterval: 20
20
Beglnn:n,3:
1
Endin,: 4^
4575.00 Infrvtl.
.„
.
o.ac ,
1
300.00 I
0.05
50.00
I
ET'JRN »!-- i-isei-s fee foe Hunting and/or Fishing (S/ha)
Beginning:
10
I
Ending;
4.0
1
70
'pERIODIc'bETURN #1-' Return from Commercial Thinning (S/ha)
Beginning: 3^
Ending: 45^ QQI"teJ^*^Q"(
Oi2O ,
\ PRODUCT *l-> Pulpwood
150.00
s/iJnit Output,
50.00
(Cubic Mtzteclba)
lAmnunt:
price:
0_ao |
Yea, of
I
200.00
I
0.10
I
0-95
I
100.00
^^«
I PRODUCT fr2-» Sawlogs
I Amounts
(
75_Q0
(
100.00
1
""o^put, Year of Recast: 10^ |
o.LO
'
q_^ |
0-l5_
fl_g() (
5°"°°_
5>
I
R00T
Rate of Interest
-~fi~
Rate of Inflation
j
Rotation Period
Years To Termination
Lag From Prep To Estat.
Vrs From Prep To Survey
f
.70"
-?o
[0
:2
return
I Cost/Return
| Point
Category
1
^
lEstimate I
■initial cost #i-> Land Market
"*,
Value
estimates
Subjective Estimates
T""l
I
Proo.
I5TOCKING STANDARD
->Ontario Standards
Level For Success:
1
0.65
{
'+
Level For Failure-
]_
O'^ I
""urel
0.90 I
\MtWAL COST «-> Property tax, «c" tS/ha"^r)+
Beginning:
i
Ending;
I
1,0
70
;
0.10
*
+
0.10 I
0.95 I
n 1 <i
u'4il
+
+
1
'
0.30 j
'
I
1
II Amount:
PRODUCT «-> Pulpwood"cubirMeter/ha)
1
Prob.
»/
I PREPARATION COST #!-> Light She'Ir!lading
*
!
lll°:°ll J«:0»l
IExpect*d Stocking:
*"j
*
+
T
'
!_.f!0-00: 230.00J
o.io,
0.95 ,
150.00 ;
(Price: S/Unit Output, Year of Forecast: 10
"
i
'
!;°° !
8-°° I
*
0-W '
*
0.90 I
'
2.00 !
ANALYSIS *3
SCOTS_PINE=CH.
Rate of Interest
• 6.00
Rotation Period
Years To Termination
='"
-^
Rate of Inflation
!in
Lag From Prep To Estab
Yrs From Prep To Survey
COSTS
AND
!0
:2
RETURN
ESTI|^^M1«.
Subjective Estimates
i
I cost/Return
I
Category
Point
[Estimate
f
*
I
^
Market Value
1
500.0
|
Pl:ob.
,
« UM
_+
COST #1 > Heavy a.
Prob.
,
<jjl
+
i-jn.OQ I
250.00
^
I
(S/ha)
I
Stocking:
i
High
q^o
I
° ■10
(
Q_g5
l
0.05
350.00
(
+.
Q-1Q
° ■95 ]
I
0.95
,
I
0.95
225;00
|
|anNUAl"cost'"#1->> Prpy,
Property, tax, etc. (S/ha/yearl
ii
Beginning:
1
Ending: 10
ODIcc^Tn
Beginning,
2^
Encilngt
U .5 ^ Vision/h.1
^^^f "^00 I
0.10!
0.90
rii""^Tir^d"shig ot Cbtist^as Trees (S/ha!
i
Beginning:
1
Ending:
J^^"""^^ f
0.10
I
0.90 I
100.
iLIQUIDATION COST #l-> Sales Commision [S/ha)
TtERMINAx'^TURN *l-> Land Sales Price (5/ha)
]
IPRODUCT
l->
#l
700.0
I
.
Christmas Trees/ha
(
gQQ ^Q
,
it Output, Year of Focecast:
^^
950,00
10
l0_00
,
0.
,
oao
Q^Q
;
3]00
,
RESULTS OK ANALYSIS
Economic Criteria:
Prob.
of
INTERNAL RATE OF RETURN
|
.
BARE ROOTISCOTS PIHE CM.j
0.16
0.13
0.13
0.13
0.12
0.12
0.11
0.11
0.11
0.10
0.08
Percentage of Iterations Abandoned:
2-00S
5.40ft
o.OOS
PROBABILITY OF EXPECTED RESULTS
Economic Criteria:
#->
S->
*->
INTERNAL RATE OF RETURN
J. P. &ARE ROOT
B. S. BARE ROOT
SCOTS PINE CH,
Probability Of
Exceeding
100 +
95+
(8)
S
50+
S0+
#
£
$
"
,
j,
60+
#
S »
+
V
s
#
s
#
t
* .
I
«
o+
s#
30+
5S
s*
*
J
J
s*
20+
I *
10+
I *
15+
s
5+
0.00+—+
0-O3.
+
0.052
I
*
+
1
*
s#
,__
0.069
«
I
_
+_
+
»
*
+
+
0.087 'TToT'^Ur'T.ul^TAl?
Internal Rata of Return
(&)


![i36l I33l EIrIIIllIrrllIl tlrxlrllIr I lrlllr]lll It DA2](http://vs1.manualzilla.com/store/data/006759536_1-e1b2d27f25e11b765edbcc7af9879218-150x150.png)