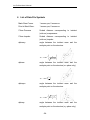
1
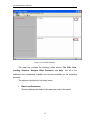
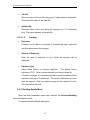
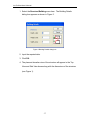
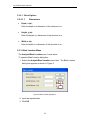
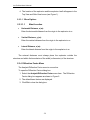
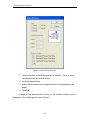
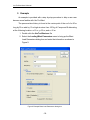
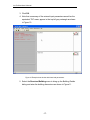
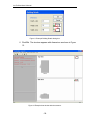
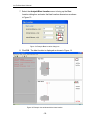
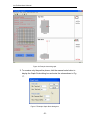
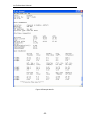
VecTor-Blast User’s Manual P.A. Miller F.J. Vecchio August 2004 Table of Contents Table of Contents LIST OF FIGURES ..................................................................................................................................... II NOTATION.................................................................................................................................................III 1 INTRODUCTION ............................................................................................................................... 1 2 VECTOR-BLAST BASICS ................................................................................................................ 1 2.1 VECTOR-BLAST INTERFACE .................................................................................................. 1 2.1.1 2.1.2 2.2 CREATING AND SAVING THE FILE ................................................................................................. 3 OPENING A SAVED FILE ................................................................................................................ 4 MENUS............................................................................................................................................ 4 2.2.1 BLAST LOAD PARAMETERS MENU ............................................................................................... 4 2.2.1.1 Menu Options ..................................................................................................................... 5 2.2.1.1.1 2.2.1.1.2 General Information .....................................................................................................................5 Loading ........................................................................................................................................6 2.2.2 BUILDING DETAILS MENU ............................................................................................................ 6 2.2.2.1 Menu Options ..................................................................................................................... 8 2.2.2.1.1 Dimensions...................................................................................................................................8 2.2.3 BLAST LOCATION MENU .............................................................................................................. 8 2.2.3.1 Menu Options ..................................................................................................................... 9 2.2.3.1.1 Blast Location ..............................................................................................................................9 2.2.4 DIFFRACTION FACTOR MENU ....................................................................................................... 9 2.2.4.1 Menu Options ................................................................................................................... 10 2.2.4.1.1 Diffraction Factors .....................................................................................................................10 2.2.5 GRAPH PRESSURES MENU .......................................................................................................... 10 2.2.5.1 Menu Options ................................................................................................................... 12 2.2.5.1.1 2.2.5.1.2 2.2.5.1.3 2.3 Face ............................................................................................................................................12 Location on the Face ..................................................................................................................12 Display on Graph........................................................................................................................12 AXES BUTTONS ......................................................................................................................... 12 2.3.1 AUTO SCALE .............................................................................................................................. 13 2.3.2 MANUAL SCALE ......................................................................................................................... 13 2.3.2.1 Time Scale ........................................................................................................................ 13 2.3.2.2 Pressure Scale .................................................................................................................. 14 3 THE DATA FILE.............................................................................................................................. 14 4 GENERAL MODELLING CONSIDERATIONS.......................................................................... 15 5 EXAMPLE......................................................................................................................................... 16 6 LIST OF DATA FILE SYMBOLS .................................................................................................. 24 7 ERROR MESSAGES........................................................................................................................ 26 -i- List of Figures List of Figures FIGURE 1 VECTOR-BLAST INTERFACE. ............................................................................................................. 2 FIGURE 2 BLAST LOAD PARAMETERS DIALOG BOX. ........................................................................................ 5 FIGURE 3 BUILDING DETAILS DIALOG BOX...................................................................................................... 7 FIGURE 4 BLAST LOCATION DIALOG BOX. ....................................................................................................... 8 FIGURE 5 DIFFRACTION FACTOR DIALOG BOX. .............................................................................................. 10 FIGURE 6 GRAPH PRESSURE DIALOG BOX. ..................................................................................................... 11 FIGURE 7 AXES BUTTONS. ............................................................................................................................. 13 FIGURE 8 GRAPH SCALE DIALOG BOX............................................................................................................ 13 FIGURE 9 EXAMPLE BLAST LOAD PARAMETERS DIALOG BOX. ...................................................................... 16 FIGURE 10 EXAMPLE VIEW WINDOW WITH BLAST LOAD PARAMETERS. ......................................................... 17 FIGURE 11 EXAMPLE BUILDING DETAILS DIALOG BOX.................................................................................. 18 FIGURE 12 EXAMPLE VIEW WINDOW WITH THE STRUCTURE. ......................................................................... 18 FIGURE 13 EXAMPLE BLAST LOCATION DIALOG BOX. ................................................................................... 19 FIGURE 14 EXAMPLE VIEW WINDOW WITH THE BLAST LOCATION.................................................................. 19 FIGURE 15 EXAMPLE GRAPH PRESSURE DIALOG BOX.................................................................................... 20 FIGURE 16 EXAMPLE VIEW WITH GRAPH........................................................................................................ 21 FIGURE 17 EXAMPLE GRAPH SCALE DIALOG BOX. ........................................................................................ 21 FIGURE 18 EXAMPLE VIEW WITH MODIFIED GRAPH. ...................................................................................... 22 FIGURE 19 EXAMPLE DATA FILE. ................................................................................................................... 23 -ii- Notation Notation DF base diffraction factor DC diffraction coefficient n number of corners traveled around by a blast wave -iii- VecTor-Blast User’s Manual 1 Introduction VecTor-Blast is a pre-processor that generates blast loads for use in finite element analysis of concrete structures. The role of VecTor-Blast is to provide a graphical user interface through which blast pressure calculations can be made. This manual provides assistance for using VecTor-Blast. VecTor-Blast was created in Visual C++ and works most efficiently in Windows XP. VecTor-Blast may not run well in older versions of Microsoft Windows because the operating system has been changed by Microsoft. Updating the comctl32.dll file, that can be downloaded from the following site, http://support.microsoft.com/default.aspx?scid=kb;en-us;167121 will fix many of the problems. Furthermore, updating the version of Microsoft Internet Explorer should accomplish the same result. 2 VecTor-Blast Basics 2.1 VecTor-Blast Interface Upon starting VecTor-Blast, an introduction window appears over the view window. The introduction window disappears if you click the mouse, hit a key, or wait a few seconds and the view window remains as shown in Figure 1. VecTorBlast is a single document interface. The exact appearance will vary slightly depending on the operating system. -1- VecTor-Blast User’s Manual Figure 1 VecTor-Blast Interface. The menu bar contains the following visible menus: File, Edit, View, Loading, Structure, Analysis, Blast Pressures, and Help. Not all of the submenus are immediately available but become available as the modelling proceeds. The window is divided into five major boxes. Blast Load Parameters This box displays the details of the explosive used in the model. -2- VecTor-Blast User’s Manual The Middle Grey Box This box graphically displays the predicted blast load at a location on the structure. The Bottom Grey Box This box contains the axes modification buttons. These buttons enable the user to change the scales of the axes on the graph. Top View This box displays the plan view of the structure. The smaller box with the x-z coordinate system displays the x and z distances to the explosion from the origin. The origin in the x-z coordinate system occurs at the top left corner of the structure. Side View This box displays the elevation view of the structure. The smaller box with the x-y coordinate system displays the x and y distances to the explosion from the origin. The origin in the x-y coordinate system is the bottom left corner of the structure. 2.1.1 Creating and Saving the File To create a new file: Select the File/New menu item. You will be asked if you want to save the current file. Click Yes or No. Everything on the screen will be erased and a blank screen will be shown. 1. To save the file: 2. Select the File/Save menu item. 3. Select the directory in which to save the file. 4. Enter a name for the file. 5. Click Save. -3- VecTor-Blast User’s Manual To save another version of the same file, select File/Save As menu item and follow steps 1 to 4 while changing the name of the file. 2.1.2 Opening a Saved File To open a saved file: 1. Select the File/Open menu item. The Open dialog box appears. 2. Browse for and selected the desired VecTor-Blast file. 3. Click Open. 2.2 Menus Control in VecTor-Blast is achieved through menu options allowing the user to make inputs and selections. This section will provide a description of the various menus and their individual options. 2.2.1 Blast Load Parameters Menu To open the Blast Load Parameters dialog box: 1. Select the Loading/Blast Parameters menu item. The Blast Load Parameters dialog box appears as shown in Figure 2. -4- VecTor-Blast User’s Manual Figure 2 Blast Load Parameters dialog box. 2. Input the required data. 3. Click OK. 4. A summary of the entered information will appear in the grey Blast Load Parameters Box in the left hand corner of the main window (see Figure 1). 2.2.1.1 Menu Options 2.2.1.1.1 General Information Title Enter an alpha-numeric title up to 30 characters long. appears in the data file generated at the end of the analysis. -5- The title VecTor-Blast User’s Manual Job File Enter the name of the job file using up to 6 alpha-numeric characters. This will set the name of the data file. Analysis By Enter the name of the user doing the analysis up to 30 characters long. The name appears in the data file. 2.2.1.1.2 Loading Explosion Currently VecTor-Blast is restricted to conventional high explosives and this option cannot be changed. Amount of Explosive Enter the mass of explosive in kg to which the structure will be subjected. Explosive Type Select either Built-In or Custom explosive. The default built-in explosive is TNT. Others can be selected from the pull down list. If Custom is chosen, it is recommended that a name be entered for the explosive using up to 20 characters. The heat of combustion in kJ/mol must be entered. Only one explosive type can be selected at once. The other will be inactive. 2.2.2 Building Details Menu Once the blast parameters have been entered, the Structure/Building menu will become active. To open the Building Details dialog box: -6- VecTor-Blast User’s Manual 1. Select the Structure/Building menu item. The Building Details dialog box appears as shown in Figure 3. Figure 3 Building Details dialog box. 2. Input the required data. 3. Click OK. 4. The plan and elevation view of the structure will appear in the Top View and Side View boxes along with the dimensions of the structure (see Figure 1). -7- VecTor-Blast User’s Manual 2.2.2.1 Menu Options 2.2.2.1.1 Dimensions Depth, x (m): Enter the depth or x-dimension of the structure in m. Height, y (m): Enter the height or y-dimension of the structure in m. Width, z (m): Enter the width or z-dimension of the structure in m. 2.2.3 Blast Location Menu The Analysis/Blast Location menu is now active. To open the Blast Location dialog box: 1. Select the Analysis/Blast Location menu item. The Blast Location dialog box appears as shown in Figure 4. Figure 4 Blast Location dialog box. 2. Input the required data. 3. Click OK. -8- VecTor-Blast User’s Manual 4. The location of the explosion and the explosion itself will appear in the Top View and Side View boxes (see Figure 1). 2.2.3.1 Menu Options 2.2.3.1.1 Blast Location Horizontal Distance, x (m): Enter the horizontal distance from the origin to the explosion in m. Vertical Distance, y (m): Enter the vertical distance from the origin to the explosion in m. Lateral Distance, z (m): Enter the lateral distance from the origin to the explosion in m. The entered distances must always place the explosive outside the structure and within the boundaries of the width (z-dimension) of the structure. 2.2.4 Diffraction Factor Menu The Analysis/Diffraction Factor menu is now active. To open the Diffraction Factor dialog box: 1. Select the Analysis/Diffraction Factor menu item. The Diffraction Factor dialog box appears as shown in Figure 5. 2. The default base factors are displayed. 3. Click Ok to close the dialog box. -9- VecTor-Blast User’s Manual Figure 5 Diffraction Factor dialog box. 2.2.4.1 Menu Options 2.2.4.1.1 Diffraction Factors Pressure: This base factor is used to create a diffraction coefficient to account for the pressure reduction due to diffraction. Impulse: This base factor is used to create a diffraction coefficient to account for the impulse reduction due to diffraction. The diffraction coefficient, DC, is calculated by Eq. 1 DC = DF n (1) DF is the base factor for pressure or impulse and n represents the number of corners the blast wave must travel around to reach the point on the structure for which the analysis is being performed. 2.2.5 Graph Pressures Menu The Blast Pressures/Pressure-Time Profile menu is now active. To open the Graph Pressure dialog box: 1. Select the Blast Pressures/Pressure-Time Profile menu item. The Graph Pressure dialog box appears as shown in Figure 6. -10- VecTor-Blast User’s Manual Figure 6 Graph Pressure dialog box. 2. Click on the face for which the analysis is required. The x, y, and z coordinate boxes will now be active. 3. Input the required data. 4. Select which pressure-time components are to be displayed on the graph. 5. Click OK. A graph of the pressure-time history on the entered analysis point is displayed in the middle grey box (see Figure 1). -11- VecTor-Blast User’s Manual 2.2.5.1 Menu Options 2.2.5.1.1 Face Click on the face where the analysis is required. This will activate the coordinates on the face. Depending on which face is selected, some of the input locations will be disabled. This is to ensure that the entered coordinates are on the surface of the face selected. 2.2.5.1.2 Location on the Face x (m): Enter the horizontal or x-coordinate of the analysis point in m. y (m): Enter the vertical or y-coordinate of the analysis point in m. z (m): Enter the lateral or z-coordinate of the analysis point in m. 2.2.5.1.3 Display on Graph Select the pressure-time components that you wish to have displayed on the graph. If you are unsure which ones will appear, click All. There can be situations where some of the components are zero and nothing will be displayed on the graph if you select that particular component to be displayed. 2.3 Axes Buttons The user is able to scale the graph using the axes buttons, shown in Figure 7, only after the graph appears. -12- VecTor-Blast User’s Manual Figure 7 Axes buttons. 2.3.1 Auto Scale Clicking this button will scale the graph to the default setting such that the entire graph is displayed. 2.3.2 Manual Scale Clicking the Manual Scale button will launch a menu shown in Figure 8. The user is able to insert custom maximum and minimum values for the x and y axes on the graph. Figure 8 Graph Scale dialog box. 2.3.2.1 Time Scale Min Time (ms): Enter the minimum value of the time axis in milliseconds (ms). -13- VecTor-Blast User’s Manual Max Time (ms): Enter the maximum value of the time axis in milliseconds (ms). 2.3.2.2 Pressure Scale Min Pressure (kPa): Enter the minimum value of the pressure axis in kPa. Max Pressure (kPa): Enter the maximum value of the pressure axis in kPa. 3 The Data File A data file, “Job.txt”, is created after the analysis. The data file contains greater detail than the graph can provide. Information for the data file is generated after each analysis. If the same analysis point is chosen two or more times in a row, the data will only be written once to the data file. As a new point is chosen, the corresponding generated information is added to the data file. The data file can be broken down into three sections: blast parameters, structural parameters, and wave parameters. Blast Parameters This section contains the details entered in the Blast Load Parameters dialog box. Structural Parameters This section contains the following details: o the size of the structure o the location of the explosive o the face on which the analysis point is located o the coordinates of the analysis point o the distance and scaled distance from the analysis point to the explosive o the angles of incidence -14- VecTor-Blast User’s Manual Wave Parameters This section contains the details of each x, y, and z component of every wave hitting the analysis point. The parameters included are all the basic side-on and face-on values. The pressure-time histories are obtained by combining certain parameters together. The final pressure-time histories of each component of every wave are also included in addition to final combined pressure-time histories if there are multiple waves striking the analysis point. 4 General Modelling Considerations The following are few general tips and modelling suggestions. VecTor-Blast was not designed for extremely near explosions (i.e. explosion almost on the surface of the structure); therefore the results may not be accurate in such cases. Model near ground explosions as explosions on the ground. Blast wave parameters are calculated based on scaled height of the blast (height of the explosion/mass of explosive1/3). Data in VecTor-Blast for scaled heights of blast does not cover a large range and is generally limited to significant heights, thus a small blast height may be out of range. If a custom explosive is used, ensure that the custom explosive is a high explosive exhibiting ideal behaviour, otherwise it cannot accurately be compared to TNT using heat of detonation and the results will not be accurate. -15- VecTor-Blast User’s Manual 5 Example An example is provided with a step by step procedure to help a new user become more familiar with VecTor-Blast. The pressure-time history is found at the centre point of the roof of a 20 m long by 30 m wide by 10 m high structure from 100 kg of Compound B detonating at the following location: x=15 m, y=30 m, and z=15 m. 1. Double click the VecTor-Blast.exe file 2. Select the Loading/Blast Parameters menu to bring up the Blast Load Parameters dialog box and enter the information as shown in Figure 9. Figure 9 Example Blast Load Parameters dialog box. -16- VecTor-Blast User’s Manual 3. Click OK. 4. Note that a summary of the entered input parameters as well as the equivalent TNT mass, appear in the top left grey rectangle as shown in Figure 10. Figure 10 Example view window with blast load parameters. 5. Select the Structure/Building menu to bring up the Building Details dialog and enter the building dimensions as shown in Figure 11. -17- VecTor-Blast User’s Manual Figure 11 Example Building Details dialog box. 6. Click Ok. The structure appears with dimensions as shown in Figure 12. Figure 12 Example view window with the structure. -18- VecTor-Blast User’s Manual 7. Select the Analysis/Blast Location menu to bring up the Blast Location dialog box and enter the blast location dimensions as shown in Figure 13. Figure 13 Example Blast Location dialog box. 8. Click OK. The blast location is displayed as shown in Figure 14. Figure 14 Example view window with the blast location. -19- VecTor-Blast User’s Manual 9. Select the Blast Pressures/Pressure-Time Profile menu to bring up the Graph Pressure dialog box and enter the location of the centre of the roof as shown in Figure 15. Select ALL so all component pressure-time histories can be seen on the graph. Figure 15 Example Graph Pressure dialog box. 10. Click OK. The graph is displayed as shown in Figure 16. -20- VecTor-Blast User’s Manual Figure 16 Example view with graph. 11. To examine only the positive phase, click the manual scale button to display the Graph Scale dialog box and enter the values shown in Fig. 17. Figure 17 Example Graph Scale dialog box. -21- VecTor-Blast User’s Manual 12. Click OK. The new graph is displayed as shown in Figure 18. Figure 18 Example view with modified graph. 13. The user may want to examine the data file for a more detailed look at the information. Locate the folder in which the VecTor-Blast.exe file is residing and double click on Job.txt. 14. The data file will open and look similar to Figure 19. Only a portion of the data file is displayed here due to its size. 15. To view the pressure-time history at other locations, repeat steps 9 to 12 changing the face and the coordinates of the location. -22- VecTor-Blast User’s Manual Figure 19 Example data file. -23- VecTor-Blast User’s Manual 6 List of Data File Symbols Mach Stem Forms: 1 means yes, 0 means no Point in Mach Stem: 1 means yes, 0 means no Z from Pressure Scaled distance corresponding to incident (side-on) overpressure Z from Impulse Scaled distance corresponding to incident (side-on) impulse alphazxy angle between the incident wave and the analysis point on the structure. z α zxy = tan −1 x2 + y2 alphazx angle between the incident wave and the analysis point on the structure (z-x plane only). z α zx = tan −1 x alphayzx angle between the incident wave and the analysis point on the structure. α zxy alphazy y2 + z2 = tan x −1 angle between the incident wave and the analysis point on the structure (z-y plane only). -24- VecTor-Blast User’s Manual z α zx = tan −1 y Ps+ Incident (side-on) overpressure* Impulse+ Incident (side-on) impulse* Ref. Imp.+ Reflected positive impulse Pr+ Reflected positive overpressure Fict. Pos. Dur. Fictitious positive duration Ref. Pos. Dur. Reflected positive duration Positive Dur. Positive duration Ps- Incident (side-on) underpressure* Pr- Negative reflected underpressure Neg. Rise Time Negative rise time Negative Dur. Negative duration dir The direction of the overpressure relative the positive sign convention *where a diffraction coefficient is used, the pressures and impulses have already been multiplied by the diffraction coefficient -25- VecTor-Blast User’s Manual 7 Error Messages All available error messages are shown here with an explanation of what they mean. These error messages appear if the user has entered invalid information or the calculations cannot proceed because the combined inputs places certain values out of range. Message: Reflected Impulse too high. Out of range of computable scaled distances. Description: The calculated reflected impulse is out of range of available surface burst data. The scaled distance corresponding to the reflected impulse cannot be calculated. 26.6<Ir<30780 kPa-ms/kg1/3 (4.25<Ir<3430 psi-ms/lb1/3) Message: Reflected Pressure out-of-range of computable scaled distances. 12.7<Pr<373000 kPa Description: The calculated reflected pressure is out-of-range of available surface burst data. The scaled distance corresponding to the reflected pressure cannot be calculated. 12.7<Pr<373000 kPa (1.85<Pr<54100 psi) Message No Face Selected Description The user has not chosen a surface on the structure where the pressuretime history will be calculated. Message The point selected is not on the structure. Please make another selection. Description The entered x, y, and z coordinates does not place the analysis point on the structure’s surface. Message: Positive Reflected Scaled Impulse out-of-range of computable scaled distances. 23.63<Ir<24200 (kPa-ms)/kg^(1/3) Negative Pressure-Time history cannot be calculated for this wave component. Description: The calculated reflected impulse is out of range with the available free air burst data. The scaled distance corresponding to the reflected impulse -26- VecTor-Blast User’s Manual cannot be calculated. 23.6<Ir<24200 kPa-ms/kg1/3 (4.46<Ir<4570 psi-ms/lb1/3) Message: Positive Reflected Pressure out-of-range of computable scaled distances. 19.31<Pr<572000 kPa Negative Pressure-Time history cannot be calculated for this wave component. Description: The calculated reflected pressure is out-of-range of available surface burst data. The scaled distance corresponding to the reflected pressure cannot be calculated. 19.31<Pr<572000 kPa (2.8<Pr<83000 psi) Message: Incident Pressure out-of-range. Pressure must be less than 44800 kPa (6500 psi) Description: The dynamic pressure can only be calculated for incident (side-on) overpressures up to 44800 kPa to correspond with available data. Pso<44800 kPa (Pso<6500 psi) Message: Z Outside Range for Surface Burst. 0.12<=Z<=19.8 m/kg^(1/3) Description: The available blast parameters for surface burst only exist for a range of scaled distances. 0.12<Z<19.8 m/kg1/3 (0.3<Z<50 ft/lb1/3) Message: Scaled Height of Charge Outside Range of Available Data. 2.53<=Hc<=17.6 m/kg^(1/3) Change Vertical Charge Height or Charge Weight Description: To calculate mach pressures and impulses, the scaled height of charge must remain with limits of available data. 2.53<Hc<17.6 m/kg1/3 (1<Hc<7 ft/lb1/3) Message: Mach Pressure out-of-range to calculate scaled distance. Description: The calculated mach pressure must be at least 10 kPa in order to calculate the corresponding scaled distance. P>10kPa (P>1.45 psi) Message: Mach Impulse out-of-range to calculate scaled distance Description: The calculated scaled mach impulse must lie in an appropriate range to calculate corresponding scaled distances. 26.5<I<2369 kPa-ms/kg1/3 (3.27<I<264 psi-ms/lb1/3) Message: Z Outside Range for Free Air Burst or Air Burst. -27- VecTor-Blast User’s Manual 0.06<=Z<=11.9 m/kg^(1/3) Description: The available blast parameters for free air burst only exist for a range of scaled distances. 0.06<Z<11.9 m/kg1/3 (0.15<Z<30 ft/lb1/3) Message: Cannot calculate deflection angle. Scaled Distance out of range. Description: In the process of iterating to calculate the angle of deflection, pressures are calculated corresponding to scaled distances. If the scaled distance at one point is out of range, the iteration is forced to stop and the deflection angle can’t be calculated. Message: Could not converge on a deflection angle. Geometry does not lend itself to regular reflection. Incident wave only. Description: This is more of an indication as to what is occurring than an actual error. This simply indicates that the geometry between the blast location and a point on the surface of the structure will not be loaded by a ground reflected wave and only the incident wave will strike the location. -28-