1
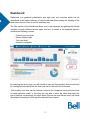
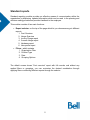
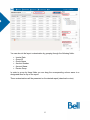
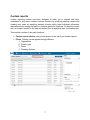
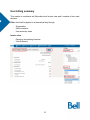
eReporting
User Manual
1
Contents
Dashboard....................................................................................................................... 3
Standard reports ............................................................................................................. 5
Custom reports ................................................................................................................ 7
User billing summary ..................................................................................................... 10
2
Dashboard
Dashboard is a graphical presentation and high level cost overview which can be
considered as an instant reflection of current data and allows seeing the trending of the
data over a period of time in a quick and easy way.
The filter section of the Dashboard allows you to see expenses by applying the filtering
operation through different service types, and as it is shown in the snapshot below it
contains the following controls:
-
Product type cost chart
Device number chart
Total cost chart
Hierarchy navigation
By selecting the device type, you will be able to see the filtered data in distinct color and
by ceasing the selected device the total cost can be observed for all devices.
Total monthly cost chart can be used as a criterion for comparison among the total cost
for each particular month. In this chart you are able to move the slider and select the
part of interval, consequently two other charts (Device cost and Device count) will show
the related information for that specified selected time interval.
3
By going through the hierarchy navigation on the right side of the page, you can drill into
the different organizations and see the details behind the summary. It is required to
mention that by selecting desired organizations all three charts will be updated
subsequently.
4
Standard reports
Standard reporting module provides an effective means of communication within the
organization by displaying updated information which can be used in the planning and
decision making process and provides feedback to the employee.
This module consists of two main functions:
•
•
Report selector: on the top of the page which let you choose among six different
reports
1. Cost Overview
2. Usage Overview
3. Invoice Charge report
4. 3-month Usage report
5. Hardware report
6. User profile report
Filters: which contains
1. Organization Filter
2. Product Type
3. Date
4. Grouping Options
The default screen shows “Cost overview” report with full records, and without any
applied filters or groupings, you can customize the desired combination through
applying filters or selecting different reports through the selector.
5
You can also do the layout customization by grouping through the following fields:
•
•
•
•
•
•
Invoice Date
Group ID
Group Name
Account Number
Account Name
Device Group
In order to group by these fields you can drag the corresponding column name to a
designated area on top of the report.
These customizations will be presented on the desired report (download or view).
6
Custom reports
Custom reporting module has been designed to allow you to interact with data,
understand it and make a better business decision by modifying existing reports and
creating new views by assigning desired columns which meet individual information
requirements and saving the results to address particular situations. So any key contact
can run a report and drill to the data as needed from an analytical user to business user.
This module consists of two main functions:
•
•
Custom report selector: can provide access to the set of pre-created reports
Filters: Filtering can be applied through different
1. Organization
2. Product type
3. Dates
4. Grouping Options
7
Custom report management
Custom report management can be performed through “Manage custom report” by
assigning report Name, Description and Columns.
Steps to create a new custom report:
1. Click on “Manage custom reports” button on the top of the page.
2. Assign Report Name and Description in intended boxes, and click on Save button.
3. By selecting the Report’s name which is now visible on the “Report Table” you
can select required columns among all available columns on the “Column not
assigned” table on the right side of the page, and pressing
button or dragging
the columns to the right panel.
4. Select if you would like to have this report published for your entire company (or
private)
5. The Report will be saved by pressing “Submit” button.
8
To modify an existing custom report, you need to:
1- Click on “Manage custom report” button on the top of the page.
2- Select the Report which you would like to modify.
3- You can add more columns or remove the previously assigned columns by
selecting from each “Column not assigned” and “Column assigned” table on
the right side of the page and transferring the selected columns to the other table
and pressing “Submit” button.
Note: display order of the reports can be changed by dragging and dropping the report
to the new position in the list, and pressing “Update display order” button.
To delete a Custom report, you need to:
1. Click on “Manage custom report” button on the top of the page
2. Select a report you would like to delete
3. Press “Delete” button that appears on the top right of the page.
9
User billing summary
This module is considered as Subscriber-level invoice view and it consists of two main
sections:
Filter: that shall be applied in a hierarchical way through
-
Organization
Service selector
User summary dates
Invoice view:
-
Exporting and printing functions
User Summary
10
User billing summary module works in a hierarchical way. You first pick or search for the
desirable organization by typing its name on search box or searching through the list,
after organization selection one phone numbers shall be selected as a service in
“service selector” and eventually list of invoices for the same client in different months
will be shown in “User summary dates”. By default, the first mobile number will always
be pre loaded.
The selected invoice would be shown in left side of the page and this bill can be
exported and printed out with the help of specific functions buttons at the top of the bill.
By selecting another services or dates the invoice would be updated automatically.
11