1
User's manual for TIMRET:
a micro-computer program for
silviculture investment analysis
W.J.
. "' .
Ondro and
W.
Marshall
Natural Resources
Canada
Ressources naturelles
Canada
Canadian Forest
Service
Service canadien
des forets
TIll' Ca/1adia/1 forest Sen'ice's Nor/J'Wl'sl Regio/1 is resl,ullsi/J/(' for fu/filllllg the fi'deral role ill forestry
research, n'giolla/ devc/opllll'"I, a/1d lec!lII% gy lrallsfer ill A/berla, Saskatc!lewall, Mmlitoba, alld till' Norlhwest
Tf'rritories. The maill obj/'ctin's are rescarch alld regiollal devc/opllll'nt ill supporl of improi'ed forest mallagemelll
for ti,e ecol/omie. social, mId I'lwirollllll'II/alllt'lltiit of all Calladialls. Tlu' Nortl,w/'s/ Regia" also has responsibility
for the impll'mentatioll of fedl'rnl-prol1illcial fon'Stry agm'ment::: wilhill its three prOl,in(('s alld territory.
Regional actil'itie::: are d/rected frolll tilt' Nor/llem Fon'stry C{,lIlre ill [dIllOllloll, Alberla, and liIen'are district
offices ill {'rillce Alberl, Saska/c!wwall, alld Willl/ipeg, Mani/ova. The Northwest Regioll is aliI' of six r{'giolls alld
IlI'o IIa//(mal forestry il/stilli/es of tlte Cmladiall forest Sen.llet', whiclt lias its Ili'adquartl'rs ill Ottawa, Olltario.
Sen.lice calladiell des forNs, n'gioll dll Nord-Oill'st, repn'Sf.'IIte Ie gOllVerlll'mt'1I1 federal CIt Alberta, en
Saskateltell'al/, au Mallitolm e/ da"s II'S Tf'rritoire:; dl/ Nord-OW'sf ('1/ ce qui a trait aI/x recilerches forestieres, a
l'all/bUlSt'mel,1 dll territolrt' l't all trallsfert de It'e/Ill%gie. Cd orgallisllle s"illieressl' Sllr/Ollt it la n'cl/erel,e 1'1 ii
l"allu;IIageme"t dll terrilOlrt' I'll {IIII' d'al1lCliorer J"ambwgemCIII fon'sller afi" que tOilS les Calladiells pllis5en/ ell
profiter £lUX poillts de lllle ('collolllique, social I't ellPjrOlmeml'lllal. l.,e bllreall dc la regioll dll Nord-Ollest est
ega/cmCIII respo"sabl/' de la mise ell {)('!/lW' d('S eli/elites forl'stii'rt'S fMerales-prOl'lIIciales all seill de ces trois
prOIlillces et du lerritoirc COllcalle.
US activites n'giOlIf1/I'� 5011/ genies it parlir dll Celltre de fores/erie dll Nord dOllt Ie bllreall est it Edmolltoll
(AI/lcrta); Oil trOIait' e�a/efllCl/t dl'S bllrl'allx de district iJ PrillCt' AI/'I'rt (Saskalcl!t'WflIl) et a Wimllpeg (Mallitoba).
Ln reSioll dll Nord-Qllesf correspo1ld it /'UIII' dl'S SIX regiolls de Sl'nllCeCOllad,elJ des fOrt!ts, dOllt Ie bureau prillcipal
es/ a Ottawa (011Iorio). (lit' rt'pn>st'llte esafl>me1lt dt'/lx des illstlll/is lIatiOl/allX de forest erie de ce Milllstere.
USER'S MANUAL FOR TIMRET: A
MICRO-COMPUTER PROGRAM FOR
SILVICULTURE INVESTMENT ANALYSIS
W.i. Ondro and W. Marshall
Canadian Forest Service
Northwest Region
Northern Forestry Centre
1995
© Minister of Supply and Services Canada 1995
Catalogue No. Fo46-236/1995E
ISBN 0-662-23068-X
This publication is available at no charge from:
Natural Resources Canada
Canadian Forest Service
Northwest Region
Northern Forestry Centre
5320 - 122 Street
Edmonton, Alberta T6H 355
A microfiche edition of this publication may be purchased from:
Micromedia Ltd.
Place du Portage
165, H6tel-de-Ville
Hull, Quebec J8X 3X2
CANADIAN CATALOGUING IN PUBLICATION DATA
Ondro, W.J.
User's manual for TIM RET:
investment analysis
a
micro-computer program for silviculture
Includes an abstract in French.
Includes bibliographical references.
ISBN 0-662-23068-X
Cat. no. Fo46-236/1995E
1. Timber - Economic aspects - Computer programs. 2. Forest management
Economic aspects - Computer programs. 3. Silvicultural systems - Economic
aspects - Computer programs. I. Marshall, W. (Wade) II. Northern Forestry
Centre (Canada). III. Title. IV. Title: A micro-computer program for silvicultural
investment analysis.
50431.5066 1995
*
ii
634.9'2'0285
C95-980072-7
This report has beell prill ted all Canadian recycled paper.
Ondro, W.J.; W. Marshall. 1995. User's manual for TIMRET: a micro-computer
program for silviculture investment analysis. Nat. Resour. Can., Can.
For. Serv., Northwest Reg., North. For. Cent., Edmonton, Alberta.
ABSTRACT
This manual describes the usage of a micro-computer software package,
TIMRET (TIMber RETurns), which was developed to aid the forest manager in
evaluating profitability of silvicultural investments. Returns from a range of invest
ment scenarios, e.g. , forest renewal, cleaning, spacing, thinning, release, fertiliza
tion, and tree improvements, can be calculated and compared by using any of the
following criteria: 1) internal rate of return, 2) present net worth, 3) profitability
. TIMRET calculates returns from treatment costs,
index, and 4) benefit/cost ratio
and benefits such as increased yield, size premiums, logging cost reductions, and
product from trees removed by treatment. The output of the financial analysis can
be presented in a tabular or graphical form. Examples of these inputs and examples
of TIMRET calculations are provided.
RESUME
Ce manuel decrit I'utilisation du programme d'ordinateur TIMRET (TIMber
RETurns), con\,u poill aider Ie ge�tiunnaire forestier a evaluer la productivite des
investissements en sylviculture. Des rendements a partir de plusieurs scenarios,
comme Ie renouvellement forestier, Ie degagement, l'espacement, l'eelaircissement,
les coupes de degagement, la fertilisation ainsi que l' amelioration des arbres peu
vent etre ainsi calcules et compares a l'aide de l'un ou l'autre des criteres suivants:
1) Ie tau x interne de rendement, 2) la valeur nette actuelle, 3) I'index de
rentabilite, et4) Ie rapport benefice/coUt. TIMRET calcule Ie rendement a partir des
couts de traitement et les benefices tels Ie rendement accru, I'accroissement de la
dimension, la reduction des couts d'abattage et les produits tires des arbres sacrifies
par Ie traitement
. Le produit de I'analyse finale peut etre presente sous forme de
graphiques au de tableaux. Vous y trouverez des exemples de calculs prepares par
TIMRET.
iii
iv
CONTENTS
INTRODUCTION . . .
1
STARTING TIMRET .
1
TERMINOLOGY
1
FINANCIAL ANALYSES
Management Scenario Analysis . ..
Marginal Analysis .. . . . .. . . .
Starting and Ending Analysis Cases
Year Markers .
2
2
2
3
3
ENTERING DATA
Title .. . . . . .
Benefits/Costs .
Timing of Treatments
Economic Parameters
3
3
3
3
3
EDITING DATA .
Typeover .
Edit Mode
3
3
3
TREATMENT
Description
Present Value
First Year
Last Year
Step Year
4
4
4
4
4
4
ECONOMIC PARAMETERS
Discount Rates
Inflation Rate
Discounting
Cash Flows
4
4
4
4
4
ACTIVITY LIST
5
FINANCIAL ANALYSIS RESULTS
Tabular Presentation .
Internal Rate of Return
Present Net Worth
Benefit/Cost Ratio .'
Profitability Index
Graphic Output ... . .
5
5
5
5
5
5
5
SAVE/LOAD/DELETE
Saving the Current Case .
Retrieving a Case . . . . . . . . . .
6
6
6
ADVICE WHEN USING TIMRET . .. . .. .
Distinguishing Cases from Worksheets
Making Backups
Verifying Inputs .... .. . .. ... .
6
6
6
6
v
TROUBLE-SHOOTING GUIDE
Too Many Cash Flows "
Long Investment Periods
7
7
7
GENERAL INFORMATION
7
ACKNOWLEDGMENT
7
APPENDIXES
1.
TIMRET Quick Reference
8
2.
Suggested Readings
9
'"
FIGURES
1.
Output from TIMRET showing profitability analysis of lodgepole
pine thinning by present net worth . . . . . . . . . . . . . . . . .
5
Output from TIMRET showing profitability analysis of lodgepole
pine thinning by benefit/cost ratio . . . . . . . . . . . . . . . . . . .
5
Output from TIMRET showing profitability analysis of lodgepole
pine thinning by profitability index . . . . . . . . . . . . . . . . .
6
.
2.
3.
.
TABLES
1.
2.
Screen display of TIMRET financial information on treatment
benefit/ cost and stand age at activity or harvest . . . .
2
Screen display of TIMRET financial returns at rotation
2
NOTE
The exclusion of certain manufactured products does not necessarily imply
disapproval nor does the mention of other products necessarily
imply endorsement by Natural Resources Canada.
vi
INTRODUCTION
In today's increasingly complex decision
as cost and benefits, into individual cases, that can
environment, the forest manager needs a simple,
be saved on disk, retrieved, and modified for
quick, user-friendly, and flexible financial analysis
further analysis. With TIMRET, the analyst can
software to help make decisions about possible
compute cash flow from investments before income
forest management scenarios. TIMRET, a recently
developed forestry investment analysis software
taxes for six discount rates. Summaries of result can
be displayed and viewed on the screen and printed.
package, is a tool developed by the authors that is
TIMRET can calculate financial returns by hectare,
intended to meet this need. TIMRET, an acronym
stand, or whole forest. Each case is defined by a
be run on any IBM-compatible personal computer
revenues are generated from these steps, and are
that has a 3.1 or higher version of the DOS-based
subsequently used to calculate financial returns.
for TIMber RETurns, is a software package that can
series of steps that specify costs and revenues. Net
Lotus 1-2-3 spreadsheet package.
Inputs to the program specify discount rates
and management scenarios such as forest fertiliza
This manual is organized in sections. The first
section explainS how to start up the TIMRET disk
tion, spacing, thinning, release, tree improvement,
ette. The following sections explain terminology
and wetland drainage. The program can calculate
used, the type of financial analyses TIMRET can be
returns for any management practice that brings
improved timber benefits such as increased stem
used for, and entering and editing of data. Sub
sequent sections describe the presentation (of
wood yields, log size premiums, logging cost
red uctions from harvesting bigger trees, and
results) of the financial analysis (i.e., tabular and
products from trees removed by treatments. The
this manual, advice to TIMRET users and general
analyst can file selected steps (computer runs), such
graphical outputs). In the concluding sections of
information are given.
STARTING TIMRET
To start TIMRET, insert the TIMRET floppy
diskette into your drivel The program can be run
on a 286, 386, or 486 SX or OX IBM-compatible
personal computer with Lotus 1-2-3 version 3.1+
installed. Ensure that the directory containing
Type a:tima [enter] [enter] [enter], if your drive
is "a", or b:tima [enter] [enter] [enter], if your drive
is "b". Upon execution, a title screen will appear for
a short time after which the preloaded example will
appear (Tables 1 and 2).
Lotus 1-2-3 is included in the Path statement in the
Autoexec.bat file (path=C:\ 123R3).
TERMINOLOGY
Revenues (benefit sl-appear as positive number
on display and printouts.
Costs-appear as negative numbers on display and
printouts.
1 TIMRET diskette can be obtained from the senior author.
Timber yield and depletion---€xpressed in dollars
per hectare ($/ha). All timber volumes are con
verted to m3/ha for computing volumes for a
stand or forest. The volumes are multiplied by
market value of stumpage
[in m3 or foot board
measure (fbm)] and entered.
Table 1.
Screen display of TIMRET financial infonnation on treatment benefit/cost and stand age at
activity or harvest
Treatment ($/ha)
Benefit
Cost
Benefit/ cost item
Treatment cost
Trees removed by treatment
Market value of increased yield
Log size premium
Conventional logging cost reduction'
n/ab
220
680
65
880
-400
n/a
n/a
n/a
n/a
Stand age at activity or harvest (year)
Last
Step'
First
25
25
60
60
60
1
1
1
1
1
25
25
60
60
60
8%
10%
-70.09
0.82
-0.18
-122.18
0.69
-0.31
a Denotes the number of years between first and last activity.
b nfa = not applicable.
C
Denotes the difference in logging cost between untreated and treated stands.
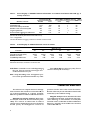
Table 2.
Screen display of TIMRET financial returns at rotation
Criterion
3%
4%
Present net worth ($/ha)
Benefit/cost ratio
Pro fitability index ratio
397.50
1.99
0.99
231.80
1.58
0.58
Discount rate
6%
5%
114.60
1.29
0.29
31.42
1.08
0.08
Note: specified inflation rate is 0%.
Internal rate of return (%) is 6.49 for 3--10% discount rate.
Cash flows-assumed to occur at the beginning of
the year. Costs or revenues occurring in Year 1
are discounted for one year.
Press <RETURN> key after every entry. Cursor
control is done by the arrow keys.
Data Steps describing forest management prac
tices can be specified and entered in any order.
-
FINANCIAL ANALYSES
The software can compute returns for manage
ment scenarios that include several treatments, or
can evaluate profitability of a specific treatment,
either for a portion of a rotation or the whole rotation.
Management Scenario Analysis. Most finan
cial analyses are done to find out treatment profit
ability for a stand or an entire forest. In order to
analyze various management scenarios, the analyst
should specify all management activities or
2
practices from the start to the end of the rotation.
Results of the analyses will reflect the returns for the
treatment(s) costs and their timing.
Marginal Analysis. These determine the effect
of an additional treatment, such as better site prepa
ration, thinning, or more fertilizer on wood yield.
Financial returns are based on cash-flow differences
between a stand that received the extra treatment
and one that did not.
Starting and Ending Analysis Cases. A typical
forest investment starts with the establishment of a
new stand or forest, but TIMRET can begin or end
at any specified time. Often, the starting point is a
major expenditure or treatment. The analyst needs
to identify the first and last investment activity.
Beginning activities include site clearing, site
preparation, natural regeneration, and planting;
some intermediate treatments such as cleaning,
spacing, thinning, or fertilizing can be beginning
activities for other investments. Ending activities
are usually final harvests and timber disposal.
Year Markers. TIMRET sets the base year for
the investment at the first specified activity. All cash
flows are discounted back to this. If an earlier base
year is desired, add a null activity to set it, such as
(C/B 0).
�
ENTERING DATA
An analysis requires four data groups that must
be entered to identify and define a case. The data
entry order is arbitrary. To add an entry, move to an
empty row of the editing area and type in informa
tion for each of the following:
Title. It contains description of cost or benefit
To enter a title, move cursor to the left-most column
(A) and type it.
Benefits/Costs. It describes and gives numeri
cal values to treatment costs, yields, products, and
prices. To enter a benefit/cost, type the negative
cost value into the cost column (B) or the positive
benefit value into the benefit column (C).
TIming of Treatments. After entering descrip
tion and numerical values of the cost or benefit, the
timing of the treatment must be specified. The first
year of the treatment is entered in the first-year
column (D), and the last year of the treatment is
entered in the last-year column (F). The number of
years between treatments is specified in the step
year column (E).
Economic Parameters. These are the discount
rates and inflation rate. Default values are provided
upon initial execution of T IMRET macro. To modify
the economic parameters, execute the Calculate
macro (Alt-C) to get the Calculate menu. Choose
Inflation to modify the inflation rate or Discount
to modify one of the discount rates. The new values
are entered at the top of the screen. To restore
default discount rates, execute the Calculate macro,
then choose Discount, then Default.
EDITING DATA
Data-error checking is performed when calcu
lating financial criteria. If an error occurs or infor
mation simply requires change, editing will be
needed. There are two ways to edit data.
One way of editing is to typeover. Move the
cursor over the cell that needs to be changed and
type in an new value. This is done while in the
default typeover mode, known as a READY mode.
(See mode indicator at top right comer of screen).
The other way to correct data is through the
EDIT mode. This mode is useful when the analyst
wishes to avoid retyping the contents of the entire
cell. To edit data using this method, move the cursor
over the cell that requires editing and press the F2
key. (See mode indicator change to EDIT ). T he
current value of the cell will appear at the top of the
screen for editing. Use arrow keys to remove
characters, and backspace or delete keys to delete
characters. All other character keystrokes will cause
that particular character to be inserted at the
position of the cursor. Press Enter when satisfied,
and the mode will once again be in the READY
mode. Press Esc any time during editing to abort
the edit.
3
TREATMENT
Treatment can be any forestry activity or prac
tice such as planting, thinning, site preparation, or
forest renewal. These activities that are expressed in
costs and benefits for the investment. The speed and
reliability of the analysis depends on how activities
are entered and specified. Erroneous specification
of activities will produce wrong analyses.
TIMRET checks for and alerts the user to obvi
ous entry errors, such as a positive cost or negative
benefit, but cannot check for treatments cost. For
example, $400/ha for thinning is as valid as $40/ha
in TIMRET.
The analyst can enter up to 100 transactions per
case.
Description. This is a 30-character description
of the benefit/cost being entered, such as market
value of increased yield. Enter a description that
defines the entire investment benefit/cost and
return flow pattern.
Present Value ($/ha). Enter this value of
benefits/costs in units of dollars per hectare ($/ha).
A cost is entered as a negative number, a benefit as
a positive number. Because TIMRET allows
unrestricted input for the description of the
benefit/cost, it cannot determine whether a
transaction should be a cost or a benefit; it is there
fore important to enter the present value with the
correct sign. (The program does check for this type
of error.)
First Year. This means first year relative to Year
0, the year in which the benefit/cost occurs. This is
a required input for all benefits/costs analyses.
Last Year. This means last year relative to Year
O. The actual number for the last year must be equal
to or greater than that in the first year. If the last year
is equal to the first year, the benefits and costs
incurred in the latter will also apply to the former
year.
Step Year. This is the number of years between
each occurrence of a benefit/cost. This is entered
only if the benefit/cost occurs more than once. If the
benefit/cost occurs in a single year, the field should
be set to 1.
First, last, and step years are expressed as stand
age at renewal, treatment, and harvest. TIMRET
establishes the base year as the earliest year (the
year with the lowest number). Length of investment
(the difference between the first and last year), can
not exceed 200 years. (See trouble-shooting guide if
investment period exceeds 200 years.)
ECONOMIC PARAMETERS
Discount rates are annual rates in percent and
can be real (without inflation) or nominal (with
inflation) values.
Inflation rate is the average annual rate in per
cent expected over the life of the investment. Use an
inflation rate of 0% for analyses done in real or
constant dollar terms.
For c1iscounting, all cash flows are treated as if
they occur at the beginning of the year. Costs and
4
revenues that occur in Year 1 are therefore dis
counted for one year (to the beginning of Year 0).
Each activity is expanded into one or more cash
flows. A cost or revenue amount is calculated for
the first year and repeated every step year until the
last year. If the first year is the same as the last year,
only one cash flow is computed. No cash flows will
be computed for years beyond the last specified for
the transaction. The extended cash flow amount is
computed where N is the number of years from the
base year of the activity.
ACTIVITY LIST
A list of benefit/cost activities is displayed at
all times except when displaying a graph or calcu
lating financial criteria. Several activities are dis
played at once, but the user can scroll through all of
them by using the arrow keys and the Page Up and
Page Down keys. A full screen activity list can be
obtained by executing the Window macro (Alt-W)
to eliminate the results window. Simply re-execute
the Window macro to restore the results window.
A complete activity list can be printed by
executing the Print macro (Alt-P), choosing Text
from the menu, and typing in the number of lines
that need to be printed.
FINANCIAL ANALYSIS RESULTS
Tabular Presentation. Financial returns are
computed after executing the Calculate macro
(Alt-C) and selecting the Calculate option. Within a
few seconds, the results will be displayed in the
financial analysis section of the screen.
The four financial criteria are shown for the six
discount rates selected.
Internal Rate of Return (IRR) is the discount
rate that equates discounted costs and revenues.
IRR is the return on investment if all immediate
revenues are reinvested in the project. IRR is not
affected by the discount rate. If the IRR can not be
determined then ERR will be shown, indicating an
error.
Present Net Worth (PNW) is discounted bene
fits less discounted costs. A positive value indicates
return exceeding the discount rate.
Benefit/Cost Ratio (B/C) is the present value of
the benefits divided by the present value of the
costs. A value greater than 1.0 indicates that the
discounted benefits exceed costs.
Profitability Index (PI) is the present net worth
divided by treatment cost. It is used to rank invest
ment in order of profitability.
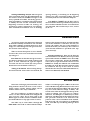
Graphical Output. The built-in graphic capa
bility of the Lotus 1-2-3 version 3.1 TIMRET package
allows instantaneous on-screen display of calcu
lated financial criteria and a printed copy (Figs.
1-3). This feature is also available on other financial
analysis software packages.
To display a graph on the screen, execute the
Graph macro (Alt-G), choose the financial criteria
to graph, and then choose the style of graph. Hit any
key to return to editing. To print the graph most
recently plotted, execute the Print macro (Alt-P)
and choose Current graph from the menu.
2.5 ---- ---- ----
500 -..
o
�
e
�
"
"
g
.,
�
•
c
1
E
•
•
�
..
-100 --.200 -3
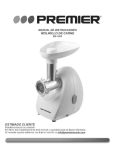
Figure 1.
•
---_.
5
6
Discount rate (%)
8
10
Output from TIMRET showing profit
ability analysis of lodgepole pine thin
ning by present net worth.
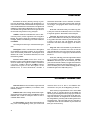
Discount rate (%l
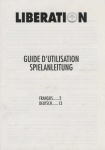
Figure 2.
Output from T IMRET showing profit
ability analysis of lodgepole pine thin
ning by benefit/cost ratio.
5
--- --
1.5
-0.5
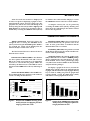
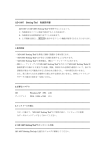
Figure"3.
3
4
-S
6
Discount rate (%)
--
•
10
Output from TIMRET showing profit
ability analysis of lodgepole pine thin
ning by profitability index.
SAVEILOAD DELETE
TIMRET allows the analyst to save and load
cases from a data disk. To save or load cases using
a floppy disk, it is a good idea to first change the
working directory to the floppy drive. This is
accomplished by executing the File macro (AIt-F)
and choOSing Directory from the menu. At the
prompt, enter in the new working directory to be
the path of one of the floppy disks (e.g., A:B:).
Saving the Current Case. Execute the File
macro (Alt-F), choose Save from the menu, and type
a file name that identifies the case. If this file already
exists, the analyst will be presented with another
menu with three options: Cancel, Replace, and
Backup. Choose Cancel to abort the save operation,
Replace to write over the old file, and Backup if the
old file is still needed.
Retrieving a Case. Execute the File macro (AIt
F), choose Retrieve from the menu, and type in the
file name of the case to be retrieved.
ADVICE WHEN USING TIMRET
Distinguishing Cases from Worksheets. There
is no way to distingUish a saved TlMRET case from
a regular Lotus worksheet. To avoid error and con
fusion, save all TIMRET cases on a separate data
disk or in a separate directory.
Making Backups. As a precaution, one should
make a backup copy of the TIMRET disks upon
receipt for safe storage. These programs are not
copy-protected or copyrighted. Do not use the
original program and data disks except to make
additional copies
.
6
Always Verif y Inputs. Look out for some of the
following cornmon errors that can be made when
using this program:
•
important treatments left out, espeCially costs.
•
errors in data.
•
number of years exceeds 200.
•
relative year values are not correctly calculated.
TROUBLE-SHOOTING GUIDE
Too Many Cash Flows. Long investment cases
can result in more than 100 cash flows, a number
that must be reduced to conduct an analysis. An
excessive number of cash flows can occur by includ
ing several annual costs such as management fees
and leases in the transactions. One solution is to
combine similar activities within a year, such as all
activities with the same tax treatment. Another op
tion is to combine costs or revenues spread over
several years into fewer payments. For example,
instead of using an annual management fee, apply
a double amount every second year. This will have
only a minor effect on the outcome.
Long Investment Periods. TiMRET does not
accept an investment period if it extends beyond
200 years. Although this is unlikely to occur, one
solution would be to reduce arbitrarily the invest
ment length to 200 years by compressing cash flows
into a shorter period. The present value of costs or
revenues that occur in the distant future is very
small, so the effect on the outcome is small. A dollar
received in 200 years is worth less than 0.1 cents
today after discounting at 5%.
GENERAL INFORMATION
Appendix 1 is a quick reference guide that can
help in this software operation. Suggestions for
further reading are listed in Appendix 2.
User comments are welcome. Contact:
W.J.Ondro
Natural Resources Canada
Canadian Forest Service, Northwest Region
Northern Forestry Centre
5320 - 122 Street
Edmonton, Alberta T6H 3S5
(403) 435-7210
Neither Natural Resources Canada nor the
authors warrant this program in any way. Natural
Resources Canada will not be held liable for dam
ages of any kind that result from the use of this
software. All efforts have been taken to ensure that
this software performs as described.
TiMRET is within the public domain and can
be copied without restriction. Trade names are
mentioned for information purposes only.
ACKNOWLEDGMENT
The authors thank D. MacIsaac, Natural
Resources Canada, Canadian Forest Service,
Edmonton, Alberta, for providing useful review
comments.
7
APPENDIX 1
TIMRET QUICK REFERENCE
The Basics of Using TIM RET
TIMRET is a Lotus 1-2-3 worksheet equipped
with a number of macros to help the user work
efficiently. All macros are executed by using an
Alt-<letter key> combination. In order to run a
macro, the AIt key must be held down while the
letter key is pressed. All macros described below
can also be accessed through the use of a main menu
Alt-F (File)
This macro is used to bring a case into memory
from disk or to save the current edited data to disk.
Using this macro, the user can save the current case
to disk, retrieve a case from disk into memory, or
change the working directory.Only files previously
saved with TIMRET can be loaded in without error.
(Alt-M).
Alt-G (Graph)
The macros also take advantage of Lotus-style
menus that appear at the top of the screen. To use a
Lotus menu, move the highlighted cursor over the
menu choice and hit the Enter key or simply type
the first letter of the menu choice.
This macro allows the user to graph PNW, BIC,
or PI versus the discount rate. The macro will
prompt the user for the type of data and style of
graph desired. Once chosen, the graph will be
displayed on the screen. Hit any key to return
editing.
To edit blocks of data in the editing area, use the
Lotus 1-2-3 commands of Copy, Move, and Range
Erase. Do not use Worksheet Delete Row or Work
sheet Insert Row.Other useful features available in
Lotus 1-2-3 are the F2 key (edit an entry), and the
FlO key (redisplay graph). Refer to your Lotus 1-2-3
manual for more information on these and other
editing commands.
The TIM RET Macros
Alt-C (Calculate)
When the user adds, deletes, or edits new data,
the results in the bottom window will not change.
In order to see the results of changes made, this
macro must be used.
8
Alt-P (Print)
This macro is used for printing either the edited
data and results or a graph of one of the economic
statistics. Once the user has specified what to print,
the macro will pause and tell the user to ready the
printer. Once the printer is ready, the user should
hit a key to send the selected output to the printer.
Alt-W (Window)
The economic results normally appear in a win
dow at the bottom of the screen. If full screen editing
is desired, execute this macro eliminate the window.
Simply execute the macro again to reestablish the
window.
Alt-X (eXit)
Exits the user from TIMRET as well as Lotus
1-2-3. Be sure to save data with AIt-F before exiting.
APPENDIX 2
SUGGESTED READINGS
Anderson, F.J. 1979. Ontario reforestation policy benefits and
Alemdag, 1.5.; Honer, T.G. 1973. Relationships between breast
height and stump diameter for eleven tree species from
eastern Canada. Environ. Can., Can. For. Serv., For.
Manage. Inst., Ottawa, Ontario. Inf. Rep. FMR-X-149.
Brumelle, S.L.; Carley, J,S.; Vertinsky, I.B.; Wehrung, D.A. 1988.
Evaluating silvicultural investments:
Hawkins, c.J.; Pearce, D.W. 1971. Capital investment appraisal.
The MacMillan Press Ltd., London, U.K.
costs. Can. Public Policy 3(1):336--347.
an analytical
framework. For. Econ. Policy Anal. Res. Unit, Univ. B.C.,
Vancouver, British Columbia, Work. Pap. 116.
Hannula, 0. 1971. The effect of average stand diameter on tree
length logging cost. Pulp Pap. Mag. Can. 72(2):96--100.
Heaps, T.; Pratt, B. 1988. The social discount rate for silvicultural
investments. B.c. Min. For., Victoria, British Columbia and
B.C. For. Res. Dev. Agreement Rep. 071.
Honer, T.G. 1967. Standard volume tables and merchantable
conversion factors for the commercial tree species of central
Buongiorno, J.; Gilless, J.K. 1987. Forest management and
economics. MacMillan Publishing Company Ltd., New
and eastern Canada. Can. Dep. For. Rural Dev., For., Inf.
Rep. FMR-X-S.
York, New York.
Johnstone, W.o. 1976. Variable-density yield tables for natural
Cassier, G.L.; Anderson, B.L.; Aplin, R.D. 1984. Capital
investment analysis using discounted cash flows. Grid
stands of lodgepole pine in Alberta. Fish. Environ. Can.,
Can. For. Serv., Ottawa, Ontario. For. Tech. Rep. 20.
Publishing Inc., Columbus, Ohio.
Fraser, T.; Tustin, J.R.; Szumidlo, Z. 1977. Financial evaluation of
forestry projects. New Zealand Forest Service, Wellington,
New Zealand. Inf. Ser. 75.
Gittinger, J.P. 1982. Economic analysis of agricultural projects.
2nd edition. The John Hopkins University Press, Baltimore,
Maryland.
Gregerson, H.M.; Contreras, AH. 1979. Economic analysis of
forestry projects. U.N. Food Agric. Org., Rome, Italy. For.
Ondro, W.J.; Constantino, L.F. 1990. Financial returns from
fertilizing 70-year-old lodgepole pine near Hinton, Alberta.
For. Chron. 66(3),287-292.
Row, c.; Kaiser, H.P.; Sessions, J. 1981. Discount rate for long
term forest servict� investments. J. For. 179(6):367-369.
Sudgen, R.; Williams, A.H. 1978. Principles of practical
cost-benefit analysis. Oxford University Press, Oxford,
U.K.
Pap. 17.
Vasievich, J.M.; Frebis, R.; Wiethe, RW. 1984. QUICK SILVER.
Gunter, J.E.; Haney, H.L. 1984. Essentials of forest investment
The forestry investment analysis program, Version 2.0 Pc.
analysis. Oregon State Univ. Book Stores Inc., Corvallis,
U.s. Dep. Agric., For. Serv., Southeast. Cent. For. Econ. Res.,
Oregon.
Triangle Park, North Carolina.
9