1
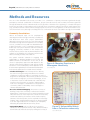
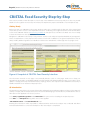
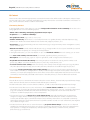
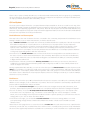
CRiSTAL Food Security 2.0 User’s Manual
Community-based Risk Screening Tool – Adaptation and Livelihoods
Focus on Food System Resilience
Page 2 | CRiSTAL Food Security 2.0 User’s Manual
© 2014 The International Institute for Sustainable Development
Published by the International Institute for Sustainable Development.
The International Institute for Sustainable Development (IISD) contributes to sustainable development by advancing
policy recommendations on international trade and investment, economic policy, climate change and energy, and
management of natural and social capital, as well as the enabling role of communication technologies in these areas.
We report on international negotiations and disseminate knowledge gained through collaborative projects, resulting
in more rigorous research, capacity building in developing countries, better networks spanning the North and the
South, and better global connections among researchers, practitioners, citizens and policy-makers.
IISD’s vision is better living for all—sustainably; its mission is to champion innovation, enabling societies to live
sustainably. IISD is registered as a charitable organization in Canada and has 501(c)(3) status in the United
States. IISD receives core operating support from the Government of Canada, provided through the International
Development Research Centre (IDRC), from the Danish Ministry of Foreign Affairs and from the Province of
Manitoba. The Institute receives project funding from numerous governments inside and outside Canada, United
Nations agencies, foundations and the private sector.
This document is an output from a project funded by the U.K. Department for
International Development (DFID) and the Netherlands Directorate-General for
International Cooperation (DGIS) for the benefit of developing countries. However, the
views expressed and information contained in it are not necessarily those of or endorsed
by DFID, DGIS or the entities managing the delivery of the Climate and Development
Knowledge Network, which can accept no responsibility or liability for such views,
completeness or accuracy of the information or for any reliance placed on them.
International Institute for Sustainable Development
Head Office: 161 Portage Avenue East, 6th Floor, Winnipeg, Manitoba, Canada R3B 0Y4
Tel: +1 (204) 958-7700 | Fax: +1 (204) 958-7710 | Web site: www.iisd.org
PHOTO CREDITS
Cover: iStockphoto
Page 10: Marius Keller, IISD
Back cover: Andrea Rivera Sosa
Page 3 | CRiSTAL Food Security 2.0 User’s Manual
Contents
Introduction4
Concepts5
Goals and Structure
8
Methods and Resources
10
Community Consultations
10
Other Sources of Information
11
Required Resources
11
CRiSTAL Food Security Step-by-Step
13
Getting Ready
13
A) Introduction
13
B) Context
14
Community Context 14
Climate Context
14
C) Food System
16
Food Utilization and Consumption
16
Food Access
16
Food Availability
17
Supporting Resources and Services
17
Supporting Organizations and Policies
18
D) Resilience Analysis 18
Resilience of Food Utilization and Consumption
19
Resilience of Food Access
19
Resilience of Food Availability
19
Resilience of Supporting Resources and Services
19
Resilience of Supporting Organizations and Policies
20
E) Indicator Selection
20
F) Reports
21
Additional Resources
22
References23
Page 4 | CRiSTAL Food Security 2.0 User’s Manual
Introduction
Climate variability and change affect both natural and human systems, altering the productivity, diversity and
functions of many ecosystems and livelihoods around the world. Such impacts can affect the food security of
vulnerable communities in multiple ways. For example, food production can be directly affected by increasing
temperatures, changing rainfall patterns and climate extremes. People’s ability to absorb food can be compromised
by water-borne diseases—the spread of which may be facilitated by extreme rainfall or drought. Food access may
be limited by various climate impacts on people’s incomes and on food prices. Climate hazards are also likely to
increase the instability of food availability, access and utilization.
Although climate variables may not always be the most important drivers of food insecurity at the local level, they
can undoubtedly put the food security of communities at risk. Given the variety of potential direct and indirect
impacts, actions to reduce climate risks to food security should not exclusively focus on making food production
more resilient. They should also consider possible entry points for resilience actions within the entire food system,
and risks to that system, that allow communities to access sufficient, safe and nutritious food. Only such a holistic
approach can help identify the most effective and efficient actions to ensure food security in the context of climate
shocks and stresses.
However, local decision-makers can easily be overwhelmed by the complexity of food systems and of the potential
climate impacts on their key elements and interlinkages. There is thus a need for a tool to systematically assess the
risks to the key factors that underpin food security posed by climate variability and change. This will help to develop
actions that strengthen the climate resilience of food systems and to identify indicators that measure changes in
resilience over time. CRiSTAL Food Security, a specialized version of the Community-based Risk Screening Tool –
Adaptation and Livelihoods (CRiSTAL), seeks to address this gap.
Box 1: CRiSTAL
The original CRiSTAL tool was developed by a group of four international non-governmental
organizations in response to the outcomes of the first phase of the Livelihoods and Climate Change
Initiative, which demonstrated how ecosystem management and restoration and/or sustainable
livelihoods projects contribute to risk reduction and climate change adaptation. Recognizing this
potential, project planners and managers began asking how they could systematically integrate
risk reduction and climate change adaptation into their work. CRiSTAL was developed to respond
to this need. Launched in 2007, it has since been applied in over 20 countries in Asia, Africa and
the Americas by various institutions and development professionals. Between 2010 and 2012 a
completely revised version of CRiSTAL was developed based on extensive user experience and
feedback. More information is available on www.iisd.org/cristaltool.
Page 5 | CRiSTAL Food Security 2.0 User’s Manual
Concepts
The CRiSTAL Food Security tool adopts a food systems and resilience approach in order to understand and reduce
the risks that climate variability and change pose to community food security. This section illustrates the conceptual
framework that gives the tool its analytical foundation and provides definitions for a number of key terms.
Food security exists when all people, at all times, have physical and economic access to sufficient, safe and nutritious
food that meets their dietary needs and food preferences for an active and healthy life (World Food Summit, 1996).
This definition comprises four dimensions: food availability, access, utilization and stability (Schmidhuber & Tubiello,
2007). Other definitions of food security may be used in specific countries or communities of practice.
Food systems describe the processes, required inputs and generated outputs involved in feeding a population.
Understanding food systems is important to understanding how food security can or cannot be achieved, particularly
at the local level. The CRiSTAL Food Security analysis is based on a conceptual framework for food systems proposed
by Tyler et al. (2013) (see Figure 1). This framework, which has the form of a spinwheel, puts household food security
at its core. The analysis starts in the centre by looking at food utilization—that is, the ability of people to consume
and benefit from food, which depends on the diversity and nutritional value of food, health and hygiene aspects, as
well as the social values and practices that shape food consumption.
From there, one can look at food access strategies, including how households gain access to food through alternative
livelihood strategies. Food access options include subsistence production, purchase, barter and food aid. The third
ring describes the processes that ensure food availability such as production, processing, distribution, storage and
trading. The two outer rings present the resources and services that support food production and the organizations
and policies that influence food availability, access and utilization. Food stability is considered a cross-cutting theme
that is analyzed in the context of each spinwheel ring.
2. Food
Access
Purchase
i
od
Fo &
on
Food
Co
Production
E
m
& mu
M nic
a rk a tio
y
on
e tin n
re &
t ati
ti
r
o
g
p
Trans
ca
u
Fo
Ed
& Mod Pri
stic
e
c
m
ark es
Do ety
Foreign
et s
Saf
Relations
Info
rmat
io n
dA
Fo o
He
alt
h
)
n
W
Wa ater &
ste
Infr.
tio
me
-Livelihood
Income
-Remittances
-Safety Net
-Credit
ne
rg
y
ge a ti
on
uc
co
1.
Household
Food
Utilization
Pa Pro
c k ce s
a gi sin g
ng
Barter
In
Or So
ga ci
niz al
at
i
Ec
o
(W sy
Fo
d
Em
Resp erge
ons ncy
eP
lan
Agriculture
s
Inputs
Re
Te
c
Eq hno
uip lo
Foo
m
d
& M Pr
ark ices
et
s
Trade
Rules
Source: Tyler et al. (2013)
3. Food
Availability
d
P r o ce,
S e l f - ste n
i
s
(S u b
r
pa
P r e ra
Food & Sto
ial
et
anc s
af tu
Fin rvice
d S cul
Se
o
Fo gri
A
&
arch t
Rese opmen
l
Deve
Figure 1:
Community
Food System
Framework
4. Supporting
ces & Services
Resour
Extension
ice
Services
erv
c S rs
bli ide
Pu rov
ystems
P
Ecos and)
(L
s
s
on
em
st r)
tion
e
ibu
at
str il
Di eta
od & R
r s
ste Plan
a
s
Di very
co
&
gy nt
e
5. Supporting
nizations & Policies
Orga
Page 6 | CRiSTAL Food Security 2.0 User’s Manual
Climate risk is defined as the probability of harmful consequences or expected losses resulting from the interaction
of a climate hazard with exposure and vulnerable conditions. Climate hazards include potentially damaging hydrometeorological events or trends such as storms, floods, droughts or the steady increase of temperatures over several
years and decades. Exposure refers to the presence of people and assets in climate hazard-prone areas. Vulnerability
is defined as susceptibility to harm and is a function of sensitivity (the degree to which people and assets may
be affected by climate hazards) and adaptive capacity (the ability of institutions, systems and individuals to take
advantage of opportunities or cope with consequences of potential damages) (adapted from Intergovernmental
Panel on Climate Change, 2012; Lim & Spanger-Siegfried, 2005; United Nations International Strategy for Disaster
Reduction, 2009).
Adaptive capacity is closely related to resilience, which can be defined as the ability of a system to absorb
disturbance and reorganize while undergoing change so as to retain essentially the same function, structure, identity
and feedbacks. The resilience approach is based on the understanding that a system is evolving rather than static,
and that the type and magnitude of change is not always predictable, which requires a system to be flexible. It also
highlights the intrinsic linkages between ecological and social systems (Nelson, Adger, & Brown, 2007).
In CRiSTAL Food Security, the same five concentric rings shown in the food system framework above are used to
analyze resilience. For each ring, specific analytical questions are defined for this purpose (see Figure 2). Those
questions are based on resilience criteria developed by Tyler and Moench (2012) (see Table 1). These criteria
look at the resilience of systems (with an emphasis on aspects such as flexibility, robustness, diversity and safe
failure); agents (focussing on responsiveness, resourcefulness and the capacity to learn) and institutions (rights and
entitlements, decision-making processes and access to information). The questions are aimed at identifying a broad
range of locally relevant resilience factors without being too prescriptive.
e
s e
a h s to quit
m ou fo able
m se od
un h
ity old
?
Do
ho
s a a ra n
e
Do use itio th
tr g
nu urin
d
sp Is
at t h e
ia l
ly d resource
Is
th
istri
e
b u te d ?
an to re
tic ide cap
ipa nt abi
te ify a lity
pro nd
ble
ms?
1.
Household
Food
Utilization
u
n se
so ge hol
e y ur of d
ea ces
r?
of
ro
incohouseport
m
tow e holdion
ard goe
foo s
d?
Ar
es
sta net elfWou
ke wo o
comp ld a fa
ho r
rom ilu
l
r
ise e i
n
t
he o
Are mech
sy n
in place to anism
s
c
o
s
r
d
a
i
ng beh un
ho
avi ter
ou
Wha
rs?
tp
olicies and orga
Are p sufficiently d nizationa
ece
l
ices
serv sensitive to citizen ntralise
need d
to be
s?
2. Food
Access
d
an
ehol to
ous ays
a h le w ring
es ltip d du
Doe mus foo ear?
v s y
ha acce the
Source: Tyler et al. (2013)
3. Food
Availability
er
th e
Is acc in
th co
wi or
e
rc
?
ou ity
re s a c
li
bi
th e ap
c
pa va
D o e s a re
p
ca no m
s
re in r
have
he nd rfo
Is t rn a e pe
lea prov
im
Figure 2:
Resilience
Framework
4. Supporting
ces & Services
Resour
Is
r th
fol e-es ere
low ta ca
ing blis pa
ad hf
is
in Is t
go
nd organizational
cies a lusive: do they
poli
inc
Are vices
le access?
ser ble equitab
ena
o
yt
lit ion ?
bi ct ion
un upt
e
r
urc n?
so tio
re ndi
mand met
he co
l de
cal
od
oca ix of lo
l
Is by m ported food?
m
di
and
on g
i
t
za on ?
ni am abled
a
rg ing en
k rs
de
t
ar
p
e m?
te
5. Supporting
izations & Policie
n
s
Orga
ms
fo o d
s ys t e
s
e
t
o
g
r
a
h a ve
nd
equitcapacity ass?
a b l e a cce
D
ty
hav oes the res rce/service ts
ou
es
an te to to
en
g le
or m ubstitutable compon s?
ce
kin tab
a
n
ultiple
?
o
i
Is t
delivery opt
n-m un ?
isio , acco tory
mo esta here ca
c
e
d
bili blish pability to
Is
nt pa
ze r prior
pare tici
esou ities, and
trans nd par
rces fo
a
r action?
Page 7 | CRiSTAL Food Security 2.0 User’s Manual
Table 1: Normative criteria for resilience
SYSTEMS
Flexibility and
Robustness
The system can meet service needs under a wide range of climate conditions. Assets
can be converted or structures modified under stress to introduce new ways to ensure
continued functionality.
Redundancy,
Modularity and
Diversity
There is spare capacity to accommodate unexpected service demand or extreme
climate events. System components and pathways provide multiple options or
substitutable components for service delivery and are spatially distributed to avoid
concentrated failure.
Safe Failure
Failure in one part of the system is unlikely to compromise the ability of the system as
a whole to deliver service. The potential for failures to cascade between systems and
system components is small.
AGENTS
Responsiveness
and
Re-organization
Agents are motivated and able to plan and organize timely action when required,
including restructuring. Function, structure and order can be restored in a timely fashion
after an extreme event.
Resourcefulness
Agents have access to their own resources or the resources and services of other
systems and agents. Priority actions for adaptation can be identified and the necessary
resources mobilized for implementation.
Capacity to Learn
Agents are able to identify and anticipate potential risks. Lessons from past failures and
external feedback are internalized and improvements implemented.
INSTITUTIONS
Rights and
Entitlements
Access to systems and capacities is assured by equitable rights and entitlements.
Collective action is enabled, rather than being constrained.
Decision Making
Decision-making processes are transparent, representative and accountable. Diverse
stakeholders have ways to provide input to decisions. Dispute resolution processes are
accessible and fair.
Information
Agents have access to necessary information in order to determine effective actions and
to make strategic choices for adaptation.
Source: Tyler & Moench (2012)
Page 8 | CRiSTAL Food Security 2.0 User’s Manual
Goals and Structure
CRiSTAL Food Security is a decision-support tool for local-level government staff and development practitioners
to support the climate resilience of food systems at the community level. It aims to help users to understand:
•What the key elements of a food system of a given community are and how they are affected by climate
variability and change.
•How resilient different parts of the food system are to climate variability and change, and what can be done to
improve resilience.
•What indicators can help monitor the evolution of community food system resilience over time.
CRiSTAL Food Security is mainly targeted at local-level decision-makers, such as municipal or district-level
government staff, project managers of development organizations and local community leaders.
The tool consists of a series of Microsoft Excel spreadsheets and is currently available in English and Spanish. Its
main output is a series of automatically generated reports based on information entered into the spreadsheets.
Figure 3 gives an overview of the main analytical modules of CRiSTAL Food Security. The tool is divided into six
logically connected modules:
A.
The introduction consists of three pages on the objectives, approach, concepts and structure of the tool, and
of one page for entering information about your application of the tool.
B.
The context analysis has two pages that look at community characteristics and livelihoods, and at the climate
context, respectively.
C.
The food system analysis looks at the five dimensions described in the conceptual framework above (food
utilization and consumption, food access, food availability, supporting resources and services, and supporting
organizations and policies). It also considers the sensitivity of key food system elements within each dimension
to relevant current and future climate hazards.
D.
The resilience section uses the same five dimensions and helps the user analyze the resilience of the food
system through questions that are specific to each dimension (also see the framework presented above).
E.
The indicators section guides the user in the identification of specific, measurable, attainable, relevant and
time-bound (SMART) resilience indicators based on the analysis in the previous step.
F.
The final section automatically produces a series of reports that summarize key parts of the analysis.
The five dimensions of the food system framework presented in the concepts section above are reflected throughout
the analysis in steps C, D and E.
Page 9 | CRiSTAL Food Security 2.0 User’s Manual
A
B
Introduction
Contextual information on
the focus community and
its climate:
• What are the communities’
main characteristics and
livelihood activities?
• What climate changes,
climate hazards and
non-climate hazards
have been observed?
FOOD SYSTEM DIMENSIONS
Background information on
the tool and its current
application:
• Welcome page
• Approach and concepts
• Overview of analytical
steps
• Enter information about
your application of the
tool
Context
C
Food System
D
Resilience
E
Indicators
Analysis of information on
the various key dimensions
of the food system that
underpins local food
security (utilization and
consumption; access;
availability; supporting
resources and services;
supporting policies and
organizations).
Identification of the impacts
of cllimate hazards on each
of the key elements.
Analysis of relevant
resiliience issues for each
aspect of the food system.
Identification of key
resilience actions to
address issues.
Preliminary identification
of potential indicators to
measure the current state
and future progress on key
resilience issues.
Development of indicators
that can be used to
measure the resilience of
the food system that
underpins local food
security.
Selection of SMART
indicators (Specific,
Measurable, Attainable,
Relevant, Time-bound)
based on proposed indicators
from previous step.
The following questions guide
the analysis in this part:
The following questions guide
this part of the analysis:
The following questions guide
this part of the analysis:
Food utilization and
consumption
• What food items are
utilized and consumed in
the community and how?
• How resilient is the
community in its
consumption and utilization
of food items?
• How can the resilience of
food utilization and
consumption be measured?
Food access
• How does a community
access these food items?
• How resilient is the
community in accessing
food items?
• How can the resilience of
food access be measured?
Food availability
• What are the most
important resources for
making food available in
the community?
• How resilient is the
availability of food items
in the community?
• How can the resilience
of food availability be
measured?
Supporting resources
and services
• What are the most
important supporting
resources and services
for the community
food system?
• How resilient are the
supporting resources
and services?
• How can the resilience
of supporting resources
and services be
measured?
Supporting organizations
and policies
• What are the most
important supporting
organizations and
policies for the
community food
system?
• How resilient are
the supporting
organizations and
policies?
• How can the resilience
of supporting
organizations and
policies be measured?
F
Reports
Summary reports on the
entire analysis conducted
with the tool:
• Background Report
• Food System Report
• Climate Impacts Report
• Resilience Analysis Report
• Resilience Indicator
Report
Figure 3: CRiSTAL Food Security Modules
Note that it is possible to apply only parts of the tool. For example, users may only wish to analyze the food system
and stop after module C. Similarly, they may wish to stop after module D. The background reports provide a summary
of those steps that were completed.
Page 10 | CRiSTAL Food Security 2.0 User’s Manual
Methods and Resources
The use of the CRiSTAL Food Security tool relies on a combination of primary information gathered through
participatory methods (stakeholder consultations, project team discussions) and secondary information gathered
through desk-based research. CRiSTAL Food Security provides a framework for organizing, in a simple and logical
format, the information collected both at the local level (from communities and key informants) and at higher levels
(e.g., scientific information about climate change projections). There is no strict guidance on what information has to
come from which source, although consulting the focus communities as much as possible is strongly recommended.
Community Consultations
Almost all analytical steps can be completed by
collecting information through community consultations
and discussions with other project stakeholders.
Although users may have access to some of the required
information through their own experience or secondary
sources, consultations may yield more detailed and upto-date information on the community situation, key
livelihoods, food system elements and their resilience.
Engaging community members in the analysis also
ensures that any actions that are planned based on the
analysis are accepted by the community and are in line
with local needs, priorities and conditions.
The specific methods selected for engaging local
stakeholders in applying CRiSTAL Food Security are
flexible and left to the discretion of the user, as the
choice for appropriate approaches will depend on the
cultural context and the experience and capacity of field
researchers. Some Participatory Rural Appraisal tools
that have been applied in previous CRiSTAL and CRiSTAL
Food Security applications in Central America include:
Figure 4: Mapping Exercise in a
Nicaraguan community
Source: Keller, 2011
•Livelihood Strategies: This technique aims to identify
the main income-generating and subsistence activities
of different social groups within a community. A series of
diagrams are developed to illustrate key productive activities
for the main social groups, economic interlinkages, access
to important resources and hazards that could affect key
activities. This information is critical to understanding
food access strategies of the different social groups in a
community and the vulnerability of these strategies to
climate-related hazards.
•Resource and Hazard Mapping: This exercise consists of
drawing a map of the community or relevant area and the
identification of relevant resources as well as hazards that could
affect the resources on the map. In the context of food security
and climate resilience, the exercise can be used to map key
elements of the food system, such as cropland or food storage
facilities, and to understand their exposure to climate hazards.
It can also support discussions on resilience, for example by
illustrating the spatial diversification of key assets.
•Vulnerability Matrix: This tool allows focus groups to
identify the most important threats of key climate hazards to
their livelihoods and food security by ranking the severity of
Figure 5: Vulnerability Matrix
from a Colombian community
Source: Künzler, 2012
Page 11 | CRiSTAL Food Security 2.0 User’s Manual
the impacts of hazards such droughts or floods on key livelihood resources or food system elements. The ranking
exercise can support the prioritization of vulnerable food system elements for the subsequent resilience analysis
in the CRiSTAL Food Security tool.
There are many other participatory exercises that can be applied in order to gather information for the different parts
of the CRiSTAL Food Security Analysis. Wherever possible, different social groups, such as gender and livelihood
groups, should be consulted separately in order to understand the different conditions and challenges they face.
There are numerous guidebooks on participatory rural appraisal tools, many of which have been developed specifically
for a sector or a region. The following references are particularly relevant to the context of climate resilience and
food security:
•CARE’s Climate Vulnerability and Capacity Analysis (CVCA) Handbook contains facilitation tips and a range of
participatory field tools, including hazard mapping, a vulnerability matrix and seasonal calendars with a specific
emphasis on climate-related risks. (www.careclimatechange.org/cvca/CARE_CVCAHandbook.pdf)
•The Asian Disaster Preparedness Center’s (ADPC) Community-Based Disaster Risk Management Field
Practitioner’s Handbook provides a process for community-based disaster risk management with explanations
for a range of participatory exercises for each step. (www.adpc.net/pdr-sea/publications/12handbk.pdf)
•The Inter-American Institute for Cooperation on Agriculture’s (IICA) 80 Tools for Participatory Development
offers a wide selection of participatory tools for rural development appraisal, planning, follow-up and evaluation.
(www.iica.int/Esp/regiones/central/cr/Publicaciones%20Oficina%20Costa%20Rica/80tools.pdf)
It is essential that consulted groups have a good understanding of the purpose and expected outcomes of a
consultation, in order to ensure meaningful participation and to avoid excessive expectations. Experience shows that
it is particularly important to spend enough time explaining key term concepts, such as climate change, resilience,
food security and food systems, as they can often be hard to grasp, not only for community members but also for
local-level project or government staff.
Other Sources of Information
CRiSTAL Food Security users are encouraged to complement and triangulate the information collected at the
community level with additional information collected through desk-based research as well as meetings with
researchers, academics, non-governmental organizations and government representatives.
Key information to be collected includes:
•Local livelihood conditions and trends
•Food security issues, especially at larger scales, that can influence the focus community
•Past and current climate conditions and trends, and climate change projections
•Other relevant environmental and socioeconomic trends affecting the focus community
Required Resources
The resources required to apply the CRiSTAL Food Security tool can vary according to the objectives and capacities
of users, the availability of background information and the willingness of key stakeholders to participate in the
analytical process:
•Knowledge and skills: Researchers involved in the application of CRiSTAL Food Security should have basic
knowledge of climate variability and change, resilience, livelihoods, food security, and gender and diversity.
They should be able to use a range of participatory rural appraisal tools and have good facilitation skills. Basic
computer literacy is required to use the Excel-based tool itself. A comprehensive training may be required for the
researchers involved before they begin the analysis.
•Participants: There should be at least two facilitators (one moderator and one note taker). The facilitation team
should include both men and women. To cover the required knowledge and skills noted above, it may be best to
assemble interdisciplinary facilitation teams. Consulted groups should ideally consist of about 10, but not more
than 15 community members.
Page 12 | CRiSTAL Food Security 2.0 User’s Manual
•Time: Typically, users will need two or three full-day visits to a community in order to cover the entire analysis.
The visits do not need to happen consecutively and a few days or weeks might be needed in between to input
and process collected information appropriately. Discussions with different focus groups within a community
can ideally take place in parallel. One or two days are necessary for background research, and another one or two
days are required to enter and process the research results with the CRiSTAL Food Security tool.
•Material: Usual materials needed for participatory exercises include flipcharts, markers, coloured paper, masking
tape, notebooks, etc. Having a camera is useful. Snacks and drinks should be provided to participants. For the
analysis as such, a computer equipped with Microsoft Excel and a printer to distribute the summary reports
are needed.
•Cost: Cost can vary considerably as a function of specific human (e.g., training, staff time) and physical resources
(e.g., use of meeting rooms, material, food) in the process.
Users of CRiSTAL Food Security should remain open to adapting the research process constantly in response to
specific local conditions and needs. For example, it may in some cases become necessary to spend more time
explaining certain concepts before moving on to the next analytical step.
Page 13 | CRiSTAL Food Security 2.0 User’s Manual
CRiSTAL Food Security Step-by-Step
This section provides a brief description of each step of the CRiSTAL Food Security analysis. It does not provide
details on how to gather the necessary information, but explains the purpose and details of each analytical step.
Getting Ready
Before you start your CRiSTAL Food Security Analysis, make sure to read through the first part of this manual and
ensure that you have access to the required resources for conducting a thorough assessment. Then download the
tool from the CRiSTAL website (www.iisd.org/cristaltool) and open the tool in Microsoft Excel. You are now ready
to enter information into the spreadsheets.
Navigation in CRiSTAL Food Security is easy. There is a tab for each analytical step described below (see Figure 6).
There are explanations on the purpose and content on each tab. In addition to the general explanations that are
always visible, additional guidance is available for cells that are marked with a red triangle in the top right corner.
Figure 6: Snapshot of CRiSTAL Food Security Interface
The information entered on each page is automatically linked to cells on other pages. Make sure to keep your
spreadsheets protected to avoid deleting Excel formulas that link cells between different tabs. If you need to revise,
update or change previously entered information, simply go back to the respective tab—CRiSTAL Food Security is
flexible and allows for an iterative analytical process.
A) Introduction
The introductory part of the tool consists of three tabs outlining the aims and target audience of the tool, the approach
and key concepts, and the analytical structure. The fourth tab belonging to the introductory module allows users to
fill in data on their application of the tool, such as:
•The name, organization, position and contact data of the person who is leading the analytical process.
•The date on or time period during which the tool was applied.
•Information sources and research methods used.
Entering this information makes it possible to understand when and how the analysis was conducted and allows
interested stakeholders to contact the lead person after the analysis is completed.
Page 14 | CRiSTAL Food Security 2.0 User’s Manual
B) Context
There are two tabs summarizing important contextual information that will be used in subsequent analytical steps.
The first tab looks at the community and livelihood context, whereas the second tab summarizes information on
past, current and future climate conditions and hazards.
Community Context
In the left-hand section of this step, you can enter background information on the community where the tool is
being applied. This covers the following aspects:
•Name of the community, municipality, department and/or region
•Population size and number of dwellings
•Geographical context (e.g., location, access, etc.)
•Culture and diversity: Observations or secondary information on gender, diversity and cultural practices (e.g.,
differences in livelihood activities between men and women, religious practices, etc.)
•Governance: Formal and informal governance mechanisms (e.g., local governments, water management council,
justice schemes, etc.)
•Education and skills: Formal and informal education (e.g., average number of school years) and skills (vocational
skills, organizational capacity, etc.) among the local population
In the right-hand section, you can enter details on up to four livelihood activities. For each activity, you can enter:
•The name of the activity or income source (for example, agriculture, fishery, tourism, etc.)
•Description of the activity (e.g., types of crops for agriculture; small- or large-scale for fisheries; etc.)
•People who are involved in the activity: How many people are involved in the activity, and from what social
groups (e.g., 30 per cent of the inhabitants, the poor, men only, mostly women, etc.)
•Seasonal variation of the activity: How the intensity of this activity varies throughout the year (e.g., day labour
only takes place during harvesting season in May and June; remittances are stable through the year, etc.)
•The average income generated per year from this activity: How much income the activity generates per year
for the entire community on average (when in doubt, use the average of the previous five years). If this topic is
sensitive, you can put percentage points into these boxes or leave them empty. Note that the total income for the
community is automatically calculated at the bottom of the table, unless you have not filled out these boxes.
Climate Context
This tab allows users to summarize information about the current climate, observed and projected climate change,
and on the main climatic and non-climatic hazards affecting the community.
The left-hand section looks at current climate conditions, as well as observed and projected climate change:
•The first two boxes allow users to enter information about current climate conditions: one is for scientific
information (e.g., from the national meteorological department) and the other one is for community observations
(e.g., how community members describe their own climate). The juxtaposition of the two boxes allows for
comparison of different perspectives on the same question.
•The next two boxes look at observed (i.e., past) climate change. Typically this will involve any permanent
changes in average climate variables (e.g., mean temperature, annual rainfall, the number of extreme events)
over the past decades. Again, scientific information and community observations are compared. Community
observations tend to be shorter term and more local, while scientific records can reach further back, but might be
only available at larger scales.
•The final four boxes allow users to enter information on projected climate change. As these are not observed
variables, but scientific projections, there is no box for community observations here. There are separate boxes
for projections on changes in temperatures, rainfall, frequency and intensity of extreme events, and other
phenomena (e.g., sea-level rise).
Page 15 | CRiSTAL Food Security 2.0 User’s Manual
Box 2: Finding and Using Climate Change Information
Scientific information on observed and projected climate change trends and impacts at national and
regional levels can be accessed through the following sources:
•Intergovernmental Panel on Climate Change reports: These summarize the current knowledge
on climate change and its impacts by region and for ecological zones. (http://www.ipcc.ch/
publications_and_data/ar4/wg2/en/contents.html)
•United Nations Framework Convention on Climate Change (UNFCCC) National Communications:
These documents are prepared by signatory Parties to the UNFCCC, and communicate the results of
national assessments of greenhouse gas emissions, as well as information on vulnerability, impacts
and adaptation. Observed and anticipated trends and impacts of climate change for users’ countries
can be drawn from these documents. (http://unfccc.int/national_reports/non-annex_i_natcom/
items/2979.php and http://unfccc.int/national_reports/annex_i_natcom/submitted_natcom/
items/4903.php)
•The World Bank Climate Change Knowledge Portal: This platform provides an online tool for
access to comprehensive global, regional and country data related to historical, current and future
climate impact and vulnerability. (http://sdwebx.worldbank.org/climateportal/index.cfm)
•Climate Wizard provides climate change information and visualizes the impacts anywhere on Earth
(www.climatewizard.org)
•The Adaptation Learning Mechanism provides country summaries on observed and projected
climate change and impacts. (www.adaptationlearning.net)
There are many other relevant sources of information, often region- or country-specific, which we
cannot list here. Make sure to search the Internet thoroughly and consult local experts.
Climate change projections should be used carefully because they are based on imperfect climate
models and on development scenarios that are inherently uncertain. We therefore recommend
that you compare different sources and look for projections that are based on different models and
scenarios. Also, make sure to note any uncertainty ranges that are mentioned in the projections (e.g.,
a projected 3°C temperature rise by 2050 may come with an uncertainty range of 1.5°C to 5°C;
average rainfall projections may be negative but the uncertainty range can be from +20 to -50 per
cent; extreme events projections are often even more uncertain).
The right-hand section of the tab looks at key current and future climate hazards. Climate hazards are “potentially
damaging hydro-meteorological events or phenomena; they can be events that have an identifiable onset and
termination, such as a storm, flood or drought, as well as more permanent changes, such as shift from one climatic
state to another” (Lim & Spanger-Siegfried, 2005).
Select up to four climate hazards not only based on community consultations, but also taking into account scientific
information entered on the left-hand side, as communities may not know what future hazards can potentially affect
them. For each climate hazard selected, you will then be asked to specify:
•Whether it is a current or potential future hazard
•Its frequency: how often a hazard occurs (e.g., once every year, twice a decade)
•Its intensity: how “strong” the hazard is when it occurs (e.g., moderate drought lasting two to three weeks)
•Its future evolution under climate change: anticipated changes in the location, duration, frequency and intensity
of the hazard under climate change (e.g., storms are likely to occur less often but to become more intense in a
specific area).
Page 16 | CRiSTAL Food Security 2.0 User’s Manual
There is also a space to briefly describe any non-climate hazards mentioned by the focus group (e.g., earthquakes,
volcanoes, diseases). These will not be taken forward in the analysis but are important to be kept in mind because it
can help you understand the broader vulnerability context.
C) Food System
The food system analysis follows the conceptual framework presented above. There is one tab for each ring of the
spinwheel presented on page 6: food utilization and consumption, food access, food availability, supporting resources
and services, and supporting organizations and policies. Each tab has two parts: the left-hand side describes key
elements of the respective food system component and the right-hand side looks at how the climate hazards defined
in the previous step affect the food system elements.
Food Utilization and Consumption
This step looks at the main food items that are consumed in the community and potential food utilization issues
relating to health, access to water and sanitation, as well as cultural issues:
•Up to 10 main food items consumed in the community should be listed in the top left part of the tab. You should
then define the importance of each food item on a scale from 1 (not very important) to 3 (very important).
Importance can be subjective (as felt by community members) and can relate to nutritional, cultural or other
aspects. In the “observations” box you can note reasons for considering items important, whether there is
seasonal variation in consumption of each item, whether there are differences in consumption patterns between
social groups (especially genders) and other observations.
•Move down to the health and water section. There are two boxes for noting health issues and observations on
the state of access to clean water and sanitation in the community. Both aspects are critical for food utilization,
as poor health and lack of access to clean water and hygiene can undermine the ability of community members
to digest and thus utilize food.
•At the bottom of the tab you will find the diversity and culture section. Here you can note any observations
on different consumption patterns between genders and social groups as well as on the cultural preferences of
certain food types over others.
Having completed the left-hand side, you can look at how the up to four climate hazards entered in the previous tab
affect the consumption of food items, health issues and access to water and sanitation, and how they may affect
the differences in consumption patterns between genders and social groups. For each food item and utilization
issue there is a box to describe the most important impacts and one for ranking its sensitivity on a scale from 0 (not
sensitive) to 3 (very sensitive).
Food Access
This tab looks at how the up to 10 food items listed in the previous step are accessed by the community through
different access strategies, such as subsistence or purchase. The list of food items is automatically copied from the
previous tab. Proceed with the analysis as follows:
•Select relevant food access strategies: Five possible food access strategies are proposed (subsistence, local
purchase, external purchase, barter and food aid). You can replace the last two with other strategies if required.
•For each food item, choose the most important food access strategy by marking “yes” in the respective box.
If more than one is very important (e.g., a food item is accessed through two or three strategies to a similar
extent; one access strategy is less important overall but critical in a specific period), you can mark more than one
strategy with a “yes.” You can leave other boxes blank.
•In the boxes to the right, you can describe seasonal variations in food access strategy. Refer to a normal
year representing average climate conditions described in the climate context section and without severe
climatic events.
At the bottom of the page there is a section that looks at income use. The total annual income is copied from the
community context tab. You are asked what share of this income is normally used to purchase food, and whether
this share varies significantly between households in the community. If some households use a significantly higher
Page 17 | CRiSTAL Food Security 2.0 User’s Manual
share of their income for food purchase, note which households are concerned and approximately what income
share they use for food.
Having completed the left-hand side, you can look at how the up to four climate hazards entered in the climate
context tab affect food access. For each food item there is a box to describe the most important impacts and one for
ranking its sensitivity on a scale from 0 (not sensitive) to 3 (very sensitive).
Food Availability
In this step, key resources that are needed for making food available to the community are identified. As a reminder,
identified food items and access strategies from the previous tab are displayed on the left-hand side. Proceed
as follows:
•In the first column of boxes, identify up to five important resources or services that relate to food availability
issues such as food production, processing and packaging, distribution and retail, preparation and storage,
and markets.
•Note who in the community has access to (i.e., is able to benefit from) these resources and services.
•Identify who controls access to each resource or service (i.e. who, within or outside the community, has the
ability to mediate other people’s access to each resource?)
•Note any trends in the state of the resource or service (i.e., is the resource or service in a good or bad state? Is
it degrading, expanding, improving, etc.?).
The right-hand side of the tab looks at climate impacts. The four climate hazards identified in the climate context tab
are shown in the top row. Rank the impact of each hazard on each resource according to the following scale:
•2= high positive impact
•1= medium positive impact
•0= no impact
•-1= medium negative impact
•-2= high negative impact
Then describe important impacts in the box on the right.
Supporting Resources and Services
This tab looks at the natural, physical and financial supporting resources and services that are needed to make the
core food system described in the three previous steps work. As a reminder, key food availability resources entered
in the previous tab are shown on the left hand side. Conduct the following steps:
•Identify up to three natural and three physical supporting resources and services in the first column of boxes.
Examples of natural resources include land, soil and forests. Water is set as a default resource. Physical resources
refer to elements such as communication and energy infrastructure. Roads are set by default. Default resources
can be removed if not applicable.
•Next, note who in the community has access to (i.e., is able to benefit from) these natural and physical resources
and services.
•Then, identify who controls access to each resource or service (i.e. who, within or outside the community, has
the ability to mediate other people’s access to natural and physical resources?).
•Note any trends in the state of the resource or service (i.e., is the resource or service in a good or bad state? Is
it degrading, expanding, improving, etc.?).
You will note that the income sources identified in the community context tab are automatically copied and presented
as financial resources below. Note any relevant trends for each income source.
Page 18 | CRiSTAL Food Security 2.0 User’s Manual
The right-hand side of the tab looks at climate impacts. The four climate hazards identified in the climate context tab
are shown in the top row. Rank the impact of each hazard on each resource according to the following scale:
•2= high positive impact
•1= medium positive impact
•0= no impact
•-1= medium negative impact
•-2= high negative impact
Then describe important impacts in the box on the right.
Supporting Organizations and Policies
As a final step of the food system analysis, this tab looks at the organizations and policies that support the entire
food system. At the community level, these can be local organizations that support the management of natural
resources (e.g., water committees) or provide emergency response services. It also entails political resources, such
as important power relations and access to the decision-making process (e.g., good relations to a regional governor).
Cultural resources are also included here. You are asked to conduct the following analytical steps:
•Identify up to three social resources (e.g., community organizations, networks, relationships of trust, reciprocity
and exchanges), up to two political resources (e.g., access to the decision-making process, power relations) and
up to two cultural resources (e.g., rituals, religious beliefs, taboos).
•Note who in the community has access to (i.e., is able to benefit from) these social, political and cultural
resources and services.
•Identify who controls access to each resource or service (i.e., who, within or outside the community, has the
ability to mediate other people’s access to social, political and cultural resources?)
•Note any trends in the state of the resource or service (i.e., is the resource or service in a good or bad state? Is
it degrading, expanding, improving, etc.?).
The right-hand side of the tab looks at climate impacts. The four climate hazards identified in the climate context tab
are shown in the top row. Rank the impact of each hazard on each resource according to the following scale:
•2= high positive impact
•1= medium positive impact
•0= no impact
•-1= medium negative impact
•-2= high negative impact
Then describe important impacts in the box on the right.
With this step, you have completed the food system analysis.
D) Resilience Analysis
The resilience analysis takes you through the same five components of the food system (utilization and consumption,
access, availability, supporting resources and services, supporting organizations and policies). There is one tab for
each component. In each tab, a summary of the analysis conducted for the respective food system component is
presented on the left-hand side. On the right-hand side of each tab, you will find between three and five resilience
questions. You are then encouraged to conduct the following tasks:
•Provide a detailed answer to each resilience question, taking into account the summary of the previous analysis
located on the left as well as your general knowledge of the community.
•Propose resilience actions that address the specific resilience issues identified in the answer to the resilience
questions.
Page 19 | CRiSTAL Food Security 2.0 User’s Manual
•Identify a range of SMART (specific, measurable, attainable, relevant, time-bound) potential indicators.
Examples for possible indicators are provided for each resilience question. There is no need to select a specific
indicator here—this will be the remit of the next section of the tool. The idea is to provide a list of potential
indicators that can then be refined in the next section.
In each tab, there is also an optional box for additional remarks on the resilience of the respective food system
component. This may include observations that do not fit into the answers to the specific resilience questions. For
example, you may identify fundamental barriers to resilience that go beyond the scope of the resilience questions,
such as lack of land tenure or water scarcity.
Resilience of Food Utilization and Consumption
The specific resilience questions that have to be answered in the context of food utilization and consumption are:
•Do households in the community consume diverse nutritional sources throughout the year?
•Is there equitable access to food within households?
•Are there health and sanitation issues in the community that could affect the nutrition of individuals?
•What types of storage and cooking techniques are available to households?
More detailed explanations on the background of each resilience question are available in the tool (place the cursor
over the cell in which the questions is stated).
Resilience of Food Access
The specific resilience questions that have to be answered in the context of food access are:
•Do the households in the community have diverse ways to access food throughout the year?
•Is food access in the community equitable between households?
•What share of household incomes used to purchase food?
More detailed explanations on the background of each resilience question are available in the tool (place the cursor
over the cell in which the questions is stated).
Resilience of Food Availability
The specific resilience questions that have to be answered in the context of food availability are:
•Are the key resources for food availability (such as storage systems) spatially distributed, so that they are not
easily disrupted by climate hazards?
•Do key resources for food availability have multiple options for service delivery?
•Do key resources for food availability have sufficient capacity and alternative options for service delivery, and are
they accessible for all?
•Are mechanisms in place to counter hoarding behaviours?
More detailed explanations on the background of each resilience question are available in the tool (place the cursor
over the cell in which the questions is stated).
Resilience of Supporting Resources and Services
Before turning to the specific resilience questions, a pre-selection of three supporting resources and services
is proposed here, as the analysis would be too complex if the resilience questions had to be answered for each
resource. The resources should be pre-selected based on their climate sensitivity or due to their importance in
responding to negative climate impacts. There are boxes for noting the three prioritized resources or services and for
providing a justification of this selection. The following resilience questions are then answered for each of the three
priority resources:
Page 20 | CRiSTAL Food Security 2.0 User’s Manual
•Is the resource in good condition?
•Is the resource/service spatially distributed so that it is not completely disrupted by a single climate hazard?
•Does the resource/service have substitutable components or multiple options for delivering its service?
•Does the resource/service have spare capacity?
•Is there potential for cascading failures in linked infrastructure services if one element fails?
More detailed explanations on the background of each resilience question are available in the tool (place the cursor
over the cell in which the questions is stated).
In contrast to the resilience analysis of the four other components, resilience actions and indicators are identified here
by resource. Consider your answers to all the resilience questions when identifying appropriate resilience actions.
Resilience of Supporting Organizations and Policies
The specific resilience questions that have to be answered in the context of supporting organizations and policies are:
•Can key community organizations and governmental institutions restore their functionality after a climate-related
shock or stress?
•Do the supporting organizations and policies provide equitable access within the community?
•Do community organizations have the capability to establish priorities, implement plans and mobilize resources
permanently?
•Is there a capability to learn and avoid repeated failures and to innovate to improve performance?
•Are community organizations and key government institutions sufficiently decentralized to be responsive to
citizens’ needs?
More detailed explanations on the background of each resilience question are available in the tool (place the cursor
over the cell in which the questions is stated).
E) Indicator Selection
In this section, SMART (specific, measurable, attainable, relevant and time-bound) resilience indicators are selected
and defined. There is one tab for each component of the food system. Each tab has the same structure, showing first
the resilience questions, responses, actions and potential indicators as identified in the resilience analysis section. In
each tab, you are encouraged to conduct the following steps:
•Select resilience indicators: Select the most important indicators based on the potential indicators developed in
the previous section. You can choose up to three per resilience question, but often you may select none or only
one or two. In this case, leave unused boxes blank.
•Define the indicators: Explain the indicator measures specifically (e.g., percentage of households in community
with a fridge, share of irrigated crop land)
•Identify data sources and responsible organizations: Explain what data sources should be used to measure the
indicator over time and what organization is providing the information.
•Identify a person who will be responsible for collecting information on each indicator.
•Provide the current value of the indicator (baseline).
•Provide a target value along with a target time horizon.
You may want to conduct this indicator selection exercise iteratively, as you may find out that some proposed
indicators cannot be operationalized due to lack of data or other reasons, or that additional indicators are needed
for specific aspects. Be aware of the importance of strictly prioritizing indicators. The analysis allows you to identify
many indicators, but for a practical monitoring system it may make sense to measure no more than 20 indicators
across time. You may consider integrating the indicators into existing monitoring systems (such as community
indicators on food security that are monitored as part of food security early warning systems).
Page 21 | CRiSTAL Food Security 2.0 User’s Manual
F) Reports
CRiSTAL Food Security automatically produces five summary reports:
•A background report summarizing technical data on the current application of the tool as well as background
information on CRiSTAL Food Security.
•A food systems report summarizing information entered into the CRiSTAL Food Security tool on the different
layers of the food system of the assessed community.
•A climate impacts report summarizing information entered into the CRiSTAL Food Security tool on the impacts
of climate variability and change on the different parts of the community food system.
•A resilience analysis report summarizing the resilience analysis of the different components of the food system
of the assessed community.
•A resilience indicators report summarizing details of the selected resilience indicators.
The reports are programmed in a printer-friendly format. They allow you to use the results for further work and to
share them with other people.
Page 22 | CRiSTAL Food Security 2.0 User’s Manual
Additional Resources
A range of resources is available on the CRiSTAL website (www.iisd.org/cristaltool) and on the website of the
Climate Resilience and Food Security in Central America (CREFSCA) project (www.iisd.org/adaptation/crefsca).
Among other things, you can find:
•Downloads of CRISTAL Food Security tool and user’s manual and of other versions of the CRiSTAL tool.
•The paper, Climate Resilience and Food Security: A Framework for Planning and Monitoring, which lays out the
conceptual basis for this tool.
•Examples of past CRiSTAL and CRiSTAL Food Security applications around the world, including a database of
users’ reports.
•An events calendar showing upcoming training sessions and other activities.
From time to time, training workshops on CRiSTAL and on CRiSTAL Food Security are conducted in different regions
around the world. Previous experiences with using CRiSTAL have demonstrated that, for new users, it is important
to attend a training session. The training workshops often provide participants with an introduction to some of the
basic concepts and approaches to climate change, its links to sustainable livelihoods and food security, and how
they relate to the CRiSTAL process. Group work and practical application are strongly emphasized. However, each
training session is different, tailored to the expressed needs and available resources of the community. Examples of
completed training sessions are available through the CRiSTAL website.
Please check the website regularly for updates about the tool and its applications (e.g., translation of the tools into
different languages, development of online training materials).
To learn more about CRiSTAL Food Security and associated training opportunities, or simply to share your experience
with the CRiSTAL application, please contact: Alicia Natalia Zamudio ([email protected]) or Anne Hammill
([email protected]) at the International Institute for Sustainable Development (IISD).
Page 23 | CRiSTAL Food Security 2.0 User’s Manual
References
Intergovernmental Panel on Climate Change. (2012). Summary for policymakers. In C.B. Field et al. (eds.), Managing
the risks of extreme events and disasters to advance climate change adaptation: A special report of Working Groups I and II
of the Intergovernmental Panel on Climate Change (pp. 1–19). Cambridge, U.K.: Cambridge University Press.
Nelson, D. R., Adger, W. N., & Brown, K. (2007). Adaptation to environmental change: Contributions of a resilience
framework. Annual Review of Environmental Resources, 32, 395–419.
Schmidhuber, J. & Tubiello, F. (2007). Global food security under climate change. Proceedings of the National
Academy of Sciences of the Unites States of America, 104(50), 19703–19708. Retrieved from http://www.pnas.org/
content/104/50/19703.full.pdf
Tyler, S. & Moench, M. (2012). A framework for urban climate resilience. Climate and Development, 4(4), 311–326.
Tyler, S., Keller, M., Swanson, D., Bizikova, L., Hammill, A., Zamudio, A.N., et al. (2013). Climate resilience and food
security: A framework for planning and monitoring. Winnipeg: International Institute for Sustainable Development.
Lim, B. & Spanger-Siegfried, E. (Eds.). (2005). Adaptation policy frameworks for climate change: Developing strategies,
policies and measures. United Nations Development Programme. Retrieved from http://www.preventionweb.net/
files/7995_APF.pdf
United Nations International Strategy for Disaster Reduction. (2009, May). 2009 UNISDR terminology on disaster risk
reduction. Geneva: United Nations.
World Food Summit. (1996). Rome Declaration on World Food Security. Rome: FAO. Retrieved from http://www.fao.
org/docrep/003/w3613e/w3613e00.HTM
Photo: Local consultation in the community of California, Honduras.
For more information, please consult www.cristaltool.org