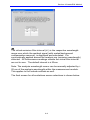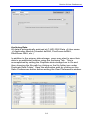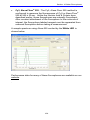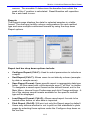
1
NanoDrop 3300 Fluorospectrometer V2.7 User’s Manual The information in this publication is provided for reference only. All information contained in this publication is believed to be correct and complete. Thermo Fisher Scientific shall not be liable for errors contained herein nor for incidental or consequential damages in connection with the furnishing, performance or use of this material. All product specifications, as well as the information contained in this publication, are subject to change without notice. This publication may contain or reference information and products protected by copyrights or patents and does not convey any license under our patent rights, nor the rights of others. We do not assume any liability arising out of any infringements of patents or other rights of third parties. We make no warranty of any kind with regard to this material, including but not limited to the implied warranties of merchantability and fitness for a particular purpose. Customers are ultimately responsible for validation of their systems. © 2008 Thermo Fisher Scientific Inc. All rights reserved. No part of this publication may be stored in a retrieval system, transmitted, or reproduced in any way, including but not limited to photocopy, photograph, magnetic or other record, without our prior written permission. For Technical Support, please contact: Thermo Fisher Scientific 3411 Silverside Road Bancroft Building, Suite 100 Wilmington, DE 19810 U.S.A. Telephone: 302-479-7707 Fax: 302-792-7155 E-mail: [email protected] www.nanodrop.com For International Support, please contact your local distributor. Microsoft, Windows, Windows NT and Excel are either trademarks or registered trademarks of Microsoft Corporation in the United States and/or other countries. Adobe and Acrobat are trademarks of Adobe Systems, Incorporated. All other trademarks are the property of Thermo Fisher Scientific Inc. and its subsidiaries. NanoDrop is a trademark of Thermo Fisher Scientific. Revised 4/08 TABLE OF CONTENTS 1. Overview ................................................................................................. 1-1 Instrument Description..................................................................1-1 Virtual Filtering – White LED ........................................................1-2 Operation ......................................................................................1-3 2. Initial Set Up ........................................................................................... 2-1 Computer Requirements ..............................................................2-1 Software Installation .....................................................................2-1 3. General Operation.................................................................................. 3-1 The Sample Retention System.....................................................3-1 Cleaning the Sample Retention System.......................................3-1 Sample Size Requirements ..........................................................3-2 Software Architecture and Features .............................................3-3 Application Modules .....................................................................3-3 Account Management...................................................................3-5 4. Create/Edit Method ................................................................................ 4-1 Create New Method......................................................................4-1 Edit Existing Method.....................................................................4-5 5. User Preferences.................................................................................... 5-1 General Settings ...........................................................................5-1 Archiving Data ..............................................................................5-3 Reports .........................................................................................5-4 6. Fluorescence Profiler ............................................................................ 6-1 7. Common Module Functions.................................................................. 7-1 Acquisition Page Functions ..........................................................7-1 Generating a Standard Curve.......................................................7-4 8. Nucleic Acid Quantification................................................................... 8-1 dsDNA 33258 Hoechst .................................................................8-1 dsDNA PicoGreen® (dye) .............................................................8-2 RNA RiboGreen® (dye).................................................................8-2 Quant-iT™ DNA BR .....................................................................8-3 Quant-iT™ DNA HS .....................................................................8-4 Sybr® Green I................................................................................8-4 9. Protein Quantification............................................................................ 9-1 Fluorescamine ..............................................................................9-1 FluoroProfile® ................................................................................9-2 Fluoraldehyde™ OPA...................................................................9-2 Quant-iTTM Protein Assay .............................................................9-3 10.Other Fluorophores ............................................................................ 10-1 Blue LED Methods..................................................................... 10-1 UV LED Methods ....................................................................... 10-2 White LED Methods................................................................... 10-3 11.Archived Data and Data Viewer ......................................................... 11-1 Archive File Creation ................................................................. 11-1 Data Viewer ............................................................................... 11-2 12.Source Check...................................................................................... 12-1 13.Troubleshooting ................................................................................. 13-1 Error Codes and Messages....................................................... 13-1 Connection Errors...................................................................... 13-3 Sampling Concerns ................................................................... 13-7 14.Maintenance and Warranty ................................................................ 14-1 Cleaning..................................................................................... 14-1 Warranty .................................................................................... 14-1 15.Appendices ......................................................................................... 15-1 Instrument Specifications .......................................................... 15-1 Reference Table of Shortcut Keys............................................. 15-1 Solvent Compatibility ................................................................. 15-1 Section 1-Overview 1. Overview Instrument Description The Thermo Scientific NanoDrop™ 3300 Fluorospectrometer uses patented sample retention technology (surface tension) to make small volume fluorescent measurements. The uniquely clean optics of the retention system, combined with proprietary signal processing for the White LED applications, enables measurements across a wide range of wavelengths using sample volumes of 1–2 ul without cuvettes and costly filter changes. The excitation source comes from one of three solid-state light emitting diodes (LED’s), which are oriented 90° to the detector. A 2048-element CCD array detector, covering 400 – 750 nm, is connected by an optical fiber to the optical measurement surface. The spectrometer is configured with a cut filter to eliminate light transmission below 395 nm. The image below lists some of common fluorophores that can be measured using the NanoDrop 3300 along with the most appropriate excitation LED. UV LED max=365 nm; equipped with cut filter that eliminates excitation above 400 nm. Example Applications: • GFP wt Em509 • Quinine Sulfate Em450 • Hoechst 33258 Em450 • 4-MU Em450 • Q Dots various Blue LED max= 470 nm; equipped with cut filter that eliminates excitation above 495 nm. Example Applications: • GFP wt Em509 • EGFP Em509 • FITC-FAM Em515 • Alexa 488 Em520 • PicoGreen Em525 • RiboGreen Em525 • Alexa 555 Em565 • B-Phycoerythrin Em575 • Q Dots various White LED range= 500-650 nm; uses virtual filtering. Example Applications: • Cy3, Alexa 555 Em565 • Alexa 568 Em600 1-1 Section 1-Overview • Cy5, Alexa 647 Em667 • Sulforhodamine 101 Em 600 • 5-CMTREm570 • Q Dots various • TET Em535 • HEX Em555 Virtual Filtering – White LED In order to excite a broader range of fluorophores (~460 – 650 nm range), a White LED source is selected. The White LED is composed of a Blue LED and a yellow-orange phosphor excited by the Blue LED to give an approximately White spectrum (typically bluish in appearance). Virtual filtering (patents pending) involves taking a reference spectrum as a wavelength intensity map of the White LED yellow peak, measuring a sample, and then mathematically determining the true sample signal from the total signal. The residual signal (with background removed) is calculated and displayed over the respective wavelength range determined by the virtual emission filter interval (∆λ). The ∆λ is symmetrically applied around the analysis nm (emission wavelength) selected. All fluorescence readings outside the virtual filter interval are set to zero. One of the factors making it feasible to extract the sample fluorescence by subtracting a scaled representation of the source is the inherent “off-angle” light rejection properties of the optical fiber and the reduction in scattering from directly wetted optical surfaces. An additional element making this method possible is the high reproducibility of the relative spectral output intensity vs. the wavelength of the LED. In practice, a “Virtual Emission Filtering Interval ( ” is set for each method created that uses the White LED. 1-2 Section 1-Overview See the section entitled Common Module Functions for more information on the ∆λ . Operation A 1-2 ul sample is pipetted onto the end of the lower measurement pedestal (the receiving fiber). A non-reflective “bushing” attached to the arm is then brought into contact with the liquid sample causing the liquid to bridge the gap between it and the receiving fiber. The gap, or pathlength, is controlled to 1mm. Following excitation with one of the three LEDs, emitted light from the sample passing through the receiving fiber is captured by the spectrometer. The NanoDrop 3300 is controlled by software run from a PC. All data is logged and archived in the C:\ND-3300 Data folder as well as at a second user defined location. An external power supply is not required. The operating power is supplied by the USB port on the PC. Patents The sample retention technology used in the Thermo Scientific NanoDrop™ 1000 Spectrophotometer & the Thermo Scientific NanoDrop™ 3300 Fluorospectrometer is covered under US patents 6,628,382 and 6,809,826. Other patents are pending. 1-3 Section 2- Initial Set Up 2. Initial Set Up Computer Requirements The operating software will only run on an IBM compatible PC meeting the below criteria. Mac versions of the software are not currently available. • Microsoft Windows, compatible with Windows 2000 and XP (32 bit only). • Windows Vista has also been successfully tested with the software. The operating software will not work with Windows 95, 98, ME, XP (64 bit) or Windows NT. • 233 MHz or higher processor • CD ROM drive • 32 MB or more of RAM • 40 MB of free hard disk space • Open USB port (the instrument can only be connected via the USB port) • Microsoft Excel or other spreadsheet program to manipulate archived data (optional) Software Installation WARNING: The system software must be loaded onto the PC before the USB cable is connected. Administrator access on the PC is required to install the software. To properly install the operating software: 1. Close all programs and make sure that the USB cable is unplugged. 2. Insert the operating software CD in the CD drive of the PC. The software installation menu should appear automatically. If software menu does not appear, choose “My Computer” to view the contents of the CD. Double click on the file named “nd3300[version]-install.exe“. 3. After software installation, remove the sticker on the back of the instrument and connect the USB cable. The Found New Hardware Wizard should start as shown below. Windows XP SP2 operating system will ask to allow it to search the internet for the proper software as shown- Select “No, not this time”. Follow the prompts for automatic installation of the software. 2-1 Section 2- Initial Set Up Intro Page: Windows XPSP2 All Windows Operating Systems Your NanoDrop 3300 should now be ready for operation. If the software does not start properly, refer to the Troubleshooting Section for possible solutions. Configuring the System Font The software is designed to look best with the MS Sans Serif font, 8 point. To check that the system font is set to the proper selection: Open the “Displays Properties” by right clicking on the desktop and select Properties Æ Appearance. (Additional step for Windows XP: click on the “Advanced” button). From item list select “icon”. Select the “MS Sans Serif (western)” font and select “8 point”. Click “OK”. Choosing an alternative font may result in some text being truncated in the operating software window. Software Upgrades Periodic upgrades are made to the operating software and are available for download. See our website for the latest available software version. Instrument / PC Connection To make measurements with the instrument, simply connect the USB cable to the backs of both the instrument and the PC. Registering Your Instrument Please register your product! We periodically update our software and add new features free of charge. We would like to keep our user list updated so that we may alert you to these upgrades and all 2-2 Section 2- Initial Set Up information supplied is completely confidential. You can register your instrument on our website. 2-3 Section 3-General Operation 3. General Operation The Sample Retention System The main steps for making a measurement are listed below: 1. With the sampling arm open, pipette the sample onto the lower measurement pedestal. 2. Close the sampling arm and initiate a measurement using the operating software on the PC. The sample column is automatically drawn between the upper bushing and the lower measurement pedestal and the measurement is made. Refer to the Common Module Functions for more details about initiating a measurement. 3. When the measurement is complete, open the sampling arm and blot the sample from both the upper bushing and the lower pedestal using low lint laboratory wipe. Cleaning the Sample Retention System Blotting the sample from the upper bushing and lower pedestal (as shown above) upon completion of each sample measurement is usually sufficient to prevent sample carryover and avoid residue buildup. However, if a sample has dried down on the pedestal leaving a residue, it may be removed by pipetting approximately 5 ul of 0.5 M HCl onto the pedestal, lowering the arm and letting it remain on the pedestal for 1-2 minutes. Wipe off the solution and pipet 5 ul of dH2O, lower the arm and then remove water with a lab wipe. Although generally not necessary, 2 ul water aliquots can be used to clean the measurement surfaces after particularly high concentration 3-1 Section 3-General Operation samples to ensure no residual sample is retained on either the pedestal or the bushing. It is recommended that the areas around the upper bushing and lower pedestal be cleaned (i.e. with water) after measuring a large number of samples. This will prevent the blotting after each measurement from carrying previous samples onto the measurement pedestals and affecting low-level measurements. A final cleaning of all surfaces with de-ionized water is also recommended after the user’s last measurement. Decontamination of Measurement Pedestals If decontamination is necessary, a sanitizing solution, such as a 0.5% solution of sodium hypochlorite (1:10 dilution of common commercial bleach – freshly prepared), can be used to ensure that no biologically active material is present on the measurement pedestals. The metal fiber optic fittings are made from 303 stainless steel and are resistant to most common laboratory solvents (see the Solvent Compatibility appendix). Sample Size Requirements Although sample size is not critical, it is essential that a liquid column is formed and the gap between the lower measurement pedestal and the upper bushing is bridged with sample. It is best to use a precision pipettor (0-2 ul) with precision tips to ensure that sufficient sample (1-2 ul) is used. Lower precision pipettors (0-10 ul and larger) are not as good at delivering 1 ul volumes to the measurement pedestal. If you are unsure about your sample characteristics or pipettor accuracy, a 2 ul sample is recommended. Sample Carryover Simple wiping of the upper bushing and lower measurement pedestal with a dry laboratory wipe is highly effective in preventing sample carryover. This is possible since the measurement pedestal is, in actuality, the highly polished end of a fiber optic cable. There are no cracks or crevices for residual sample to get trapped within. Sample Homogeneity Sampling from non-homogeneous solutions, particularly when using small volumes, can cause significant deviations in the data generated using all measurement technologies including fluorospectrometry. 3-2 Section 3-General Operation Bubbles must also be avoided since they can lead to erroneous signals. When dispensing samples, it is advisable not to dispel the full liquid (sample) content from the pipette tip and risk bubble introduction to the sample being measured. Effect of Evaporation and Volatile Solvents Normal evaporation of the sample during the measurement cycle usually has just a minimal effect on readings for aqueous samples. Highly volatile solvents, such as hexane, will likely evaporate before the measurement can be completed. Less volatile solvents such as DMSO can be used successfully. Software Architecture and Features Main Menu With the sampling arm in the down position, start the software by selecting the following path: Start Æ Programs Æ NanoDrop Æ ND-3300 [version] Application Modules The software has been tailored to meet the life scientist’s needs. It includes the following pre-coded application modules: • Nucleic Acid Quantitation - 33258 Hoechst dye, PicoGreen® dye, RiboGreen® dye, Quant-it™ DNA HS and Quant-It™ DNA BR methods. • Protein Quantitation - Quant-iT™ Protein, Fluorescamine, Fluoraldehyde™ OPA, and FluoroProfile™ assays, 3-3 Section 3-General Operation • Other Fluorophores - FITC (Fluorescein) (methods for using either the Blue or White LED), Cy3-Alexa Fluor® 555 and Cy5Alexa Fluor® 647, 4-methyl umbelliferone, quinine sulfate, DyLight 405, DyLight 488, DyLight 549, DyLight 633, DyLight 649 and DyLight 680. Create/Edit Method The Create/ Edit Method button, accessible from the Main Menu, gives the user the ability to configure new fluorescent dyes and methods, adding to those currently available. This button also allows the user to edit existing methods. Note: Diamonds indicate predefined methods that cannot be modified. The Create/Edit Method Section describes this feature in detail. Fluorescence Profiler The Fluorescence Profiler is designed to provide LED excitation selection guidance when the user is unsure of the excitation/emission profiles of a specific or unknown fluorophore. The Fluorescence Profiler Section describes this feature in detail. Data Viewer This module is designed to offer the user the ability to customize report structures, import archived data and re-plot archived data. The Data Viewer is described in detail in the section on Archived Data and Data Viewer. User’s Manual A .pdf version of this User’s Manual (Ctrl + M) is accessible from the Main Menu. It can also be accessed by selecting from the Help pull down menu in any application module or from Start Æ Programs Æ NanoDrop Æ ND-3300 (version) User Preferences Each user can select default settings for several features common to each application module. See the section on User Preferences for more information. Source Check This module is used to confirm that the respective LEDs are operational. 3-4 Section 3-General Operation Duplicate data storage The duplicate data storage option is selected using the User Preferences window to designate a secondary storage path. Account Management The Account Management module provides options for directing where specific data files are archived, allowing users to segregate their data into personal folders. The Account Management module is accessible to the administrator and level 10 users only. The module will be “grayed out” for all other users. Account Types There are three types of user accounts: • Level 10- is the highest security setting and any level 10 user can add new users, modify a user profile, delete a user account and set password options. At the time of software installation, the only level 10 account is “Administrator” whose initial password is “nanodrop”. It is strongly recommended that the password be changed after the initial account set up. Any user can be set to a level 10 access, although this is not recommended (see Level 5 below). Note: The administrator (or the last level 10 user) account may not be deleted. • Level 5- is the security setting recommended for an ordinary user account. An account with this access will be password protected and will be able to select specific user preferences. All data generated will be automatically archived in to the user’s account in c:\ND-3300 data (and the user specified location if that preference is selected). • Default- (Level 0 security) is the access level reserved for the Default account only. This account enables any user without an account to access all active software measurement modules. It is not password protected, however, user preferences can be set for this account. All data generated will be automatically archived into the Default folder within the c:\nanodrop data folder. Note: The administrator may disable the default user account for laboratories requiring unique user accounts. 3-5 Section 3-General Operation Account Log-in/Log-out and Time Out The user’s account will remain active until 1) the user logs out of his/her account by using the pull down box on the Main Menu to select either Default or another user name or 2) the user closes the software. A user account will also log out if the software “System idle timeout” is exceeded. After 4 hours of inactivity the software account will automatically revert back to the Default user. A screen will appear indicating that the time is about to expire, with a 30-second countdown. If the user elects CANCEL, the clock will reset and the user account and application module will remain active for another 4 hours. If the time expires, the open application module will close, returning to the Main Menu and the Default user. Account Lockout User-specific accounts can become locked out in several ways as noted below: • Failure to change password within the allotted time • Incorrectly entering the password 99 consecutive times • The administrator locks a specific account Only the administrator (level 10) can unlock a locked account. This is done by using the Modify User entry in the Account Management module. Note: All accounts (even the administrator) can be locked if the incorrect password entry occurs as described above. 3-6 Section 3-General Operation Change Password This module enables each user having an authorized account ID to change their respective password. This option is “grayed out” for the default user. Note: The administrator, using the Options entry in the Account Management module, establishes whether user passwords will expire and if so, after how many days. Passwords.log file This file contains the User ID & password for all accounts and is readable only by the software. It can be found in the C:\ND-3300 Data\log files folder. It is strongly recommended that the administrator make a copy of that file and store it in the same log files folder as described above each time a new user account is added or a password is changed. If the administrator’s account becomes locked, the up-to-date copy can be renamed and used as the password.log file. 3-7 Section 4-Create/Edit Method 4. Create/Edit Method Method Name The Method is the unique name used for both inherent fluorophores (e.g., FITC) and named applications (e.g., PicoGreen). Five (5) buttons at the bottom of the Method List in the Method Editor are used to configure, change, remove, and save new methods. Note: Diamonds indicate predefined methods which cannot be modified (see figure below). Create New Method To add a new method, highlight any method and click on Create Method. A new window will appear that requires the user to select the source LED desired. 4-1 Section 4-Create/Edit Method The excitation source options include: • • • UV LED: excitation maximum 365 nm Blue LED: excitation maximum 470 nm White LED: 460-650 nm excitation In addition, the user may elect to turn on or turn off the Auto Gain feature which controls the length of excitation gain based on fluorescent signal intensity. The current default setting of auto gain selected is recommended. Note: It is recommended that the user select the Auto Gain feature as the default setting. The alternative to Auto Gain is Fixed Gain which sets the excitation gain using a factor between 0 and 10. Refer to Common Module Functions for more information on gain. Selecting the Next button will bring up the following screen: 4-2 Section 4-Create/Edit Method Use this screen to select the wavelengths of interest, the standard curve type, the default units and the analysis type. Standard Curve Type: Determines the default standard curve fitting method. Choices include: • • • Interpolation: linear interpolation between adjacent standards. Linear 2nd or 3rd order Polynomials Note: The operator may also change the standard curve fit type using the toggle button on the standard curve page within each module. Default Units: There are six pre-configured choices of concentration units. The user may toggle to the Add New option to include additional types of units. Analysis type: options include either 1 point or Formula. If 1 point is selected, the fluorescence value returned by the fluorescence acquisition module is simply the RFU at one wavelength. If this control is set to formula, the fluorescence value displayed, archived and used for concentration calculations will be determined by the relationship between 2-4 wavelengths as defined by the formula. If the White LED is chosen as the excitation source, the following screen will appear: 4-3 Section 4-Create/Edit Method ∆λ The virtual emission filter interval (∆λ) is the respective wavelength range over which the residual signal (with scaled background compensation removal), is displayed and calculated. It is symmetrically applied around the analysis nm (emission wavelength) selected. All fluorescence readings outside the virtual filter interval are set to zero. The default interval is ± 20nm. Note: The analysis wavelength cursor can be manually adjusted by ± 20 nm of the analysis wavelength within the measurement module. This applies to the locked methods as well. The final screen for all excitations source selections is shown below: 4-4 Section 4-Create/Edit Method Use this screen to name the method, assign it to a category and set the following two options: • Graph Min. nm: minimum wavelength (nm) for the x-axis of the fluorescence spectral plot. • Graph Max nm: maximum wavelength (nm) for the x-axis of the fluorescence spectral plot. Edit Existing Method Methods with a black diamond next to them are protected and cannot be edited. All other methods may be edited at any time by highlighting the method name and hitting the Edit Selected button. The following screen will appear. 4-5 Section 4-Create/Edit Method The user may move to the appropriate window by using the top tabs and edit only the parameters of interest. The user may also edit a method from within the acquisition module by using the Edit drop down box. View Selected This button allows the user to review the parameters of a method but will not save any changes. 4-6 Section 5-User Preferences 5. User Preferences Selecting the User Preferences module will bring up a page with three main tabs. General Settings The General Settings tab displays several parameters that the user may define as default settings. • Acquisition Set-up Enables the user to select from the following options when setting up the acquisition page: • Display of raw data for each measurement • Display of advanced parameters such as saturation nm, minimum blank gain and maximum gain ratio with every measurement. • Activation of the beep associated with the measurement cycle • Auto scale of the y axis after every measurement. • Prompt the user prior to closing the Data Viewer. • Confirmations Enables the user to choose whether or not the software displays a dialog box for the following: • Confirmation of units used for standards • Notification of measurements that do not meet the specified minimum blank gain or maximum gain ratio values as defined in the Gain Notification Settings box. 5-1 Section 5-User Preferences • Gain Notification Settings The term gain is used to refer to the amount of time the sample is excited. Time is therefore used to maximize the signal to the CCD detector while preventing detector saturation. A value of 10.0 corresponds to the maximum gain or excitation time maximum of 1 second (1000 msecs). Note: The settings may also be changed from within each module by displaying the advanced parameters and modifying the gain values. Modifying the settings from within the module will not change the default settings used for other methods or for the current method once the module is closed. Min. Blank Gain- individually set for each LED This setting determines the minimum gain that the software will use for reference or “blank” measurements without triggering a Low Blank Gain pop-up message. Usually the most appropriate default setting is “5” for the Blue and White LED’s and “10” for the UV LED. Increasing the Min. Blank Gain value for either the Blue or the White LED is appropriate when the user wants to ensure higher gain values for blank measurements. Reducing the Min. Blank Gain setting to a value of less than 5 may be preferred if the user finds that blank measurements always result in low gain values- even when the pedestal area is clean of all dust or lint. • • Max. Gain Ratio This factor compares the actual gain used for the sample measurement to the actual gain used for the blank measurement. If the ratio exceeds the Max. Gain Ratio setting, a message will appear prompting the user to either accept or reject the data when measuring low fluorescence samples. Visual inspection of the sample’s emission spectrum can aid in the decision making process. The default setting for the Max. Gain Ratio is 3. Note: The Gain Notifications function must be enabled for the settings to be utilized. Save all selections by clicking the Save Preferences button before exiting the User Preferences window. 5-2 Section 5-User Preferences Archiving Data All data is automatically archived at C:\ND-3300 Data Æ User name Æ Application Module (Hoechst dsDNA, PicoGreen dsDNA, RiboGreen RNA, etc.) In addition to the primary data storage, users may elect to save their data to an additional location using the Archiving Tab. This is accomplished by setting the Duplicate data storage box to On and then choosing the file path by clicking on the file folder icon under Duplicate Data Folder. Save the alternative path by clicking on the Save Preferences button before exiting the User Preferences window. 5-3 Section 5-User Preferences Reports The default setting for saving data in a report is for Auto Report to be enabled. The user may choose to deselect this option using the Change Settings button. The same button also allows the user to select a previously saved report column configuration as the default for particular methods. This feature is only available when there are stored alternate report formats to choose from. Save all selections by clicking the Save Preference button before exiting the User Preferences window. 5-4 Section 6- Fluorescence Profiler 6. Fluorescence Profiler The Fluorescence Profiler module is designed to provide LED excitation selection guidance when the user is unsure of the excitation source/emission profile of a specific or unknown fluorophore. The following window will appear after choosing the Fluorescence Profiler module from the Main Menu: As indicated in the left hand panel- the user begins by blanking with water or the appropriate buffer solution. When a blank has been stored, the software will automatically move forward to the Measure window. The user cleans away the water or buffer by blotting the sample with a dry laboratory wipe and then loads 1-2 ul of the sample of interest. Click measure to automatically excite the sample sequentially with the three LEDS and display their respective emission profiles. Note: A minimum threshold of 30 RFU is required for detection. 6-1 Section 6- Fluorescence Profiler The software will then display the prominent peaks above the specified minimum RFU and automatically select the LED source yielding the highest fluorescent signal as the optimal LED source. When there is significant fluorescence produced from more than one of the LEDs, the software automatically selects the LED producing the largest RFU signal. The user may review the various emission peaks by scrolling through the box labeled Possible Sources. If more than one LED generates a fluorescence signal, the user can save more than one method by giving each method a unique name. The Back and Next arrows may be used at anytime to take a new blank, make a new measurement or move forward to save the information as a new method (see figure below). 6-2 Section 7- Common Module Functions 7. Common Module Functions Module Startup Each module (or application) is accessible starting from the Main Menu. All sample data will automatically be logged in the appropriate archive file. The acquisition window shown below is representative for all application modules for which a protocol is available in the software. If a protocol is not available, the Open Protocol button will not be displayed. Acquisition Page Functions • Blank (F3) Before making a fluorescent measurement, a blank (using water or the buffer, solvent or carrier liquid the sample of interest is in) must be measured and stored. It is not necessary to blank between every sample. • Measure (F1) Each time a software module is opened, the Measure button is inactive as noted by its “grayed-out” appearance. A blank must first be measured before the Measure button will become active. The Measure button is used to initiate the measurement sequence for all samples (non-blanks). It is activated by depressing the F1 key or clicking the Measure button. 7-1 Section 7- Common Module Functions • Re-blank (F2) The Re-blanking option (F2) establishes a new reference (blank) that is used for the calculations of subsequent samples. However, unlike the Blank (F3) function, the Re-blank feature recalculates the fluorescence spectrum for the most recent sample and displays this on the screen. • Print Screen (F4) The Print Screen button will print a copy of the current operating screen to the default printer attached to the operating PC. • Print Report (F5) Selecting the Print Report (F5) button will print the existing sample report to the default printer. It does not clear the sample report contents. The user also has options as to how the buffer is handled (automatically clear upon printing, prompt before clearing, etc.) See the section on Archived Data and Data Viewer for additional details. All data is stored in the archive file at C:\ND-3300 Data Æ User name Æ Application Module (Hoechst dsDNA, PicoGreen dsDNA, RiboGreen RNA, etc.) • Recording (F6) The default setting has the Recording feature activated which automatically records in a report format. See the section on Archived Data and Data Viewer for additional details. Note: To override this feature, click on the Recording button. Once de-selected, the button will read Start Report. • Show Report (F7) The user can display the entries comprising the current Sample Report at any time by selecting the Show Report button. This function will enable the Data Viewer software described in the section on Archived Data and Data Viewer. Parameters specific for the individual application modules are populated for each individual Sample ID. • View Standard Curve All applications or modules include an optional Standard Curve functionality. In addition to the measured RFU output, the user can generate a standard curve using a reference and up to 7 standard concentrations (1 to 5 replicates per point). • Open Protocol Selecting this button will open the method protocol directly from the data acquisition page. This button will only display on the acquisition pages of methods for which a protocol is available. 7-2 Section 7- Common Module Functions • Reset Window Clicking on this button will give the user the option of resetting the values of all standards for the current measurement session. Clearing all points will also allow the user to change the units of measure. • Method The method name specifies which application is in use. • Source The Source field specifies the excitation source used for the method selected. Note: The source cannot be changed for pre-defined, protected methods. • Measurement Type Reference is used for a non-analyte solution, Standard for a known concentration of reagent, and Sample for an unknown concentration of the sample of interest. Note: The module will always output RFU (relative fluorescent units) even when a standard curve is not generated. • Sample ID The Sample ID is highlighted for overtyping or barcode scanning. The user may input a sample ID that will be used to identify the measurement in a report print and in the archived data file. The sample ID entry is key-focused, meaning it is the default selection on the screen and should have a flashing text cursor when the instrument is waiting to make a new measurement. Note: The sample ID name can be changed only by using the Data dropdown box on the reports page. • Dilution Factor This parameter is displayed within the Measurement Type box once a standard curve has been generated. The concentration automatically calculated from the standard curve will be multiplied by the indicated dilution factor and displayed on the bottom right corner of the window. The default value for the dilution factor is 1. 7-3 Section 7- Common Module Functions • Sample # This box keeps count of the number of samples measured. Generating a Standard Curve • Measurement Type: Standards tab When the Standards tab is selected under Measurement Type from the main acquisition page, the user will initially see only the Reference and Standard 1 options displayed. The option to change units of measure from previously defined units is also displayed. • Units Confirmation If units were not changed when the Standards tab was initially selected, the following window will appear prior to measuring the first reference or standard: 7-4 Section 7- Common Module Functions • Additional Standards After the initial measurement is made for Standard 1, the user may choose to continue making measurements of Standard 1 or select, define and measure the next standard. The option to return to a standard and make additional measurements is available at any time. When the minimum of a reference and one standard or two standards has been measured the orange button on the top panel will turn green. This only indicates that the minimum number of standards has been measured to display a valid curve. • Excluding or Deleting Standard Curve Data Points The user may exclude points by viewing the standard curve and selecting the data point to be deleted in the table and then clicking on the Delete Point button. • Standard Curve Types There are three Standard Curve Type options. • • • Linear 2nd or 3rd order Polynomials Interpolation: Linear interpolation between adjacent standards. The standard curve type may be changed using the Standard Curve Type toggle button located on the standard curve page of each module. 7-5 Section 7- Common Module Functions Linear Curve Polynomial Curve File There are three options available from the File tool bar drop down menu • Page Setup Displays options to customize page setup for report printing. • Print Window A Print dialogue can be initiated from the File pull-down menu or by typing Ctrl+P. The user can specify which networked printer to use from the Print dialogue. A non fatal error message will appear if the PC is not connected to a printer. • Save Window The current screen can be saved as a .jpg image file by selecting Save Window from the File pull down menu. Edit Options for editing non-protected methods as well as cutting and pasting sample ID information are available from the Edit tool bar drop down menu. 7-6 Section 7- Common Module Functions Configuration There are five options controlled by the Configuration tool bar pull down feature as shown below: Each of these options may also be set by selecting the General Settings tab in the User Preferences module. • Silent Operation The instrument has a default setting to make a beep at the end of each measurement. The user may choose to silence this operation using the Configuration feature. • Auto Scale Plot The drop-down allows for the option of having the software automatically scale a plot. • Show Raw Plot Another option available in the Configuration drop-down is the choice of displaying either just the RFU plot or a spectrum showing the blank, raw and RFU plots. Note: The spectrum with raw data displayed uses two scales. The right hand scale displays counts and is used for both the blank and raw data. The left hand scale reports the difference between the blank and raw and is reported as RFU. The two scales can be modified independently by overtyping the top value. • Show Advanced Parameters This option controls the choice to display all available parameters on the main screen. With advanced parameters displayed, the main acquisition page will appear as shown below: 7-7 Section 7- Common Module Functions Advanced Parameters include the following: • Min Blank Gain- Individually set for each LED. This parameter determines the minimum excitation time used for making reference or “blank” measurements. The default setting of “5” is usually the most appropriate for both the Blue and White LEDs. The default setting of “10” is the most appropriate for the UV LED. • Max Gain Ratio- This factor compares the actual gain used for the sample measurement to the actual gain used for the blank measurement. If the ratio exceeds the Max Gain ratio setting, a message will appear prompting the user to either accept or reject the data. If the spectral image is particularly distorted or has very narrow emission profiles, it is best to reject the measurement and remeasure with a fresh sample. The signal (RFU) is always displayed and can be used to assess the validity of the message. The default setting is 3. • Saturation nm The operating software automatically limits the amount of time the LED source is on in order to prevent too much light from saturating or flooding the spectrometer detector for all wavelengths above the user selectable setting termed “Saturation nm”. The default setting is 25nm below the selected emission wavelength for the Blue and UV LEDs and 40 nm below the emission wavelength for the White LED. The user may 7-8 Section 7- Common Module Functions find that for a particular application, choosing a saturation nm nearer the emission nm of interest may result in longer excitation times and higher sample fluorescence readings. The software will not prevent saturation for wavelengths below the selected Saturation nm. Note 1: The Saturation nm setting is only displayed if selected. The user may select this option using the configuration drop down box. Note 2: The fluorescence signal from the sample fluorophore (emission wavelength) is never allowed to saturate the detector when the Auto Gain setting is active. Note 3: When Fixed Gain is active (i.e. when the user defines the excitation time), it supersedes the Saturation nm setting. This can result in saturation at any wavelength of the spectrum including the fluorophore of interest. • Prompt Close Data Viewer The final option controlled by the Configuration drop down menu is the choice to be prompted prior to closing the Data Viewer. Standard Curves Use this pull down menu and select either Save As (Ctrl+A) to save a standard curve or Load (Ctrl+L)to load a previously saved curve. Show Context Help (Ctrl+H) Context Help is enabled in the Main Menu, all function modules, and all Application modules. The help feature is enabled by choosing Show Context Help from the Help menu or by selecting Ctrl+H. Once enabled, placing the cursor on elements of the screen will automatically generate an explanation of that element. Context Help remains active until the user deselects it. 7-9 Section 7- Common Module Functions Gain The excitation sources are activated for a sample specific period of time to maximize their respective emission. The term gain is used to refer to the amount of time the sample is excited. Time is therefore used to maximize the signal to the CCD detector while preventing detector saturation. • Auto/Fixed Gain Auto / Fixed Gain are the two options for setting the gain or excitation time and are selected via the Create/Edit method module. When the Auto Gain (default) mode is used, the source (LED) illumination (excitation) time is optimized for each sample. The Actual Gain value for the respective sample will be displayed in this mode. A value of 10.0 corresponds to the maximum gain or excitation time maximum of 1 second (1000 msecs). The Fixed Gain option is selected when constant gain or excitation time is wanted for every sample. Fixed Gain settings range from 0.1 to 10.0 in 0.1 increments. Note: RFU signals for all gain settings are normalized for the actual time of measurement. The Auto Gain feature is activated or deactivated via the Method Editor module. RFU at XXX nm This is the relative fluorescence output at the wavelength specified for the method (user settable cursor). The user may move the cursor + 20 nm of the analysis wavelength. λ∆ For White LED excitation, the virtual emission filter interval (∆λ) is the respective wavelength range over which the residual signal (with scaled background compensation removal), is displayed and calculated. It is symmetrically applied around the Analysis nm (emission wavelength) selected. All fluorescence readings outside the virtual filter interval are set to zero. The Default interval is ± 20nm and may be modified using either the Method Editor module or from 7-10 Section 7- Common Module Functions within the respective fluorescence (method) module. See the section on Create/Edit Method for further details. Note: The baseline for non-analyte (non-fluorescent) samples can exhibit significant non-uniformity and irregularity with the virtual filtering algorithm. The greatest effect is on the detection limits (sensitivity) for low-concentration fluorophores. Fluorescence of concentrated solutions, where the fluorescence intensity is significantly greater than the non-analyte background fluorescence, can be measured with good reproducibility. Working with more concentrated solutions for fluorophores such as Cy3 or Alexa Fluor 555, where the excitation maximum (555 nm) is also the maximum emission of the White LED, can overcome the baseline nonuniformity. Units This term refers to the way a sample concentration is expressed based on a standard curve. It is only populated when a standard curve is utilized. The operator can choose which unit configuration to use in several ways. The Create/Edit Method module allows a unit choice as a default selection while the method page allows for interactive changes in the selection. Escape Key (ESC) The escape key is set to exit out of all screens. Hitting the escape key twice will log the user out of an application module. Exit (Ctrl+Q) This command closes all application modules and supporting options. After clicking the Exit button, the user has 10 seconds to cancel the exit command. If no action is taken within 10 seconds, the exit command is carried out. Note: All measurement data is automatically saved to an archive file and requires no user action. 7-11 Section 8 Nucleic Acid Quantification 8. Nucleic Acid Quantification Pre-Coded Applications There are six pre-coded applications within this module for determining nucleic acid sample concentrations: • • • dsDNA 33258 Hoechst dye dsDNA PicoGreen® dye Quant-It™ DNA BR • • • Quant-It™ DNA HS RNA RiboGreen® dye Sybr® Green I Once a specific, pre-coded application has been selected and opened, the user may access the corresponding protocol directly from the data acquisition page. In addition, the user may create and save other methods for nucleic acid quantification by using the Create Method feature within the Create/Edit Method Module. See the section on Create/Edit Method for a more detailed explanation. dsDNA 33258 Hoechst This application is configured to measure fluorescence of the Hoechst dye, which is greatly increased upon binding to double-stranded (ds) DNA. Fluorescence of the Hoechst-dsDNA complex can be measured at an emission maximum of 450 ± 20 nm following excitation by the UV LED. Using 2 ul samples, sensitivity for the Hoechst assay is approximately 150 picograms and the linear range is from 75 ng/ml to 1500 ng/ml. Performance data for this assay can be found on our website. 8-1 Section 8 Nucleic Acid Quantification dsDNA PicoGreen® (dye) This application is configured to measure fluorescence of PicoGreen® dye, which is greatly increased upon binding to double-stranded dsDNA. Fluorescence of the PicoGreen® dsDNA complex can be measured at 525 ± 20 nm using the Blue LED excitation. Using 2 ul samples, sensitivity for the PicoGreen® assay is approximately 2 picograms and the linear range is from 1 ng/ml to 1000 ng/ml. Performance data for this assay can be found on our website. RNA RiboGreen® (dye) This application is configured to measure fluorescence of RiboGreen® dye, which is greatly increased upon binding to RNA. Fluorescence of the RiboGreen® RNA complex can be measured at 525 ± 20 nm using the Blue LED excitation. Using 2 ul samples, sensitivity for the RiboGreen® assay is approximately 10 picograms. It is best to use two distinct dye stock working concentrations to cover a linear range of 5 ng/ml to 1000 ng/ml. Performance data for this assay can be found on our website. 8-2 Section 8 Nucleic Acid Quantification Quant-iT™ DNA BR The Quant-iT™ dsDNA Broad Range Assay is a fluorescent nucleic acid stain for quantitating minute amounts of double-stranded DNA (dsDNA). When used with the NanoDrop 3300, this assay provides a highly sensitive means of dsDNA quantitation with minimal consumption of sample. Fluorescence of the Quant-iIt™ dsDNA BR complex can be measured at 523 ± 20 nm using the Blue LED excitation. Using 2 ul samples, sensitivity for the Quant-iT™ dsDNA Broad Range assay is approximately 20 picograms and the linear range is 10 ng/ul to 5000 ng/ul. 8-3 Section 8 Nucleic Acid Quantification Quant-iT™ DNA HS The Quant-iT™ dsDNA High Sensitivity Assay is a fluorescent nucleic acid stain for quantitating minute amounts of double-stranded DNA (dsDNA). When used with the NanoDrop 3300, this assay provides a highly sensitive means of dsDNA quantitation with minimal consumption of sample. Fluorescence of the Quant-iT™ dsDNA BR complex can be measured at 530 ± 20 nm using the Blue LED excitation. Using 2 ul samples, sensitivity for the Quant-iT™ dsDNA High Sensitivity assay is approximately 2 picograms and the linear range is 1 ng/ml to 500 ng/ml. Sybr® Green I The Sybr® Green I dye is a fluorescent nucleic acid stain for quantitating double-stranded DNA (dsDNA). When used with the NanoDrop 3300, this assay provides a highly sensitive means of dsDNA quantitation with minimal consumption of sample. Fluorescence of the Sybr® Green I dsDNA complex can be measured at 527 ± 20 nm using the blue LED. Using 2 ul samples, sensitivity for the Sybr® Green I assay is approximately 2 picograms and the linear range is 1 ng/ml to 1000 ng/ml. 8-4 Section 8 Nucleic Acid Quantification . 8-5 Section 9 Protein Quantification 9. Protein Quantification Pre Coded Applications There are four pre-coded applications within this module for determining protein sample concentrations. • • • • Fluorescamine FluoroProfile® Fluoraldehyde™ OPA Quant-iT™ Protein Once a specific, pre-coded application has been selected and opened, the user may access the corresponding protocol directly from the data acquisition page. In addition, the user may create and save other methods for nucleic acid quantification by using the Create Method feature within the Create/Edit Method Module. See the section on Create/Edit Method for a more detailed explanation. Fluorescamine The Fluorescamine protein dye is a fluorescent stain for quantitating minute amounts of protein and peptides in solution. The Fluorescamine reagent reacts rapidly with primary amines. Using this assay with the NanoDrop 3300 will provide a highly sensitive means of protein quantitation with minimal consumption of sample. When activated with the UV LED (365 nm) the fluorescence of the protein-dye complex has an emission wavelength of 470 ± 20 nm. The sensitivity of the Fluorescamine protein assay is 8 ug/ml and the linear range is 8 ug/ml 500 ug/ml. 9-1 Section 9 Protein Quantification FluoroProfile® The FluoroProfile® protein dye is a fluorescent stain for quantitating minute amounts of protein in solution. Using this assay with the NanoDrop 3300 will provide a highly sensitive means of protein quantitation with minimal consumption of sample. The FluoroProfile protein dye consists of the natural product, eppicocconone. When activated with the Blue LED (470 nm) the fluorescence of the protein eppicocconone complex has an emisision wavelength range of 614 nm ± 20 nm. The sensitivity of this assay is 3 ug and the linear range is 3 ug/ml - 100 ug/ml. Larger ranges may require the use of a 3rd order polynomial curve, while extended incubation times may enhance linearity at higher protein concentrations. Fluoraldehyde™ OPA The Fluoraldehyde™ OPA assay offers a rapid fluorescent detection of minute amounts of proteins and peptides in solution. When used with the NanoDrop 3300 this assay provides a highly sensitive means of protein quantitation with minimal consumption of sample. The fluorescence can be measured at 455 ± 20 nm using the UV LED. A wide dynamic range for the assay is obtained by utilizing two distinct sample-to-reagent volumes. Using 2 ul of sample mixed with 20 ul of reagent yields a sensitivity of 15 ug/ml and a dynamic range of 15 ug/ml to 1000 ug/ml. The sensitivity of the assay is increased to 1 ug/ml and the linear range extended to include the 1 ug/ml - 50 ug/ml range when a higher sample-to- reagent volume is used. Refer to the assay protocol for more information about the dilutions required for specific ranges. 9-2 Section 9 Protein Quantification Quant-iTTM Protein Assay The Quant-iTTM protein assay is a fluorescent stain for determining minute amounts of protein in solution. When used with the NanoDrop 3300 this assay provides a highly sensitive means of protein quantitation with minimal consumption of sample. The fluorescence can be measured at 600 ± 20 nm using the Blue LED. It is necessary that two distinct dye stock working concentrations and a third order polynomial curve be used to cover a dynamic range of 5 ug/ml to 500 ug/ml. Using 2 ul samples, sensitivity for the Quant-iTTM protein assay is approximately 10 nanograms Performance data for this assay can be found on our website. 9-3 Section 9 Protein Quantification 9-4 Section 10-Other Fluorophores 10. Other Fluorophores There are eleven pre-coded methods contained within this module: • • • • • • Fluorescein, FITC, FAM Cy3,Alexa Fluor® 555 Cy5,Alexa Fluor® 647 Quinine Sulfate 4-methyl umbelliferone DyLight 405 • • • • • DyLight 488 DyLight 549 DyLight 633 DyLight 649 DyLight 680 The option is available to create and save other methods by using the Create Method feature within the Create/Edit Method Module. See the section on Create/Edit Method for a more detailed explanation. Blue LED Methods • DyLight 488 - This application is designed to measure the fluorescence of DyLight 488 at 518 nm ± 20 nm when it is bound to the molecule of interest. It is spectrally similar to Alexa Fluor 488 and Cy2 • Fluorescein, FITC, FAM - This application is configured to measure the fluorescence of Fluorescein (FITC) at 515nm ± 20 nm. Unlike the Nucleic Acid & Protein dyes described earlier, Fluorescein is naturally fluorescent. After covalent attachment of FITC to the molecule of interest, FITC-labeled reagent must be separated from unbound fluorophore before taking a measurement. A sample spectrum using FITC excited by the Blue LED is shown below: 10-1 Section 10-Other Fluorophores UV LED Methods • DyLight 405 - This method is designed to measure the fluorescence of the DyLight 405 dye at 400 nm ± 20 nm when it is bound to the molecule of interest. It is spectrally similar to Alexa Fluor 405 • Quinine Sulfate - This method is designed to measure the inherent fluorescence of quinine sulfate. Fluorescence of quinine sulfate is measured at 450 nm± 20 nm nm • 4-Methyl Umbelliferone, (4-MU) - This method measures the fluorescence of enzymatic cleavage products containing 4-methyl umbelliferone at 450 nm ± 20 nm. Detection of 4-methyl umbelliferone may be used as a sensitive, quantitative assay for ß–galactosidase or other enzymes that cleave substrates linked to 4-MU. Cleavage of 4-methyl umbelliferyl-ß-D-galactoside by ßgalactosidase yields the fluorescent molecule 4-methyl umbelliferone (7-hydroxy-4-methylcoumarin, 4-MU). Note: 4-methyl umbelliferone is fluorescent only above pH 8. A sample spectrum using 4 MU excited by the UV LED is shown below: 10-2 Section 10-Other Fluorophores White LED Methods • Cy5 Alexa Fluor® 647 - This method measures the fluorescence of Cy5 or Alexa Fluor 647 at 670 nm ± 30 nm. Unlike the Nucleic Acid & Protein dyes described earlier, these fluorophores are naturally fluorescent. After covalent attachment of the fluorophore to the molecule of interest, the fluorophore-labeled reagent must be separated from unbound fluorophore before taking a measurement. • DyLight 549 - The DyLight 549 method is designed to measure the fluorescence of DyLight 549 at 568 nm ± 20 nm when bound to the molecule of interest. It is spectrally similar to Alexa Fluor 555 and Cy3 • DyLight 633 - The DyLight 633 dye is spectrally similar to Alexa Fluor 633. This method measures the fluorescence of DyLight 633 at 658 nm ± 20 nm when it is bound to the molecule of interest. • DyLight 649 - This method is designed to measure the fluorescence of DyLight 649 at 674 nm ± 30 nm when it is bound to the molecule of interest. It is spectrally similar to Alexa Fluor 647 and Cy5. • DyLight 680 - The DyLight 680 method is configuredd to measure the fluorescence of DyLight 680 at 715 nm ± 30 nm when bound to the molecule of interest. It is spectrally similar to Alexa Fluor 680. 10-3 Section 10-Other Fluorophores • Cy3, Alexa Fluor® 555 - The Cy3, Alexa Fluor 555 method is configured to measure the fluorescence of Cy3 or Alexa Fluor® 555 at 565 ± 20 nm. Unlike the Nucleic Acid & Protein dyes described earlier, these fluorophores are naturally fluorescent. After covalent attachment of the fluorophore to the molecule of interest, the fluorophore-labeled reagent must be separated from unbound fluorophore before taking a measurement. A sample spectrum using Alexa 555 excited by the White LED is shown below: Performance data for many of these fluorophores are available on our website. . 10-4 Section 11-Archived Data and Data Viewer 11. Archived Data and Data Viewer Sample data from all application modules is automatically stored in archive files and can be opened by either the integrated Data Viewer software program or spreadsheet programs such as MS Excel. Archive File Creation Every time an application module is started, an application-specific archive file is created for the user that is logged in. All measurements made by the user (in that application module) for a given calendar day are stored in a single archive file. These files bear the name of the respective application module with the date appended. For example, an archived file entitled “PicoGreen-dsDNA 2006 10 10.nfd ” corresponds to PicoGreen® assay data from the software session that was generated on October 10, 2006. A unique file extension (.nfd) has been given to these files to enable automatic startup with spreadsheet formats or by importing into Data Viewer (see Data Viewer later in this section). The data may be edited and/or reformatted and stored under names of the user’s choice. The spectrum can be re-plotted from the wavelength data if needed for further analysis. Note1: Fluorescence data shown in archive files are represented as they are displayed on the screen. Note 2: For data from all modules, a column entitled Measurement Type is included. For each measurement, this column will contain Measure, Blank, or Re-blank. If the value is Measure, then the values in that row are from a normal measurement that has utilized the stored blank value. If the value is Blank, it indicates that the measurement is the initial blank recorded. If the value is Re-blank, it is the re-analysis of the previous measurement with a new blank. Data Storage Hierarchy The hierarchy for archive files is as follows: 11-1 Section 11-Archived Data and Data Viewer C:\ND-3300 Data Æ User name Æ Application Module (Hoechst dsDNA, PicoGreen dsDNA, RNA RiboGreen, etc.) User-Defined Archive File Location In addition to the primary data storage, users may elect to save their data to an additional location. This option can be chosen under the Archiving Tab in User Preferences on the Main Menu by setting the Duplicate data storage box to On and then choosing the file path by clicking on the file folder icon under Duplicate Data Folder. Save the alternative path by clicking on the Save Preferences button before exiting the User Preferences window. All data is written to the archive file immediately upon completion of the measurement. Inadvertent software or PC shutdowns should not affect the archive file. Data Viewer Data Viewer is a versatile data reporting software program incorporated into the operating software that offers the user the ability to customize report structures, import stored data and re-plot data from previously generated data. Using the Data Viewer is the most expedient method to review data. This feature may be accessed during measurement sessions from the Show Report function found within each method module. Accessing the feature via the Main Menu is used to import and review previously archived data and also allows the software to be utilized as a stand alone feature (i.e. when a NanoDrop 3300 is not connected to the PC). Data Viewer Features The Data Viewer is composed of two or three pages in a tabular form consisting of Plots, Reports and Standard Curves (where utilized). The user may access any page by clicking on the tabs. The software opens to the Plots page (see Plots later in this section) whether accessed through the Main Menu or Show Report. Note: 11-2 Section 11-Archived Data and Data Viewer Recording rather than Start Report must be selected in order to access the Data Viewer via Show Report. Tool Bar Features common to all three pages include: • Configuration: Options controlled by this tool bar function include Auto Scale, Include graph in printout and Include standards in printout. • Data: Includes options to import data (Ctrl+I), rename samples (Ctrl+N) and delete sample data (Ctrl+D). Note: After deleting all samples, it is important to exit out of the Data Viewer module and reenter if importing data for a different application type. • Report: This tool bar function allows the user to select columns of interest to be included in a report. See Reports Page later in this section for more detail. • File Page Set-up: Allows the user to define the page set up for printing out the spectra, the report and the standard curve. • Print Window: The current Plot, Report, or Standards screen may be printed by selecting Print Window or Ctrl +P. • Save Window: Saves files as .jpgs. • Help/Context Help: This feature is enabled in the Main Menu, all function modules, and the application modules. The help feature is enabled by choosing Show Context Help from the Help menu pull down or by selecting Ctrl+H. Once enabled, placing the cursor on elements of the screen will automatically generate an explanation of that element. Context Help remains active until the user deselects it. Import Accessing the Data Viewer via the Main Menu allows the user to import archived data. Use the Data drop down tool on the top menu bar to select Import Samples (Crtl+I). This will bring up a new window with an Import Folder box and a Directory Tree. 11-3 Section 11-Archived Data and Data Viewer Features include: Import Folder: Used to select folder where data is to be imported from. Folder selection must be at the level of user or higher. Directory Tree: Used to select specific data to be imported. Clicking on the square to the left of each file name will provide further detail to each level. Users may choose to select either individual samples within a file or the entire file. All import selections must be of the same application or method type. >>> or <<<: Used to move the highlighted sample choices to or from the Selected Samples box. Search: Function allows the user to locate specific data by searching through sample ID names. Note: This function is case sensitive. Sample Information and Spectrum: Are populated with the information associated with the most recently highlighted sample. Import and Return: Uses selected sample data to populate Plots and Reports windows and then returns to the Plots window. Note: Holding down the shift or control PC function keys will allow the user to select multiple samples and/or files for importing. The keys can also be used to deselect multiple samples as shown in the image above. Plots The Plots page displays selected sample spectra. 11-4 Section 11-Archived Data and Data Viewer Features include: Method: Auto fills in module name. Date: Auto fills in date and time of report. Selected Plot: There are two methods of selecting or highlighting individual sample data. The user may simply move the cursor over the plot of interest and click or use the Selected Plot drop down box (which will also display the legend). The selected sample will show up as a bold plot line. Plots/Sets: Users may select the maximum number of individual plots (up to 20) graphed per page. Although a report can hold data for an unlimited number of samples, a graph page is limited to 20 plots. Additional sample spectra are displayed on new plot pages. Each page is then referred to as a set. Legend: Positioning the cursor over the legend box will bring up a visual display matching the sample name to a plot color. The user is not able to select or highlight a sample from the legend. Sample information: Automatically populates with data associated with selected sample. Data displayed is appropriate for data type chosen. Note: Information is based on data collected at the time the sample was measured and is not modified by a change in cursor position on the Data Viewer real time display. Movable x and y axis: available for all data types. If the cursor is out of view in either direction- rescale the axis by typing over one of the outer limit numbers. The cursor RFU information displayed at the bottom of the page is determined by the position of the movable 11-5 Section 11-Archived Data and Data Viewer cursors. The movable X determines the baseline from which the peak of the Y position is calculated. Reset Baseline will reposition the x axis back to zero. Reports The Reports page displays the data for selected samples in a table format. The user may modify column configurations for each method type and save multiple customized formats by using the drop down Report options. Report tool bar drop down options include: Configure Report (Ctrl+F): Used to select parameters to include on a report. Sort Report (Ctrl+T): Allows users to sort data by column (exampleby date or sample name). Save Report Format: Saves specific report in appropriate data type folder. All files saved with .nfd extensions even if “all files” is chosen. To designate a saved report format as the default format, exit to the Main Menu, choose Users Preferences and click Change settings. A list of the various saved formats available for the specific method type will be displayed. Load Report Format (Ctrl+G): Allows saved report formats to be loaded either before or after data is imported. Print Report (Ctrl+R): Will print out only the Report page by default. Users may choose whether or not to print out the standards or plots pages by selecting these options under the Configure drop down on the tool bar. 11-6 Section 11-Archived Data and Data Viewer Save Report (Ctrl+S) and Load Report (Ctrl+L): There are several choices for this option as seen in the following window: Using the Full Report option will allow the user to use the Data Viewer to reload the report at a later date. The saved report may be recalled using the pull down Load Report (Ctrl+L). If using the Load Report feature- the report will be displayed with the default column configuration. Note: Access the User Preferences module on the main menu to modify and save preferred default configurations. Reports are saved in an .nfr format. The other two options are meant for reports that are expected to be opened in Excel type spreadsheets. To open these reports, go to the C:\ND-3300 Data\Reports folder and right click on the file of interest. Additional features of the Report page: • Method: Automatically populated with data method type. • Date and time: Automatically populated when report is generated. • Report Name: User defined designation for the current report. • Report Mode: Drop down box defining options for managing reports. • Max Report size: Default number is set at the maximum of 200. When the selected buffer size is reached, the user has four choices including Ignore, Save, Print, and Save and Print. 11-7 Section 11-Archived Data and Data Viewer Selecting Show Report will bring the user to the report page. All data is saved in the archive files and can be retrieved using the Import feature of the Data Viewer module. Standards The Standards page will display the actual reference standards applied to each particular sample at the time of measurement. Opening Archived Data with Spreadsheet Programs The files are in tab-delimited format and can be opened in Microsoft Excel or an equivalent spreadsheet program. 11-8 Section 12-Source Check 12. Source Check The Source Check module is used to verify that the respective LEDs are operational. The following spectra are typical examples of Blue and White LED source checks. The user simply selects the LED of interest and then clicks the measure button. Note: The measurement should be done with a clean, dry pedestal. Loading sample or buffer onto the pedestal when using the Source Check module is not required. If your Source Check spectrum profile is not similar to the samples shown below- please clean the pedestal and take a new measurement. For further information, contact your local distributor or Technical Support. Blue LED Source Check White LED Source Check 12-1 Section 12-Source Check While the UV source is not detectable by the human eye, UV activated fluorescence can be observed by placing a lab wipe on the bottom pedestal, closing the arm and hitting measure. The resultant blue fluorescence may be observable by looking through the side slits of the shield covering the pedestals. The spectral images produced using a lab wipe with the UV LED will vary widely. An example profile is shown below: UV LED Source Check Images are automatically saved and archived on the hard drive of the PC at the following location: C:\ND-3300 Data\Operation & Performance Images. 12-2 Section 13-Troubleshooting 13. Troubleshooting Error Codes and Messages Error USB2000 This error might appear upon software startup and usually indicates that the USB cable is not properly connected or the software is not loaded properly. To troubleshoot, do the following: 1. Confirm that the USB cable is connected to both the PC and the instrument. 2. If the cable is connected properly but the error persists, run the “USB Reset” application located in Start Æ Programs Æ NanoDrop Æ Utilities Æ USB Reset. If USB Reset is not installed on your PC, you can download it from the Downloads section of our website. 3. Follow the onscreen instructions from USB Reset. After unplugging and then reconnecting the USB cable, the Found New Hardware Wizard should start as shown below. (Windows XP SP2 operating system will ask to allow it to search the internet for the proper software as shown- Select “No, not this time”). Follow the prompts for automatic installation of the software. Intro Page: Windows XP- SP2 Other Windows Operating Systems 4. Restart the operating software; if it works properly you are finished. If it does not operate properly, go to step 5. 5. Close the operating software and open the USBView utility to confirm proper USB communication: Start Æ Programs Æ NanoDrop Æ 13-1 Section 13-Troubleshooting Utilities Æ USBView. If USBView is not installed on your PC, you can download it from the “Downloads” section of our website. 6. Click on the “Device Connected” as shown below. If more than one USB device is connected, view each of them. One of the connected devices should give an “idVendor” and “idProduct” as 0x2457 and 0x1002 respectively as shown below. If these are present, the USB function of the instrument should be OK. If the “idVendor” and “idProduct” are different than below, or if no USB device is present in the list, go to step 7. 7. Install the instrument on another PC to rule out a faulty USB hub/port on the original PC. Run USBVIEW on the 2nd PC. If the same behavior is exhibited, contact your local distributor or Technical Support. 8. If none of the troubleshooting steps above solves the problem, contact your local distributor or Technical Support. 13-2 Section 13-Troubleshooting Connection Errors This error occurs whenever the USB connection is disrupted while operating a software module. In most cases, selecting Retry will reconnect properly. Some possible causes and solutions are listed below: Power management scheme on the PC: The USB communication will be lost whenever your PC automatically goes into standby or hibernate mode. Retry will NOT reconnect the instrument. If this occurs, the USB cable will need to be disconnected and then reconnected before selecting Retry. You can confirm that the power management settings are correct by opening the Power Options Properties page by choosing Start Æ Control Panel Æ Power Options. Both System Standby and System Hibernate should be set to “never” for the Plugged In column as shown below: 13-3 Section 13-Troubleshooting Static Electricity Discharge Discharge from the user to the instrument can be a problem in very dry environments. It may be necessary for the user to wear a grounding strap to prevent the discharges from occurring. Defective USB Port on PC If your instrument operates properly most of the time, but the Connection Error appears intermittently, it could be caused by the USB port on the PC. If this occurs, install the software and operate on another PC. If the error does not occur on the second PC, it may be necessary to replace the USB card on the original PC. Error: Code 8 This error occurs when access to any of the three “.log” files (“dye list.log”, “passwords.log” or “user preferences.log”) has been denied. This usually occurs when a user without administrator access runs the software. If this is the case, someone with administrative privileges must set the permissions on the operating program files folder (C:\ND-3300 Data\Log Files) so that all users have read/write access to the files in the folder. To set the permissions, do the following: 1. 2. 3. 4. Log in using an account with administrator rights. Right click on the C:\ND-3300 Data\Log Files folder. Select “Sharing and Security”, or “Sharing”. Set the security according to your operating system/networking as shown below: XP Professional using Domain Networking (using a server). Windows 2000 Professional 13-4 XP Home and XP Professional using Workgroup Networking Section 13-Troubleshooting On the Security tab, set he permissions for “Users” to “Full Control” as shown below On the Sharing tab, select share this folder as shown below: On the Sharing tab, set the Network sharing and security settings as shown below: Note 1: If you encounter a message stating that Windows has disabled remote access to this computer, it will be necessary to run the Network Setup Wizard in order to set the permission levels on the folder. Note 2: This error can also occur if the .log files are set to read-only. To confirm, right click each .log file and select Properties. Deselect the Read Only box for each .log file if it is checked. Incorrect command line parameters… This error may be seen during the initial installation of the software and will be followed by the message “Unable to locate the LabView Runtime Engine” when the operating software is first opened. To install the missing file, go to C:\Program Files\NanoDrop\Utilities\Run Time Installers and double click on the file LVRUNTIMEENG.msi. Follow all prompts to install at default location. Other Software Error Messages An Error Occurred: Code: 7 Source: Open file in….. This error occurs when any of the three “.log” files (“dye list.log”, “passwords.log”, “user preferences.log”) has been removed from the folder where the program files were installed (C:\NanoDrop Data\Log Files). These files must be present in this folder in order for the software to operate. Can’t find file OOIDRV.INI….. 13-5 Section 13-Troubleshooting This error occurs when trying to install the software without administrator privileges. Contact your system administrator to install the software. Error 7 Occurred at New File….. This occurs when the “C:\ND-3300 Data” file folder has been removed from the C: drive or it has been corrupted. If this message appears, click on the Stop button in the error window. Close the operating software. Open Windows Explorer and create a new folder on the C: drive. Name the folder “C:\ND-3300 Data” (case sensitive) and close Windows Explorer. Restart the NanoDrop 3300 operating software. Can’t Find LabView RunTime Engine….. This error message likely means that one or more of the software components have been removed or corrupted. If this occurs, reinstall the operating software using the installation CD or download it from our website. EZUSB.SYS Cannot Be Found….. If this error message appears, do the following: Windows 2000: type C:\WINNT\INF in the file path text box. Windows XP: type C:\WINDOWS\INF in the file path text box. This should allow the software to complete the installation successfully. Driver X Configuration Failed - You Must Manually Edit the Registry This error message (or others with similar wording) appears when attempting to install the operating software on a computer running Windows 2000 or XP. It occurs because the user does not have the necessary authorization to install the software on the computer. Contact your system administrator if this message appears. Error 8 Occurred at Open File….. This error message occurs when the user attempts to take a measurement while the data file is open. Close the data file and you should be able to continue taking samples normally. Error 9000 This error occurs when the passwords.log file is missing or corrupt. 13-6 Section 13-Troubleshooting Reinstall the operating software and "overwrite" the existing copy when prompted." A new copy of the passwords.log file should appear in the C:\ND-3300 Data\Log Files folder. Insufficient Memory….. This error message (or others with similar wording) occurs when attempting to install the operating software on a computer that does not have at least 40MB of free hard disk space. No Printer Connected….. This error appears when attempting to print when a printer is not attached to the PC. It is non-fatal and will not cause the software to shut down. Sampling Concerns Sample Homogeneity The user must be sure the sample solution is homogeneous when measuring fluorescence. Micro-sampling from non-homogeneous solutions can cause significant deviations in the fluorescence data generated. Sample Accuracy and Reproducibility If you are obtaining results that seem inaccurate or not reproducible, it could be the result of sample or aliquot non-homogeneity or liquid column breakage. It may be helpful to try the following to ensure representative results: • Clean the Surface Make sure the sample surfaces are clean before starting the software module. A dirty sample pedestal on startup can cause erroneous fluorescence measurements (even negative values) and signal saturation. It is always a good practice to clean the sample surfaces with de-ionized water to remove any dried sample that might be present. • Increase Sample Size Very strange results can occur when the liquid sample column is not completely formed during a measurement. While making a measurement, visually confirm that the liquid column is formed. If necessary, try 1.5-2 ul samples to ensure the column is formed. Also, proteins and solutions containing surfactants are known to ”un-condition” the measurement pedestal surfaces so that the liquid column does not form. If this occurs, “buff” the measurement pedestal surfaces by 13-7 Section 13-Troubleshooting rubbing each with a dry laboratory wipe 40-50 times. This will “recondition” the surface allowing for the liquid sample column to form. It is important to clear any residual lint form the labwipe away from the pedestal area. This can be done using either a damp wipe or compressed air. Low Blank Gain Notification This message is automatically displayed when the actual gain for a blank is less than that specified as the default setting. It is recommended that the user blot away the water or buffer, clean the pedestal area of dust and lint load another sample and make a new blank measurement. If the message occurs for successive measurements, it is recommended that the user accept the measurement and reset the default Min. Blank Gain setting for the appropriate LED. Note1: The Min Blank Gain setting may be modified by selecting the Advanced Parameters from the Configuration drop-down file or via the User Preferences module. Modifying the settings using the Advanced Parameters will only utilize the changes for the immediate measurement session. To save changes, modify the setting from within the Users Preferences. Note 2: A general rule of thumb is to review the blank gain settings in the archived data and choose a gain value consistent with the recorded data. Gains of less than 1 are not acceptable for Min Blank Gain settings. For further information, contact your local distributor or Technical Support. 13-8 Section 13-Troubleshooting High Gain Ratio Notification This message is automatically displayed when ratio of the actual sample gain to the blank gain is more than that specified as the default setting. If the spectral image is particularly distorted or has a very narrow emission profile, it is best to reject the measurement , blot away the water or buffer, clean the pedestal area of dust and lint, load another sample and make a new measurement. Note1: The Max Gain Ratio setting may be modified by selecting the Advanced Parameters from the Configuration drop –down file or via the User Preferences module. Modifying the settings using the Advanced Parameters will only utilize the changes for the immediate measurement session. To save changes, modify the setting from within the Users Preferences. Technical Support If after referring to the above troubleshooting tips you are unable to resolve your problem, please contact Technical Support or your local distributor. In addition to the serial number of your instrument, the following information will be very helpful: • Visual inspection of the light sources: Use the Source Check module to confirm that the WHITE and/or BLUE light sources are emitting when making a measurement. Caution: Do not look directly at the UV light source while making measurements. To check the UV LED source, place a piece of white paper on the pedestal, lower the arm, click the measure button and look for a blue hue on the white background. 13-9 Section 13-Troubleshooting • Application Module Screen Captures: Screen captures of the actual spectrum as seen on your PC can be of great use in diagnosing problems. Making a screen capture is quite easy. Simply choose Save File from the pull-down menu in the header of the respective screen (module). This saves the image as a .jpg in the respective module’s folder in which the user is working. Send the .jpg file as an email attachment to your local distributor or to Technical Support. • Data Archive Files: If you have questions about your data, please send the archive file containing the suspect data as an email attachment to your local distributor or to Technical Support. The archived file can be found at the following path:C:\ND-3300 data Æ Username Æ Application Module 13-10 Section 14-Maintenance and Warranty 14. Maintenance and Warranty Cleaning The primary maintenance requirement of the NanoDrop 3300 is keeping the measurement and optical surfaces clean. Upon completion of each sample measurement, wipe the sample from the upper bushing and lower pedestal to prevent sample carryover and avoid residue buildup. It is also recommended that both measurement surfaces be cleaned with de-ionized water upon completion of a testing series. No other regular maintenance is required. Decontamination of Measurement & Optical Surfaces If decontamination is necessary, a sanitizing solution, such as a 0.5% solution of sodium hypochlorite (1:10 dilution of common commercial bleach solutions – freshly prepared), can be used to ensure that no biologically active material is present on the measurement pedestals. The metal fiber optic fittings are made from 303 stainless steel and are resistant to most common laboratory solvents (see “Solvent Compatibility” appendix). Warranty All fluorospectrometers and accessories manufactured by Thermo Fisher Scientific are warranted against manufacturing defects in parts and labor for a period of one year. Preventive Maintenance as well as additional one, two, and three year warranty extensions are available. Additional information about the various plans may be found on our website. 14-1 Section 15-Appendices 15. Appendices Instrument Specifications • Sample Size: 1-2 microliters • Light Sources: 3 light emitting diodes (LEDs) • Excitation Maxima of LEDs UV: 365 nm, Blue: 470 nm, White: 500-650 nm • Light Source: three light-emitting diodes (LEDs) • Detector: 2048 element linear silicon CCD array • Wavelength Range: 400-750 nm • Wavelength Accuracy: 1 nm • Wavelength Resolution: 8 nm (FWHM at Hg 546 m) • Fluorescence Precision: < 5% CV (10 nM Fluorescein) • Measurement Cycle Time: Less than 10 seconds • Dimensions: 20 cm X 15 cm x 12 cm • Weight: 3 Kg • Sample Pedestal Material of Construction: 303 stainless steel and quartz fiber • Operating Voltage: 5 vdc (all power supplied by USB port) • Operating Power Consumption: 2 W • Standby Power Consumption: 1 W • CE and UL/CSA Approval • Included in system: software, compatible with Windows 2000 or XP Reference Table of Shortcut Keys Function Measure Key F1 Re-blank F2 Blank F3 Print Screen Print Report Recording Show Report F4 Function Save as Delete sample Data Configure Report Load Report Format Function User’s Manual Rename Samples Keys Ctrl+F Print Window Ctrl+P Ctrl+G Print Report Ctrl+R Keys Ctrl+A Ctrl+D Ctrl+M Ctrl+N F5 Help Menu Ctrl+H Exit Ctrl+Q F6 Import Load Report Format Ctrl+I Save Report Ctrl+S Ctrl+L Sort Report Ctrl+T F7 Solvent Compatibility The NanoDrop 3300 is compatible with most solvents typically used in life science laboratories. These include: methanol, ethanol, n-propanol, isopropanol, butanol, acetone, ether, chloroform, carbon tetrachloride, 15-1 Section 15-Appendices DMSO, DMF, acetonitrile, THF, toluene, hexane, benzene, sodium hydroxide, sodium hypochlorite (bleach), dilute HCl, dilute HNO3, dilute acetic acid. All forms of Hydrofluoric Acid (HF) are incompatible, as the fluoride ion will dissolve the quartz fiber optic cable. 15-2