1
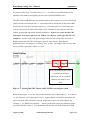
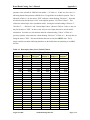
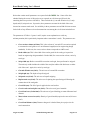
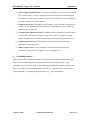
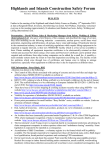
Appendix A:
User’s Manual for Rural Road Costing Model
VEMAX Management Inc.
August, 2009
Disclaimer: Use of the Road Costing Model
Significant care must be exercised in using this model in that this model, like any other
spreadsheet model, is only an analytical tool designed for a very specific purpose. In
particular, this model was designed to assist in developing estimates of the historical
costs of constructing rural roads in Saskatchewan for the specific purposes of PS 3150
when records of actual historical costs are not available. Within the context of PS 3150,
it is assumed that actual records of the cost to construct rural roads will be available from
2002 to the present. The application of this model is restricted to estimating construction
cost for rural roads constructed in Saskatchewan prior to 2002. It should be noted that our
research was not exhaustive and there may well be additional information not included in
this review which would significantly alter the model results. Further, the costs of
constructing roads are typically site specific and therefore may be highly variable across
various locations. The default data employed in this model is based on a number of listed
sources and may or may not reasonably reflect the experience of individual Rural
Municipalities (RMs) in Saskatchewan. As such, individual users of this model assume
full responsibility to ensure that the data used in the model reasonably represent the
circumstances in the RM under study. Individual users of this model may choose to
substitute certain data elements based on their own knowledge, experience or historical
observations. However, it is important to note that any data used whether it is the default
data or substituted data, must prove acceptable to auditors involved in the PS 3150
process and the responsibility for the input data, the model results and the involvement of
auditors in the process of estimating historical costs using this model lie with the
individual users.
It should also be noted that this model is intended for the sole purpose of estimating
typical construction costs for the following designated roads (constructed prior to 2002):
(i) Main Farm Access (MFA), (ii) Grid, (iii) Primary Grid, and (iv) Special Roads. There
may be situations for which the use of this model is inappropriate. For example, the
model is not designed to be used to estimate the construction costs of: heavy haul roads;
structural haul roads; structural roads (roads with base and sub-base); or surfaced roads
(e.g., surfaced roads in urban areas). Again, this model should only be used to estimate
the replacement cost of the listed designated roads only in the absence of better
information (e.g., actual historical cost data).
Rural Road Costing User’s Manual
1.
Appendix A
Introduction
The intent of this brief manual is to introduce and explain the Excel spreadsheet model designed
to facilitate the calculation of Current Replacement Cost (CRC) estimates for rural roads of
varying type in alternative Rural Municipality (RM) divisions across the Province of
Saskatchewan. In actuality there are 3 such models, one for each of the road types considered in
this study: (i) Main Farm Access (RoadCostModel_Aug10_09_MFA_USER.xls), (ii) Grid
(RoadCostModel_Aug10_09_Grid_USER.xls), and (iii) Primary Grid
(RoadCostModel_Aug10_09_PrGrid_USER.xls).1 Although differing by certain data
elements, the three models nonetheless operate identically. For this reason, the manual will use
as its example the spreadsheet model employed to calculate CRC estimates for MFA roadways.
2.
Model Construction
The spreadsheet model itself consists of three individual worksheets:
•
Disclaimer: This worksheet contains the disclaimer pertaining to the use of the road
costing model. It repeats the disclaimer listed above.
•
Assumptions: This worksheet lists and describes the assumptions and calculations
embedded in the spreadsheet design itself. In essence, it summarizes much of the
information embedded in the main report of this study. So it will not be reviewed here.
•
MFA_Data&Results: This worksheet accepts user-defined parameter values and data,
and posts a summary of key model results. It is this worksheet that is of principal
concern in this manual since it is the user interface applied to estimate CRC.
•
MFA_MainCalcs: This worksheet is linked to the data of MFA_Data&Results in order
to conduct model calculations and derive the desired results. This worksheet should not
be modified in any way by users. The nature of the calculations themselves are reviewed
in detail within the main report of this study and will not be repeated here.
It is worth noting that – excepting cells which require input from model users – all worksheets are
protected from inadvertent data entry. In other words, the contents of every cell in all worksheets
1
Note that replacement costs for Special Roads can be estimated using either the “Grid” or “Primary Grid”
spreadsheets. Special Roads intended to accommodate less than 150 vehicles per day were designed to
Grid standards. Special roads intended to accommodate more than 150 vehicles per day were designed to
Primary Grid standards. For more detail, see the cross-section drawings within the worksheet
“Assumptions” contained in each of the road costing spreadsheets.
August 10, 2009
VEMAX Management Inc.
Page 1 of 9
Rural Road Costing User’s Manual
Appendix A
may not be overwritten by model users unless the protection is explicitly disabled by the users.
The only exceptions involve the data input areas. This has been designed into the model to avoid
accidental changes in the model which could lead to errors or omissions in the results.
3.
Model Use
As mentioned above, the principal concern of this manual involves the data and summary results
worksheet of the overall spreadsheet model. The data and results worksheet itself
(MFA_Data&Results) consists of three key areas of concern: (i) key model parameters, (ii)
summary results, and (iii) input and default model data. Each is discussed, in turn, below.
3.1
Model Parameters and Current Replacement Cost Results
Table A.1 pictures the key parameters requiring selection by model users. Note that the
parameter values requiring entry are listed in RED font. This is a standard feature of the
spreadsheet model – areas and cells accepting input are in RED font. All other spreadsheet areas
and cells should be left undisturbed by users.
Table A.1. Key input parameters and current replacement cost (CRC) results.
Use Custom Input Values?
RM Division number =
0
3
2007 Current Replacement Cost ($/km) =
2002 Current Replacement Cost ($/km) =
51,210
23,797
The first input – “Use Custom Input Values?” – refers to custom data that RM staff may prefer to
employ since they better represent unit costs and other data of relevance to their particular RM
and experience. If users select a value of “1”, then the custom-defined values will be used. (Note
that the topic of custom values will be discussed later in this manual.) If, instead, a value of “0”
is selected, then default data of some sort – contingent on the selection of RM division number –
will be employed within model calculations.
The second input – “RM Division number =” – refers to the RM division to which the RM
belongs. If custom data is not employed within the model, the selection of division number will
dictate and select the default data applied in model calculations. The default data, it should be
noted, is based on statistical investigation of data obtained by VEMAX and Municipal Affairs for
August 10, 2009
VEMAX Management Inc.
Page 2 of 9
Rural Road Costing User’s Manual
Appendix A
the purpose of this study. Note that values of 1, 2, 3, 4, 5 and 6 are acceptable inputs for this
parameter (each number corresponding to each of the 6 identified RM divisions).
The CRC results (in BLUE font) reported in this table are the estimated cost of road construction
(in $/km) for the selected input data (i.e., custom input data or default data for the selected RM
division) for the years 2007 and 2002, respectively. (Given the rapid rise in road construction
costs over this period, the 2002 CRC estimate will be substantively lower than the 2007 CRC
estimate generated through model data and calculations.) Of these two results, the 2002 CRC
dollar figure is the input required for the VEMAX Asset Register system supporting PS 3150
compliance. In other words, if the road costing model is used to estimate CRC for the Asset
Register system, the 2002 CRC dollar figure should be entered as the “Reproduction /
Replacement Cost” and assigned a “Valuation Year” of 2002. An example of the necessary data
entry procedure is provided in Figure A.1 below.
If the road costing model is used
to generate an estimated
replacement cost for a road, the
valuation year must be set to
2002
Figure A.1. Entering 2002 CRC estimate within VEMAX Asset Register system.
Based on these inputs, we can now interpret the parameter values within Table A.1. At a value of
“0”, the parameter “Use Custom Input Values?” suggests that the user-defined custom data will
not be used in the CRC calculations. Instead, default data of some sort will be applied. By
selecting “3” for “RM Division Number =”, the user has decided to apply the default input data
associated with RM division 3. Cost calculations will therefore rest on the default data of RM
August 10, 2009
VEMAX Management Inc.
Page 3 of 9
Rural Road Costing User’s Manual
Appendix A
division 3. In this case, the estimated CRC for 2007 is $51,210 per kilometre of MFA roadway,
and the estimated CRC for 2002 is therefore $23,797 per kilometre of MFA roadway. Recall that
the 2002 figure is the one required for the VEMAX Asset Register system.
3.2
Summary Results
Table A.2 lists the summary results corresponding to the selected parameter values of Table A.1,
above. For each category of cost (cut-and-fill, stripping, sub-total, etc.), three unique expressions
of replacement cost are calculated. The first column of results – “Current replacement cost
($/km)” – summarizes the CRC results by cost category for a single kilometre of MFA roadway.
The second column of results – “% of Grand Total CRC” – indicates the percentage of costs
accounted for by each cost category. In this case, we note that “Cut-and-fill cost” accounts for
the greatest percentage of (grand) total CRC.
Table A.2. Summary results for selected parameter values.
Cost Category
Cut-and-fill cost
Stripping cost
Replacement cost
Gravel cost
Culvert cost
Current
replacement
cost ($/km)
21,081
5,827
8,364
9,035
2,460
% of Grand
Total CRC
41.2%
11.4%
16.3%
17.6%
4.8%
SUB-TOTAL OF CRC
46,767
91.3%
Engineering fees
Other costs
3,274
1,169
6.4%
2.3%
GRAND TOTAL OF CRC
51,210
100.0%
Notice that the summary results computes a “Sub-total of CRC” based on a range of construction
activities (cut-and-fill, stripping, culverts, etc.). The sub-total then forms the basis for computing
both engineering fees and other costs (recall that these cost categories are derived by applying
percentage values to the sub-total). Adding engineering fees and other costs to the sub-total
provides the “Grand total of CRC” sought ultimately by RM staff.
August 10, 2009
VEMAX Management Inc.
Page 4 of 9
Rural Road Costing User’s Manual
3.3
Appendix A
Custom and Default Data Input Values
The results obtained through model calculations rest on both basic parameter inputs (as depicted
in Table A.1) and a range of data input values. As discussed above, while default data is
provided for each RM division to which any particular RM may belong, custom input values can
be entered by RM staff and applied to model calculations. This provides the flexibility necessary
to modify default data for a particular RM should superior data be available.
Table A.3 illustrates the first half (denoted “Part 1”) of the data input area of the spreadsheet
model (“Part 2” is shown and discussed further below). As can be seen, this part of the
spreadsheet contains 4 columns. The column “Parameter name” simply lists the names of all data
input parameters used in model calculations (and discussed in detail within the main report of this
study). The column “Unit” indicates the relevant unit quantities and/or costs of the input
parameters. The column “Value” contains the values actually employed in model calculations –
values listed in bold BLUE font to indicate they are the product of internal model calculations.
The values placed in this column through model calculations are based on the key parameter
values selected in Table A.1. Recall, for instance, that the parameter value for “Use Custom
Input Values?” was “0” – indicating that custom input values were not to be used in model
calculations. This is reflected in the statement “NO” under the column heading “Custom Input
Values” of Table A.3 (“NO” in response to the question “Use These Values?”). In other words,
since “0” was selected in Table A.1, the custom input values of Table A.3 will not be used as the
values supporting model calculations (although, coincidentally, most of the values match
excepting “Strip depth” and “Strip unit cost”). Whether applied in model calculations or not,
however, it is important to note that all data elements under the column heading “Custom Input
Values” are in RED font. As discussed previously, this indicates that users are free to enter data
within this area – this column – of the spreadsheet should they choose to do so. However, it is
important to note that any custom data employed must meet the approval of auditors involved in
the PS 3150 process.
August 10, 2009
VEMAX Management Inc.
Page 5 of 9
Rural Road Costing User’s Manual
Appendix A
Table A.3. Data input values (Part 1: Parameters, Values and Custom Input).
INPUT VALUES FOR MODEL CALCULATIONS
Parameter name
Unit
Value
USE THESE VALUES? ==>>
Cross-section volume
m3/km
6,146
Road width
m
7.0
Strip width
m
27.8
Cut-and-fill unit cost1
$/m3
3.43
2
Strip depth
m
0.08
Strip unit cost1
$/m3
2.62
Replace unit cost
$/m3
3.76
Gravel lift
cm
5.00
Gravel crush & stockpile cost
$/m3
8.05
Gravel haul cost
$/t-km haul
0.222
Mass/Volume conversion
t/m3
1.6
Gravel haul distance
(average)
km haul
50.0
Approach (culvert)
- Culvert supply & install
- Length of culvert
- # of culverts per km
Roadway (culvert)
- Culvert supply & install
- Length of culvert
- # of culverts per km
Engineering percent
Other costs percent
Custom
Input
Values
NO
6,146
7.0
27.8
3.43
0.10
3.26
3.76
5.00
8.05
0.222
1.6
50.0
$/m
m
# / km
78.25
10.0
2.0
78.25
10.0
2.0
$/m
m
# / km
89.53
10.0
1.0
89.53
10.0
1.0
7.0%
7.0%
2.5%
2.5%
% of subtotal
% of subtotal
It is important to note that any user employing the custom data input capability of the model
must enter data for each and every data category (e.g., cut-and-fill unit cost, strip depth, strip
unit cost, replace unit cost, etc.) – even if this data repeats the default data contained in other
columns of the spreadsheet (see Part 2 of Table A.3). Failure to do so can lead to erroneous
results.
Part 2 of Table A.3 is presented below. As can be seen, this part of the table includes the default
data reached by VEMAX and Municipal Affairs through the statistical study of data sets pertinent
to the six RM divisions of interest. Assuming custom input data is not applied by the user of the
spreadsheet model, the default data set employed for model calculations is contingent on the
August 10, 2009
VEMAX Management Inc.
Page 6 of 9
Rural Road Costing User’s Manual
Appendix A
parameter value selected for “RM Division number =” in Table A.1. In this case, the value is 3 –
indicating that the data pertinent to RM division 3 is applicable for the RM in question. This is
indicated in Table A.3 by the answer “YES” under the column heading “Division 3”. Note that
all other divisions list the answer “NO” to the implied question, “Use These Values?”. This
reflects the internal logic of the spreadsheet model. Among the column headings “Division 1”,
“Division 2”,…, “Division 6” and “Custom Input Values” (shown in Table A.2, above), only one
may list the answer “YES”. In other words, only one set of input data can be used for model
calculations. So in this case, the numbers under the column heading “Values” of Table A.2
precisely equal the values under the column heading “Division 3” of Table A.3 – the only data set
listing the answer “YES”. Note that all default data sets are listed in GREEN font. This is
simply a model convention indicating that these are the default data sets pertaining to each RM
division.
Table A.3. Data input values (Part 2: Default Values).
DEFAULT VALUES (by RM division):
Division 1
NO
6,146
7.0
27.8
3.16
0.10
3.06
3.76
5.00
8.05
0.222
1.6
50.0
Division 23
NO
6,146
7.0
27.8
3.43
0.08
3.04
3.76
5.00
8.05
0.222
1.6
50.0
Division 34
YES
6,146
7.0
27.8
3.43
0.08
2.62
3.76
5.00
8.05
0.222
1.6
50.0
Division 4
NO
6,146
7.0
27.8
3.54
0.12
4.00
3.76
5.00
8.05
0.222
1.6
50.0
Division 5
NO
6,146
7.0
27.8
3.21
0.12
3.16
3.76
5.00
8.05
0.222
1.6
50.0
Division 64
NO
6,146
7.0
27.8
3.43
0.10
4.18
3.76
5.00
8.05
0.222
1.6
50.0
78.25
10.0
2.0
78.25
10.0
2.0
78.25
10.0
2.0
78.25
10.0
2.0
78.25
10.0
2.0
78.25
10.0
2.0
89.53
10.0
1.0
89.53
10.0
1.0
89.53
10.0
1.0
89.53
10.0
1.0
89.53
10.0
1.0
89.53
10.0
1.0
7.0%
2.5%
7.0%
2.5%
7.0%
2.5%
7.0%
2.5%
7.0%
2.5%
7.0%
2.5%
August 10, 2009
VEMAX Management Inc.
Page 7 of 9
Rural Road Costing User’s Manual
Appendix A
Notice that certain model parameters are reported in bold GREEN font. Some of the data
obtained during the course of this project were reported on a division-specific basis (the
remaining data on a province-wide basis). These include the: (i) cut-and-fill unit cost, (ii) strip
depth, and (iii) strip unit cost. In practice, these parameters account for the bulk of the costs
incurred to construct rural roads. So variability in these parameters across RM divisions account
for the bulk of any differences in road construction costs among the six divisions included here.
The parameters of Table A.3 (parts 1 and 2) require some explanation to avoid any
misinterpretation (this is particularly important where custom data is used). The parameters are:
•
Cross-section volume (m3/km): This is the volume of ‘cut-and-fill’ excavation required
to construct the road grade over a one kilometre length (based on engineering design
standards). In this case, the cross-section volume corresponds to a MFA road.
•
Road width (m): This is the width of the road at grade for the road type in question
based on engineering design standards. Road width, like cross-section volume, varies by
road type.
•
Strip width (m): Before cut-and-fill excavation can begin, the topsoil must be stripped.
The total strip width includes the width of the road plus width of the ditch cuts on either
side of the road. Again, this varies by road type.
•
Cut-and-fill unit cost ($/m3): The unit cost of cut-and-fill excavation.
•
Strip depth (m): The depth of topsoil stripped.
•
Strip unit cost ($/m3): The unit cost of topsoil stripping.
•
Replace unit cost ($/m3): The unit cost of replacing the topsoil stripped following the
construction of the road grade.
•
Gravel lift (cm): The lift of gravel applied to the road surface.
•
Gravel crush and stockpile cost ($/m3): The unit cost of gravel material.
•
Gravel haul cost ($/t-km haul): The unit cost of gravel hauling per tonne-kilometre haul
distance.
•
Mass/volume conversion (t/m3): Density of gravel hauled (required to convert $/t-km to
$/m3).
•
Gravel haul distance (km): Distance that gravel is hauled from pit to project site for
road construction.
August 10, 2009
VEMAX Management Inc.
Page 8 of 9
Rural Road Costing User’s Manual
•
Appendix A
Culvert supply and install ($/m): The supply and install cost for culverts. Note that this
data is required twice. Once for approach culverts, and second for culverts underlying
the main road. These costs need not be the same since, for instance, culverts underlying
the main road may be of greater diameter.
•
Length of culvert (m): The length of culver required. Again, this data is required twice
since the culvert underlying the main road may be longer than the culvert required for
approaches to the main road.
•
# of culverts per kilometre (#/km): The number of culverts required for each kilometre
of road constructed. Again, this data is required twice since, for example, a greater
number of approach culverts may be required than culverts underlying the main road.
•
Engineering percent (%): The percentage of road construction costs typically
attributable to engineering fees.
•
Other costs percent (%): The percentage of road construction costs typically
attributable to other costs (e.g., signage, low level crossings, etc.).
4.
Concluding Remarks
This brief manual has illustrated the steps necessary for users to estimate current replacement
costs for rural roads through the road costing spreadsheet. Recall that there are 3 such
spreadsheets – one for each road type. And, although this manual illustrates the function of the
MFA version alone, the remaining spreadsheet models (i.e., Grid and Primary Grid versions)
operate identically. Only the data employed varies (e.g., cross sectional data).
August 10, 2009
VEMAX Management Inc.
Page 9 of 9