1
Ref. SAF/LAND/VITO/PUM_ENDVI10
Issue: Version 1.3
Date: 1 July 2015
The EUMETSAT Satellite Application Facility on
Land Surface Analysis (LSA SAF)
Product User Manual (PUM)
Normalized Difference Vegetation Index
PRODUCTS: LSA-410 AND LSA-453 (ENDVI10)
Reference Number:
Issue/Revision Index:
Last Change:
SAF/LAND/VITO/PUM_ENDVI10
Issue 1.3
01/07/2015
1
Ref. SAF/LAND/VITO/PUM_ENDVI10
Issue: Version 1.3
Date: 1 July 2015
DOCUMENT SIGNATURE TABLE
Prepared by :
Approved by :
Name
Date
B. Smets, H. Eerens, E. Swinnen
Land SAF Project Manager (I. Trigo)
10/01/2014
Signature
DOCUMENTATION CHANGE RECORD
Issue / Revision
Version 0.0
Version 1.0
Version 1.1
Version 1.2
Date
2010
04/03/2013
15/12/2013
10/01/2014
Version 1.3
01/07/2015
Description:
Preliminary version from MARS/CVB
Version prepared for LSA SAF ORR
Updated with comments from LSA SAF ORR
Added reference to metadata to present satellite source
(Metop-A or Metop-B)
Split ENDVI10 into LSA-410 (ICDR) and LSA-453 (CDR) as
defined by SAF SG-6
2
Ref. SAF/LAND/VITO/PUM_ENDVI10
Issue: Version 1.3
Date: 1 July 2015
DISTRIBUTION LIST
Internal Consortium Distribution
Organisation
Name
IPMA
Luís Pessanha
IPMA
Isabel Trigo
IPMA
IPMA
IPMA
IPMA
IPMA
IPMA
IPMA
Isabel Monteiro
Sandra Coelho
Carla Barroso
Pedro Diegues
Teresa Calado
Benvinda Barbosa
Ana Veloso
VITO
VITO
VITO
VITO
VITO
VITO
VITO
VITO
VITO
VITO
Herman Eerens
Else Swinnen
Tim Jacobs
Sara Verbeiren
Frederik Coelst
Bart Deronde
Erwin Goor
Lieve van den Heuvel
Bart Ooms
Lieven Bydekerke
External Distribution
Organisation
EUMETSAT
EUMETSAT
EUMETSAT
EUMETSAT
EDISOFT
EDISOFT
EDISOFT
GMV
GMV
Name
Frédéric Gasiglia
Dominique Faucher
Lorenzo Sarlo
Lothar Schueller
Teresa Cardoso
Carlos Vicente
Joaquim Araújo
Mauro Lima
José Freitas
No. Copies
No. Copies
3
Ref. SAF/LAND/VITO/PUM_ENDVI10
Issue: Version 1.3
Date: 1 July 2015
Steering Group Distribution
Nominated by:
Name
IPMA
Pedro Viterbo
EUMETSAT
Lorenzo Sarlo
EUMETSAT
EUMETSAT
EUMETSAT
IPMA
MF
RMI
VITO
No. Copies
Harald Rothfuss
Lothar Schueller
Kenneth Holmlund
Pedro Viterbo
Jean-François Mahfouf
Rafiq Hamdi
Eric Gontier
4
Ref. SAF/LAND/VITO/PUM_ENDVI10
Issue: Version 1.3
Date: 1 July 2015
Table of Contents
Contents
DOCUMENT SIGNATURE TABLE ............................................................................ 2
DOCUMENTATION CHANGE RECORD................................................................... 2
1
INTRODUCTION ................................................................................................. 8
2
ALGORITHM .................................................................................................... 10
2.1
Introduction .................................................................................................. 10
2.2
Segment Processing ................................................................................... 11
2.3
Synthesis Processing .................................................................................. 12
3
PRODUCT DESCRIPTION ............................................................................... 15
3.1
Image format and naming convention ....................................................... 15
3.2
Temporal characteristics ............................................................................ 16
3.3
Spectral characteristics .............................................................................. 16
3.4
Spatial characteristics ................................................................................. 18
4
DATA ACCESS ................................................................................................ 20
4.1
Introduction .................................................................................................. 20
4.2
Data Catalogue Discover and Order........................................................... 22
4.3
Data Catalogue subscribe ........................................................................... 23
5
VALIDATION AND QUALITY CONTROL ........................................................ 24
6
REFERENCES .................................................................................................. 25
5
Ref. SAF/LAND/VITO/PUM_ENDVI10
Issue: Version 1.3
Date: 1 July 2015
List of Figures
Figure 1 – ENDVI10 product example. ....................................................................... 8
Figure 2 : Example contents of the annotation file METOPAVHRR_20100211_S10_EUR_NDV.hdr .......................................................... 16
Figure 3 - Spatial windows........................................................................................ 18
Figure 4 : LSA-SAF ENDVI10 home ......................................................................... 20
Figure 5 - Data Access link ....................................................................................... 21
Figure 6 : ENDVI10 Product Catalogue .................................................................... 21
Figure 7 - Product discovery ..................................................................................... 22
Figure 8 : ENDVI10 subscriptions and massive orders ............................................ 23
6
Ref. SAF/LAND/VITO/PUM_ENDVI10
Issue: Version 1.3
Date: 1 July 2015
List of Tables
Table 1- Product Requirements for ENDVI, in terms of area coverage, resolution and
accuracy. ............................................................................................................. 9
Table 2 : METOP-AVHRR spectral bands ................................................................ 11
Table 3 : Compositing rule ........................................................................................ 14
Table 4 - Image layers of ENDVI10 .......................................................................... 17
Table 5 - Status Map bits .......................................................................................... 17
Table 6 - Spatial overview of ENDVI10 .................................................................... 18
Table 7 - Spatial windows ......................................................................................... 19
7
Ref. SAF/LAND/VITO/PUM_ENDVI10
Issue: Version 1.3
Date: 1 July 2015
1 Introduction
The Satellite Application Facility (SAF) on Land Surface Analysis (LSA) is part of the SAF Network,
a set of specialized development and processing centers, serving as EUMETSAT (European
organization for the Exploitation of Meteorological Satellites) distributed Applications Ground
Segment. The SAF network complements the product-oriented activities at the EUMETSAT Central
Facility in Darmstadt. The main purpose of the LSA SAF is to take full advantage of remotely sensed
data, particularly those available from EUMETSAT sensors, to measure land surface variables,
which will find primarily applications in meteorology (http://landsaf.ipma.pt/).
The EUMETSAT Polar System (EPS) is Europe’s first polar orbiting operational meteorological
satellite and the European contribution to a joint polar system with the U.S. EUMETSAT will have
the operational responsibility for the “morning orbit” with Meteorological-Operational (MetOp)
satellites, the first of which was successfully launched on October 19, 2006. Despite the wide range of
sensors on-board MetOp (http://www.eumetsat.int/), most LSA SAF parameters make use of the
Advanced Very High Resolution Radiometer (AVHRR) and, to a lesser extent, of the Advanced
Scatterometer (ASCAT).
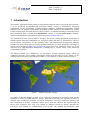
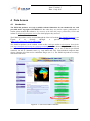
The Metop-AVHRR S10 (“ENDVI10”) are near-global, 10-daily composite images which are
synthesized from the "best available" observations registered in the course of every "dekad" by the
orbiting earth observation system Metop-AVHRR, A year composite of 2009 is shown in Figure 1.
Figure 1 – ENDVI10 product example.
On behalf of the JRC‐MARS program of EC, VITO has developed a processing chain for the
treatment of NOAA‐AVHRR data over Europe. Individual tracks/orbits are ingested, corrected in
different steps (calibration, geometric correction, atmospheric correction, cloud/snow labeling) and
then composited to 10‐daily "Synthesis" images (S10). With this chain all the daytime‐observed
NOAA data registered since 1981 were treated by different stations in Europe. Recently the
procedures were adapted for AVHRR/Metop level 1b data. The resulting S10‐composites from
8
Ref. SAF/LAND/VITO/PUM_ENDVI10
Issue: Version 1.3
Date: 1 July 2015
METOP‐AVHRR are very comparable with the ones delivered by VITO's SPOT‐VEGETATION
processing chain: 1km resolution, near‐global coverage, frequency of 10 days ("dekad") and similar
spectral contents (RED, NIR, SWIR ‐ no BLUE but two thermal bands). In addition to the basic
information layers (surface reflectances, angles of the sun/view geometry, status map, etc.), the
decadal composites also comprise two "value‐added" image layers: NDVI and accompanying LST
(Land Surface Temperature).
The Metop-AVHRR S10 is operated in the LSA SAF System II at VITO. ENDVI10 is available as a
Climate Data Record (LSA-453) starting in March 2007 and an Interim Climate Data Record (LSA410) performing continuous updates in Near Real Time of LSA-453. In both cases, ENDVI10 consists
of composites representing a Normalized Difference Vegetation Index and are distributed together
with a set of ancillary dataset layers (surface reflectances, sun and view angles, quality indicators).
The product and ancillary dataset layers described in this document refer to both LSA SAF products:
the ENDVI10 Climate Data Record (LSA-453) and ENDVI10 Interim Data Record (LSA-410). The
Land Surface Temperature ancillary layer is added on courtesy of VITO, whereof EUMETSAT does
not take any liability, responsibility and ownership. The products can be acquired from
http://www.metops10.vito.be/index.html.
This document is one of the product manuals dedicated to LSA SAF users. The algorithm and the
main characteristics of the vegetation indices (NDVI and accompanying LST) generated by the LSA
SAF from AVHRR data system are described in the following sections. The characteristics of
AVHRR based vegetation indices provided by the LSA SAF are described in Table 1. Further details
on the LSA SAF product requirements may be found in the Product Requirements Document (PRD)
available at the LSA SAF website http://landsaf.ipma.pt).
Table 1- Product Requirements for ENDVI, in terms of area coverage, resolution and accuracy.
Product Name
ENDVI10
Product
Identifier
LSA-453
LSA-410
Coverage
Global
Resolution
Accuracy
Temporal
Spatial
Threshold
Target
Optimal
10-daily
1km
R>0.80
R>0.90
R>0.95
where R = coefficient of determination.
9
Ref. SAF/LAND/VITO/PUM_ENDVI10
Issue: Version 1.3
Date: 1 July 2015
2 Algorithm
2.1
Introduction
The European Metop satellites were conceived by ESA/EUMETSAT to complement the
geostationary METEOSATs. In this way they are analogue to the North-American NOAA-platforms
which accompany the geostationary GOES-East and -West satellites. Since mid-2007, Metop thus
occupies the "morning orbit" while NOAA assumes the "noon orbit": the local solar time of the
overpasses is around 9h30' for Metop and 14h for NOAA. Both platforms carry the same AVHRR
instrument which scans the full earth surface at ±1km resolution in five spectral bands: RED, NIR,
SWIR, TIR1, TIR2. During the night the SWIR-band is switched to MIR, but the ENDVI10 only deal
with daytime registrations.
Compared to NOAA, the Metop-AVHRR has been enhanced in three ways: the platform is perfectly
stabilized which guarantees an optimal geo-correction of the imagery, all registered 1km data are
stored on board and tunneled via the antenna of Svalbard (Sweden) to the central processing center of
EUMETSAT (Germany), and the latter performs the most crucial enhancement steps (rectification,
calibration, cloud/snow detection) and broadcasts the results in near real-time via its EUMETCast
system.
The 1km resolution image data registered all over the globe by METOP-AVHRR are systematically
captured by the antenna in Svalbard (Norway) and further tunneled through EUMETSAT (Germany).
EUMETSAT immediately applies some crucial pre-processing steps: the raw observations are
calibrated and transformed into top-of-atmosphere radiances (TOA), accurate “Lon/Lat-planes” are
added with the geographical position of each pixel in the raw segment, and also a mask is added
indicating the status of each observation (clear, cloud, snow). The resulting data stream is cut into
segments of 3 minutes (1080 scanlines) which are distributed in near-real time via the EUMETCast
broadcasting system in the form of EPS-formatted Level1B-files. EUMETSAT operates at the time of
writing two METOP platforms, known as METOP-A and METOP-B.
10
Ref. SAF/LAND/VITO/PUM_ENDVI10
Issue: Version 1.3
Date: 1 July 2015
The AVHRR-3 sensor on board of METOP registers in five spectral bands, as shown in Table 2.
During the day band 3 operates in the SWIR (3A), during the night it is switched to MIR (3B).
Band
nr.
Bandwidth(µm)
Spectral domain
Band abbreviation
1
0.58 - 0.68
Shortwave
VIS (visual) or RED
2
0.725 - 1.00
Shortwave
NIR (near infrared)
3A
1.58 - 1.64
Shortwave
SWIR (shortwave
infrared)
3B
3.55 - 3.93
Middle infrared
MIR
4
10.3 - 11.3
Longwave thermal
infrared
TIR4
5
11.5 - 12.5
Longwave thermal
infrared
TIR5
Table 2 : METOP-AVHRR spectral bands
The Level1b files always provide the longitude and latitude on the WGS84 geodetical datum for a
subsample of pixels. These "Lon/Lat-planes" are needed for the mapping of the raw images towards a
geographical projection system.
2.2
Segment Processing
VITO ingests all the METOP EPS Level1b files received through its EUMETCast reception stations.
However, for the production of the ENDVI10 only the daytime segments are used (hence band 3 is
always SWIR). Each individual segment is then treated as follows:
Segment selection:
The continuous data feed comprises all kinds of METOP-AVHRR imagery, registered over
land and sea, during the day and the night. But as the focus is on global vegetation
monitoring, only the daytime segments with at least some land pixels are retained for further
processing. In line with the VGT-S10, no further attempts are made to process the sea pixels.
And the elimination of the night time registrations implies that band 3 always corresponds
with the SWIR (B3A).
Spatial - Remap:
Using the mentioned Lon/Lat-planes, included by EUMETSAT in the Level1b, and a "nearest
neighbour" resampling scheme, the five spectral bands of AVHRR are converted to the
WGS84 Geographical Lon/Lat system with the same framing and resolution as used for
SPOT-VGT (pixel size of 1°/112 1 km along a great circle.
11
Ref. SAF/LAND/VITO/PUM_ENDVI10
Issue: Version 1.3
Date: 1 July 2015
Spatial - Angles:
Similar images are computed providing for each pixel the angular position (zenith/azimuth) of
the sun and the sensor at the moment of the registration.
Spectral - Shortwave:
The on-board registered radiances are converted into surface reflectance factors by means of
the SMAC algorithm [Rahman et al, 1994] which removes (at least partially) the unwanted
atmospheric and angular impacts on the ground signal. The SMAC-coefficients for METOP's
three shortwave channels (RED, NIR, SWIR) were computed on behalf of the MARS-project
[Berthelot et al, 2008]. They are also made available via CESBIO's SMAC-website
(http://www.cesbio.ups-tlse.fr/fr/smac.htm). In addition to these band-specific coefficients,
SMAC also needs the input of the atmospherical state at registration time, in terms of water
vapour, aerosol load and ozone content. For the assessment of these three atmospheric state
variables, the same approach is followed as for SPOT-VGT: for aerosols and ozone only
climatologic values are used (long term monthly averages), but for water vapour more precise
data are acquired from ECMWF, i.e. global water vapour maps with a spatial resolution of
0.5° and a renewal frequency of six hours (four water vapour images per day).
After the atmospheric correction, the Normalised Difference Vegetation Index (NDVI) is
computed from the surface reflectances: NDVI = (NIR-RED)/(NIR+RED).
Spectral - Longwave:
Land surface temperatures (LST) are derived, separately for land and sea pixels, from the two
TIR brightness temperatures using the split window technique [Coll and Caselles, 1997],
which also requires the input of water vapour and TIR emissivities. For water vapour, the
same six-hourly ECMWF data are used as for SMAC. The TIR emissivities of the land pixels
are assessed via a simple linear equation from their NDVI.
Quality - Masking:
Each pixel's observational state is expressed via subsequent 0/1-switches in a bitmap image.
This "status mask" classifies each pixel according to criteria such as: landsea, and
clearcloudsnow/ice. While the GLC2000 map [Bartholomé et al, 2005] is used to separate
land from sea pixels, the distinction between “clearcloudsnow/ice” is fully based on the
results of the cloud/snow detection added by EUMETSAT in the Level1b-files [EUMETSAT,
2004].
2.3
Synthesis Processing
The final ten-daily composites (S10) are created in a similar way as for SPOT-VGT:
Spatial aspects:
The composite images follow the same map system as the corrected segments, i.e. WGS84
Geographical Lon/Lat with a resolution of 1°/112. But while the segments only cover limited
zones, the S10-composites always extend over the same near-global area, ranging from -180°
to +180° in longitude and from -56° to +75° in latitude (40 320 columns x 14 673 lines). As
for SPOT-VGT, the composites only contain information for the land pixels. All the water
pixels are flagged with unique missing values codes.
12
Ref. SAF/LAND/VITO/PUM_ENDVI10
Issue: Version 1.3
Date: 1 July 2015
Temporal aspects:
Every month is divided in three "dekads". The first two always comprise ten days (1-10, 1120), the third one has variable length as it runs from day 21 until the end of the month. The
procedure starts with the selection of all segments registered within the concerned dekad and
overlapping at least partially with the mentioned target zone.
Spectral aspects:
In general, for each land pixel in the composite, different observations are available, from
different segments or registration dates. The compositing selects the "best available"
observation and transfers all its components (reflectances, temperatures, angles, status, ...) to
the corresponding layers in the S10 synthesis. A classification action is performed, as
explained further below. After the classification, the best available group is found. If it
contains only one observation, this will be the "best" one. If there are more, the one with the
highest NDVI is selected. This method favours the near-nadir views and suppresses the
observations which are still partly affected by clouds, snow and water (which all have low
NDVI).
Quality Control:
Scenes of NOAA-AVHRR are often affected by radiometric errors (stripes, waves) or
geometrical shifts, especially when a platform reaches its nominal lifetime. Hence, after the
pre-processing each individual segment is visually checked by an operator who identifies and
rejects the bad scenes. Without this measure, the bad segments can spoil the quality of the
final composites. But after one year of similar checks on the AVHRR data of METOP, no
such errors could be detected. So as an alternative, we now only check the daily global
composites, which are produced as well in the background. This requires less time and is as
effective as checking hundreds of individual segments (480 per day).
The compositing is a crucial step. Whereas the individual segments contain a lot of clouds and occupy
different and scattered areas, the final ten-daily composites are better "filled", less contaminated by
clouds and they always cover the full area of the “target zone”, in this case the major part of the globe.
The global S10-composites derived from METOP-AVHRR have the same spatial characteristics as
the S10 of SPOT-VGT both can even directly be superimposed. As mentioned, all sea pixels are
flagged and information is only provided for the land pixels.
The compositing rule is a classical “Maximum NDVI” with constraints on the observation status and
the registration geometry. In practice, for each pixel the available observations are first classified as
follows (Өs=sun zenith angle, Өv=view zenith angle) as shown in Table 3.
13
Ref. SAF/LAND/VITO/PUM_ENDVI10
Issue: Version 1.3
Date: 1 July 2015
REGISTRATION GEOMETRY
OBSERVATION
STATUS
BAD
θs>75° or θv>45
ACCEPTABLE
θs<75° and θv>40
GOOD
θs<75° and θv<40
Cloud
Not used
C2
C1
Snow/Ice
Not used
B2
B1
Clear
Not used
A2
A1
Table 3 : Compositing rule
All observations in the BAD category are immediately discarded. The remaining ones (if any) are
grouped in six classes with the following hierarchy: A1>A2>B1>B2>C1>C2. Then the highest nonempty class is searched. If it contains only one observation, that one is selected, else it will be the one
with the highest NDVI (which promotes the cloud and snow free data). If a pixel has no GOOD or
ACCEPTABLE observations, its position in the composite is flagged with special codes in all spectral
layers. But in all other cases (at least one acceptable measurement), the ENDVI10-composite will
contain the values of the best observation (reflectances, angles, etc.), while its nature (clear, cloudy,...)
is expressed via the ENDVI10 Status Map.
14
Ref. SAF/LAND/VITO/PUM_ENDVI10
Issue: Version 1.3
Date: 1 July 2015
3
Product Description
3.1
Image format and naming convention
The ENDVI10 LSA SAF product follows the following naming standard:
METOP_AVHRR_YYYYMMDD_S10_www_vvv.ee>
where
YYYYMMDD = start date of the concerned dekad. YYYY, MM, DD denote the year, the
month, the day. DD can only be 01, 11 or 21, as being the start of the 10-daily period.
www = the label of the selected geographical window (see paragraph 3.4).
vvv = the label of the concerned image layer (see paragraph 0).
eee = the filename extension (IMG, HDR, TIF or XML).
The ENDVI10 products are distributed in zip archives. The archive uses a simple name convention:
YYYYMMDD_www.zip
with the same convention as described above. Each zip archive contains 26 files:
twelve image layers represented by an image and the corresponding header,
one xml file containing the metadata conform to INSPIRE metadata guidelines version 1.2.
INSPIRE is a European metadata format description providing rules to use the IOS19115
standard. Note the xml file does not have a label representing the image layer, hence no vvv.
The indication whether the data source is METOP-A or METOP-B is comprised in the
metadata file in the element <identificationInfo>/<aggregationInfo>. The source is indicated
as either METOP_A or METOP_B representing the source of the L1b input segments.
one quicklook in a black&white geo-tiff format. The quicklook is sub-sampled to 25% in both
horizontal and vertical direction from the NDVI band.
The image layers are provided in “flat binary” format without header/trailer bytes. “Flat” means that
each layer of a certain composite is stored in a separate image file. These files have the fixed
extension *.IMG. Because all layers have the byte data type (1 pixel = 1 byte), the total number of
bytes in each image is equal to the number of pixels (see Npix in Table 4). This type of imagery can
be easily imported in any standard software for image processing.
Associated to each image file is a small ASCII-formatted annotation file, which uses the same
filename as the image but extension *.HDR. It provides all the basic ancillary information to import
the imagery directly into the ENVI software. Similar annotation files can easily be created for other
packages. Figure 2 depicts an example of the HDR of the NDVI image of EUR-window extracted
from the ENDVI10 of the second dekad of February 2010. The sequence “1.5, 1.5, -11, 75” in “map
info” specifies that the center of the top-left pixel (Col=1.5, Rec=1.5) is located at the geographical
position with Lon=-11°, Lat=75°.
15
Ref. SAF/LAND/VITO/PUM_ENDVI10
Issue: Version 1.3
Date: 1 July 2015
ENVI
description = {METOP-AVHRR, 10-daily synthesis, 20100211-20100220, NDVI,
processing by VITO-Belgium}
samples = 8176
lines = 5600
bands = 1
file type = ENVI Standard
data type = 1
sensor type = METOP-AVHRR
map info = {Geographic Lat/Lon, 1.5, 1.5, -11, 75, 0.0089285714,
0.0089285714, WGS-84, units=Degrees}
Figure 2 : Example contents of the annotation file METOP-AVHRR_20100211_S10_EUR_NDV.hdr
3.2
Temporal characteristics
Every month is divided in three "dekads". The first two always comprise ten days (1-10, 11-20), the
third one has variable length as it runs from day 21 until the end of the month.
The distinction between "days" is based on UT/GMT criteria. And every "dekad" a new ENDVI10 is
generated. Although Metop-AVHRR became operational around mid-2007, the ENDVI10 time series
distributed by VITO only starts in January 2008. The objective is to deliver each new ENDVI10 with
a maximum delay of three days, i.e. at the latest on days 03/13/23.
3.3
Spectral characteristics
Each ENDVI10 composite comprises twelve separate image layers, whose characteristics are listed in
Table 4. All layers have data type “8-bit, unsigned byte”, so the digital values V in the images vary
(potentially) between 0 and 255.
16
Ref. SAF/LAND/VITO/PUM_ENDVI10
Issue: Version 1.3
Date: 1 July 2015
IMAGE
Physical Values Y
Scaling
Digital Values V
UNIT
Ylo→ Yhi
Y = A + B*V
Vlo→ Vhi
Vflag
Rs,RED
%
0 → 62.50
Y=0.250*V
0 → 250
255
SR2
Rs,NIR
%
0 → 83.33
Y=0.333*V
0 → 250
255
SR3
Rs,SWIR
%
0 → 62.50
Y=0.250*V
0 → 250
255
NDV
NDVI
-
0 → 250
255
LST
Land surface
temperature
SZA
VVV
CONTENT
SR1
-0.08 → 0.92 Y=-0.08 + 0.004*V
°C
-50 → 75
Y=-50 + 0.5*V
0 → 250
255
Sun Zenith Angle
degrees
0 → 125
Y=0.500*V
0 → 250
255
VZA
View Zenith Angle
degrees
0 → 125
Y=0.500*V
0 → 250
255
SAA
Sun Azimuth Angle
degrees
0 → 360
Y=1.500*V
0 → 240
255
VAA
View Azimuth Angle
degrees
0 → 360
Y=1.500*V
0 → 240
255
TCO
Nr. of Clear
observations
-
1 → 255
Y=V
1 → 255
0
DAY
Day in dekad
-
1 → 11
Y=V
1 → 11
0
STM
Status Map
-
1 → 255
0
bit-interpretation (see table below)
Table 4 - Image layers of ENDVI10
NIR=near infrared, SWIR=shortwave infrared.
Rs=atmospherically corrected "surface" reflectance, NDVI=Normalized Difference Vegetation
Index=(Rs,NIR-Rs,RED)/ (Rs,NIR+Rs,RED).
V=digital value as indicated in the image, Y=physical meaning.
Vlo-Vhi=Significant V-range. The scaling only holds for this range. Values beyond V lo-Vhi are flags.
Vflag: Per image, there is only one flag to indicate all "aberrant" states (Sea, NoData, NoValidData,
Error). The Status Map image provides more information.
Bit-interpretation of the Status Map (Bit7=Most Significant Bit):
Decimal
Bit-Value
1
0
128
Bit7
Land
Sea
64
32
16
8
4
2
1
Bit6
Bit5 Bit4
Bit3
Bit2
Bit1
Bit0
ValidObs never never
Good
CloudORshadow Cloud
Snow
NoValidObs always always Acceptable none of these Cloudfree NoSnow
Table 5 - Status Map bits
17
Ref. SAF/LAND/VITO/PUM_ENDVI10
Issue: Version 1.3
Date: 1 July 2015
Bits 4 and 5 are unused and always 0.
No cloud shadow detection applied, hence always bit2=bit1
The compositor classifies each pixel's observations in three categories depending on the sun and view
zenith angles: "good", "acceptable" and "bad". The last group is definitely withdrawn, but in the
absence of "good" observations "acceptable" ones may creep into the composites. This is indicated by
bit3.
Sea pixels can be easily recognized because all bits are 0 (thus also the decimal value is zero). Land pixels with
at least one cloud/snow-free observation have decimal value 200 (128+64+8) or 192 (128+64, when bit3=0).
3.4
Spatial characteristics
In a spatial sense, the near-global ENDVI10 are identical to (and congruent with) the ones of SPOTVEGETATION:
Geodetical datum
WGS84
Projection
Unprojected Geographic Lon/Lat
Resolution
ΔLon=ΔLat=1°/112=0.00892857 (± 1 km along a great circle)
Centre of edge pixels
LONmin: -180° → LONmax+179.991071°
LATmin: -56° → LATmax+75°
Ncol / Nrec / Npix
40 320 / 14 673 / 591 615 360
Table 6 - Spatial overview of ENDVI10
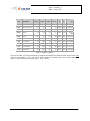
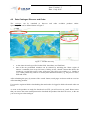
However, the near-global imagery is not distributed as such. Users can only select one of the ten predefined “windows” listed in Table 7. These windows are the same as used for the free distribution
of SPOT VEGETATION products.
Figure 3 - Spatial windows
18
Ref. SAF/LAND/VITO/PUM_ENDVI10
Issue: Version 1.3
Date: 1 July 2015
www
WINDOW
LONmin LONmax LATmin LATmax
Ncol
Nrec
Npix
AMn
North America
-180
-13
40
AMc
Central America
-125
-50
0
50
8400 5600 47 040 000
AMs
South America
-93
-33
-56
25
6720 9072 60 963 840
EUR
Europe
-11
62
25
75
8176 5600
AFR
Africa
-26
60
-35
38
9632 8176 78 751 232
ASw
Asia West
25
98
5
50
8176 5040 41 207 040
ASn
Asia North
45
180
40
ASe
Asia East
68
147
5
55
8848 5600 49 548 800
ASi
Asian Islands
92
170
-12
29
8736 4592 40 115 712
AUS
Australasia
95
180
-48
10
9520 6496 61 841 920
75 18704 3920 73 319 680
45 785
600
75 15120 3920 59 270 400
Table 7 - Spatial windows
The listed LON/LAT-values indicate the geographical longitude and latitude of the centre of the edge
pixels in each window. ‘Ncol’ and ‘Nrec’ are the number of columns and rows in each window and
‘Npix’ is the total number of pixels (Npix = Nrec x Ncol).
19
Ref. SAF/LAND/VITO/PUM_ENDVI10
Issue: Version 1.3
Date: 1 July 2015
4 Data Access
4.1
Introduction
The ENDVI10 products are freely available without limitations for non-commercial use, and
provided under copyright of EUMETSAT. But when they are used for reports, publications or
similar, please mention the reference: "by courtesy of the LSA SAF project, produced by VITO" and
inform us ([email protected]) for which purpose they are used.
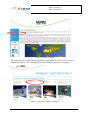
The ENDVI10 products can be accessed through the LSA SAF website (http://landsaf.ipma.pt/), see
Figure
4
or
directly
through
(http://www.metops10.vito.be/index.html).
a
specific
product
website
The ENDVI10 products can be ordered via the on-line catalogue and/or via subscription, through the
link http://metops10.vito.be/etop-s10_pages/gotocatalogue.html, as shown in Figure 5. Selections can
be made in time (e.g. the 36 dekads of 2009) and in space (e.g. one or more of the ten pre-defined
windows), but not in a thematic sense (e.g. only NDVI and LST). Each individual composite thus
always comprises all of the twelve constituent images (see 3.3). The ENDVI10 products are always
delivered in ZIP-form.
Figure 4 : LSA-SAF ENDVI10 home
20
Ref. SAF/LAND/VITO/PUM_ENDVI10
Issue: Version 1.3
Date: 1 July 2015
Figure 5 - Data Access link
The Catalogue refers to a product distribution facility which provides access to several
datasets provided by VITO, amongst them is the ENDVI10 product, see Figure 6.
Figure 6 : ENDVI10 Product Catalogue
21
Ref. SAF/LAND/VITO/PUM_ENDVI10
Issue: Version 1.3
Date: 1 July 2015
4.2
Data Catalogue Discover and Order
The catalogue can be consulted to discover
Specific queries can be defined shown in Figure 7.
and
order
available
products
online.
Figure 7 - Product discovery
A time interval can be specified via the fields ‘Start Date’ and ‘End Date’.
One of the ten pre-defined windows can be selected by activating the “Draw region of
interest” command (icon in top left area). Clicking on the “Search” button then shows the
window(s) covering this region. Some AOIs may only fall in one window (e.g. Canada in
www=AMn), others may even be covered by three different windows (e.g. Iraq in www=ASw,
EUR and AFR).
After submitting the query by means of the ‘search’ button, result pages are shown with an overview
of the matching products.
User must be registered before downloading data and need to be logged in before the actual order can
be set.
As soon as the products are ready for download over FTP, you will receive an e-mail. Please notice
that you can use the same userId/password to download the products from the FTP-server, as the one
you use to log on to the catalogue.
22
Ref. SAF/LAND/VITO/PUM_ENDVI10
Issue: Version 1.3
Date: 1 July 2015
4.3
Data Catalogue subscribe and Massive orders
If you are interested in getting the latest ENDVI10 products in near-real time via FTP, you can use the
subscribe button to configure your subscription. If you are interesting in getting the full product
archive through FTP, you can use the massive order button to configure your order, see Figure 8.
Figure 8 : ENDVI10 subscriptions and massive orders
4.4
Helpdesk
In case of problems or questions, please send an e-mail to the helpdesk
([email protected]).
23
Ref. SAF/LAND/VITO/PUM_ENDVI10
Issue: Version 1.3
Date: 1 July 2015
5 Validation and Quality Control
The adopted strategy for validation is a comparison between the NDVI of METOP-AVHRR and
SPOT-VEGETATION. Both the strength of the agreement and the consistency of this agreement over
time was evaluated. The results of the validation can be found in the following report:
SAF/LAND/VITO/ENDVI_VR/1.0 (February 2013) evaluates the NDVI product
A high, near linear agreement was found between the NDVI of VGT and METOP-AVHRR, and the
results were stable over time. The relationship expressed through the geometric mean regression has a
slope very close to 1.
A seasonality of the differences exists but is likely caused by a combination of SZA and validity of
the atmospheric correction.
The slight non-linearity could be attributed to the differences between the spectral response functions.
Other influencing factors, such as viewing geometry were also demonstrated.
Concerning the best metric to evaluate the similarity and the consistency of the agreement over time,
it is concluded that the agreement coefficient (AC) is superior to R.
24
Ref. SAF/LAND/VITO/PUM_ENDVI10
Issue: Version 1.3
Date: 1 July 2015
6 References
Bartholomé E. and Belward A., “GLC2000: a new approach to global land cover mapping from Earth
observation data”, International Journal of Remote Sensing, vol. 26, no. 9, 1959-1977 (2005).
Berthelot B., “SMAC coefficients for METOP AVHRR/3”, VEGA Technologies SAS, Toulouse,
Internal report SMAC01-TN-AVHRR3-VEGA, 63 p. (2008).
Coll C. and Caselles V., “A split-window algorithm for land surface temperature from Advanced
Very High Resolution Radiometer data: validation and algorithm comparison”, Journal of
Geophysics Research, 102(D14), 16697-16713 (1997).
Cracknell A, 1997, The Advanced Very High Resolution Radiometer, Taylor & Francis, ISBN 0-74840209-8.
Eerens H, Baruth B, Bydekerke L, Deronde B, Dries J, Goor E, Heyns W, Jacobs T, Ooms B, Piccard
I, Royer A, Swinnen E, Timmermans A, Van Roey T, Vereecken J & Verheijen Y, 2009, TenDaily Global Composites of Metop-AVHRR, Proc. of the 6th International Symposium on
Digital Earth, Beijing, 9-12 September 2009 (http://www.isde6.org/).
Eerens H., Piccard I., Royer A. and Orlandi S., 2004, “Methodology of the MARS crop yield
forecasting system. Vol. 3: Remote sensing information, data processing and analysis”, Eds.
Royer A. and Genovese G., EUR 21291 EN/3, 76 p. (2004).
EUMETSAT, “EPS ground segment – AVHRR L1 product generation specification”, EUMETSAT,
Darmstadt, Germany, Document EUM.EPS.SYS.SPE.990004, 158 p. (2004).
EUMETSAT, “AVHRR Level1b Products Guide”, EUMETSAT, Darmstadt, Germany, Document
EUM/OPS-EPS/MAN/04/0029, 123 p. (2008).
Rahman H. and Dedieu G., “SMAC: a Simplified Method for the Atmospheric Correction of Satellite
Measurements in the Solar Spectrum”, International Journal of Remote Sensing, 15(1), 123143 (1994).
25
Ref. SAF/LAND/VITO/PUM_ENDVI10
Issue: Version 1.3
Date: 1 July 2015
Appendix A.
Acknowledgements
The development and implementation have been originally carried out in the JRC-MARS program
under the responsibility of the institutes VITO-TAP and JRC-IPSC with support of the Belgian
Science Policy Office (BelSPO). The global operations and improvements are further carried out
under the responsibility of EUMETSAT’s LSA SAF program.
Appendix B.
Glossary
AOI:
ATBD:
AVHRR:
Col:
CVB:
Dekad:
EC:
ECMWF:
ENDVI:
ENDVI10:
EPS:
EUMETSAT:
EUR:
FTP:
GLC2000:
HDR:
IPMA:
IMG:
JRC:
ENDVI10:
NIR:
Lat:
Lon:
LSA:
LST:
MARS:
METOP:
MIR:
NDVI:
NOAA:
ORR:
PUM:
PRD:
R:
Rec:
RED:
S10:
SAF:
SMAC:
SWIR:
Area Of Interest
Algorithm Theoretical Baseline Description
Advanced Very High Resolution Radiometer
Column
Center for Image Processing, also known as CTIV
10-daily period starting on 01, 11 or 21st of month
European Commission
European Center for Mid-term Whether Forecast
EPS NDVI
10-daily EPS-NDVI
EUMETSAT Polar System
European Meteorological Satellite Organisation
Europe
File Transfer Protocol
Global Land Cover map from year 2000
Header
Instituto de Meteorologia (Portugal)
Flat binary image
Joint Research Center
Metop AVHRR 10-daily, same as ENDVI10
Near Infrared Radiation
Lattitude
Longitude
Land Surface Analysis
Land Surface Temperature
Monitoring Agriculture through Remote Sensing
Meteorological Operational polar satellites of EUMETSAT
Medium Infrared
Normalized Difference Vegetation Index
National Oceanic and Atmospheric Administration (USA)
Operational Readiness Review
Product User Manual
Product Requirements Document
Coefficient of determination
Record (line)
Red radiation channel
10-daily composite starting on 01, 11 or 21st of month
Satellite Application Facility
Simplified Method for the Atmospheric Correction
Short Wave Infrared
26
Ref. SAF/LAND/VITO/PUM_ENDVI10
Issue: Version 1.3
Date: 1 July 2015
TOA:
TOC:
TIR:
VGT:
VITO:
WGS:
ZIP:
Top of Atmosphere
Top of Canopy
Thermal Infrared
Vegetation sensor on board of SPOT satellites
Flemish Institute for Technological Research
Wold Geodetic System
File format used for data compression and archiving
27