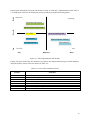
1
Optimizing System Level Testing of Evolved Packet Gateway G U OJ U N WA N G KTH Information and Communication Technology Degree project in Communication Systems Second level, 30.0 HEC Stockholm, Sweden Optimizing System Level Testing of Evolved Packet Gateway Guojun Wang 14th May 2013 Industrial advisor: Karin Nordling, Ericsson Academic adviser and Examiner: prof. Gerald Q. Maguire Jr. KTH Royal Institute of Technology School of Information and Communication Technology Stockholm, Sweden Abstract The goal of this thesis project is to improve industrial system testing efficiency. The thesis is mainly focused on the field of telecommunication. Testing is one of the most important steps before selling a product to customers and testing is also an important component of after sale maintenance. The work load for testers can be decreased and more projects could be carried out in parallel, if the testing efficiency can be improved. The thesis project is carried out within the Ericsson Product Development Unit (PDU) Packet Core System Test section. The goal is to improve the system testing efficiency of the Evolved Packet Gateway, as system testing has gradually become one of the bottle necks for the whole product release. Ericsson wants to accelerate its pace in releasing new products to the market and releasing new software to their customers. An initial investigation was made to get a clear view about how the complete system testing procedure is currently carried out and then, an analysis was made based on this information. Ideas were collected for a proposed new implementation and finally a prototype for the most useful ideas was developed and evaluated to show how the system testing efficiency can be improved. Finally, these ideas were proved to be valuable for Ericsson PDU Packet Core System Test section and two of them have been adopted and are already under developing. Keywords: system testing, EPG, optimization, prototype, test analysis, automation, database i Sammanfattning Målet med detta examensarbete är att förbättra effektiviteten inom industriell systemtestning. Avhandlingen är främst inriktad på området för telekommunikation. Testning är ett av de viktigaste stegen innan försäljning av en produkt till kunder och testning är också en viktig komponent under underhållsfasen. Genom att förbättra effektiviteten i testerna kan arbetsbelastningen för testare minskas och flera projekt genomföras parallellt. Examensarbetet har utförts inom Ericssons produktutvecklingsenhet (PDU) Packet Core, avdelning System Test. Avhandlingens mål är att effektivisera systemtestning av Evolved Packet Gateway (EPG), eftersom systemtest gradvis blivit flaskhalsen för hela produktens release. Ericsson vill påskynda takten som de släpper nya produkter på marknaden och ny mjukvara till sina kunder. En första undersökning gjordes för att få en tydlig bild av hur systemtest utförs för närvarande och därefter, gjordes en analys baserat pådenna information. Idéer samlades in för att föreslå en ny implementering och slutligen utvecklades en prototyp av en specifik idé och den harutvärderats för att visa hur effektiviteten hos systemtest kan förbättras. Slutligen, var dessa idéer visade sig vara värdefullt för Ericsson PDU Packet Core System Test avsnitt och tvåav dem har antagits och håller redan påatt utveckla. Nyckelord: systemtest, EPG, optimering, prototyp, test analys, automation, databas ii Acknowledgements I would like to express my gratitude to many people during this thesis project. Thanks Per Österström, the former Ericsson PDU Packet Core LSV section manager, for providing me this precious opportunity of the thesis project. Karin Nordling, the current manager in this section, has provided strong support behind to give me suggestions. The system testers within this section, especially Rohit Guilian, have helped me a lot to evaluate and improve my proposals out of the thesis project. I also would like to acknowledge the special help from my academic examiner Gerald Maguire, who has helped me from the beginning, refining the thesis scope, polishing the thesis paper, until the end of my thesis presentation. My girlfriend also has supported me with the thesis paper format, so that it looks much more professional now. Finally, thanks all of you. Without the support and help from you, I couldn’t accomplish such a good work. iii Table of Contents Abstract .............................................................................................................................................. i Sammanfattning ................................................................................................................................. ii Acknowledgements ........................................................................................................................... iii Table of Contents .............................................................................................................................. iv List of Figures .................................................................................................................................. vi List of Tables ................................................................................................................................... vii List of Acronyms and Abbreviations ............................................................................................... viii 1 2 Introduction ................................................................................................................................1 1.1 Goal .................................................................................................................................... 2 1.2 Scope .................................................................................................................................. 2 1.3 Target Audience .................................................................................................................. 3 1.4 Methodology ....................................................................................................................... 3 1.5 Structure.............................................................................................................................. 3 Background.................................................................................................................................4 2.1 2.1.1 Evolved Packet Gateway..............................................................................................4 2.1.2 SGW............................................................................................................................5 2.1.3 PGW............................................................................................................................5 2.2 System testing ..................................................................................................................... 5 2.2.1 Software Testing ..........................................................................................................6 2.2.2 System testing taxonomy .............................................................................................6 2.3 3 EPC and EUTRAN .............................................................................................................. 4 Thesis Project related measurements and metrics ................................................................. 8 2.3.1 Load and stability testing .............................................................................................8 2.3.2 Robustness testing........................................................................................................8 2.3.3 Performance test ..........................................................................................................9 2.4 System testing on EPG ........................................................................................................ 9 2.5 Related work ..................................................................................................................... 10 Idea Collection and Exhibition .................................................................................................. 11 3.1 Pre-check of testing environment ....................................................................................... 11 3.2 Real time status tracking .................................................................................................... 12 3.3 Fault detection ................................................................................................................... 14 3.4 Automatic log analysis ...................................................................................................... 14 3.5 Measurement storage in online database ............................................................................ 15 3.6 Abnormal message database .............................................................................................. 15 iv 4 5 3.7 Test requirement ................................................................................................................ 16 3.8 Test Statistics .................................................................................................................... 16 Implementation Proposal ........................................................................................................... 18 4.1 Idea evaluation .................................................................................................................. 18 4.2 Implementation Proposal ................................................................................................... 20 Prototype and Evaluation .......................................................................................................... 21 5.1 5.1.1 Input .......................................................................................................................... 22 5.1.2 Output ....................................................................................................................... 22 5.2 Automatic log analysis with analysis report ....................................................................... 22 5.2.1 Input .......................................................................................................................... 22 5.2.2 Output ....................................................................................................................... 22 5.3 Metrics for evaluation ........................................................................................................ 22 5.4 Evaluation and Decision Analysis ...................................................................................... 23 5.4.1 Accuracy ................................................................................................................... 24 5.4.2 Usability .................................................................................................................... 24 5.4.3 Efficiency .................................................................................................................. 25 5.4.4 Maintainability .......................................................................................................... 25 5.4.5 Portability .................................................................................................................. 25 5.5 6 Result submission .............................................................................................................. 22 Decision Analysis .............................................................................................................. 26 Conclusions and Future Improvements ...................................................................................... 27 6.1 Conclusions ....................................................................................................................... 27 6.2 Future work ....................................................................................................................... 27 6.3 Require reflections ............................................................................................................ 28 References: ...................................................................................................................................... 29 v List of Figures Figure 1-1: LTE SAE Architecture ......................................................................................................1 Figure 2-1: EPC and EUTRAN (figure taken from [9]) .......................................................................4 Figure 2-2: Routing path between UE and a device connected to an IP network ...................................5 Figure 2-3: EPG under test architecture ...............................................................................................9 Figure 2-4: The current way of system testing ................................................................................... 10 Figure 3-1: Real time monitoring GUI............................................................................................... 13 Figure 3-2: Notification window ....................................................................................................... 13 Figure 4-1: Idea implementation PICK chart ..................................................................................... 19 Figure 4-2: Implementation proposal ................................................................................................. 20 Figure 5-1: Framework of prototype.................................................................................................. 21 vi List of Tables Table 3-1: List of ideas ..................................................................................................................... 11 Table 4-1: List of ideas with evaluation information .......................................................................... 18 Table 4-2: List of ideas with their priority ......................................................................................... 19 Table 5-1: Raw value definition ........................................................................................................ 23 Table 5-2: Decision Analysis Spreadsheet for all criteria in total ....................................................... 23 Table 5-3: Decision Analysis Spreadsheet for Accuracy .................................................................... 24 Table 5-4: Decision Analysis Spreadsheet for Usability..................................................................... 24 Table 5-5: Decision Analysis Spreadsheet for Efficiency ................................................................... 25 Table 5-6: Decision Analysis Spreadsheet for Maintainability ........................................................... 25 Table 5-7: Decision Analysis Spreadsheet for Portability .................................................................. 25 Table 5-8: Decision Analysis Spreadsheet in total ............................................................................. 26 Table 6-1 Machine decision making .................................................................................................. 28 vii List of Acronyms and Abbreviations C&C CI EPC EPG EUTRAN FT GTP GUI PDC PDN PDP PDU PGW PIC SAE SGW ST SUT UE Mbps MB Capacity and Characteristic Continuous Integration Evolved Packet Core Evolved Packet Gateway Evolved Universal Terrestrial Radio Access Function Test GPRS Tunneling Protocol Graphical User Interface Packet Data Core Packet Data Network Packet Data Protocol Product Development Unit PDN Gateway Physical Interface Card System Architecture Evolution Serving Gateway System Test System Under Test User Equipment Megabits per second Megabyte viii 1 Introduction In the nearly 100 years since Marconi received his Nobel Prize, thousands of engineers have dedicated themselves to the standardization of mobile communication systems. Mobile communication technology has gone through the first generation analog cellular systems, such as AMPS. The Global System for Mobile Communications (GSM), and CDMA 2000 dominated the second generation. GSM evolved with the introduction of general packet radio service (GPRS) and Enhanced Data rates for GSM Evolution (EDGE). The third generation WCDMA increased data rates with the introduction of High Speed Packet Access (HSPA). The focus of the initial version of GSM was mainly on the transmission of voice. However, the desire for surfing the internet and watching videos via a mobile phone requires high data rates. This requirement leads to the creation of the 3rd generation WCDMA system defined by the third generation partnership (3GPP). Through 3GPP, another more advanced radio technology was introduced to provide even higher data rates and to allow for variable channel bandwidth. This technology is called Long Term Evolution (LTE). LTE is the first truly packetswitched wide area cellular data system which puts everything into packets and transmits these packets in an IP network. With LTE, the System Architecture Evolution (SAE) provides the non-radio part of the complete system. The Evolved Packet Core (EPC), together with LTE constitutes the Evolved Packet System (EPS), which fully supports packet-switched data services. The LTE/SAE architecture and some key interfaces and subsystems are shown in Figure 1-1. Each of these components will be described in more detailed later. EPG Figure 1-1: LTE SAE Architecture As more and more packet data is generated and consumed by subscribers, telecommunication system operators are becoming increasingly desperate for suitable equipment in their EPC. They are looking for network equipment that is stable, supports more functionality, and offers both higher uplink and downlink speeds than current equipment. In order to guarantee the quality of the equipment, testing plays an important role for both the equipment provider and the telecommunication system operators. As the equipment in EPC needs to support a large number of functions, for instance, mobility, routing, charging, session management, etc. The software system is especially complicated. Increasingly the quality of this software determines the quality of the whole system. Software testing is a common process used to collect information about the quality of a product or system under test (SUT). Software testing can be also grouped into classes: unit testing, integration testing, system testing [1], and acceptance testing [2]. These different types of testing ranges from testing an individual subsystem (unit testing) to testing the entire system in operation (acceptance testing). Normally a testing cycle follows the order: Requirement Analysis, Test Planning, Test Development, Test Execution, Test Reporting, Test Result Analysis, Defect Retesting, Regression Testing, and Test Closure [3]. If the whole procedure is well managed, both the testers and the company can improve their productivity. When working with complicated software which has more features and modifications added to it regularly, the time of executing and analyzing test cases can determine how often the new software can be delivered. However, more time is needed when it comes to a more sophisticated testing objective due to the increasing difficulty of testing, e.g. function test and system test, which leads to a slow pace for Continuous Integration (CI) [4] during software development. 1 The concept of CI was come up to reduce the work of merging all the code changes to the main software baseline when developing a new feature or making modifications [5]. By frequently integrating the changes with the existing code repository and software delivery, the risk of code conflict, as known as “integration hell” [6], can be reduced. In order to achieve the target for early integration and fast delivery, the testing efficiency becomes the main constraint in how fast the process can be. As there still has room for improving testing efficiency, Ericsson has started a Fast Feedback Testing Improvement (FFTI) project to increase the testing efficiency in each testing phase in the hope of releasing new products at a faster pace. Due to the limited time and the human resources dedicated for this thesis project, the scope of the thesis project will mainly focus on system testing efficiency optimization of the Evolved Packet Gateway (EPG) node [7], as a pilot for system testing part of the FFTI project. 1.1 Goal Testing is one of the most important procedures for any company to assess the quality of a product. With proper management procedures, testing is also used to maintain and enhance the quality of a product. The specific goals of this thesis project are: 1) Investigate the current system testing procedure for the EPG. 2) Collect or develop new ideas that could help testing the EPG’s specified functionalities in several aspects. These improvements will hopefully make the test analysis and troubleshooting more automatic and thus enhance the efficiency of evaluating functions as part of the system testing. 3) One of these proposals should be implemented and evaluated to show the overall idea(s). This prototype will be used to evaluate how much system testing could be improved if the proposal was implemented as part of the overall system testing procedure of the EPG. 1.2 Scope Even though there are lots of software and tools designed for system testing, it is still quite difficult for them to cover every aspects of system testing due to the limited knowledge of the detailed operations of the product and the evolving requirements on the final product. As a result, the company needs to develop the software both for the SUT and for testing this system. Both of these software developments are valuable for the company. This thesis project should design a pilot that would improve system testing of the EPG node. As part of the system testing, the testing must demonstrate and evaluate stability, and robustness, capacity & characteristic (C&C) of the EPG. The proposed initial direction is to examine the log analysis part of the existing system testing procedure with the aim of making it faster and to produce more precise results which can provide improved feedback to the software developers of the individual subsystems. As part of this work, the thesis project should also address how to manage the results of each test run and other related issues. 2 1.3 Target Audience The system tester, testing automation designer, and software developer should all find useful information in this thesis. Companies that want to improve their system testing efficiency should also be able to use this thesis as a reference. 1.4 Methodology The thesis project started with a literature study about the system testing procedure and system testing techniques focused mainly on those method utilized within the telecommunication industry. An internal investigation was carried out to obtain the knowledge of how system testing is implemented within the specified Ericsson section [8] where this thesis project is being carried out. After comparison and analysis, ideas that might be helpful for system testing were collected from both internal (Ericsson) and external (web, disciplines, other companies, etc.) sources. These ideas were extended according to the thesis project’s practical requirements and a prioritization was done to emphasize the most urgent needs and most important ideas. The idea with the highest priority was developed further to specify a prototype. This prototype was evaluated to show how much this idea can improve the system testing efficiency. 1.5 Structure Chapter 1 gives an overview of the thesis project and should have helped the audience to gain some understanding of this thesis project and its context. Chapter 2 introduces the basic knowledge regarding the SUT – EPG, and also the system testing knowledge relevant to the EPG node testing, as well as the previous work that has been done for system testing. Chapter 3 lists the ideas that were collected and presents them in ascending priority order. Chapter 4 proposes an implementation based on the ideas that were collected. Chapter 5 describes the prototype based on the idea that had the highest priority and provides an efficiency comparison between using the prototype and the current testing method. This comparison is used to evaluate if and by how much the proposal improves the efficiency of system testing of EPG. Chapter 6 concludes this thesis and suggests the future work. 3 2 Background This background chapter introduces the basic knowledge regarding the SUT – EPG, and also the system testing knowledge relevant to the EPG node testing, as well as previous work that has been done on system testing. 2.1 EPC and EUTRAN The EPC is the core network for a 3GPP standardized mobile network. It provides routing, charging, roaming, and other functionality. The Evolved Universal Terrestrial Radio Access (EUTRAN) is the air interface for the mobile network. The enodeb (eNB) and all the associated user equipments (UE) compose the EUTRAN network, as shown in Figure 2-1. The eNB is a radio base station within EUTRAN and handles radio resource management, routes the user plane data towards the SGW, etc. The connection between the UE and eNB is based on wireless transmission. Figure 2-1: EPC and EUTRAN (figure taken from [9]) 2.1.1 Evolved Packet Gateway Referring to Figure 1-1, the combined EPG node is comprised of the Packet Data Network Gateway (PGW) and the Serving Gateway (SGW). The EPG provides an interface between the radio access network (e.g. EUTRAN) and the internet, corporate intranet, or other packet data networks. For example, in order to surf the internet, the UE (e.g. mobile phone, tablet, or other device equipped with an EUTRAN interface) first needs to set up a connection to the desired IP network from the eNB to the SGW/PGW node, then the data can be transferred either from the UE to the IP network or from the IP network to the UE, as shown in Figure 2-2. 4 Figure 2-2: Routing path between UE and a device connected to an IP network 2.1.2 SGW The SGW is the gateway that terminates the core network’s packet network interface towards EUTRAN. It is responsible for transferring user data packets between the EUTRAN and EPC. This means it has to support handovers with neighboring eNBs. The handover process is controlled by the mobility management entity (MME). The SGW functions include [10]: UE mobility anchor point, Packet routing and forwarding, and User plane data transmission between EPC and EUTRAN. 2.1.3 PGW Packet Data Network (PDN) Gateway provides the connection between the EPC and a number of external data network. The PGW functions include [10]: Per-user based packet filtering (for example, deep packet inspection), Lawful Interception, UE IP address allocation, and Charging. 2.2 System testing System testing is part of the overall hardware and software testing. A common element of this testing is to evaluate the performance of the software, so within this project, the system testing was mainly taken within the software testing scope. 5 2.2.1 Software Testing Software testing is usually used to validate and verify that software or another type of product meets its requirements and also to detect any defects and failures before a new software version is released. As the software testing plays an increasingly important role during system development, in the current culture of system development, there are two types of existence of system testing: one independent organization for testing, separated from the development team: one cross functional team [21], which includes system testing, system developer etc. In the testing organization, there are assigned roles for manger, test lead, test designer, system tester, function tester, test automation developer, etc. Classified by the testing period and different levels, software testing includes [11]: Unit testing Unit testing, which is also known as component testing or function testing, the target of it is the individual units of source code, or the modules of a software application. The purpose is to isolate each part of the program and show that each individual works properly. And it is usually performed by the developer. Integration testing It occurs after unit testing and is used for verifying all the units or modules can work together as a group and the communication among each interface works as expectation. System testing For a complete and integrated system, system testing is targeted for evaluating if the whole system performance qualifies the specific requirement. During a test, the testers are assumed to have no knowledge of the source code and internal module design, so it also belongs to black box testing, which does not require any knowledge of the system design. Acceptance testing After system testing, the acceptance testing is used for evaluating the system’s compliance with the business requirements and assess whether it is qualified enough for delivery. 2.2.2 System testing taxonomy The objective of system testing is to evaluate if a system conforms to the requirements specified by the customers. For a large scale complicated system, it takes lot of effort to guarantee that the customer’s requirements have been met. Usually the hardware and software together comprise a complete system, so a broad view of the behavior of the system needs to be examined. For example, if one EPG node functions stable when it has thousands of users connected, will it still be stable when the number of users increase to millions, which is assumed to be lower than the maximum limitation according to the specification. The taxonomy of system testing might be viewed simply as: Basic test A basic test mainly tests if the system can be installed, configured, and brought to an operational state. Five typical basic tests are: boot, upgrade/downgrade, light emitting diode, diagnostic, and command line interface tests. 6 Robustness test A robustness test shows the system’s resilience in the event of any failure. For example, if one component of a system goes down by any reason, e.g. power down, the system should detect out the failure and restart the component or replace it with a spare component. On the other hand, with external operation, the system should also be able to restart successfully. Interoperability test An interoperability test determines if the system can interoperate with other products, for example, the communication between SGW and MME. Performance test A performance test will measure the overall system’s capacity, e.g. throughput, and response time. Stress test A stress test is designed to test the system’s performance while the offered load is in excess of the system’s designed capacity, i.e., push the system beyond its specified limits. When the stress exceeds the specified limits, the system is expected to start its overload protection mechanisms or to recover in case of failure. Load and stability test The purpose of a load and stability test is to measure whether the system can remain stable for a sufficient period of time, when the load reaches the maximum specified limits. Some typical problems that may occur during a load and stability test are: (1) system slows down, (2) system crashes, (3) a counter or gauge malfunction, etc. Reliability test A reliability test examines the system’s ability to continue running for a long period of time without the pressure of a high load Regression test A regression test is designed to ensure there no defects are introduced into the system when delivering new releases as compared with the existing system. Regulatory test The requirements from governments or organizations regulatory bodies should also be fulfilled before delivering the system to the market. One example of regulation might be that user privacy should be protected and data collected by the company not be exposed publicly [12]. 7 2.3 Thesis Project related measurements and metrics The scope of the system testing in this thesis project is mainly focused on load and stability testing, robustness testing, and performance testing. 2.3.1 Load and stability testing Load and stability testing sometimes is also called endurance testing, because this testing is usually run for several days with heavy end user load and mixed traffic generated from the network equipment, e.g. UE, eNB, SGW, PGW, etc. For example, a 48 hours stability test case is executed to test the combined SGW + PGW (EPG) node. After a specified number of UEs are attached via eNBs and have set up connections with the PDN, traffic will be generated. After the traffic in the network becomes stable, this status will be maintained for 48 hours. During this period, some activities are running in parallel: (1) Adding UEs, deleting UEs, modifying the quality of service for connections between UEs and PDN, moving UEs between MMEs, etc. (2) Collecting important data and messages from the EPG node and relevant servers connected with the EPG node, and (3) Monitoring the running status of EPG node. After the stability test case is finished, the logs that were generated during the stability test will be examined. From these logs we will extract a number of performance metrics [13]: Throughput: the number of IP packets or bytes that passed through a specific interface of the EPG node within 1 second, with separate accounting for uplink and downlink traffic Resource usage: the average value of CPU load and memory occupancy (i.e., the fraction of memory utilized of the available memory), the peak value CPU load and peak memory occupancy. Error occurrences: errors, warnings, critical alarms, and Failure: the number of dropped packets, the number of failed connection, etc. 2.3.2 Robustness testing As described in section 2.2.2, a robustness testing measures the system’s resilience in the event of any failure. For instance, after the traffic has reached a stable phase in the load and stability testing scenario, a robustness test is carried out on the EPG node to test if each Physical Interface Card (PIC) can be recovered automatically after being terminated (i.e., set to a non-running state) and if a spare PIC can take over the responsibility of the failed PIC. The performance metrics of this robustness test case can be classified into the following categories: Recovery time: the time duration between when one PIC is terminated and the system has totally recovered after invoking self-restart mechanism. Alarms monitoring: alarms that are generated during the terminating procedure should be cleared after a successful recovery. Inter PIC communication: the systems should be able to inform the spare PIC when a PIC is going to be killed. In this way, the traffic on the failed PIC can be transfered to the spare PIC in advance and the volume of the loss traffic can be decreased during the transfer of responsibility, and 8 Traffic: the volume of traffic during three phases: before the PIC failure, during the PIC recovery, after PIC recovery. It is desired that the volume of traffic should be at an approximately same value, i.e., that not traffic is lost. 2.3.3 Performance test A performance test, also called capacity and characteristic testing, is mainly used for measuring the system capacity and response time [14]. For example, two performance tests are executed to test the EPG node and each test case has a different objective. One test case is designed to test the maximum throughput of the node when the average CPU load reaches the maximum limitation, while the other test is designed to measure the maximum number of Packet Data Protocol (PDP) contexts that can be established between the UEs and PDNs, when there is no failed connection setup. The performance metrics of the capacity and characteristic testing can be described as follow: Maximum throughput: the highest throughput of the EPG node can support without exceeding the maximum allowed CPU load or packet loss. Maximum signaling rate: the minimum time required to set up a PDP request and response loop between UEs and PDNs without any failure, and Resource usage: the highest CPU load without any traffic being dropped or connection failures. 2.4 System testing on EPG When it is said that the EPG is the SUT, this usually means the EPG node is the actual entity and all the nodes and UEs around EPG, e.g. MME, eNB, SGSN, etc. are simulated by tools, as shown in Figure 2-3. Control plane traffic User plane traffic Simulated HSS Simulated MME EPG Simulated PCRF (SGW+PGW) Simulated UE, eNB Simulated PDN network Figure 2-3: EPG under test architecture Before starting the system testing, the equipment around the EPG should be simulated. This means that the EPG should think that it is connected with this equipment. For example, the simulated MME should be connected with the EPG and the simulated eNB. When a complete test network is set up, the system testing cases can be executed in this simulated network. First, using the GRPS Tunneling Protocol (GTP) [15], the EPG, MME and eNB together set up a Packet Data Protocol (PDP) context between a UE and the simulated PDN network using the control plane. With this PDP context, the simulated UE will start requesting content (e.g. webpage, audio, video stream, etc.) from a server in 9 the simulated PDN network via the EPG directly through the GTP user plane [16]. After the sever sends back the requested content, one transaction is finished. When there are multiple PDP contexts and transaction in this simulate d network, the CPU load and memory consumption of the EPG node will also increase. In order to meet different testing requirements, the simulated tools can be configured for a specific testing scenario and during which they generate different types of traffic in the network. . The performance of the EPG in these different testing scenarios will be measured. 2.5 Related work The execution of test cases has been designed to enable a high automation level of testing in the telecommunication area. This is necessary as these systems typically need to support very large numbers of users, very large numbers of devices, and high aggregate amounts of traffic. However, when it comes to system testing, many factors need to be considered and compared, before the final decision of whether the system test case has been passed or not. There are already some excellent tools for analyzing logs from system testing cases, for example, parsing the logs files to get specific values, plotting relevant graphs for a better view of the CPU load or memory occupancy, and striping out the important messages that need to be checked following each test case run. Even though we already have these tools, during the analysis, a system tester still needs to use each of these tools individually and to manually calculate and start checking log files; the lack of integration of these tools makes it difficult to have a fully automatic testing procedure from test case execution, test log analysis, test result storage, and to determine if the SUT works properly. The following graph shows the basic way of working for system testing, starting from the CLI terminal or Webportal, which is a web based management tool, to start the test case run. It goes through the checking procedure of the test environment and executes the test case. After test logs are collected, it comes to the analysis part with several tools. If system testers need to check the requirement of specific test cases, they can login to the test requirement web server and check them. Figure 2-4: The current way of system testing By looking at system testing from an overall system view, this thesis project has proposed a more automatic testing procedure, decreasing the time required for analyzing logs, monitoring the running status of each case in real time, etc. The result is to ease the work for system testers and thus to improve their efficiency. 10 3 Idea Collection and Exhibition This chapter will introduce all the ideas that were collected or developed as the result of investigating current testing procedure within Ericsson PDU Packet Core section. These ideas cover a broad area of system testing, from real time monitoring and result submission in an online database to automatic log analysis and test statistics etc. Some of the ideas originate from a current popular research area, big data analysis, while other ideas were brought up through a comparison between existing commercial tools and the testing method used within Ericsson. Each idea will be described clearly from several different points of view in a section within this chapter. Table 3-1 shows the list of the ideas that were thought to help, regarding to different aspects of system testing. Table 3-1: List of ideas Functions Pre-check Real time status tracking Fault detection Automatic log analysis Measurement storage Abnormal message database Test requirement Test statistics Description Guarantee the testing environment stability before testing Real time monitoring the status of each test case run Provide fault location and potential suggestions To achieve a more automatic analysis procedure after test case run Manage the test results and logs in an online database For better understanding of the error, warning and alarm messages To have a well structured set of test requirements Statistics of test case run, e.g. failure rate and failed reason etc. 3.1 Pre-check of testing environment This idea was brought up to guarantee a stable testing environment before starting the system test case. For system testing, the system under test (SUT) needs to cooperate with other simulator or tools, and save a huge amount of log information to disk. According to experienced system testers everyday there are lots of system test cases executed and high portion of them fail due to an unstable testing environment. 3.1.1 Idea implementation The proposal is to check all the related testing aspects in order to ensure a stable test environment, specifically: Check if there is enough space to save the generated logs after a test case is finished Check if the software has good quality according to previous test cases, before running additional test cases. Check if the EPG node and any Physical Interface Cards (PICs) are reachable Check if the software can be used for different types of EPG nodes, and Check if the versions of the different tools are correct for a specific test case. 11 In most of these cases if the result is negative, then we may be able to fix the problem automatically using scripts. 3.1.2 Advantage If the above list of issues can be checked and fixed properly before executing the test case, it can save a lot of time that would otherwise be spent trying to figure out the reason for some abnormal behavior or failure that is not relevant to the purpose of the desired system testing. 3.1.3 Limitation To check these items is feasible, the challenging part is how to fix them automatically when the reason for a specific kind of error is not easily defined. For example, there might be a large number of reasons for a node not being accessible, then, the script for fixing the failure may cause a greater risk than the failure itself, in such a case we will simply notify the tester of the problem that has been detected. 3.2 Real time status tracking The purpose of this idea is to facilitate earlier fault detection. Usually before one case reaches it’s finally result, there are prerequisites that first need to be fulfilled. The number of prerequisites for system testing is especially large, as compared with unit testing and integration testing. For example, to start a stability test case, the node software should be installed on the EPG, then the relevant severs and tools need to be configured and started before there is any further operation on the EPG node. Afterwards, simulated UEs send traffic to PDN and traffic will be generated in the reverse direction through the network. If we start a 24 hours stability test case, it may take half an hour to finish the preparation phase and only after 24 hours will we can get all the logs and then begin our further analyze of them. The idea is that we should monitor the running status of one test case from the beginning (preparation phase) until the end, thus we could process the logs and error reports in real time [17]. In this way, if there is any early failure occurs in the beginning or middle of the test run, for example, a sever does not start or there are already too many failed connections, the system tester will not need to wait until the end to find out about this failure. This many enable the system tester to either terminate the test early or to change the configuration of the test environment or the SUT - before continuing with testing. Either of these actions will increase the system testing efficiency by avoiding wasting testing time and other resources. This idea can be utilized by developing as one application tool and started in the beginning of one test case run. 3.2.1 Idea implementation The implementation can be divided into two parts: A graphical user interface (GUI) could be used to show the status of each server and tool, as well as the values and messages that are important for system testers to check during the case run. Figure 3-1 shows what such a GUI might look like. 12 Figure 3-1: Real time monitoring GUI The second part is a friendly notification window which can be generated when there is severe error or failure, especially for a test case that may take a long time, to notify the system tester with such a notification window shown in Figure 3-2. An extension to this is to send the system tester e-mail which contains this notification. This email could go to an automatic filter which could send a SMS to the system tester notifying them of either the error or that an error notification has been sent. Abnormal Notification: CPU AVG Load: 99 % Figure 3-2: Notification window 3.2.2 Advantages Normally, when one test case is running, system testers need to login to the node and manually type command in order to check on the running test's status , for example to make sure the test case has really started and is running as expect ed. The advantage of the proposed new function compared with the normal procedure is that we can predefine the expected test case results, while leaving the real time checking to script which can notify the system tester when errors occur. In this way, system testers do not need to check the status quite so often and thus they can spend the saved time on the other tasks. 3.2.3 Limitation As there might be a large number of system testing cases, and there are likely to be different prerequisites for each case, it is hard to make a single GUI that is applicable for all test cases. However, certain common parts of each test scenario could be displayed on the GUI. If the GUI only displays several simple items, then the GUI could be replaced by a script and which generate abnormal notification events. However, if we would like to display more items, then the maintenance of the GUI will be challenging, which may even increase the effort needed to maintain the test cases, as the prerequisites of some test cases might be updated sometimes. 13 3.3 Fault detection Fault detection is different from real time status tracking, as the later mainly focuses on the test case’s running status, while fault detection intends to find out the cause in the event of a failure after the test case has finished running. Usually it takes a long time for a system tester to figure out the reason for the failure, as the necessary information might not be clearly displayed and maybe hidden deeply in the logs. 3.3.1 Idea implementation A script can be developed to check relevant information in the logs to see if an error or failure has occurred. It would be desirable if the script could also suggest solutions to solve the error or failure, as not every system tester is familiar with all the areas of system testing, 3.3.2 Advantage If the fault can be detected and several solutions can be suggested to system testers, then the work load on the system tester can be decreased a lot. 3.3.3 Limitation As with the pre-checking testing environment, for each specific error or failure, there might be many potential reasons. If the script has enough knowledge of the diagnostic – solutions information available, it could at least show a list of possible solutions – even though it does not specify any detailed reason for the error or failure. 3.4 Automatic log analysis The main goal of this idea is to have automatic log analysis by the script instead of the system tester manually processing the logs after a test is finished. An analysis report should be generated to showing if the test case runs properly and if the results fulfill our expectation as to the capacity or quality of the SUT. 3.4.1 Idea implementation There are several rules that need to be observed during test case analysis: Comprehensive The analysis report should contain the most important messages, relevant calculations, or graphs of CPU load, memory occupancy, PDP context number, etc. These values are those that a system tester usually calculates and examines during log analysis. The content on the report should present all the relevant data that can be extracted by scripts. Distinctive mark and notification The report should highlight (marking in different color) the part of the report that needs attention by the system tester. For example, marking red values that has a large difference from the expected reference value. The purpose of this marking is to make the analysis report easy for someone to read and understand, even someone that does not have that much experience with system testing. 14 3.4.2 Advantage If the test report provides most of the information and calculations that a system tester usually needs to do manually, it can save a lot of time for the system tester, and thus enable them to make a decision if a test case runs properly or not. 3.4.3 Limitation As there are different test objectives in system testing, e.g. stability, robustness, C&C, and they all have different checklists during log analysis, thus the report should contain different information depending upon the objective of a specific test. 3.5 Measurement storage in online database This idea was come up due to the need for a lot of data, for example, to be reused as comparison in a subsequent test, plotting the trend of a specific value, or for other purposes. If the data from a test case’s log can be saved in an online database, then it can be fetched and reused for different purposes. 3.5.1 Idea implementation Data will be organized in a good structure according to practical needs and saved in an online database that is accessible to the relevant members of the staff. 3.5.2 Advantage Having the data stored in a database will be much more convenient for the testers and will facilitate comparison of this data with other test runs (for example, this can be used in conjunction with regression testing). As the data can be fetched from the database, comparisons can be done by scripts automatically, rather than manually by system tester. 3.5.3 Limitation There is no technical issue for this idea. The main concern is more about what data should be saved in the database. 3.6 Abnormal message database For a complicated product, a real time monitoring system is quite necessary, to supervise the running of the test in terms of keeping track of the status of the hardware and software, and to report any abnormal behavior, such as errors, warning messages, etc. As one primary purpose of system testing is to detect any failure or abnormal behavior of a product, the system tester may encounter lots of different types of messages, including error messages, warning message, etc. If the system tester has better knowledge of the meaning of these abnormal messages, it would facilitate troubleshooting. 3.6.1 Idea implementation The database used during result submission will be extended to support the implementation of this idea, in order to save the time it would require to maintain another database. Each abnormal message will be saved in the database: In different tables according to the type, e.g. error, warning, alarm, critical, etc. 15 With complete information, including: type of message, an example of the message, regular expression which can be used to search for this message, description of possible root cause, the level of severity, link with any trouble report(s), the current status (open or closed), etc. In such a manner that it can be easily found when search for a specific message. 3.6.2 Advantage If a huge number of abnormal messages can exist in a monitoring system, the system tester may not be able to know and understand all of them through their own experience, especially for a new comer that does not yet have much knowledge of the specific product. With this database, a system tester can search for a specific abnormal message that is hard to understand and learn some basic information about it. This abnormal message database can also benefit for the log analysis automation. Scripts can search for each abnormal message in the database by using the regular expression and then take different actions based upon the level of severity for this specific message. 3.6.3 Limitation The main concern is to collect all the information relevant to each abnormal message, which may cause extra work for the designer who is most familiar with the root cause of a specific This actually means that all such messages and their descriptions needs to be part of what is recorded when the developer inserts the message into the code. 3.7 Test requirement This idea was come up due to the complexity of determining the overall requirements for a specific test case. For example, what is the minimum throughput or maximum signaling rate that should be reached during this test (i.e., what are the expected values of some of the important variables that are associated with this test). 3.7.1 Idea implementation A test requirement database (using the same database as mentioned in section 3.5) should be supported. This database should record the overall requirements of a specific test case. A script can be developed to search for all the related requirements of a test case in the database, combine all of these requirements and insert them as the requirements for a new test in the requirements database. 3.7.2 Advantage It would be easier for a system tester to check if a test case has met the overall requirements of this a test case, rather than needing to several steps to get the necessary information. 3.7.3 Limitation The current format of the requirements is not formalized and it might be difficult for the script to fetch the relevant values for the corresponding items. 3.8 Test Statistics When we say testing efficiency, do we really know how efficient we are? Can we provide an exact figure to show our efficiency? In order to get a correct result, each test case is rerun for five times after modification, for example. Does this repeated testing mean the efficiency is low? These will be quite 16 tough questions if a company has not done an investigation into what is efficiency, what accuracy is required for measures of efficiency, what is the expected variance in efficiency. 3.8.1 Idea implementation Each time when a test case is finished, the system will record some information about the performance of the test case, e.g. pass or fail, duration, times of each run, testing phase (debug or regression), the reason if a case fails, etc. This idea will be supported by three calculating statistics: The failure rate of all the test cases run, The portion of time spent on failed cases in the different testing phases, and The list of the root causes of these failures. 3.8.2 Advantage With the above three statistics, the system testing section may have a better understanding of its testing efficiency and take appropriate actions when the efficiency is not sufficient. 3.8.3 Limitation It is not yet know what level of efficiency is sufficient nor what the expected values of these three statistics and their variance should be. 17 4 Implementation Proposal After the above ideas were brought up and extended with concrete ideas to implement, this chapter presents the output from the evaluation of each idea with one PICK chart and shows how these ideas all together formulate one complete implementation proposal as well. 4.1 Idea evaluation When determining the priority and most useful idea among multiple improvement ideas, a PICK chart can be very helpful. A PICK chart is a Lean Six Sigma [18] tool, for organizing process improvement ideas and categorizing them during the identify [19]. A PICK chart is divided into 4 quadrants, Possible, Implement, Challenge and Kill. That’s also how we get the name of PICK. Horizontal is scale of payoff, while vertical is ease of implementation. The Ideas that fall within Implementation quadrant should the ones that are most useful among all of them. After a lot of discussion and comparison with system testers and developers within Ericsson PDU packet Core section, each idea was fully discussed and evaluated with amount of work and payoff level as shown in Table 4-1. Idea 1 2 3 4 5 6 7 8 18 Table 4-1: List of ideas with evaluation information Amount of work Functions (Relative weeks) 5 weeks Pre-check Real Time Status Tracking Fault detection Automatic log analysis Measurement Storage Abnormal message database Test requirement Test statistics 9 weeks 11 weeks 6 weeks 6 weeks 8 weeks 4 weeks 5 weeks Payoff Medium Low Low High High Medium Low Low High Based on the information of payoff and amount of work for each idea’s implementation from Table 41, a PICK chart was drawn to identify the priority and the most useful ideas among them. Implement Challenge Automatic Log Analysis - Payoff - Measurement Storage in DB Pre - Check Abnormal Message DB Test Statistics Real Time Status Tracking Low Test Requirement Fault Detection Possible Easy Kill - Difficulty - Hard Figure 4-1: Idea implementation PICK chart Finally, the most useful ideas are automatic log analysis and measurement storage in online database, while the priority of these ideas was shown in Table 4-2: Table 4-2: List of ideas with their priority Priority 1 2 3 4 5 6 7 8 Functions Automatic log analysis Measurement storage in online database Pre-check Abnormal message database Test statistics Test requirement Real Time Status Tracking Fault detection 19 4.2 Implementation Proposal These ideas together were used to formulate a proposal for a complete implementation of a prototype to improve system testing. The complete proposal and the relationships between the each part are shown in Figure 4-2. Figure 4-2: Implementation proposal There are two methods to start a system testing case. One is to start it directly from the Linux server's terminal, while another method is to operate it from a webportal (A website based management tool to manage the software, test cases, EPG node, etc.). No matter which method is used to start the system testing case, the whole procedure will go through the following actions: pre-check, execution with real time monitoring, measurement storage in the database and automatic log analysis. The measurement stored within database, the requirement of test case, together with the abnormal message database can be utilized during the automatic log analysis, which aims to compare all the key information among different software versions. If there is anywhere goes wrong, the fault detection can detect out the fault location and provide relevant suggestions about how to solve the fault. And finally one analysis report will be generated. This report shows more detailed information generated by the automated analysis. In parallel with the testing process, the statistics from running test case will be collected and saved into a test statistics database. 20 5 Prototype and Evaluation The two ideas with the highest priority (as described in Chapter 4) were chosen to be developed as a prototype, i.e. Automatic log analysis and Measurement storage in online database. An evaluation was also carried out to show how this prototype can help to improve the system testing efficiency within Ericsson's system test section. The prototype was divided into several steps: First, the logs obtained from test case run is parsed and stored within the online database associated with the software version that is used during test case run. Based on the test case number, one script is generated from the modules in the pre-defined library. The script collects all the required data from the online database and carries out proper calculation to compare the measurement among different software versions. One analysis report that contains a lot of information from the above step will be generated in Portable Document Format (PDF). After presenting the analysis report to the system tester, the system tester needs to make a decision about whether the case was passed or failed according to the information. If the results are considered valid from the view of system tester, then the data will be kept in the database and can be reused in other log analysis. However, if the case has failed, the measurement stored within the database should be removed, and The system tester might correct the problem and initiate a new run of the same test case. Figure 5-1 shows the framework of the prototype and explains the data flow. Figure 5-1: Framework of prototype 21 5.1 Result submission The purpose of this idea is to save key measure of one test case in the online database and the data then can be manipulated in different kind of way to benefit the test case result analysis. 5.1.1 Input The input of this idea can be grouped as: Software Version; Software development branch; Test case; and The parsed numbers and messages from log analysis. 5.1.2 Output The only output is the database tables that save the measurement data which can be used for different purposes, such as comparison, computing trends of CPU load, memory occupancy, etc. 5.2 Automatic log analysis with analysis report As mentioned in section 3.4, the purpose of this idea is to reduce the workload on the system testers, by presenting test case status, results with comparison and relevant graphs on a report. Due to the limited time, the scope of the automatic log analysis only contains basic information check, test case status check, key measurement value comparison, which are part of the normal complete analysis procedure and can be automated relative easily compared with others, e.g. graph comparison. 5.2.1 Input In order to generate a test report, the following input is required: Log files from test case; Script for parsing values, messages, and automatic comparison; Library for generating PDF file; and Necessary data from the database. 5.2.2 Output The only output of this prototype is the test case based analysis PDF report. 5.3 Metrics for evaluation The evaluation will be carried out from several different aspects: Accuracy: If the information in analysis report is accurate and can be trusted by system tester Usability: How convenient is this new method in comparison with the current method for log analysis Efficiency: The time spent on the logs analysis compared with the one using the traditional method 22 Maintainability: Can be maintained in a systematic way in the future? Portability: The ease of adapting this prototype to the existing testing system 5.4 Evaluation and Decision Analysis This prototype was evaluated from different aspects within Ericsson system testing section by test objective leaders, system testers, test automation designers, to provide practical and empirical figure about the performance of this prototype. After the selection criteria and subgroups for each criterion were determined for the evaluation, decision analysis spreadsheet was used to evaluate the prototype compared with existing tools. Decision analysis is a discipline to address important decisions in a formal manner. There are different way to present the decision analysis, e.g. influence diagrams and decision trees. However, the emphasis of this evaluation was to compare between different tools from several criteria, so spreadsheet is more suitable for addressing the difference between them by using the selection criteria and assigning a weighted value to the criteria. The tool that has the highest score can be the preferred choice [20]. During the decision analysis procedure, each criterion and its subgroups were assigned with one weight according to its importance and the individuals carrying out the evaluation assigned a raw value to each subgroup of a criterion, which resulted in a weighted score. Finally the weighted score were then summed up for each criterion and compared [20]. The meaning of each raw value and decision spreadsheet for criteria can be found in the following table 5-1, while the weight for each decision criteria within the evaluation can be seen in table 5-2: Raw value 1.0 0.75 0.5 0.25 0.0 Item A B C D E Table 5-1: Raw value definition Definition Alternative fully satisfies the requirement or decision criteria Alternative partially satisfies the requirement or decision criteria Alternative partially satisfies the requirement or decision criteria Alternative partially satisfies the requirement or decision criteria Unknown or null Table 5-2: Decision Analysis Spreadsheet for all criteria in total Compared testing system Existing tools Prototype Decision Criteria Weight Raw Weight Raw Weight Accuracy 15% Usability 15% Efficiency 30% Maintainability 20% Portability 20% Total 100% The evaluation of each criterion was further performed in independent decision analysis spreadsheets and afterwards, the decision analysis spreadsheet for all criteria will be filled out. 23 5.4.1 Accuracy This prototype was utilized by test objective leaders and system testers in real testing projects. The criteria for accuracy includes: 1) show the information correctly, 2) the calculation is correct, 3) The mark is done correctly Table 5-3: Decision Analysis Spreadsheet for Accuracy Compared testing system Item Decision Criteria Weight Existing tools Raw A Accuracy 15% Weight Prototype Raw 15% Weight 15% A.1 Show the information correctly 30% 1 30% 1 30% A.2 The calculation is correct 40% 1 40% 1 40% A.3 The mark is done correctly 30% 1 30% 1 30% Subtotal 100% 100% 100% 5.4.2 Usability System testers will provide relevant information about the usability of the prototype, if it’s easy to use and provide clear information to them. The criteria for usability includes: 1) Ease to execute, 2) Ease to open the report, 3) Ease to view the content in report, 4) Ease to catch the key information Item B B.1 B.2 B.3 B.4 B.5 24 Table 5-4: Decision Analysis Spreadsheet for Usability Compared testing system Existing tools Existing tools Decision Criteria Weight Raw Weight Raw Weight Usability 15% 13.5% 14.25% Ease to execute 15% 1 15% 1 15% Ease to open the report 15% 1 15% 1 15% Ease to view the content in report 20% 0.5 10% 0.75 15% Ease to catch the key information 30% 0.5 15% 0.75 15% Enough information for analysis 20% 1 20% 0.75 30% Subtotal 100% 85% 95% 5.4.3 Efficiency The time spent on analyzing the same information from existing tools and prototype will be listed out and compare. The information includes: the status of dallas sever, core dump situation, comparison between previous build and foundation baseline build, the value trend over a series of builds. Item C C.1 Table 5-5: Decision Analysis Spreadsheet for Efficiency Compared testing system Existing tools Prototype Decision Criteria Weight Efficiency Time for Analysis (min) Subtotal 30% X X Raw Weight Raw Weight X X X 9% 10 X X X X 30% 3 X 5.4.4 Maintainability Designers will take responsibility of the maintainability evaluation part. Looking from a long term view, it should be able to use this prototype continuously, update or add more features, etc. The criteria for maintainability includes: 1) Ease to add more information in the report, 2) Ease to reduce the information in report, 3) Ability to handle change Item D D.1 D.2 D.3 D.4 Table 5-6: Decision Analysis Spreadsheet for Maintainability Compared testing system Existing tools Existing tools Decision Criteria Weight Raw Weight Raw Weight Maintainability 20% 17.25% 18.25% Ease to add information for analysis 25% 0.75 18.75% 1 25% Ease to reduce information for analysis 25% 0.75 18.75% 1 25% Ability to handle changes 20% 0.75 18.75% 0.75 18.75% Ease to manage the database 30% 1 30% 0.75 22.5% Subtotal 100% 86.25% 91.25% 5.4.5 Portability In order to make use of this tool, the first step is to adapt it into current testing system. The following parts will be affected: (1) Interaction with existing database, (2) Integration of testing tools, (3) Interaction with other supplementary tools. The criteria for portability includes: 1) Ease to switch to existing online database, 2) Ease to interact with other necessary tools, 3) Ease to be integrated within other tools, 4) Ease to be extended for other test cases Item E E.1 E.2 E.3 E.4 Table 5-7: Decision Analysis Spreadsheet for Portability Compared testing system Existing tools Existing tools Decision Criteria Weight Raw Weight Raw Weight Portability 20% X 17.5% X 18.75% Ease to switch to existing online database 25% 1 25% 0.75 18.75% Ease to interact with other necessary tools 25% 1 25% 1 25% Ease to be integrated within other tools 25% 1 25% 1 25% Ease to be extended for single test cases 25% 0.5 12.5% 1 25% Subtotal 100% 87.5% 93.75% 25 5.5 Decision Analysis Based on the previous evaluation, finally the table was filled out and presents the comparison between the current testing tools and the prototype. Item A B C D E Table 5-8: Decision Analysis Spreadsheet in total Compared testing system Existing tools Prototype Decision Criteria Weight Raw Weight Raw Weight Accuracy 15% 15% 15% Usability 15% 13.5% 14.25% Efficiency 30% 9% 30% Maintainability 20% 17.25% 18.25% Portability 20% 17.5% 18.75% Total 100% 72% 96.25% According to the above decision analysis, the weighted value of prototype is 96.25% and the existing tools get 72% weighted score. So the prototype has 24.25% advantage over the existing tools. However, the weighted value 96.25% only shows the relative superiority over other tools within the specified scope, but it doesn’t mean it’s close to the perfect situation. 26 6 Conclusions and Future Improvements In this chapter, the thesis project is finalized by presenting the results and proposing future improvements that can be further investigated or studied to help improve the system testing efficiency. 6.1 Conclusions With higher requirement from customers and also the fierce competition from other companies within telecommunication area, accelerating the speed to deliver new products with high quality becomes more and more necessary for Ericsson PDU packet core section. One CI project was initiated to fulfill this mission. However, when it comes to the system testing phase, due to the complexity of system testing case result analysis, the procedure is slowed down. This thesis project aims to solve the current concern of system testing on packet core product, EPG node, by coming up one proposal to improve the testing efficiency. After lot of investigation and study of current way of system testing, eight ideas were brought up and evaluated by system testers, designers and managers within the relevant section. Among these eight ideas, two of them were considered to have a high payoff for Ericsson, while two ideas with medium payoff, and another four ideas with low payoff [see Table 4-1]. One PICK chart was used to identify the most useful ideas for this thesis project, and it turns out to be the two ideas that have the highest payoff for Ericsson: Automatic log analysis and Measurement storage in online database. These two ideas were further implemented within one prototype, which is used to compare with the existing tools from several aspects, and evaluated to show the advantage over the existing tools. The figure from evaluation has shown that this prototype has 24.25% superiority over the existing tools. The most time consuming parts of system testing are test log analysis and troubleshooting. A well done test log analysis can help troubleshooting a lot as well. At the end of this thesis project, Ericsson already has assigned one team to start a new project based on the prototype, to upload key test measurement into online database and have a more automatic log analysis. 6.2 Future work Even though eight ideas were brought up to help out with the system testing optimization, only two of them were already implemented within a project while other two were listed out in the future work. The rest of the four ideas are still useful but not so valuable compared with other ideas. But it would be beneficial if they can be investigated further. Taking test statistics as one example, it will provide everyone a clear figure about how efficient they are during the test execution. These figures could be very interesting for the managers and stakeholders, as they may affect the progress of a project. Except for all the above mentioned ideas in this paper, I also have several suggestions for future work. One is using software libraries for distributed processing of large data sets using simple programming models, for example Apache Hadoop and Pig, when there are large set of data for automatic log analysis. These software libraries are well developed and can be downloaded from Apache official website. In addition, it also might be helpful to look into another one, which is about machine decision making to help system testers to make a preliminary decision of the quality of the test case run. After the automatic log analysis is ready, one algorithm can be developed to calculate all the difference together with relevant weight values from the log analysis, which is similar as the decision analysis used in section 5.4. Instead of using raw and weight values, this idea can make use of different 27 percentage from comparison and weight values. Taking the data in table 6-1 as example, the measurements that are crucial can be associated with high weight value, while less important measurements can have a lower value. The final difference from the comparison can be obtained from equation: Diff (5 100 23 100 4 20 0 20) 100 100 20 20 The final difference between these two versions is 12. Then the decision depends on the value of threshold. If the threshold is 3, this test run might be failed. Otherwise, the result can be taken as valid. Table 6-1 Machine decision making Measurements EPS Context Number Packet Rate (Mbps) CPU Load (%) Memory occupancy (MB) Final difference Current Veriosn Value 2000 300 50 450 Value 1900 230 48 450 Previous Veriosn Diff (%) Weight 100 5 23 4 0 12 100 20 20 The intention of this idea is to help system tester to evaluate the comparison and provide any suggestions about pass or failure. However, in the beginning, system tester still holds the power to make a decision. When this algorithm is mature enough, maybe system tester can count on it. 6.3 Require reflections During this thesis project, I have learned a lot from it. Even though I worked alone, there were lot of conversation, discussion and meetings with the employees within Ericsson. However, in the beginning, as the scope of the thesis project was very broad and I can’t focus on any of them. With the help from my examiner Maguire and my industrial supervisor, we have managed to narrow it down. I think I need to have a better planning for any projects in the future, to have a clear and specific scope. 28 References [1] ‘IEEE Standard Computer Dictionary. A Compilation of IEEE Standard Computer Glossaries’, IEEE Std 610, p. 197, 1991, DOI:10.1109/IEEESTD.1991.106963. [2] “Software testing - Wikipedia, the free encyclopedia,” Software Testing. [Online]. Available: http://en.wikipedia.org/wiki/Software_testing. [Accessed: 05-Feb-2013]. [3] “Software testing - Wikipedia, the free encyclopedia.” [Online]. Available: http://en.wikipedia.org/wiki/Software_testing#cite_note-41. [Accessed: 12-Feb-2013]. [4] “Continuous integration - Wikipedia, the free encyclopedia.” [Online]. Available: http://en.wikipedia.org/wiki/Continuous_integration. [Accessed: 14-Feb-2013]. [5] S. Stolberg, ‘Enabling Agile Testing through Continuous Integration’, in Agile Conference, 2009. AGILE ’09., 2009, pp. 369 –374, DOI:10.1109/AGILE.2009.16. [6] “Integration Hell.” [Online]. Available: http://c2.com/cgi/wiki?IntegrationHell. [Accessed: 14-Feb-2013]. [7] “Ericsson EPG Real Entity.” [Online]. Available: http://archive.ericsson.net/service/internet/picov/get?DocNo=28701EN/LZT1105300&Lang=EN&HighestFree=Y. [Accessed: 12-Feb-2013]. [8] “Evolved Packet Gateway - Ericsson.” [Online]. Available: http://www.ericsson.com/ourportfolio/products/evolved-packet-gateway. [Accessed: 12Feb-2013]. [9] ‘File:EUTRAN arch.op.svg - Wikipedia, the free encyclopedia’. [Online]. Available: http://en.wikipedia.org/wiki/File:EUTRAN_arch.op.svg. [Accessed: 10-March-2013]. [10] 3GPP TS 23.203: "General Packet Radio Service (GPRS) enhancements for Evolved Universal Terrestrial Radio Access Network (E-UTRAN) access" (Release 10), Mar. 2012. [11] Kshirasagar Naik and Priyadarshi Tripathy, Software Testing and Quality Assurance Theory and Practice (2008), John Wiley & Sons, Inc. ISBN 978-0-471-78911-6 [12] Privacy protection: Graham Greenleaf, Global Data Privacy Laws: 89 Countries, and Accelerating: http://papers.ssrn.com/sol3/papers.cfm?abstract_id=2000034 [13] B. Eric, Design for Reliability Information and Computer-Based Systems. A John Wiley & Sons, Inc., 2010. [14] “Software performance testing - Wikipedia, the free encyclopedia.” [Online]. Available: http://en.wikipedia.org/wiki/Software_performance_testing. [Accessed: 05Feb-2013]. 29 [15] 3GPP TS 36.300 V8.12.0, Evolved Universal Terrestrial Radio Access (E-UTRA) and Evolved Universal Terrestrial Radio Access Network (E-UTRAN); Overall description; Stage 2 (Release 8) Mar. 2010. [16] C. B. Barring, ‘Digital cellular telecommunications system (Phase 2+); Universal Mobile Telecommunications System (UMTS); LTE; Anonymous Communication Rejection (ACR) and Communication’, 2009, Available at http://www.etsi.org/deliver/etsi_ts/124600_124699/124611/08.02.00_60/ts_124611v0802 00p.pdf. [17] B. Plattner, ‘Real-Time Execution Monitoring’, IEEE Transactions on Software Engineering, vol. SE-10, no. 6, pp. 756 –764, November 1984, DOI:10.1109/TSE.1984.5010304. [18] M. L. George and M. George, Lean six sigma for service. McGraw-Hill New York, 2003, SIBN-13: 978-0071418218 [19] ‘Pick chart - Wikipedia, the free encyclopedia’. [Online]. Available: http://en.wikipedia.org/wiki/Pick_chart. [Accessed: 14-April-2013]. [20] M. S. Bandor, ‘Quantitative Methods for Software Selection and Evaluation’, September 2006. [21] “Cross-functional Team - Wikipedia, the Free Encyclopedia.” Accessed April 14, 2013. http://en.wikipedia.org/wiki/Cross-functional_team. 30 TRITA-ICT-EX-2013:73 www.kth.se