1
26/09/2011
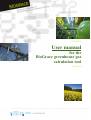
User manual
for the
BioGrace greenhouse gas
calculation tool
Version 1b
This support document is designed to help the economic operators to understand and use the BioGrace
Greenhouse gas (GHG) calculation tool. The main questions that arise concerning the tool are presented
below, with a link to the appropriate chapter within this user manual.
If the BioGrace tool is to be used for making actual calculations, then the user shall also refer to the
BioGrace calculation rules1
Functions of the tool
This chapter details the different ways of using this tool. You
will find why this tool was developed and what it can do.
How does the tool work?
This chapter explains how the tool is designed and the general
principles of the calculations.
How to understand and pilot the results?
How to deal with inconsistencies?
This part describes how the result module, in head of each
pathway, works. It also explains how to choose between
disaggregated default value and actual default value.
This part gives information on how to find and how to cope with
revealed inconsistencies in the calculations.
How can I use the tool to understand the
default values?
How can I use the tool to calculate my own
actual value?
These chapters allow you to make the best use of the tool
depending on your personal objective.
How can I create a new pathway with the
tool?
How to use the LUC sheet?
A step by step tutorial may help you to declare a land use
change in one of your pathways.
How to use the Esca sheet?
Information about “Improved agricultural management” can
help you take into account carbon stock changes related to
improved practices.
How to use the N2O emissions IPCC sheet?
Why was there a need for the BioGrace
project?
Glossary
1
A step by step tutorial may help you to calculate the N2O
emissions of your pathway.
You can refer to this chapter if you want more information on
the context of the BioGrace project.
This section provides you with the definition of the specific
wording used in the tool or in this document.
Please find the BioGrace calculation rules document as part of the ZIP file BioGrace_GHG_calculations_-_version_4b_-
_Public or as a separate document on the BioGrace website.
2
Contents
1
Functions of the tool.......................................................................................................................................... 4
2
General presentation of the tool ....................................................................................................................... 5
2.1
First and fast navigation within the tool ...................................................................................................... 5
2.2
Color-coding of Excel cells in calculation sheets .......................................................................................... 7
2.3
Comments .................................................................................................................................................... 8
2.4
How GHG calculations are made within this tool ........................................................................................ 9
2.4.1
General principles ............................................................................................................................... 9
2.4.2
Presentation of a module.................................................................................................................... 9
2.4.3
Result module and general information ........................................................................................... 11
2.4.4
Allocation modules............................................................................................................................ 13
2.4.5
Units used.......................................................................................................................................... 14
2.4.6
Specific calculation points to be known............................................................................................ 14
2.4.7
Details about N2O calculation ........................................................................................................... 14
3
Function 1: using the tool to have details on default value calculations......................................................... 16
4
Function 2: Adapting pathways to calculate an actual value........................................................................... 18
4.1
Modifying input data only.......................................................................................................................... 18
4.2
Adding specific standard values for existing input..................................................................................... 18
4.3
Adding an input in a pathway .................................................................................................................... 21
4.4
Adding a new input in a pathway............................................................................................................... 22
5
Function 3 : Creating a new pathway .............................................................................................................. 23
6
Technical detail on specific issues ................................................................................................................... 24
6.1
How to use the LUC sheet? ........................................................................................................................ 24
6.2
How to use the Esca sheet? ......................................................................................................................... 27
6.3
How to use the N2O emissions IPCC sheet? ............................................................................................... 27
6.4
Inconsistency in use of global warming potentials .................................................................................... 29
6.5
Declaring the 29g Bonus ............................................................................................................................ 30
7
Why was there a need for a BioGrace project? ............................................................................................... 31
7.1
7.1.1
A need for GHG reduction guaranty.................................................................................................. 31
7.1.2
How were the default and typical value calculations developed?.................................................... 31
7.2
8
Historic of the RED calculations ................................................................................................................. 31
History of the tool and BioGrace project ................................................................................................... 32
Glossary ........................................................................................................................................................... 33
3
1 Functions of the tool
Access and understanding of biofuel GHG calculations should be available to all involved or interested
actors; this can cover a very large and diversified public. For this reason Excel was used to set up the
BioGrace GHG calculation tool. The present document gives insight on how to understand and use this
tool.
Three main functions have been identified when developing the tool:
1. Give details on RED default value calculations: the calculation sheets have been developed to
detail the exact and comprehensive methodology applied to established default values of the
Renewable Energy Directive.
2. Adapt existing pathways for actual value calculations: adapting some of the input numbers of
the calculation sheet allows easy and RED compatible own actual value calculations. It is also
possible to add your own standard values (or conversion factors, see the final glossary for
definition of part 4.2) in the calculations (for example, adding a specific chemical input). The tool
can also be used to estimate the GHG weight of any process or any improvement actions.
3. Create a new pathway; next to the two main functions, it is also possible to create a whole new
pathway within the tool. Some advice on how to do this is given at the end of this tutorial.
However, the tool does not offer user-friendly functionalities for this function; the user should
first have obtained a thorough understanding of the tool before being able to create a new
pathway.
Each function is described in more detail in their specific chapters.
General information about the tool is given in the following chapter before detailing how to use the tool
for the functions mentioned above.
4
2 General presentation of the tool
2.1 First and fast navigation within the tool
The tool is organized in several excel sheets.
The first sheet, “About”, explains some of the vocabulary and calculations allowed by this tool.
The second sheet, “Directory”, shows all the links to the excel sheets with explicit names; for instance,
“Fame from rape seed” is linked to the “F-Rs” sheet.
After these generic sheets, the user can find several calculation sheets dedicated to one precise aspect of
the calculation:
•
LUC assesses the GHG impacts of possible Land Use Changes,
•
Esca for carbon stock changes due to improved agricultural practices.
5
•
N2O estimates N2O emissions in accordance with the IPCC methodology2. This sheet will be
provided in a next version of the tool.
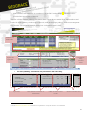
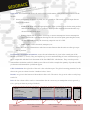
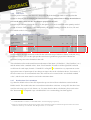
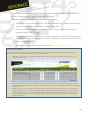
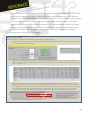
The user will then find the pathway calculation sheets. These sheets contain all the input numbers and
results for all the pathways in the scope of the tool, with one sheet per pathway, in the most transparent
way possible. The following example shows how a calculation sheet is built.
Summary of
the Results
Calculations
using
standard
values
Inputs and
input data
For each pathway, calculations are presented in the same way:
Transport
to and
of from
ethanol
depot
Quantity of product
1,000 MJEthanol / MJEthanol
Ethanol
40688,0 MJEthanol ha-1 year-1
0,531 MJ / MJWheat, input
Transport per
Truck for liquids (Diesel)
Fuel
Energy cons. depot
Electricity EU mix LV
300 km
Diesel
0,0059 ton km / MJWheat, input
0,00084 MJ / MJEthanol
2
Intermediate Calculation or
Information
Info
per kg ethanol
g CO2
g CH4
0,99
0,00
0,00
0,99
0,00
0,00
0,11
2,92
1,10
29,46
0,10
Result
Input Data
Calculated emissions
Emissions per MJ ethanol
g N2O g CO2, eq
g CO2,eq / MJEthanol
GHG calculations and
results
g CO2, eq
26,54
Results in another unit
See the BioGrace calculation rules document for explanations on why this model is recommended.
6
The two last sheets: “user defined standard values” and “standard values” present the generic data
necessary for the calculations.
The “Standard values” sheet refers to conversion factors used for the calculation of RED default values.
Their main data are GHG emission coefficients, which are the emissions of the main GHG gas associated
with 1 kilogram inputs (N-fertilizers, chemicals, etc.). It also contains other data necessary for the
conversion steps of the calculation: Lower Heating Values (LHV) for fuels and energy products, fossil
energy inputs, fuel efficiency for fuels, etc. These data are also to be used in case the user creates a new
pathway.
The “user defined standard values” sheet is provided in case the user wants to use conversion values
that are not included in the list of standard values (see section 5.1 detailing how to use the tool for this
specific use). Please note that BioGrace has formulated rules on when own standard values can be used,
these rules can be found in the BioGrace calculation rules.
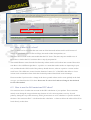
2.2 Color-coding of Excel cells in calculation sheets
Generalities: The tool is built on a very simple colour–code for cells.
•
White cells are used for input numbers. The existing values are the ones used for the RED default
value calculation. These cells can be changed by any user to test or adapt any pathway.
7
•
Grey cells are used for calculations and information that should not be changed (except when
adapting a pathway by adding new inputs or modifying the standard value called (see the section
on how to modify or add an input)).
•
Blue cells offer calculation results for a module or for an aggregation of modules.
Please note!: in case a calculation is made that will be used to show the GHG performance of a
biofuel as part of fulfilling the sustainability criteria of the RED or FQD, the function “track changes”
should be turned on. On each of the Excel sheets for the biofuel production pathways you can find
(on the left, near the top of the sheet under the results) an orange “button” which is named “Track
changes: ON” or “Track changes: OFF”. You should put this button to “Track changes: ON”. This
will cause that a change in a cell will be marked by a yellow background-colour and a red box around
the cell. This helps to keep track of changes from the original document which will be helpful for any
certification supervision of any actual value certification.
2.3 Comments
Comments have been attached to some cells. Comments appear with the usual format of Excel comments,
as a small red triangle in the right corner of the commented cells.
These comments are helpful to understand how the calculations for the RED default value were made.
Some inconsistencies are reported here. They also support detailed explanations whenever needed.
Please note!: note that for your actual calculation, you should always follow the RED methodology
and the precisions brought by the Communication papers from the Commission, and the rules set up
under the BioGrace tool defined in the BioGrace calculation rule.
The inconsistencies with the adopted methodology and pointed out by the comments are just for your
information. You should not apply the wrong approach in any way.
8
2.4 How GHG calculations are made within this tool
2.4.1 General principles
The RED Directive and the calculations in the BioGrace tool follow a Life Cycle Assessment (LCA)
perspective to evaluate the GHG emissions of one MJ of fuel. This means that:
• The functional unit is here “the production and use of one MJ of fuel”.
• All life cycle steps from biomass production to fuel use are taken into account. Each step of the life
cycle is presented in the calculation sheet within a dedicated module representing one step in the
biofuel production pathways.
• For biofuels, the use phase bears no emission of GHG as the CO2 emitted is biogenic (and the CH4
emissions occurring when burning a fuel are insignificant and fall under the cut-off rule).
• A module gathers the inputs' consumptions and calculates the emissions of the three main gases
contributing to climate change (CO2, CH4, and N2O). Details of the contribution of each gas in the
results are presented in the last step of the calculation in order to have a high traceability of the
contributions as required in the ISO norm.
• GHG emissions of each module are then summarized to obtain the GHG emission of the whole
pathway. Details of the modules aggregated under each of the RED defined step are given under 2.4.3
Result module and general information.
• Detailed calculation formulas can be seen by clicking each cell in the sheet. Methodological rules can
be understood from looking at the formula calculated. All the different rules cannot be defined here.
For more details, please refer to Annex V.C of the RED directive, and to the BioGrace calculation
rules.
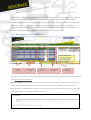
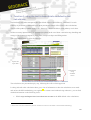
2.4.2 Presentation of a module
A module contains the following data (please refer to the previous picture for visual example):
9
Input data: the left hand side shows the main technical information of the process step modelled in the
module.
•
Names and quantity of inputs, of yields, etc, are given here. Three main types of input data are
listed in the module :
o Yield of the step, using the appropriate unit. These yields are given for the main product,
and also for all the existing co-products. No co-product mentioned means that this step
doesn't have any co-product.
o Energy inputs with for instance electricity or steam consumption. Steam consumption
can be detailed in a calculation showing how the conversion plant generating the steam,
the fuel input and possibly the electricity output in case of a CHP.
o Other inputs such as chemical, transports, etc.
•
Units: this is the key information to take into account. Beware that the units are often given per
MJ of products.
Intermediate calculation information: some relevant information is given in the central part of the
module (columns E, F and G). They are helpful to give easier understanding of some calculation stage, or
more comparable with the Excel document of the first LBST-JRC calculations. They can also provide
intermediate calculation useful for further part of the tool. In this example the quantity of product (in MJ)
per hectare and intermediate yields data appear.
GHG Calculation: the right side of the tool is the calculation part. The global warming potentials for the
three main gases are taken from the "Standard values" sheet.
Results: are given in the bottom of the module in blue cells. The unit is also given in order to easily keep
track of it.
Info: the last column offers results or intermediate data in a more easy-to-manipulate unit (in general, g
CO2,eq per kg of wheat or per kg of biofuel).
Transport
to and
of from
ethanol
depot
Quantity of product
1,000 MJEthanol / MJEthanol
Ethanol
40688,0 MJEthanol ha-1 year-1
0,531 MJ / MJWheat, input
Transport per
Truck for liquids (Diesel)
Fuel
Energy cons. depot
Electricity EU mix LV
300 km
Diesel
0,0059 ton km / MJWheat, input
0,00084 MJ / MJEthanol
Intermediate Calculation or
Information
Info
per kg ethanol
g CO2
g CH4
0,99
0,00
0,00
0,99
0,00
0,00
0,11
2,92
1,10
29,46
0,10
Result
Input Data
Calculated emissions
Emissions per MJ ethanol
g N2O g CO2, eq
g CO2,eq / MJEthanol
GHG calculations and
results
g CO2, eq
26,54
Results in another unit
10
Some modules dealing with specific issues can be found at the bottom of each calculation sheet. Indeed,
some agricultural practices or local conditions also need to be taken into account within the RED
methodology, for instance no tillage, or carbon storage due to straw incorporation into soils. Issues like
"Land-Use-Changes", "CO2 storage", "Improved agricultural management", have been added to
specifically address and take into account these subjects in each calculation sheet. Another specific
module, containing allocation calculations, is described in the following section.
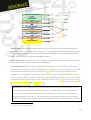
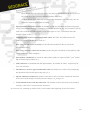
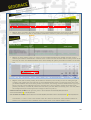
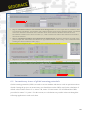
2.4.3
Result module and general information
Detailed
results
Track change
button
Global
Results to use
RED default
values
General
information
The first lines of each Excel sheet present the results synthetically for the pathway calculated in this Excel
sheet. It is made of 4 main parts:
Detailed results: this first part gives the step by step results before and after allocation. The aggregated
results given by white text correspond to the one given in annex V of the RED (see the box below).
Several calculation modules can contribute to each step. The result of each module are given in the line
with a black police (see the figure following the box).
11
el
el
eec
eec
Transport raw material
etd
esca
Processing step 1
eep
Transport intermediate product
etd
Processing step 2
eep
Transport biofuel
etd
Filling station
etd
Direct land-use change
Cultivation
eep
etd
Global results to use: the first column of this part gives step by step actual results calculated for the
present Excel sheet. The second column, column F, is very important to calculate final GHG emissions
for this pathway. It enables using a mix of both disaggregated default value and disaggregated actual
values. The box at the end of this part highlights this aspect.
RED default values: Column H gives a clear and direct comparison with the default values taken from
RED, Annex V, part D and E for the same biofuel pathway.
General information: this part brings important information to the user. The main one is the GHG
emission reduction achieved with this biofuel pathway as compared to fossil fuel. This data is to be used
to show that the sustainability criteria on GHG savings3 are met (or not). Allocation applied for the
calculation is also highlighted (in percentage for the concerned step) as an important parameter in the
result. A last box offers the possibility to change the Global Warming Potential in order to cope with the
revealed inconsistency on this topic (for more information, please refer to 6.4 Inconsistency in use of
global warming potentials and to 2.3 Comments).
Please note! : You will find in column F of the result module very important checkboxes. They are
here for implementing the possibility left by article 19, 1, c) of the RED, to assess GHG emission
from a mix between disaggregated defaults values given in annex V, part D or E, of the RED, and
disaggregated actual values. The “A” of the checkbox list means that the value used for this step in
column E is coming from the Excel sheet actual calculation. The letter “D” means that the value used
3
set up by article 17, point 2, of the RED
12
for this step in column E is coming from the RED disaggregated default value (presented in column
H).
For instance, if you want to use for the cultivation step eec the disaggregated default value of the RED
and only for this part, than you should choose the letter “D” from the checkbox list of line 6. The
letter on lines 8 and 10 of the same column F should stay positioned on “A” to get back actual values
calculated in the modules below of the BioGrace tool.
Please, also refer to BioGrace calculation rules for more explanation on the methodological rules for
applying such possibility.
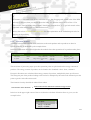
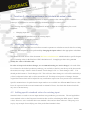
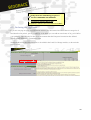
2.4.4 Allocation modules
Allocation calculations to devide GHG emissions to the main product and co-products are done in
specific modules, as illustrated by the example below.
In the tool, allocations are applied right after the module where the separation of co-products takes place.
Allocation
over main- and byproduct
Total emission before allocation:
Emissions up to and including this process step:
Main product:
Ethanol
By-product:
DDGS
Energy content (1 ton)
g CO2,eq / MJEthanol
89,19
89,19 g CO2,eq / MJethanol
26 810 MJ
53,08 g CO2,eq / MJethanol
Energy content (1,14 ton dry matter)
18 240 MJ
Total:
45 050 MJ
Total emission after allocation:
36,11 g CO2,eq / MJethanol
g CO2,eq / MJEthanol
53,08
The emissions of processing steps up to this separation point are split based on the energy contents of
products. The energy content of products can be found in the "Standard values" sheet, column O.
Energetic allocations are calculated from energy content of products, multiplied by their specific mass.
This energetic part of the product leading to the biofuel is multiplied by the total result obtained up to this
point to get the "after allocation result".
The formula is hereby detailed for ethanol from wheat:
Total emission after allocation
=
Total emission before allocation x Ethanol energy content
Total energy content (ethanol + DDGS)
In the box in the upper right corner of the excel sheet the calculator allocation factor is given, see the
example below.
Allocation factors
Ethanol plant
59,5% to ethanol
40,5% to DDGS
13
2.4.5 Units used
A major point of interest is that the tool is designed with all the data associated to specific units that
cannot be changed without changing the formulas. It is strongly advised not to change the units but to
convert the user’s units into the ones that are proposed in the tool.
For each input consumed during the life cycle, the quantity of input is converted in the quantity needed
per MJ of biofuel. This quantity is then multiplied by the global warming potentials for CO2, CH4 and
N2O which results in CO2-equivalents.
2.4.6
Specific calculation points to be known
In this example, the agro chemicals needed for the cultivation step of wheat are shown on the left, in kg
per hectare and per year. On the right part the emissions of greenhouse gas per MJ of ethanol are
calculated, using conversion formulas in the cells.
This calculation relies on the match between the name of the inputs (“N-fertiliser”, “K2O-fertiliser”, etc.)
and the names in the “standard values” sheet. Excel formulas are used to call the right GHG emission
coefficients for each input (formula “VLOOKUP” in English4). It is therefore very important to use the
appropriate name of input/output if one changes an input value in the calculation sheets. For instance, if
the user wants to use an own standard value, this value has to be created in the “user defined standard
value”, and the same name must be used in the calculation sheet.
2.4.7 Details about N2O calculation
N2O data for default values of non EU-imported crops are derived from calculations carried with the
DNDC model. This model takes into account direct and indirect emissions. Average EU data have been
used for each crops, type of soil, climate, etc. For more detail on these calculations, please refer to the
JRC documents5. For imported crops a modified IPCC tier 1 methodology has been applied.
4
or ““VERT.ZOEKEN” in Dutch, or “RECHERCHEV” in French language respectively
5
Linking an economic model for European agriculture with a mechanistic model to estimate nitrogen and carbon losses from
arable soils in Europe, A. LEIP & al, JRC, Biogeosciences, 5, 73–94, 2008
14
For the implementation of new pathways or in case of calculating actual values for cultivation (for which
all the input numbers for cultivation have to be replaced, this is one of the calculation rules), one of the
methods laid down in the IPCC guidelines for National Greenhouse Gas Inventories, Volume 4, Chapter
11(2006), tier one , two or three should be used.
15
3 Function 1: using the tool to have details on default value
calculations
The BioGrace tool makes transparent how the default values of the RED were calculated. For each
pathway of production, a dedicated Excel sheet presents the details of the default value calculations.
The list of the pathways can be found in the “Directory” sheet with links to each pathway excel sheet.
All the necessary input numbers are presented per phase on the excel sheet: cultivation step, handling and
storage of the biomass, transport to plant, plant, transport to depot and filling station.
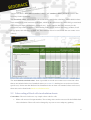
The same framework is used for all pathways:
Summary of
the Results
Inputs and
input data
Calculations
using
standard
values
The calculations are presented step by step, following the well to wheel approach.
Looking in detail at this calculation sheet gives a lot of information on how the calculations were made
and on how the RED methodology was applied6. For instance and without being exhaustive, you can find
detailed information on the following issues:
•
6
Which steps and inputs have been taken into account in the RED default value calculations:
And in some cases, the inconsistency between calculations carried out for default value and RED methodology.
16
o The different steps encompassed and the way they are modelled (has the drying of corn
have been taken into account in the RED default value? etc);
o All the different inputs taken into account for the calculation (and conversely, one can
deduct the inputs not taken into account));
•
Input quantities taken into account, for instance yields (for cultivation and processing steps),
energy consumption, chemical consumption, co-product production, etc. It is possible to click on
each cell in order to see if the number is a raw data figure or if it is a calculated value (the
formula is then visible) ;
•
Standard values used for calculating default values, like LHV, the GHG emission for
producing one kg of Hydrochloric acid, etc ;
•
How energetic allocations are made (see the allocation module for this as well as the
recommended rules) ;
•
How energy surplus is taken into account (see the energetic calculation in each pathway with
energy surplus for detail examples) ;
•
Intermediate calculations, in column E, where all the yields are expressed in ha-1.year-1 and in
MJ of biomass input (wheat, etc.) ;
•
GHG emissions as calculated from the input numbers, in columns H, I and J, respectively for
CO2, CH4 and N2O ;
•
The difference between typical and default value: this difference is achieved by multiplying
the input data of the biofuel processing step by 1,4.
•
Specific emissions calculated in modules at the end of each excel sheet: annualised emissions
from carbon stock changes caused by land use change, CO2 storage, etc.
•
Total emissions before and after allocation. The formula used for allocation can be found by
clicking on the cells of “emissions after allocation”.
An overview box, summing up all the results, can be found at the beginning of each Excel sheet.
17
4 Function 2: Adapting pathways to calculate an actual value
The BioGrace tool allows economic operators to adapt the default value calculations for available
pathways. It could thus be used for setting up calculations of its own actual value.
The following chapters give a step by step tutorial on how to adapt an existing pathway for several
situations:
•
Changing input data ;
•
Adding specific standard values for existing inputs ;
•
Adding new input in the process ;
4.1 Modifying input data only
Calculation sheets of the BioGrace tool allow economic operators to calculate an actual value for existing
pathways. This adaptation can be performed by changing the input values in the appropriate calculation
sheet.
You should first take notice of the document BioGrace calculation rules which includes a specific chapter
"Use of starting values in the BioGrace GHG calculation tool". Complying to these rules, you can
modify the value of all white cells.
In order to keep track of these changes, we recommend turning on “track changes”. On each of the
Excel sheets for the biofuel production pathways you can find (on the left, near the top of the sheet under
the results) an orange “button” which is named “Track changes: ON” or “Track changes: OFF”. You
should put this button to “Track changes: ON”. This will cause that a change in a cell will be marked by a
yellow background-colour and a red box around the cell. This helps to keep track of changes from the
original document which will be helpful for any certification supervision of any actual value certification.
Specific attention has to be paid when the input numbers are available in a different unit. The new value
has to be expressed in the exact unit mentioned in column D. Please, also check the obtained result for
any error or inconsistency.
4.2 Adding specific standard values for existing input
Standard values are used to convert input numbers into greenhouse gas emissions. The tool applied the
same standard values as the European Commission has used for calculating the RED Annex V default
values. However, users can define their own standard values and use them in the tool. This part gives a
step by step example for modifying one of the pre-defined standard values.
18
In order to do so, the dedicated excel sheet named “user defined standard values” should be used as the
excel sheet “standard values” is protected and cannot be changed.
Adding new standard value requires applying the following principles:
•
The name given to the added input in the “user defined standard value” should be different from
all the existing names of column C of the “standard value” sheet ;
•
The name of the standard value, once defined, has to be written exactly in the same way in
calculation sheets where it is used;
•
The formulas in columns H, I and J of the calculation sheet have to be checked. For instance, the
column position of the LOOKUP function must to be modified to be coherent with the given unit
of the new standard value.
•
Sources of the data should be clearly stated (see the Biograce calculation rules)
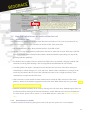
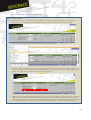
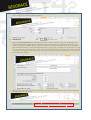
Step by step example :
The tool user wants to add a specific standard value for n-hexane instead of using the n-hexane standard value predefined in the tool. For that, the following steps must be performed:
•
Step 1 : first, get to the "User defined standard value" sheet. This sheet is framed exactly the same as the
"Standard value" sheet.
•
Step 2 : Write the name in the first available free line of the standard value in column B ("n-hexane-user1").
Think about checking that the given name is different from any other of your added values and of the "Standard
values" sheet.
•
Step 3 : Add your own values in the columns with the appropriate unit (from column D to R). If you have a
unique value in g CO2, eq (and not in CO2, CH4, N2O), than fill out the first column in g CO2 as the columns G
and K, with unit “g CO2,eq” is calculated automatically and should not be changed. Please, note that you also
have to add “0” value to the two other column (for CH4 and N2O) the other cells to avoid error messages in
pathway calculation.
19
•
Step 4 : Then, you need to fill in the column T and U with detailed information on the sources of these data
(name of the sources in column T, and remarks and details in column U), like in the example below.
•
Step 5 : Go to the pathway where you want to use this modified standard value. Modify the name of the nhexane input called in column B into "n-hexane-user1". Please note that the name must be exactly written in the
same way as in the “user defined standard value” sheet. Modify the quantity if needed in column C of the same
line.
•
Step 6 : Check and eventually modify the formulas in column H, I and J if they are not are calling the right
columns. This could be the case if the unit of your modified standard value is not the same as the unit of the
pre-defined standard value of the same product. For instance, the existing n-hexane standard value is given per
MJ. If you want to enter GHG data per kg for n-hexane-user1, then you need to change the formula in the
pathway calculation, in column H, I and J of the line where you have added "n-hexane_user1". For that, follow
the example below (the column position to change are shown in yellow):
Initial formula in cell H83 of the previous picture =$C83*$E$70*VLOOKUP($B83;'Standard
values'!$C$9:$S$160;7; FALSE)/$E$184
New formula in cell H83 =$C83*$E$70*VLOOKUP($B83;'Standard values'!$C$9:$S$160;3; FALSE)/$E$184
The numbers “7” and “3” refer to the columns where the values are taken from. These column numbers are
listed in row 3 of both the sheet “Standard values” and the sheet “User defined standard values”.
20
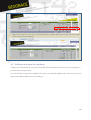
4.3 Adding an input in a pathway
Step by step example :
The tool user wants to add a new input in one of the pathways. For that, the following steps must be performed:
•
Step 1 : First, in the pathway you are working on, get to the module where you want to add a input.
•
Step 2 : Insert a new line with the function "insert" of Excel (right click).
•
Step 3 : Fill in the line with the name of the input (column B), the unit use (column D), and the quantity used
(column C). Please check that the name of the added input is the same than in the table of the "standard value"
sheet. Also verify that you use the same unit than existing input.
•
Step 4 : On the same line, add the calculation formulas in columns H, I and J according to the unit in which the
GHG emission coefficients are expressed (per kg or per MJ). Formula can be copy paste from existing input.
When formula written or copied, please check that the proper cells have been used in the formula and that units
are consistent. The same work can be carry out in column M if this “info” column exists for this module.
21
•
Step 5 : Check that the “Total” line is correctly taking into account the added input. For that, the sum in column
H to K must include the added line.
4.4 Adding a new input in a pathway
Adding a new input that does not yet exist in the BioGrace calculation tool can be done by using the two
previous step-by-step tutorials.
You will first have to add a new standard value in the “User defined standard value”, then insert your new
input in the biofuel-pathway you are working on.
22
5 Function 3 : Creating a new pathway
The BioGrace tool can also be used to set up new biofuel production chains. This requires some
knowledge of Excel and a detailed observation of how calculations are made.
The present part cannot provide a comprehensive description of the process. However, a short tutorial is
provided below to highlight major steps:
•
Step 1: Copy an existing pathway and rename it.
•
Step 2: Erase all data in the white cells of column C. Erase the names of inputs and outputs in
column B when necessary. Be sure to keep the result overview box at the top of your pathway,
and the 3 last generic modules (LUC, Improved Management Practices, CO2 storage or
replacement).
•
Step 3: the most important part is to define the frame of the new pathway, meaning the numbers
of steps (cultivation of agricultural matter, drying, transport, industrial steps, etc.), the allocations
when needed, etc. This frame is to be translated in independent modules.
•
To add up new lines, please use the “insert line” function by right clicking on the appropriate line.
Beware of adding allocation modules right after the separation step of the co-products.
•
Step 4: Fill in the new frame with appropriate inputs and outputs into column B, with the
associated input numbers in column C. The tool user needs to pay particular attention to the units
in which the input numbers are expressed. The unit in column D has to be compatible with the
units of the standard value in the “standard value” sheet.
•
Step 5: Add new standard value if needed (for more detail, please refer to "adding new standard
value" part in the previous section "Adapting pathways").
•
Step 6 : Adapt the formulas of the column H to K when needed (see "adding a new input" part in
previous section "Adapting pathways" for more detail)
•
Step 7: Add, if necessary, comments or intermediate calculations in columns E to G.
•
Step 8: Adapt all the summing cells from allocation module and total module.
•
Step 9: Adapt the overview results box to your new pathway by inserting lines and linking cells
to each name and results obtained.
23
6 Technical detail on specific issues
6.1 How to use the LUC sheet?
Land Use Changes (LUC) are to be taken into account in the GHG calculation of your product. A LUC
occurs when the biofuel cultivation has a different carbon stock per hectare than a reference situation (e.g.
conversion of forest into agricultural land). The RED methodology and the "Commission Decision of 10
June 2010 on guidelines for the calculation of land use carbon stocks for the purpose of Annex V of
Directive 2009/28/EC" give precise instructions on when and how to take these carbon changes into
account.
A dedicated module is available in the BioGrace tool at the bottom of each pathway. It will collect the
emissions caused by carbon stock changes from the LUC sheet. Thus you will need to fill in this LUC
sheet to calculate your actual changes in carbon stock. A declared LUC for a pathway will apply to the
whole result of the pathway.
If you have several consignments with two different LUC values to be integrated (for instance one with
no LUC, and one with a conversion from grassland to crop land), please use a separate copy of the
BioGrace GHG calculation tool to declare it. The tool has been designed with a single LUC sheet that
doesn't enable calculating simultaneously two or more GHG values with different LUC values.
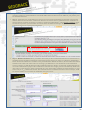
Step by step tutorial :
If you need to take into account a Land Use Change for a pathway, please apply the following steps:
•
Step 1 : In the pathway you are studying, answer "yes" to the question "Does land use change occur?" of the
LUC module. For that, use the checkbox list next to the question. Make sure that “macro” is authorised to
operate (this is the case when the text in the LUC module changes into the appearance of the figure below).
•
Step 2 : Value and text called from the LUC excel sheet then appear.
24
•
Step 3 : Go to the LUC sheet. You will there find a framework for calculating the carbon stock changes from
reference situation to actual utilisation. The annual GHG emissions that need to be added to your pathway will
be calculated from that.
•
Step 4 : Select the type of calculation you want to use. Two kinds of calculation are possible: one using the
default values listed in de tables "Commission Decision of 10 June 2010 on guidelines for the calculation of
land use carbon stocks for the purpose of Annex V of Directive 2009/28/EC", called default calculation, and a
second one if you have your own value for carbon stocks calculated according to the guidelines in the same
Commission Decision (called actual calculation).
•
Step 5 – Default calculation: First, you need to have with you the “Commission Decision of 10 June 2010 on
guidelines for the calculation of land use carbon stocks for the purpose of Annex V of Directive 2009/28/EC"
where all formula and data are available. In the part dedicated to default calculation, fill the needed information
and data in the white cells. These cells are not using a pre-defined list. You should refer to the information
given in column L to find the tables from the Commission decision. Please, use the same wording than the one
use in the communication paper of the Commission. Note that cells in light green are automatically filled from
other cells. For that, begin by filling “actual land use” part. In the bellow example, the actual land use is a crop.
That is why no Cveg is taken into account. The reference land use considered is a native forest in Europe, under
an oceanic climate. No FMG and Fl are needed for this type of cover.
25
•
The resulting LUC is calculated right bellow this part by applying the RED methodology. A positive value
shows a carbon loss from the reference situation.
•
Step 5 – Actual calculation: Fill in the white cells of the “Actual calculation” part. You should refer to the
information required in column B, and to information given in column L. First, general references for your
actual value should be added in order to keep track of the source and quality of these data. In case of methods
other than measurements, you should confirm that climate, soil type, etc, are taken into account. If this is not the
case, you cannot use your actual data. At last, add the actual Carbon stock in soils (SOC) and carbon contained
in vegetation (CVEG) for actual and reference uses. The formula from the RED methodology is then used to get
the annual carbon changes.
•
Step 6 : Check in the last line that the proper value is called. If it is not the case, get back to step 4 and choose
the appropriate calculation type.
26
•
Step 7 : Check in the biofuel production pathway where you need to declare a Land Use Change that the LUC
value is there. Please, also check that no Improved agricultural management is declared in the module right
below (See the next section for more information).
6.2 How to use the Esca sheet?
The Esca sheet is to be used when the user wants to claim increased carbon stock in soils because of
improved agricultural practices like no tillage, increased residue incorporation, etc.
This excel sheet is built on the same model than the LUC sheet. The same steps are needed to use it.
Please have a look at the LUC section to have a step-by-step tutorial.
The main difference comes from the fact that only carbon stock in soil is taken into account. Please also
note that esca has a different sign than el : a positive esca means that carbon stocks are improving in your
soil, and thus that the GHG result of the pathway should decrease, whereas a positive el means carbon
stock losses. This difference comes from the formula of Annex V.C of the RED, that define esca has a
carbon stock accumulation from which the feedstock produced should take some advantages.
Please note that if you have also a change in the above ground carbon stock or more globally in the land
use type, you should use the LUC sheet. Do not use Esca sheet if a Land use Change is also declared
for the same biofuel.
6.3 How to use the N2O emissions IPCC sheet?
N2O emissions are to be taken into account in the GHG calculation of your product. These emissions
mainly occur during the crop production step because of soil’s microorganism’s activity. In each
pathway, during the crop cultivation step, field N2O emissions are to be calculated. A specific module in
the sheet “N2O emissions IPCC” is dedicated to this calculation. A short cut below the white cell to fill in
leads directly to this sheet.
27
BioGrace tool follows IPCC guidelines 2006 for N2O emission calculation as explained in chap 11 “N20
emissions from managed soils and CO2 emissions from lime and urea application” (see the “BioGrace
calculation rules” document for specific recommendations about the use of this method). At the beginning
of the “N2O emissions IPCC” module, a short introduction presents the methodology used with the
additional hypothesis used in JEC calculations that have been incorporated in the module. This module
details the calculation of the three N20 emissions sources that occur during the agricultural step: direct
N2O emissions from the field, N20 indirect emissions due to leaching and runoff and N20 indirect
emissions due to NH3 and NOx volatilization.
Step by step example :
For N2O emissions calculations for a pathway, please apply the following steps:
•
Step 1: Fill in the name of the crop and the general information about your pathway in the Crop data box. You
can choose between 8 different crops.
•
Step 2: To calculate N2O emissions for a crop that is not listed in Table 1, then enter the name of the crop in
Table 1 and fill in Table 4 of this module. More information on how to fill in Table 4 is available in IPCC 2006
chap 11, Table 11.2.
•
Step 3: In case of Land Use Changes (LUC) or modified management practices, then the “LUC” or “Esca”
sheets should be used to calculate the carbon loss and enter the value in cell C29. Go to sections 6.2 and 6.3 of
this manual to know how to use these sheets. When the Esca sheet is used to calculated C losses due to change
in agricultural management, please note that only when negative results are obtained, C losses are actually
occurring. In this case you should change the sign of the result and insert the obtained value in cell C29.
•
Step 4: If the name of the crop selected in cell C19 is either sugar cane, or Palm, then further information
should be given in the third part of the Crop data box.
28
•
Step 4 - Calculation of direct N2O emissions from managed soils. Two more input data are needed for direct
N2O emissions calculations: the quantities of N synthetic fertilizer and N organic fertilizer applied. You should
refer to the “BioGrace calculation rules» manual to know which fertilizer should be taken into account.
Intermediate calculations are shown in Tables 2, 3, 4 and 5 and the total of direct N2O emissions are found at
the bottom of the box.
•
Step 5 - Calculation of indirect N2O emissions from managed soils. Automatic calculations are made using
previous input data. Intermediate calculations for N2O indirect emissions due to NH3 + NOx volatilisation and
leaching are shown in Tables 6 and 7 (resp.).
•
Step 6: The total N2O emissions are given in yellow at the bottom of the sheet.
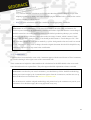
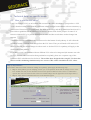
6.4 Inconsistency in use of global warming potentials
Global warming potentials (GWPs) are used to convert methane and nitrous oxide in equivalent carbon
dioxide. During the project, an inconsistency was found between the GWPs used for the calculation of
default values listed in Annex V.A, Annex V.B, Annex V.D and Annex V.E of RED and the GWPs
prescribed in Annex V.C point 5. For this reason, two calculations are possible in the tool through the
following application in each excel sheet:
29
Calculations in this Excel sheet……
strictly follow the methodology as given in
Directives 2009/28/EC and 2009/30/EC
follow JEC calculations by using GWP
values 25 for CH4 and 298 for N2O
As explained in "About" under "Inconsistent use of GWP's"
6.5 Declaring the 29g Bonus
If you are carrying out your own calculation and that your land enters into one of the two categories of
land described in point 8, part C, of annex V of the RED, you can add an extra bonus of 29 g eCO2/MJ to
your pathway. This can only be done from the moment that the European Commission has defined
degraded land and heavily contaminated land.
Within the BioGrace tool, this bonus has to be added in the Land Use Change module, as shown in the
picture bellow.
30
7 Why was there a need for a BioGrace project?
7.1 Historic of the RED calculations
7.1.1 A need for GHG reduction guaranty
For calculation of the default value LBST (Ludwig Bölkow System Technik) and JEC consortium (JRC,
EUCAR and CONCAWE) have - on request – delivered input to the European Commission. The
European Commission has made the final calculations into the default values, which are presented in the
RED Annex V.
As defined in article 17 of the RED, biofuels and bioliquids can be taken into account for the following
purposes only if they fulfil criteria of greenhouse gas emission reductions:
•
Measuring compliance with the requirements of the Directive 2009/28/EC concerning national
targets,
•
Measuring compliance with renewable energy obligations,
•
Eligibility for financial support for the consumption of biofuels and bioliquids.
Thus, the economic operators have to provide data regarding the GHG performance of their biofuels and
bioliquids7, following the appropriate methodology. Default values defined in Annex V.A, Annex V.B,
Annex V.D and Annex V.E of the RED may be used by economic operators under precise conditions
(raw materials cultivated outside the Community, raw materials cultivated in the Community in areas
where the typical value for raw material cultivation is expected to be lower than the corresponding
disaggregated default value in Annex V.D and raw materials that are waste or residues other than
agricultural, aquaculture and fisheries residues).
7.1.2 How were the default and typical value calculations developed?
The default value and typical value calculations were performed in a collaboration project with the JEC
consortium (Joint Research Centre, EUCAR and CONCAWE) and LBST. The results of their
calculations were used as inputs by the European Commission to be published in Annex V of RED and
Annex IV of FQD. LBST developed its own model software (“E3database Software”) and underlying
databases used to perform the calculations.
The input data come from several studies. The standard values were calculated as part of the E3database,
taking into account all inputs and emissions from the provision of the input. The Well-to-Wheel reports
from the JEC consortium give detailed information on how these standard values were calculated.
7
Article 18 of the RED.
31
However, in some cases small inconsistencies exist between the values in the WtW reports and the values
in the E3database. The BioGrace standard values are directly taken from E3database.
7.2 History of the tool and BioGrace project
The project BioGrace aims to harmonise calculations of biofuel greenhouse gas (GHG) emissions and
thus supports the implementation of the EU Renewable Energy Directive (2009/28/EC) and the EU Fuel
Quality Directive (2009/30/EC) into national laws.
This project contributes to the publication of a uniform and transparent list of standard conversion values
for GHG calculations, and to the elaboration of Excel files as well as user-friendly GHG calculators for
economic operators, auditors, and advisors to perform the GHG calculation step by step on their own.
These Excel files address the 22 most important biofuel production pathways cited in both directives.
The project results are disseminated to European stakeholders through a website, meetings, and a series of
workshops. National policy makers are asked to make reference to the list of standard conversion values
in their national legislation.
This tool is a result of the first step of the project, whose objective was to make the calculations that lead
to the 22 default values in the Renewable Energy Directive and the Fuel Quality Directive transparent.
The elaboration of this tool was performed and commented by the partners: IFEU, ADEME, ANL,
BE2020, BIO IS, CIEMAT, EXERGIA and STEM respectively.
32
8 Glossary
To use the tool, several terms have to be clearly defined. Some of these definitions are based on the
directive 2009/28/EC.
Standard value: data needed to convert input numbers (given in kg, kWh, etc) into GHG emissions.
Examples are Lower Heating Values and values to convert 1 kg N-fertiliser or 1 MJ of natural gas into
CO2, CH4 and N2O emissions. They are sometime also called "conversion factors".
Default values: default values are the GHG emissions per MJ of biofuel given in the tables part D of
annex V of the Renewable Energy Directive (see RED bellow). There are step by step default values and
one global value for the whole pathway. They are derived from the typical value by adding an extra 40%
of energy consumption during the process stage. They may be used instead of actual values under certain
circumstances defined in the RED.
FQD: Fuel Quality Directive, or Directive 2009/30/EC is the Directive amending Directive 98/70/EC as
regards the specification of petrol, diesel, gas-oil and introducing a mechanism to monitor and reduce
greenhouse gas emissions and amending Council Directive 1999/32/EC as regards the specification of
fuel used by inland waterway vessels and repealing Directive 93/12/EEC.
Input numbers: information on the itineraries of cultivation, industrial processes, yields, etc. The input
numbers are the values in the white cells in the BioGrace GHG calculation tool. In all these cells, actual
input numbers can be given to calculate an actual GHG value.
Starting values: the input numbers that are in the BioGrace GHG calculation tool when it is downloaded
and opened. These numbers were provided by the JEC consortium for the RED default values of the
Directive.
RED: Renewable Energy Directive, or Directive 2009/28/EC is the “Directive on the promotion and the
use of energy from renewable energy sources”.
GHG: Greenhouse gases, responsible for global warming.
LHV: Lower heating value
LUC : Land Use Changes. This term refers to the GHG emissions linked with a change in the carbon
stock because of changes in the use of the land. An excel sheet called the LUC excel sheet provides
information on how assessing them.
33
Align biofuel GHG emission calculations in Europe (BioGrace)
Project funded by the Intelligent Energy Europe Programme
Contract number: IEE/09/736/SI2.558249
Project coordinator: John Neeft - Agentschap NL (Agency NL) (formerly SenterNovem)
[email protected]
www.biograce.net
The sole responsibility for the content of this publication lies with the authors. It does not necessarily
reflect the opinion of the European Union. Neither the EACI nor the European Commission are
responsible for any use that may be made of the information contained therein.
34