1
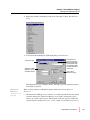
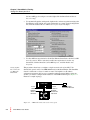
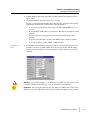
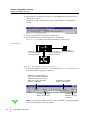
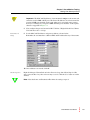
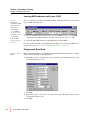
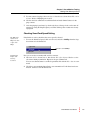
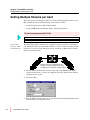
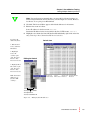
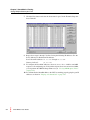
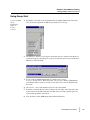
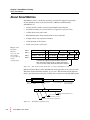
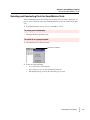
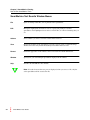
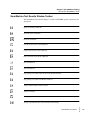
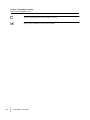
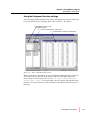
SmartBits
Multiport Port/Stream/Performance Analysis System
SmartWindow
User Guide
Version 6.53
December 1999
P/N 340-1020-001 REV C
7
SmartMetrics Testing
SmartWindow is a highly effective front panel GUI designed for developers and QA
personnel, who wish to create traditional and custom tests. The ML-5710 and 7710
SmartCards can simulate up to 1000 hosts sending varied or uniform traffic to the Layer 3
switch and can fully characterize the switch for both Layer 2 and Layer 3.
A range of tests for Layer 3 functions–including SmartMetrics tests–can be performed that
monitor and measure traffic received from any combination of SmartMetrics SmartCards,
including multiple VTEs sent by multiple SmartCards. This allows testing of complex
protocol sensitive application and systems scenarios.
What’s in this chapter
This chapter contains the following sections:
Section 1: Layer 3 Switching
Section 2: Required Steps for Layer 3 Testing
Section 3: Setting One Stream per Card
Section 4: Setting Multiple Streams per Card
Section 5: About SmartMetrics
Section 6: How to Run SmartMetrics Tests
Section 7: How to Optimize 16-bit Latency Testing
Section 8: SmartMetrics 16-bit Tests
Section 9: Other SmartMetrics Tests
Section 10:SmartMetrics Test Results
Section 11:Detailed Tracking and Statistical Results
SmartWindow User Guide
137
Chapter 7: SmartMetrics Testing
Layer 3 Switching
Layer 3 Switching
In most cases, a Layer 3 switch is in fact a fast protocol-based router minus certain router
functions. A Layer 3 switch typically works with only one or two protocols, performs at or
close to wire speed, is good at keeping streaming packets in order, and makes routing
decisions based on ASICs (unlike a router which is software-based).
The 10 Mbps, 100 Mbps and Gigabit Ethernet Layer 3 switches are expected to operate at
full line-rate at Layer 2 and wire-speed IP routing at Layer 3 simultaneously on all ports
with zero packet loss and extremely low latency.
Test Methodology
The SmartWindow tests and results which demonstrate the performance capability of the
switch include the following topics:
•
20 Counters (transmit and receive packets and bytes, packet loss, triggers, tags,
collisions, errors, ARP and ping counters)
•
•
•
Sequence Tracking data
Latency Distribution data
Latency over Time data
About Streams
It is essential to understand SmartBits streams which provide the basis for using the ML7710 traffic and test capability. Each stream, generated by its own Virtual Transmit Engine
(VTE), represents a repeated packet with the following characteristics:
138
•
•
Designed to set up traffic for testing layer 2 (switching) or layer 3 (routing).
•
Each stream has its own IP/MAC source and destination addresses, frame length,
protocol or custom packet, IP gateway for routing, and statistics/histogram tracking
capability.
•
•
With IP, each stream also has ARP request and response ability.
•
If 10 streams are defined, the 10 packets are transmitted in the order created, then recycled to transmit the next 10, until the transmission is stopped. If only one stream is
created for a card, then the traffic is comprised of the one packet type.
•
Each ML-7710 SmartCard may transmit up to 1000 streams per card, and may track
statistics/histogram information on up to approximately 80,000 streams.
A signature field in each packet contains its source and destination location, its
sequence in the traffic flow, and when it was sent and received.
The stream of one card typically transmits to the stream of another card, simulating
transmission from one host computer to a second host computer. Both can be on the
same subnet or on different subnets.
SmartWindow User Guide
Chapter 7: SmartMetrics Testing
Layer 3 Switching
Unlike the older SmartCards such as the SX-7410 Ethernet SmartCard which is a packet
blaster for hubs and switches, the ML-5710 and 7710 are equivalent to 1000 IP
connections, now condensed into a simple format for creating 1000 streams which closely
mimic real world traffic.
Place 20 ML-7710 cards into a SmartBits chassis, then stack 4 chassis; with 80 cards, you
can simulate up to 80,000 streams.
Hard Disk Requirements for Streams
Each stream’s setup configuration requires 4.5 Kb per stream per card. For 1000 streams
you may need to allocate 5 to 7 Mb of hard drive.
Multiply by 20 cards = 120 Mb of hard drive per test setup
Multiply by 4 chassis = 480 Mb of hard drive per test setup
If you want to make histogram measurements, double your estimated hard drive
requirement.
SmartWindow User Guide
139
Chapter 7: SmartMetrics Testing
Required Steps for Layer 3 Testing
Required Steps for Layer 3 Testing
These following steps describe the addresses to set up and the use of ARP exchange,
which is necessary to route packets properly through attached devices.
•
•
Layer 3 Setup
Layer 3 ARP
Important: Testing routers requires some preparatory work. You must do these two steps
in order prior to running any of the Layer 3 tests:
Layer 3 Setup
Use the Layer 3 Setup dialog box to configure the required information prior to running
SmartMetrics tests on a router and to control management frames per RFC-1944. You
must provide the gateway of the router or the Layer 3 switch.
!
Caution: Never check the Reply to all ARP requests box when connected to a live network. SmartMetrics SmartCards automatically respond to ARP requests. Use this box
only for back-to-back testing. You can still automatically update the router's ARP table for
each stream by selecting Layer 3 Send ARP Requests from the SmartCard's popup menu or
Layer3 ARP from the Actions menu.
Configuring Layer 3 Setup
1
140
Right-click on an L3-6705/L3-6710 or ML-7710/ML-5710 SmartMetrics SmartCard
and choose SmartMetrics Mode from the drop-down menu, then choose Layer 3
Setup.
SmartWindow User Guide
Chapter 7: SmartMetrics Testing
Required Steps for Layer 3 Testing
Table 7-1
Layer 3 Setup field descriptions
Field
Description
MAC Address
A user-defined MAC address for the SmartMetrics SmartCard
used to respond to ARP requests from connected devices.
These responses are only transmitted if the Reply to all ARP
requests box is checked.
IP Address
The SmartMetric SmartCard’s IP address. This address should
be different from the IP addresses of the Layer 3 streams.
Gateway
The gateway should be set to the IP address of the router port
connected to the SmartCard. A valid gateway IP address must
exist either in this dialog box or in the Gateway field in the
Virtual Transmit Engine (VTE) Setup dialog box.
Netmask
This is the netmask used in conjunction with the Gateway
(router port).
Ping Target
The L3-6705/L3-6710 or ML-7710 SmartCards can issue
Ping, SNMP and RIP packets that simulate typical
background traffic. The intervals at which these packets are
transmitted can be specified in whole seconds or in .1 seconds
for the ML-7710. The Ping Target specifies the IP address to
which the Ping packet is sent.
InterARP GAP
Some systems cannot handle ARP requests sent at full wire
speed. If the device(s) under test misses the ARPs, the tests
will fail. If needed, you can set this parameter to set a gap
between ARP requests. This setting will apply to all ARPs sent
from the selected port. This feature is only enabled if the Allow
time control of ARP Requests check box is set in the
Preferences dialog box. This dialog allows you to set the
InterARP GAP. This is the setting that will be applied to all
ARP requests sent by all SmartMetrics SmartCards in a
chassis.
Reply to all ARP
requests
Checked: The SmartCard replies with Layer 3 MAC
addresses to each ARP request it receives without setting up
any streams.
Unchecked: (Default) This is the most common setting for
this checkbox. The SmartCard does not reply to each ARP
request it receives with Layer 3 Setup MAC addresses.
SmartWindow User Guide
141
Chapter 7: SmartMetrics Testing
Required Steps for Layer 3 Testing
Address Resolution Protocol (ARP)
In order for data streams to be sent through a router, the L3-6705 and other multilayer
SmartCards have to know the MAC address of the router port and the Router has to know
the MAC addresses of the L3 cards. This is done using ARP (Address Resolution
Protocol) packet exchanges.
ARP maps an IP address to a MAC address. This IP address is the address of the Router
port connected to the L3 card, not the IP destination of a packet. The router port address is
specified in the entry called Default Gateway. When this entry is set–that is, not zero–the
ARPs generated by the L3 card will go to this address instead of the specified IP
destination address.
The Router will also issue ARP requests to the L3 cards. These will be replied to by either
the local stack or the protocol stream if the target IP address in the ARP request packet
matches the Source IP address in the stream or stack. If a VFD has been set up for the
destination IP address then the ARPs will fail. In this case the alternative is to set a
General ARP Reply flag which will cause the L3 card to respond to all unsatisfied ARP
requests using a MAC address generated from the card number.
Sending Layer 3 ARP Requests
To ensure proper transmission of VTEs of data through routers and Layer 3 switching
products, it is normally necessary to send a Layer 3 ARP on behalf of the active streams.
1
142
To send ARPs from all Layer 3 cards, choose Actions > Layer 3 ARP.
This is should be done each time the device or devices under test are connected, powered up, or reset.
SmartWindow User Guide
Chapter 7: SmartMetrics Testing
Required Steps for Layer 3 Testing
2
To send ARP requests for a single card, right-click the mouse button on a Layer 3
card, then choose Layer 3 Send ARP Requests.
Preparing the Device Under Test (DUT)
Important: SNMP functionality, proprietary polling, and Spanning Tree frames generated by the DUT will lower the measured performance of the DUT. It is recommended that
you turn off all traffic generated by the DUT to get performance of the switching fabric.
SmartWindow User Guide
143
Chapter 7: SmartMetrics Testing
Setting One Stream per Card
Setting One Stream per Card
This section presents introductory startup procedures and a basic test scenario based on a
single stream from each SmartCard:
•
•
•
•
•
Default Global Settings to Review
Preferences to Review
Set Up One Layer 3 Stream per ML-7710 SmartCard
Pinging and ARPing to Check Links
Transmit Traffic and View Counters
The test configuration illustrated in the first five procedures has the following connections:
•
•
•
Two ML-7710 SmartCards are installed in slots 4 and 5 of a SmartBits chassis.
The SmartBits chassis is connected to a PC with SmartWindow via an Ethernet port.
The two ML-7710 ports of the SmartBits chassis is connected to two gateway ports on
the Layer 3 switch/router (Device under Test).
This test setup uses two ML-7710s
Additional SmartCards that support this test
Two L3-6710s or ML-5710s could be substituted for the ML-7710s.
Review Default
Global Settings.
The default settings of each SmartCard should be checked to ensure that they are
appropriate.
1
144
Open SmartWindow.
SmartWindow User Guide
Chapter 7: SmartMetrics Testing
Setting One Stream per Card
2
Right-click an ML-7710 SmartCard and choose SmartMetrics Mode then Transmit
Setup.
3
In the Virtual Transmit Engine (VTE) Setup dialog, select This Port.
Transmit mode.
Interpacket Gap
Default is set for
Full Wire Speed.
Background fill
pattern inside the
IP packet (between
the IP header and
the signature field).
Custom (default) is
often used.
Select Error
Generation type.
This dialog allows you to configure streams. Although you can vary many parameters,
most fields are optional.
Preferences to
Review (See
“Preferences” on
page 38).
There are three preferences which merit quick consideration. Choose Options >
Preferences.
•
The default inter-ARP gap is set to 9.6 uSec as a standard specification and by default
cannot be changed for a SmartCard. However, if you wish to change this gap (for
instance, if a switch cannot process ARP requests at full-wire speed), you must turn
on the Preference checkbox Allow time control of ARP requests. Then you can re-set
SmartWindow User Guide
145
Chapter 7: SmartMetrics Testing
Setting One Stream per Card
the inter-ARP gap for each port as needed (right-click the SmartCard and choose
Layer 3 Setup).
Setting Up One
Layer 3 Stream
per ML-7710
SmartCard.
•
To automatically update (with speeds, duplex mode, and auto-negotiation settings) the
Fast Ethernet cards with the last saved configuration or a newly opened configuration
file, click the checkbox Restore MII Control register 0 after File/Open.
•
To allow MII auto-negotiation for all the Fast Ethernet SmartCards, check Allow MII
Auto-Negotiation. Then to selectively enable auto-negotiation for each or any
SmartCard, click the SmartCard, select MII Registers, and click Enable AutoNegotiate.
This procedure shows how to configure a single stream in each of two ML-7710
SmartCards (ports 4 and 5 of an SMB-2000 chassis) with SmartWindow. The SmartBits
chassis is connected to a Layer 3 switch or router. It is helpful to set IP address
assignments in patterns that are easy to remember and interconnect. Before setting up
streams, you need to configure the IP addresses of the SMB and DUT ports. Figure 7-1
illustrates a sample topology.
SMB-2000
Port 5
20.0.0.1
Port 4
10.0.0.1
Gateway
10.0.0.100
255.0.0.0
Gateway
20.0.0.100
255.0.0.0
Switch/Router
Figure 7-1. 2 ML-7710 cards connected to router ports
146
SmartWindow User Guide
PC workstation
with SmartWindow
Chapter 7: SmartMetrics Testing
Setting One Stream per Card
Port 4 Layer 3
Setup.
1
In SmartWindow, right-click on the ML-7710 Port 4 SmartCard, and choose SmartMetrics Mode.
2
Click the SmartCard again, then choose Layer 3 Setup.
The Layer 3 Setup window describes the local stack and is optional for most testing
requirements. This window is edited for the following purposes:
• To set the gateway IP address of the router port (DUT)–REQUIRED for Layer 3
switches.
• To change MAC and IP addresses (if needed) so that they do not duplicate stream
addresses.
• To set the netmask for management frames if needed (optional; ignored by
streams).
• To specify a Ping IP address for pings and SNMP frames if needed (optional).
• To specify frequency for Ping, SNMP, or RIP (optional).
3
Set the MAC and IP addresses and gateway address as shown below. Gateway is the
IP address of router port. MAC address is for the card (not stream). The IP address
must be in the same subnet as the router port/gateway. Once addresses are entered,
click OK.
Warning: Do not check the Reply to all ARP Requests checkbox on a live network. This
is useful for unidirectional traffic only, to set up transmission of IP addresses.
Important: The gateway IP address is the target address for ARP frames. If the gateway
IP address is zero, the ARP frames will target the destination IP addresses of the streams.
SmartWindow User Guide
147
Chapter 7: SmartMetrics Testing
Setting One Stream per Card
4
Right-click the card then choose Transmit Setup. Highlight the default stream and
click the Delete button.
The default stream is deleted so that it can be replaced with more fully defined
streams.
5
To add a stream to Port 4, click the Add VTEs button.
6
Choose IP from the Protocol pull-down menu, and click OK.
Use Figure 7-2 as a guide for entering the IP addresses of the streams.
Stream on Port 4.
SMB-2000
Stream #1, Port 4
Source IP 10.0.0.10
Dest IP 20.0.0.10
PC workstation
Stream #2, Port 5
with SmartWindow
Source IP 20.0.0.10
Dest IP 10.0.0.10
Switch/Router
Figure 7-2. Stream IP addresses by port association
7
In the Protocol Editor, choose View > Invert Table then View > Concise/Detail to see
more fields. Enter the appropriate addresses.
MAC Dest is the MAC address of
router port (it may be automatically
updated via the Actions > Layer 3
ARP or the Layer 3 Send ARP
Requests commands).
The Source IP is the IP
address of the stream.
The MAC Src is the MAC
address of the stream.
The Dest IP is the
destination or target
IP address.
Note: Note that when an ARP response is received, the ARPs are handled internally,
therefore the MAC Dest will not be updated.
148
SmartWindow User Guide
Chapter 7: SmartMetrics Testing
Setting One Stream per Card
Important: The MAC and IP addresses of streams must be unique to the streams and
cannot be used for SMB or DUT ports. The Source IP addresses of each stream and its
associated SMB port should be on the same subnet as its associated router gateway.
For Layer 3 routing tests, each pair of SMB and DUT ports should be on the separate
subnets as suggested in Figure 7-2.
Port 5 Layer 3
Setup.
8
Now configure the port and stream for ML-7710 Port 5. Right-click the Port 5 SmartCard and choose Layer 3 Setup.
9
Set the MAC and IP addresses and gateway address as shown below.
Remember, the card must have a different MAC and IP address than any of the streams.
10 Once addresses are entered, click OK.
Stream on port 5.
Right-click the port 5 SmartCard and select Transmit Setup, then follow Steps 4–6. Be
sure to press the Enter key after each text entry to save it. Click the Close button to exit the
window.
Note: Note that Source and Destination IPs mirror the settings on port 4.
SmartWindow User Guide
149
Chapter 7: SmartMetrics Testing
Setting One Stream per Card
Learning MAC addresses with Layer 3 ARP
As each
SmartCard
transmits an ARP
request, look for
a brief green
transmit and
receive LED. If
you do not see a
momentary green
receive LED
light, the ARP
response was not
received.
Now, as an alternate procedure for learning the MAC destination addresses, you can send
Layer 3 ARPs from each card.
1
Click on each SmartCard and choose Layer 3 Send ARP Requests, or to send ARP
requests from all configured ports at one time, choose Actions > Layer 3 ARP.
2
Watch the SmartBits hardware or SmartWindow front panel LEDs.
For other streams and ARPs, try the ARP Exchange Times test to ensure that ARPs for all
streams were received. See “Viewing ARP Response Times” on page 185.
Pinging each SmartCard
Pinging to Check
Links.
150
Before transmitting traffic, it is worthwhile to ping the SmartCard IP addresses to confirm
that the links to the DUT are working properly.
1
Right-click on port 4, choose Layer 3 Setup, enter the target IP address for port 5, and
set the ping frequency to 10.
2
Click OK.
3
Right-click on port 5, select Layer 3 Setup, enter the target IP address for port 4, and
set the ping frequency to 10.
4
Click OK.
SmartWindow User Guide
Chapter 7: SmartMetrics Testing
Setting One Stream per Card
5
To view counters for pings, choose Actions > SmartCounters, then choose File > New
Counter Window. Highlight ports 4 and 5.
6
Click on the Start command on each SmartCard and watch SmartCounters for the
ping counters.
7
After the pinging is performed, go back to the Layer 3 Setup of each card to turn off
pinging by setting the Ping Frequency to 0. This will keep other results more clearly
segregated.
Checking SmartCard Speed Setting
The ML-7710
default is 10
Mbps. You may
require 100
Mbps.
If the link is not active, check that the correct speed is selected.
•
To reset the SmartCard speed, click on each card, and select 100Mbps from the dropdown menu of each SmartCard.
Choose to set 100Mbps.
Transmitting
Traffic and
Viewing
Counters.
Now you are ready to transmit traffic and view counters.
1
Choose Actions > SmartCounters, then choose File > New Counter Window to view
all counters during transmission. Repeat for the port 5 SmartCard.
You can save SmartCounters to an Excel spreadsheet file with the File > Save As command.
2
Click Start on transmitting SmartCard to start transmission. For bi-directional transmission, click Start on both SmartCards.
SmartWindow User Guide
151
Chapter 7: SmartMetrics Testing
Setting Multiple Streams per Card
Setting Multiple Streams per Card
This section presents detailed procedures for creating and using multiple streams on two
ML-7710 SmartCards, and then producing counters and test results:
•
•
Setting Up 20 Streams per ML-7710 SmartCard
Creating SMB Group, Transmitting Traffic, and Viewing Counters
This test setup uses two ML-7710s
Additional SmartCards that support this test
Two L3-6710s or ML-5710s could be substituted for the ML-7710s.
Setting Up 20
Streams per ML7710 SmartCard.
The following procedure describes how to quickly set up 20 consecutive streams from
each SmartCard, with varied IP and MAC addresses as well as with varied packet lengths.
If desired, you can also assign different protocols and add up to 1000 streams to further
mimic real world networks.
One ML-7710 card configured with 40
streams can easily simulate 40 PC Hosts
sending and receiving traffic through a DUT.
152
1
Click on the Port 4 SmartCard and choose Transmit Setup. Highlight the default
stream and click the Delete button. It is helpful to delete the default stream and then
configure all new streams.
2
Click Add VTEs.
3
Enter 20 VTEs. Click the Randomized radio button in the Frame Length field. Select
IP from the Protocol drop-down menu.
SmartWindow User Guide
Chapter 7: SmartMetrics Testing
Setting Multiple Streams per Card
Note: Netcom Systems recommends that you start with Fixed frame lengths to set
initial testing benchmarks, then try Randomized frame lengths for contrast. However,
for this test we are going to use Randomized.
4
Click OK. The Protocol Editor appears with default addresses for 20 streams.
5
Edit the first stream as follows:
Source IP address for the first stream: 10.0.0.4
Destination IP address for the stream (which is the Port 5 VTE stream): 20.0.0.5
6
Highlight each column (the SourceIP, then DestIP) individually, right-click on the first
entry, select Copy Down, then select Fill Increment 0.0.0.x.
To change IP
address defaults:
Default view
1. Edit Stream 1
Source and Dest
IP address.
2. Hightlight
Source IP
column, rightclick, then Copy
Down > Fill
Increment 0.0.0.x.
Editing the Default
2. Highlight Dest
IP column, rightclick, then Copy
Down > Fill
Increment 0.0.0.x.
MAC destination
addresses are
filled by ARP
exchange.
Router port
MAC address
Stream
Stream source Stream destination
MAC address IP address
IP address
User-specified entries
are required for
Source IP and Dest IP.
Figure 7-3. Editing default IP addresses
SmartWindow User Guide
153
Chapter 7: SmartMetrics Testing
Setting Multiple Streams per Card
7
Click the Close button and view the 20 streams for port 5 in the Transmit Setup window. Click OK.
8
Repeat above steps 1 through 7 for Port 5 using the following IP addresses. Use the
Port 5 addresses for Destination IP addresses.
Port 5 Stream IP addresses: 20.0.0.005 through 20.0.0.024
20.0.0.100
Gateway for Port 5:
9
To configure the Dest MAC addresses, choose Actions > Layer 3 ARP to send ARP
requests to all configured ports. To check that all ports have sent and received ARPs,
you can perform the ARP Exchange Times test (see “Viewing ARP Response Times”
on page 185).
10 To confirm that the SmartBits links to the DUT are working properly, ping the port IP
addresses as shown in “Pinging each SmartCard” on page 150.
154
SmartWindow User Guide
Chapter 7: SmartMetrics Testing
Setting Multiple Streams per Card
Using Group Start
Creating an SMB
Group,
Transmitting
Traffic, &
Viewing
Counters.
1
Frequently, it is useful to start all transmissions of multiple SmartCards at the same
time. To do this, right-click on SMB Group and choose Set Group.
2
Click the None button to clear all ports, then click on Port 1 and Port 2 checkboxes to
constitute the group (All other ports are grayed out because the box in use is fitted for
Multi-user). Then click OK.
3
To see results of multiple SmartCards on a single screen, choose
Actions > SmartCounters. Then choose File > New Counter Window. Highlight the
port numbers whose counters you wish to view (here Ports 1 and 2). Keep this window open.
4
Choose View > Show and check the boxes for rows and columns.
5
To define a custom indicator, select an empty cell to the right of the cells where data
will be entered. Left-click inside this cell, then insert your math equation (press F2
twice) using spreadsheet conventions.
6
Now click Start on the SMB Group and watch SmartCounters.
SmartWindow User Guide
155
Chapter 7: SmartMetrics Testing
About SmartMetrics
About SmartMetrics
SmartMetrics refers to a method of generating test traffic that supports many unique
streams definitions. Some of the characteristics of Ethernet and Frame Relay
SmartMetrics are:
•
•
•
•
•
•
•
Multiple frame
blueprints,
different
protocols, and
varied frame
sizes possible in
stream
configurations.
Unique streams of traffic, generated from multiple frame blueprints.
Information tracking on a per-stream basis (as opposed to a per-port basis).
A CRC check on the entire frame.
Embedded Signature fields with information about each frame.
In-depth latency and sequence information.
An IP checksum for IP streams.
Traffic can be used to test Layer3.
Index 1
MAC Dest
MAC Src UDP
Index 2
MAC Dest
MAC Src
IPX
Prot Header
Index 3
MAC Dest
MAC Src
IP
Prot Header
Payload
Signature CRC
Index 4
MAC Dest
MAC Src TCP
Prot Header
Payload
Signature CRC
Payload
Prot Header
Signature CRC
Signature CRC
Payload
If enabled, the Signature field overwrites 18 bytes of
data at the end of the payload. It contains information
such as the time stamp, Steam ID, and frame sequence.
Figure 7-4. Four Streams (frame blueprints) on a single SmartMetrics card
Ethernet and Frame Relay cards in SmartMetrics mode support the use of a Signature field.
This field contains information about the specific frame. The information in the Signature
field is a powerful feature used by the receiving card to analyze network traffic (Histograms).
2-byte
time offset
4-byte stream/VTE
number
4-byte sequence
count
4-byte Tx timestamp
4-byte check pattern
(inverse timestamp)
Bits 0-15=Stream/VTE ID# (1-n)
Bits 16-23=Card ID# (0-79)
Bits 24-27=Chassis ID# (0 for now)
Bits 28-31=Check Number (example IP=2)
Figure 7-5. SmartMetrics signature field
156
SmartWindow User Guide
Chapter 7: SmartMetrics Testing
About SmartMetrics
SmartMetrics Test Requirements
Tx requirements
The following must be configured in order for a card to transmit SmartMetrics streams:
•
•
•
The card must be one mentioned in Table 7-2 on page 158.
Streams must exist, be activated, and Frame Rate > 0.
Signature field must be activated on all SmartMetrics cards. To activate the Signature
Field:
• ML-5710, ML-6705, ML-6710, ML-7710. Edit the smartbit.ini file by making
the following entry in the [Preferences] section. See Table 5-4, “SmartBit.ini file
important commands and settings,” on page 87:
Layer3 Signature Control=11
•
POS cards and LAN-6201. Select the Signature Field checkbox in the Transmit
Setup dialog box.
Rx requirements
The following must be configured in order for a card to receive SmartMetrics streams:
•
•
•
•
The card must be one mentioned in Table 7-2 on page 158.
The firmware must support the requested test. See Table 7-2 on page 158.
The Card needs to be in SmartMetrics mode.
The Card must support the requested test. See Table 7-2 on page 158.
1. This entry causes a checkbox to appear between Net Dst and ARP in the Virtual Transmit
Setup (VTE) dialog box.
SmartWindow User Guide
157
Chapter 7: SmartMetrics Testing
About SmartMetrics
Table 7-2
SmartMetrics Cards Test Compatibility
Test Type
L36710
ML-7710
ML-7711
ML5710A
WN-3405
WN-3415
WN-3420A
POS-6500A/3500A
POS-6500B/3500B
POS-6502A/3502A
LAN6201A/
3201A*
Latency Per VTE
No
Yes (FV† >=1.07)
Yes
No
Yes
Yes
Latency over Time
Yes
Yes
Yes
Yes
Yes
Yes
Latency Distribution
Yes
Yes
Yes
Yes
Yes
Yes
Raw Packet Tags
Yes
Yes
Yes
Yes
Yes
Yes
Frame Variation
No
Yes (FV > 1.00)
Yes
No
No
No
Sequence Tracking
Yes
Yes
Yes
Yes
Yes
Yes
Sequence + Latency
Yes
Yes (FV >= 2.00)
Yes
Yes
Yes
Yes
ARP exchange times
Yes
Yes
Yes
Yes
No
No
(16)Latency Per VTE
Yes
Yes
Yes
Yes
No
No
(16)Latency over time
Yes
Yes
Yes
Yes
No
No
(16)Latency
distribution
Yes
Yes
Yes
Yes
No
No
* Requires SmartMetrics mode
† FV= Firmware version
158
SmartWindow User Guide
Chapter 7: SmartMetrics Testing
How to Run SmartMetrics Tests
How to Run SmartMetrics Tests
1
Ensure that both transmitting and receiving SmartCards are in Layer 3 mode.
Either:
• Right-click the card and choose SmartMetrics Mode.
• Check the SmartMetrics Mode box on the Virtual Transmit Engine (VTE) Setup
dialog box.
2
Ensure that at least one VTE exists for the transmitting and receiving SmartCards and
that the VTEs are activated.
Check here to activate a VTE.
You must have
at least one
VTE set up and
activated. You
can add other
VTEs, including
variable length
frames.
Make sure this box is checked.
3
Choose Options > SmartMetrics Tests from the Main Menu.
The SmartMetrics Tests window is displayed.
SmartWindow User Guide
159
Chapter 7: SmartMetrics Testing
How to Run SmartMetrics Tests
4
Select the test you want to run from the Test Type drop-down menu.
5
Specify any parameters needed for the test, such as intervals (for Sequence + Latency
test results.)
6
Select the transmitting and receiving ports.
7
Click the Start button to start the test.
While the test is running the port selection area and most toolbar buttons are greyed
out. The status bar at the bottom of the window displays Test Running.
8
Click the Stop button to stop the test.
The status bar at the bottom of the window displays Test Idle.
9
To view test results, click the Results button.
The Results drop-down menu appears.
10 Select the card for which you want to view results.
11 To save test results to a file, select File > Save or Save As. (The default file format is
Excel.)
160
SmartWindow User Guide
Chapter 7: SmartMetrics Testing
How to Run SmartMetrics Tests
Selecting and Deselecting Ports for SmartMetrics Tests
Select transmitting ports and receiving ports separately. You can select a single port, all
ports at once, or all of the same type of SmartCard ports at once (if you have more than
one).
1
From the main menu, choose Actions > SmartMetrics Tests.
To select ports individually:
•
Click the check box beside the port.
To select all or a group of ports:
1
Click the Tx Ports or Rx Ports button.
Receive Ports button
2
Select one of the following:
• Select All Cards to select all ports
• Clear Card Selections to clear all existing selections
• The SmartCard type to select all of the same type of cards
SmartWindow User Guide
161
Chapter 7: SmartMetrics Testing
How to Run SmartMetrics Tests
SmartMetrics Test Results Window Menus
File
Open an existing results file, save or print the active spreadsheet.
Edit
Manipulate highlighted information, such as copying and pasting it to another
spreadsheet. Clear highlighted areas such as an entire line, or remove formatting that you
set.
Actions
Select whether you want to view the toolbar and/or status bar.
View
Specify the elements of the spreadsheet you want to appear (such as column headings,
Toolbar, and events only and the mouse/keyboard actions allowed to edit.
Format
Define the appearance of the window, such as font used and column dimensions.
Window
Specify how you want multiple spreadsheets displayed in the window.
Help
Identifies the SmartMetrics Test module.
Note: If results for more than one port are displayed, when you save to a file, only the
active spreadsheet will be saved to the file.
162
SmartWindow User Guide
Chapter 7: SmartMetrics Testing
How to Run SmartMetrics Tests
SmartMetrics Test Results Window Toolbar
The SmartMetrics Test window displays a toolbar if the Toolbar option is checked on the
View menu.
Opens an existing results file.
Saves the active results file.
Prints the results file
Cuts the selected area to the Clipboard.
Copies selected area to the Clipboard.
Pastes selected area from the Clipboard
Start transmission.
Stop transmission.
Stop getting test results in the current active Results window.
Stop getting test results in all Results windows.
Adjust column width to match contents.
Adjust row height.
Arrange open files in cascade formation.
Arrange open Results files in tile formation, horizontally.
SmartWindow User Guide
163
Chapter 7: SmartMetrics Testing
How to Run SmartMetrics Tests
Arrange open Results files in tile formation, vertically.
Display About information for the current window.
164
SmartWindow User Guide
Chapter 7: SmartMetrics Testing
How to Optimize 16-bit Latency Testing
How to Optimize 16-bit Latency Testing
The notion of “having to know the latency of a DUT” before running a latency test may
seem like a backwards approach to latency testing. However, the reason for latency tests is
to verify the accuracy of your own latency estimates.
Netcom Systems recommends that you proceed as follows:
1
Using your own Latency estimates for a given DUT, run the Latency Distribution Test
as described in “(16) Latency Distribution Test” on page 167.
2
Take a look at the results.
•
Are the latency results distributed over a few buckets?
•
•
3
Reset the Precision to narrow the scale. For example, if the latency results fall
within two or three buckets toward the center at the default precision of 25.6 µs,
you can change the Precision factor and run the test again.
Try using several frames of variable lengths.
When you are satisfied with the granularity of the Latency Distribution Test, run the
other latency tests.
Refer to “SmartMetrics 16-bit Tests” on page 166 for additional information on setting up
16-bit tests.
SmartWindow User Guide
165
Chapter 7: SmartMetrics Testing
SmartMetrics 16-bit Tests
SmartMetrics 16-bit Tests
16-bit SmartMetrics Tests may generate incorrect results when numbers exceed the upper
limit of a given Histogram Precision range. When this occurs, the results displayed are
meaningless and the test should be run again within prescribed guidelines for a given
DUT.
SmartMetrics Tests use a 32-bit latency counter, whenever possible, to gather and display
statistical data. Some earlier cards only had 16-bit counter capability for gathering
statistical data (this is a firmware limitation). However, for cards that do support 32-bit
counters only 16-bits out of 32-bits are retrieved and displayed for the 16-bit test results.
The retrievable 16-bit portion depends on the Precision setting. By default, the Precision is
set to 25.6, a range of 25.6 µs to 1,677,696 µs (1.6 secs).
This limitation only applies to the 16-bit tests; all 32-bit tests such as, Raw Packet Tag test,
Sequence Tracking test, etc., use the entire 32-bit counter contents and no Precision
setting is required.
The following SmartMetrics Tests are affected:
•
•
•
(16) Latency per VTE
(16) Latency over Time
(16) Latency Distribution
As an example, suppose you run the (16) Latency per VTE test, transmitting a single burst
of frames from the SmartBits Port 1 through a DUT back to Port 2 on the SmartBits. Each
frame’s latency is estimated at 100 µs. We send a single burst, but when the test finishes,
the cumulative latency does not fall between 25.6 µs -1.68 seconds. The test results are
incorrect and we need to recalculate the burst size in frames or change the latency range.
For greater granularity, the expected latency for one frame should fall somewhere close to
the lower limit of the target Precision setting in Table 7-4.
!
Caution: When running 16-bit SmartMetrics Tests, you should take the following conditions into consideration:
•
166
At Precision 6.5 milliseconds, the maximum time of any 16-bit test is 429 seconds.
SmartWindow User Guide
Chapter 7: SmartMetrics Testing
SmartMetrics 16-bit Tests
(16) Latency Distribution Test
The following section describes how to optimize and run this 16-bit test. As explained in
“How to Optimize 16-bit Latency Testing” on page 165, this test is used to:
•
•
•
Narrow down latency estimates
Calculate the number of frames in a burst
Optimize the Precision setting for other 16-bit latency tests
Running the Latency Distribution test
1
From the SmartMetrics Tests window, select Latency Distribution from the Test Type
drop-down menu.
2
Specify a Precision in microseconds in the Histogram Precision field, or use the
default. See “Using the Histogram Precision settings” on page 169.
3
Select the ports to transmit VTEs of data in the test.
4
Select the ports to be monitored as they receive data.
5
Click the Start button to start the tests for all of the ports involved in transmitting and
receiving the data streams.
6
Run the test for a period of time. Then click the Stop button to terminate the test.
7
To view the results, click the Results button and select the port in the drop-down menu.
Adjusting the Precision granularity
After you run this test a few times, you will be able use the latency results to run other
SmartMetrics tests with greater precision.
1
Run the test using the default Precision.
2
When the test is finished, view the results.
3
For example, if the results fall between 25.6 and 51.2 µs, adjust the Precision so that
51.2 µs falls at the upper limit of the range, i.e., select a Precision of 1.6 µs.
4
Run the test again.
5
If the results fall within the lower end of the range, modify the buckets for greater
granularity.
SmartWindow User Guide
167
Chapter 7: SmartMetrics Testing
SmartMetrics 16-bit Tests
You can modify the values in the configurable buckets scale. When you run the test
again, this modifies the header values on the Results spreadsheet.
When you change the bucket values,
the corresponding headers
in the Results spreadsheet change, too.
The Latency Distribution Test transmits a burst of packets (including variable length
packets if you wish), monitors the received latency data, and distributes the results into
spreadsheet “buckets” according 16 specified intervals.
Table 7-3
168
Bucket default values
Bucket
Default
Value
1
25.6
2
51.2
3
128
4
256
5
512
6
1,280
7
2,560
8
5,120
9
12,800
10
25,600
11
51,200
12
128,000
13
256,000
14
512,000
15
1,280,000
16
1,677,696
SmartWindow User Guide
Chapter 7: SmartMetrics Testing
SmartMetrics 16-bit Tests
Using the Histogram Precision settings
You may change the Histogram Precision setting of the buckets. For instance, if Precision
is set to the default 25.6 µs, then upper limit of the test will be 1, 677, 696 µs.
1) Histogram Precision scale
drop-down menu...
2) ...controls current “bucket” values and...
3) ...Header values in Results spreadsheet.
Figure 7-6. Latency Distribution Test window
When you run the test, the buckets are used for holding the distributed latency results for
the received packets in the burst. If the latency results exceed the upper limit of the
selected range for any Precision scale (see Table 7-4, “Latency ranges by Histogram
Precision setting,” on page 170 for range limits), the test is invalid. You must then either
run the test for a shorter period or set the granularity of the Histogram Precision scale to a
new range.
SmartWindow User Guide
169
Chapter 7: SmartMetrics Testing
SmartMetrics 16-bit Tests
Setting the Precision
Precision means finer granularity on the scale of measurement. As the scale increases, it
shifts from µs to seconds. The increments of measurement become larger and granularity
is lost.
Table 7-4
Latency ranges by Histogram Precision setting
Minimum latency*
Maximum latency
.1µs
6.5536ms
.2µs
13.1ms
.4µs
26.2ms
.8µs
52.4ms
1.6µs
104.8ms
3.2µs
209.7ms
6.4µs
419.4ms
12.8µs
.8389sec
25.6µs
1.68sec
51.2µs
3.36sec
102.4µs
6.71sec
204.8µs
13.4sec
409.6µs
26.8sec
819.2µs
53.7sec
1638.4µs
107.4sec
3276.8µs
214.7sec
6553.6µs
429.4sec
* The lower limit is used to select the range in
the Histogram Precision scale.
(16) Latency per VTE Test
The Latency per VTE test checks the latency for each active VTE of the transmitting port.
Before running this test, refer to “SmartMetrics 16-bit Tests” on page 166.
SmartWindow monitors the received data and displays these results:
•
•
•
•
170
Port - Transmitting port number.
VTE - Transmitting VTE stream number.
Frames -Total number of packets received.
Minimum, Maximum, Average – Minimum, maximum, and average latency (time in
microseconds, between time sent and time received)
SmartWindow User Guide
Chapter 7: SmartMetrics Testing
SmartMetrics 16-bit Tests
Running the Latency per VTE test
1
Select Latency per VTE from the Test Type field drop-down list.
2
Specify a Precision in microseconds in the Latency Precision field, or use the default.
3
Select the ports to transmit VTEs of data in the test.
4
Select the ports to receive data.
5
Run the test for a specified period of time. Then click the Stop button to terminate the
test.
6
To view the results, click the Results button and select the port in the drop-down
menu.
The values show the latency of all received packets in the burst and are dependent on
the Precision setting.
(16) Latency Over Time Test
You must specify a time period (e.g., 1 millisecond increments). The test will store results
in up to 4,000 data collectors. The test records all packets received with timestamp data
and calculates the average latency for all currently active VTEs. The test also records data
for discard eligible packets. Before running this test, refer to “SmartMetrics 16-bit Tests”
on page 166.
SmartWindow monitors the received data and displays these results for all packets and as
well as separate columns for discard eligible packets:
•
•
•
MilliSec – The time interval over which the data was gathered.
Frames – Total number of packets received.
Minimum, Maximum, Average – Minimum, maximum, and average latency (time in
microseconds, between time sent and time received)
Running the Latency Over Time test
1
Select Latency over time from the Test Type field drop-down menu.
2
Specify the Precision in microseconds in the Latency Precision field, or use the
default.
3
Select the ports to transmit VTEs of data in the test.
4
Select the ports to be monitored as they receive data.
5
Click the Start button to start the tests for all of the ports involved in transmitting and
receiving the data streams.
6
Run the test for a period of time. Then click the Stop button to terminate the test.
7
To view the results, click the Results button and select the port in the drop-down
menu.
SmartWindow User Guide
171
Chapter 7: SmartMetrics Testing
Other SmartMetrics Tests
EXAMPLE: If you set the test for a time interval of 5000 milliseconds, and the test
runs for 1 minute. The Results spreadsheet will contain 12 rows, showing the number
of packets, minimum, maximum and average latency during that time period.
Other SmartMetrics Tests
Refer to “Required Steps for Layer 3 Testing” on page 140 to set up Smartmetrics tests
and “How to Run SmartMetrics Tests” on page 159 to run them.
Sequence Tracking Test
The Sequence Tracking test checks if any packets were dropped (not received) or received
out of sequence for each active VTE.
SmartWindow monitors the received data and displays results for:
•
•
•
•
•
•
Port - Transmitting port number.
VTE - Transmitting VTE stream number.
Frames -Total number of packets received.
InSeq - Number of packets received in sequence.
Duplicate - Number of duplicate packets received.
Lost - Number of packets lost.
To run the Sequence Tracking test:
1
Select Sequence Tracking from the Test Type field drop down list.
2
Select the ports to transmit VTEs of data in the test.
3
Select the ports to be monitored as they receive data.
4
Click the Start button to start the tests for all of the ports involved in transmitting and
receiving the data streams.
5
Run the test for a period of time. Then click the Stop button to terminate the test.
6
View the results by clicking the Results button.
Sequence + Latency Test
The Sequence + Latency test checks packet tags to verify that packets transmitted by other
SmartMetrics SmartCards are received correctly, whether they are received in the correct
sequence, and whether there are duplicate or missing packets. This test is a combination of
the Sequence Tracking, Latency per VTE, and Latency Distribution tests.
The Sequence and Latency test is run per VTE stream. SmartWindow reports test results
for each active VTE stream separately. For the duration of the test, the results show the
minimum, maximum and average latency in microseconds for each VTE stream received
from each port transmitting to the receiving port.
172
SmartWindow User Guide
Chapter 7: SmartMetrics Testing
Other SmartMetrics Tests
Important: This test does not apply to ML-7710 SmartCards.
SmartWindow monitors the received data and displays results for:
•
•
•
•
•
•
•
Port - Transmitting port number
•
16 Latency intervals - Latency distribution for default or user-specified times in
microseconds.
VTE - Transmitting VTE stream number
Frames -Total number of packets received
InSeq - Number of packets received in sequence
Duplicate - Number of duplicate packets received
Lost - Number of packets lost
Minimum, Maximum, Average – Minimum, maximum, and average latency (time in
microseconds, between time sent and time received)
Note: For this release, use a rate less than 133,000 per second. You set the rate at the
Interpacket Gap area of the Transmit Setup dialog box.
To run the Sequence + Latency test:
1
Select Sequence + Latency from the Test Type list box.
2
Enter a time in microseconds for an interval and press Enter, or use the default times
that are displayed for the test. These times are used to create a histogram of packets
received within the specified time intervals. You can specify up to 16 counter ranges,
incrementing each histogram counter for each packet received within the range of the
counter. Each counter can be specified in bit times (for example, 0.1 µsec.).
3
Then select which time intervals you want to use for the test. If you do not select any
intervals, each of the 16 will be used.
4
Select the ports to transmit VTEs of data in the test. Only SmartMetrics SmartCards
appear.
5
Select the ports that will be monitored as they receive data.
6
Click the Start button to start the tests for all of the ports involved in transmitting and
receiving the VTE data streams.
7
Run the test for a period of time. Then click the Stop button to terminate the test
8
View the results by clicking the Results button.
You can save the results to an Excel or Layer 3 Editor file, or copy and paste them to other
applications.
SmartWindow User Guide
173
Chapter 7: SmartMetrics Testing
Other SmartMetrics Tests
Raw Packet Tags Test
In Layer 3, VTE streams contains a 16-byte packet tag field in each transmitted packet.
This tag is inserted at the end of the packet and consists of: packet sequence number,
source VTE stream, destination VTE stream and timestamp. This function is used to
determine transit latency and, in conjunction with the Protocol VFD, to facilitate mesh
tests of components such as routers.
In the Raw Packet Tags test, packets are stored and sent directly to SmartWindow without
any calculations or filtering performed on the VTE stream tags received. The test can store
up to 4,000 packet tags. The results spreadsheet for the test displays one line of
information for every tagged packet of each VTE.
Note: The Raw Packets Test retrieves and displays a maximum of 16,300 packets.
SmartWindow monitors the received data and displays these results for each packet of
each VTE:
•
•
•
Port – The port on which the packet was received.
•
TxTime – The timestamp of when the packet was transmitted. It is the timestamp of
transmit time for a packet to 100 ns resolution. (This time stamp is added by the
transmit hardware and represents the actual time the packet exited the card rather than
the time the packet was prepared for transmission.) It is an absolute number
representing the clock tick at the time of transmission. It is relative to Rx Time.
•
RxTime - The timestamp of when the packet was received. It is an absolute number
representing the clock tick at the time of receipt. It is relative to Tx Time.
•
Delta – The amount of change between Tx Time and Rx Time.
VTE – The number of the VTE identifying the VTE source of the stream.
Sequence – The packet sequence number, which is incremented for each packet
transmitted. Sequence numbers are maintained independently for each destination
VTE stream. They are reset to zero whenever the card is started.
To run the Raw Packet Tags test:
174
1
Select Raw packet tags from the Test Type field drop down list.
2
Select the ports to transmit VTEs of data in the test.
3
Select the ports to be monitored as they receive data.
4
Click the Start button to start the tests for all of the ports involved in transmitting and
receiving the data streams.
5
Run the test for a period of time. Then click the Stop button to terminate the test.
6
View the results by clicking the Results button.
The raw data is shown in the spreadsheet and can be copied or saved for detailed processing elsewhere.
SmartWindow User Guide
Chapter 7: SmartMetrics Testing
Other SmartMetrics Tests
ARP Exchange Times Test
This is a test of ARP (Address Resolution Protocol) response. For each VTE stream that
uses IP or UDP, the card transmits an ARP request. The timestamp of the request and its
response is stored per stream. Information is stored for each active stream.
For each VTE (stream) SmartWindow displays these results:
•
•
DestMAC - the MAC address of the connected device under test.
ReplyTime - the time in microseconds before an ARP response was received.
To run the ARP Exchange Times test:
1
Select ARP Exchange Times from the Test Type field drop down list.
2
Select the ports to transmit VTEs of data in the test.
3
Select the ports to be monitored as they receive data.
4
Click the Start button to start the tests for all of the ports involved in transmitting and
receiving the data streams.
5
Run the test for a period of time. Then click the Stop button to terminate the test.
6
View the results by clicking the Results button.
Frame Variation Test
Packets that were transmitted at regularly-spaced intervals can be delayed once they enter
the network and arrive at varying intervals, due to factors such as jitter or the device's
buffering.
This test measures variations in how soon one packet follows another in a VTE stream. It
measures, for example, the time interval between packets 1 and 2, then between packets 2
and 3 and so on as they arrive at the device under test. This test plots the number of
packets that arrive within each of the 16 user-specified time intervals.
SmartWindow monitors the received data and displays these results for each packet of
each VTE:
•
•
•
•
Port – The port on which the packet was received.
VTE – The number of the VTE identifying the VTE source of the stream.
Frames -Total number of packets received
16 Intervals – Time interval default or user-specified times in microseconds by which
to track packet arrival times.
To run the Frame Variation test:
1
Select Frame Variation from the Test Type field drop down list.
2
Enter a time in microseconds for an interval and press Enter, or use the default times
that are displayed for the test. These times are used to create a histogram of packets
received within the specified time intervals.
SmartWindow User Guide
175
Chapter 7: SmartMetrics Testing
Other SmartMetrics Tests
You can specify up to 16 counter ranges, incrementing each histogram counter for
each packet received within the range of the counter. Each counter can be specified in
bit times (for example, 0.1 µsec.).
176
3
Select which time intervals you want to use for the test. If you do not select any intervals, each of the 16 will be used.
4
Select the ports to transmit VTEs of data in the test. Only SmartMetrics SmartCards
appear.
5
Select the ports that will be monitored as they receive data.
6
Click the Start button to start the tests for all of the ports involved in transmitting and
receiving the VTE data streams.
7
Run the test for a period of time. Then click the Stop button to terminate the test
8
View the results by clicking the Results button.
SmartWindow User Guide
Chapter 7: SmartMetrics Testing
SmartMetrics Test Results
SmartMetrics Test Results
The SmartMetrics tests emulate live network traffic. They provide information about the
relationships and timing of frames so you can evaluate the functionality and performance
of a device under load. They dynamically track data per stream and change in latency.
Since the results are in spreadsheet format, you can also obtain totals for a single
SmartCard. The stream-based SmartMetrics test results include:
•
•
•
•
•
•
•
•
Sequence tracking
Sequence + Latency–both16- and 32-bit tests (does not apply to ML-7710 SmartCard)
(16) Latency per VTE
(16) Latency distribution
(16) Latency over time
ARP exchange times
Raw packet tags
Frame variation
The (16) in front of some test options refers to the number of bits available for counter
results. Tests with no (16) contain 32-bit counters. Before running the 16-bit counter tests,
refer to “SmartMetrics 16-bit Tests” on page 166.
Latency in SmartMetrics Test Results
All of the SmartMetrics latency tests measure the difference between transmit and arrival
time. Specifically, this is the difference between the time at which a tagged byte leaves the
transmitting port and the time at which that byte arrives at the receiving port. However,
each test result differs in how it measures latency—per VTE, over time, or by distribution.
The Sequence + Latency tests combines three tests: Sequence tracking, Latency per VTE,
and Latency distribution.
Cut Through and Store and Forward Devices
Latency test results are typically used to measure the performance of "cut through"
devices. Measurement of latency through one or more "store and forward" switches can be
calculated by adding the time to transfer any remaining bytes out of the transmitting port.
Cut Through devices begin retransmission after receiving packet headers. This increases
performance over "store and forward devices." Latency of these devices is described
above.
Store and Forward devices receive a complete packet on the input port before beginning
transmission on the output port. For these devices, the latency is defined as the difference
between the time the last byte leaves the transmitting device and the time at which the first
byte arrives at the destination device.
SmartWindow User Guide
177
Chapter 7: SmartMetrics Testing
SmartMetrics Test Results
The results are presented to cover both possibilities. A result of NO is shown in the Store
and Forward column if the system is able to detect the type of device under test is a cutthrough switch.
Interpreting SmartMetrics Test Results
SmartWindow places test results for a receiving port into a spreadsheet that you view from
within the SmartMetrics Tests window. Use the SmartMetrics Test window toolbar buttons
or the menu options to modify the spreadsheet format and selectively display information,
similar to the way you do with traditional spreadsheet applications.
Timestamps - Tests that use latency histograms (Sequence + Latency, Latency over time)
utilize a timestamp of when the packet was transmitted. The timestamp is the transmit
time for a packet to a 100 ns resolution. The transmit hardware adds this time stamp. It
represents the actual time the packet exited the card rather than the time the packet was
prepared for transmission. It is an absolute number representing the clock tick at the time
of transmission.
Management Frames – You can add management frames (RIP and SNMP) to any
SmartMetrics tests as per RFC 1944 from the Layer 3 Setup dialog box. Management
frames are relatively low rate streams containing authentic packets that are designed to
inject management and routing control traffic into a test stream
Note: If you display results for more than one port at a time, when you save to a file, only
the active spreadsheet will be saved to the file.
Viewing SmartMetrics Test Results (Histograms)
To view results for a single destination SmartCard:
1
Click the Results button, or select Actions > Get Results from the menu.
2
Select the port for which you want to view results.
A spreadsheet containing the results appears in the right pane of the window.
3
Specify any formatting or window elements that you want using the toolbar or menu
bar options.
To view results for more than one port, repeat these steps. Spreadsheets for subsequent
ports that you select will display in the window according to which command is in effect
on the toolbar.
To change the order in which the results are retrieved:
178
1
Click the Results button, then choose Options from the pop-up menu.
2
From the SmartMetrics Test Options dialog, select the port to reorder the test results.
SmartWindow User Guide
Chapter 7: SmartMetrics Testing
Detailed Tracking and Statistical Results
Detailed Tracking and Statistical Results
This section illustrates a sample configuration procedure for the latency and sequence
tracking tests to inspect the raw packet results by using data capture.
•
•
•
Performing
Latency and
Sequence
Tracking Tests.
Performing Latency and Sequence Tracking tests
Inspecting Raw Packets
Using Triggers and Capture
The Latency and Sequence Tracking tests provide valuable statistical data for performance
analysis of the Layer 3 switch/router.
1
Before running these tests, confirm that your links are alive.
Link displayed on the SmartCard
indicates an active link to the DUT.
In this example, the following parameters are set up using 20 streams for Ports 1 and 2:
• Transmit Setup: Continuous Mode, 9.6 µSec interpacket gap for 100% utilization
• Frame length for all streams: 60
2
Choose Actions > Layer 3 Send ARP Requests.
3
To run SmartMetrics tests on traffic from Port 1 to Port 2, choose Options > SmartMetrics Tests.
SmartWindow User Guide
179
Chapter 7: SmartMetrics Testing
Detailed Tracking and Statistical Results
Sequence
Tracking.
180
4
Choose Test Type > Sequence Tracking, select checkboxes for Tx Port 01 and Rx Port
02, then click Start button at the bottom of the window. After several seconds, click
the Stop button. Then click Results button and select the receive card, Port 02.
5
To set a lighter load and determine the rate at which there is little or no packet loss,
right-click Port 1, select Transmit Setup, and click This Port button.
6
From the drop-down menu for Interpacket Gap, select % Utilization in the Units field
then enter 90 in the Rate field. Click OK.
7
Click OK again to close the Transmit Setup window.
SmartWindow User Guide
Chapter 7: SmartMetrics Testing
Detailed Tracking and Statistical Results
8
Run the Sequence Tracking test again.
After a few more test runs, the 80% load produced the following sequence tracking.
You may wish to repeat this test a number of times over a period of time to track the
consistency of the router and potential interruptions during the same and different
loads, with increased or decreased number of streams, with varied frame lengths
(either fixed or random.
⇓
The remaining tests are run at the 80% utilization rate with the same switch.
SmartWindow User Guide
181
Chapter 7: SmartMetrics Testing
Detailed Tracking and Statistical Results
Latency Tests
1
Choose Test Type> Latency over Time. Click Start button, run for a few seconds, then
click the Stop bottom. Click Results and select the receive Port 02.
An ideal switch would slightly increase latency for a short time; latency would remain
constant for most of the test, then decrease as the ML-7710 stops transmitting. An
increasing latency from start to finish indicates that the switch cannot handle the load
for long sustained periods. As the latency increases, the switch buffers more frames. A
spike in the latency indicates a problem with buffer scheduling and warrants more
investigation.1
1. After approximately 1 second, the latency drops to a reasonable level. A possible cause of this
change is the use of a Fast Path mechanism.
182
SmartWindow User Guide
Chapter 7: SmartMetrics Testing
Detailed Tracking and Statistical Results
A closer look at
the Latency per
VTE.
2
Choose Test Type > Latency per VTE. Click Start button, run for a few seconds, then
click the Stop bottom. Click Results button and select the receive Port 02. Here again
spikes in the latency are apparent.
The 20 streams are summarized with the minimum, maximum, and average for each
stream. The latency range is relatively wide.
And now the
Latency
Distribution.
3
Choose Test Type > Latency Distribution. Click Start button, run for a few seconds,
then click the Stop bottom. Click Results button and select the receive Port 02. Here
the latency has dropped dramatically, to the later low level shown in step 7, so that the
13.4 to 14.2 mSec shows consistently under the 20 mSec time interval.
SmartWindow User Guide
183
Chapter 7: SmartMetrics Testing
Detailed Tracking and Statistical Results
Inspecting Raw
Packets.
To look closely at the content of the last 131,000 packets received, use the Test Type Raw
Packet Tags test.
4
To use full-wire rate in Single Burst mode, click the Port 4 SmartCard, choose Transmit Setup, and click This Port button. Set mode to Single Burst and select Units >
%utilization and Rate > 100 in the Interpacket Gap field which will create a 10-second burst at full wire rate. Click OK.
Note: The two active ML-7710 SmartCards show the live Link status and Burst
mode.
Burst Mode sends 100 frames
from Port 6 to Port 2.
5
184
Now choose Options > Layer 3 Tests and then Test Type> Raw Packet Tags.
SmartWindow User Guide
Chapter 7: SmartMetrics Testing
Detailed Tracking and Statistical Results
6
Click the Start, Stop, and Results buttons to view raw packets in detail.
Notice how the test cycles continuously through the five streams set up on Port 4.
Viewing ARP Response Times
It can be helpful to look at ARP response times which may vary with traffic load, time of
day, and the characteristics of each switch. The ARP response times also confirm that all
ports are sending and receiving ARPs properly.
Perform an ARP
exchange and
view the ARP
response times.
1
Choose Options > SmartMetrics Tests.
2
Choose Test Type > ARP exchange times.
3
Click on Ports 2 and 6 for Tx and Rx Ports. Each port will send ARPs to the DUT and
receive a response time for each stream.
4
Click the Start button. After a few seconds, click the Stop button.
5
Click the Results button and select port 2 results. Then click Port 6 results.
A separate Results window appears for each port.
SmartWindow User Guide
185