1
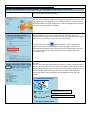
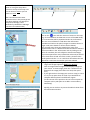
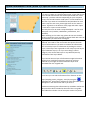
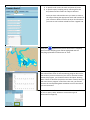
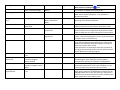
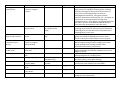
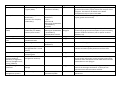
Oyster Information Portal – user-guide (19/11/2012 version)
Developers: Ana Rubio & Pia Winberg Shoalhaven Marine and Freshwater Centre, University of Wollongong Further information/comments: [email protected] (Ana); 0427 28 5999 FRDC‐DCCEE 2010/534 ‘Ensuring that the Australian Oyster Industry adapts to a changing climate: a natural resource and industry spatial information portal for knowledge action and informed adaptation frameworks’. This project has initially focused on 4 Local Government Areas in the NSW coast (Port Macquarie/Hastings; Lower Hawkesbury; Shoalhaven and Bega with focus on Pambula Lake) for a proof of concept of an Oyster Information Portal. This prototype can be expanded to other oyster farming states and coastal catchments in Australia in the future. Background: The Australian oyster industry identified a need to consolidate and access natural resource information based on environmental monitoring and industry management data. Such data exists and could contribute to increased resilience of the industry in light of climate change (Leith and Haward, 2010) and interactions with catchment development. However the data is currently dispersed, inaccessible and/or difficult to interpret. By accessing and relating information such as environmental and management approaches with oyster performance, the oyster industry should become stronger and more resilient. It will provide the industry with the capacity to inform pre‐emptive adaptation responses rather than reactive ones. Project outline: This project will collate and translate environmental, industry, catchment and climate related data into a user‐friendly online map‐based portal. The oyster industry, its stakeholders and Natural Resource Management agencies have been consulted throughout with an initial focus on the 4 oyster producing areas in NSW used in this proof of concept project. Current status: Current prototype of the Oyster Information Portal (OIP) covers 4 main oyster producing rivers used in this proof of concept: Camden Haven, Hawkesbury River, Shoalhaven River and Pambula Lake. Data used in the OIP includes priority data sets identified by oyster industry members and catchment managers at workshops undertaken as part of this project. These data sets cover water quality data from monitoring programs undertaken by local and state government, researchers and the oyster industry through their Shellfish Quality Assurance Program managed by NSW Food Authority; bacteriological, heavy metals, biotoxins, algae and water quality. In addition catchment‐related information, oyster monitoring programs and links to reports, websites, programs that contribute towards the health and management of coastal estuaries and land are also included. The following notes have been put together to assist you with the navigation through the OIP. The OIP works best using Google Chrome, Firefox or Safari. Hope the following notes are helpful when using the portal. Contact us if you have any problems accessing the data Go to http://www.oysterinformationportal.net.au/data‐portal The data portal is password protected‐ please contact Ana Rubio ([email protected]) if you would like to have access to it. With in‐kind support from the NSW Food Authority, Coastal Councils and Government departments in the 4 LGAs where we are working on this project (http://www.oysterinformationportal.net.au/sponsors ) http://www.oysterinformationportal.net.au/data-portal
Oyster Information Portal (Scale 1)= Australia and NSW LGA scale
General tools:
Most of the tools used in this web-mapping tool are similar to the tools
you use in web and GIS softwares
Enlarge ‘Map’ or ‘Legend’ window: You can place mouse on margin separating both windows‐ you will see that the mouse pointer changes to an arrow with both points‐ left click mouse and while holding left click, drag mouse so that the margin moves based on the window you would like to enlarge Check the ‘Help’ tab Please familiarise at this scale with the tools for Zoom in; Zoom out; Panning; Back to original view (useful for when you have zoom in too much and you are not sure where you are in the overall map). You will need to use the Hyperlink (shown in red rectangular) to extract information from the different layers/ polygons or points. The information associated with the feature you have selected will come up in the ‘Information’ tab. See more information on this below under the ‘Information’ tab. ‘Legend’ The ‘Legend’ tab will show the layers of information that the map holds at any scale. In some cases the layers will always be shown as in Scale 1 (diagram on the left) and in other cases each layer will have a square in front of the name of the layer that will allow you to switch them on (by ticking the square, so the map draws the information from this layer) or switch them off (by un‐
ticking the square so the information is not displayed in the map‐ see below). Square ticked= Layer visible Square un‐ticked= layer not visible You have two options in Scale‐1 to ‘Zoom to’ using the drop‐down arrows on the top of the map area. You can Zoom to LGA or you can Zoom to a State LGA= Local Government Area. Remember that in this prototype we have been working in 4 LGAs (Port Macquarie/Hastings; Lower Hawkesbury; Shoalhaven and Bega with focus on Pambula Lake) ‘Information’ tab Enlarge viewing of plots Click on the icon and then click on a feature on the map (e.g. click somewhere on NSW state or one of the NSW LGAs). => A new window will be populated under the ‘Information’ tab. You can scroll down to read about the information provided and clink on the plots/ images to visualise them at a larger scale (more details on how to do this below). You can open more than one Hyperlink per map. Each hyperlink will result in a different window that will be collated like an accordion in the ‘Information’ tab. By clicking on the name of a window, this will collapse or extend accordingly. If you have opened too many Information tabs and you would like to close them all and start from scratch‐ please tick the small square with the ‘x’ in it‐ it will clear all windows that are opened or it will clear the window you have selected Enlarge photos, plots or other graphics. 1 Large scale images appear in NEW front Window: Click on image and the image will be displayed larger on your screen. To close image, press the ‘x’ button on the bottom of the image (if this does not work, then press ‘Esc’) 2 If you right‐click on the image you can then ‘Copy’ or ‘Save as’ so you can paste them in word if you would like to compare different plots from different regions [In this version of the portal we do not have an option to compare side‐by‐side plots as we did in some industry workshops] Equally you can click on any external web link shown from the Information window Oyster Information Portal (Scale 2)= Specific River information
Zoom to Scale 2- River scale
How to Zoom from LGA to River scale: ‘Legend’ =Visualise layers of information: If you scroll to the end of the page from the LGA window there is an entry to Zoom to a ‘Scale 2 River name’. If you click on this link a second web browser tab will be opened with the “River scale map” you have selected. Depending on your computer set‐up, this second browser could open in a new window or a new tab. If you want to have different tabs/windows for each Scale‐2 map for each river, please right click on the ‘Zoom to Scale 2’ hyperlink at the bottom of the page and select ‘Open in new tab’ or ‘Open in new window’ Currently there are 4x Scale 2 maps developed – one for each OIP oyster river (Camden, Hawkesbury, Shoalhaven, and Pambula). When working on this scale map, please do not use the back arrow to go back or your map will re‐appear blank with none of the selections you have been working on. As you open a new map, no layer of information will be selected. You need to click and unclick the squares for each layer of information as you wish to visualise the information. You can overlay layers of information by clicking on several layers. These layers are organised so that a top layer will lay on top of a bottom layer (i.e as if you are making a cake or lasagna!). This means that layers on top will hide/overlay information from layers below. If you cannot see one layer of information might be because another layer could be covering the area that you have selected or you might not have clicked that layer to be visualised from the ‘Legend’ tab. From here you can select information from features on the map (sampling points, polygons, areas) by using the Hyperlink icon. Information windows for each selectable point will appear in the Information tab as per Scale 1. A table summarising data information by custodian used in this data portal has been included at the end of this user‐guide. This table also includes a list of acronyms used in this portal. Other ways of Zooming: You can click on the ‘Search’ tab and choose: 1) A specific scale‐ enter the scale and press ok/ enter 2) A specific topic/ sampling site by selecting from the drop‐down window under the ‘Object selection’ Once you have selected the item you want to zoom to, the map will bring the appropriate scale and location for your selection. Make sure that the layer of information you want to see has been ticked from the ‘Legend’ tab Using the Hyperlink icon you can hover over a sampling point and the sampling point will be highlighted and the sampling ID/Number will be shown in a box Sometimes, you might find a plot with no data on it. It means that information exists for this monitoring program but not for the location you have selected. If you click on another location within this program, you should be able to find plots showing data. If there is data but the plot has not been created, then you will read “Plot in progress” and if this is the case, you should contact the corresponding data custodian to access the data if you are interested. If you see in the ‘Information’ tab a link to “Further Data”‐ click on it as a report, table, website or some other type of information will pop up Acronyms
ASS= Acid Sulfate Soils DO= Dissolved Oxygen EMS= Environmental Management Systems HA= Harvest Areas LGA= Local Government Agency LPMA= Land & Property Management Authority MHL= Manly Hydraulic Laboratory NOW= NSW Office of Water NRCMA= Northern Rivers Catchment management Authority NSW DPI= NSW Department of Primary Industry NSW FA= NSW Food Authority OIP=Oyster Information Portal OMP= Oyster Monitoring Program OeH= Office of the Environment and Heritage PMHC= Port‐Macquarie Hastings Council SQAP= Shellfish Quality Assurance program STP=Sewage Treatment Plant SRCMA= Southern Rivers Catchment management Authority WQ= Water Quality Data sources available as per 19th November 2012
Scale1: Australia wide (States) Scale1: NSW Study Areas ‐ LGAs (4) ‐Port‐Macquarie & Hastings; Lower Hawkesbury; Shoalhaven; Pambula lake Scale 2: River scale ‐General information on oyster industry in each state: oyster species cultivated; oyster legislation; state fisheries groups; production reports, spat sales (when available) ‐Oyster production per state by quantity and quality since 2000‐
2010 General information on: ‐Councils and CMA information ‐State for the Catchment Reporting ‐National Pollution Inventory ‐Oyster industry for each of the 4 LGAs part of this project: oyster species cultivated; production value and production by oyster sizes, oyster industry strategic management plans ‐Metadata file for the Oyster Information Portal project ‐Historical oyster production plots for Sydney rock oysters (1930‐current) ‐OeH information on catchment /river features (area, macrophytes area, depth, tidal limit, flushing times, average rainfall, Annual evaporation) ‐Photos of the estuaries See table in next page for details in data sources Data Type Layer name in OIP Custodian Type of icon Water Level & Discharge NSW Office Water – Water Level & Discharge BoM Rainfall NSW Office of Water (NOW) BoM Icon Sewage Treatment Plant (STP) Sewage Treatment Plant Icon/Polygon Water level/ Tidal level Historical Water quality Manly Hydraulics Lab Water level OzCoast Water Quality Local council/ Sydney Water/ Shoalhaven Water MHL/ OeH OzCoast‐ State and local government Icons Historical Water quality NSW Fisheries and Others NSW Fisheries/ Researchers Icons Oyster Harvest Areas Harvest Areas NSW FA Polygon Oyster flesh Biotoxin Included in each Harvest Area NSW FA Shellfish Quality Assurance Program‐ Water/ Shellfish NSW FA Shellfish Quality Assurance Program‐ Heavy Metal Included in each Harvest Area NSW FA Polygon NSW FA Point NSW FA Point NSW FA Polygon Rainfall gauges Bacteriological (water and oyster) Heavy Metals in Oysters Microalgae/ Phytoplankton Icon Icons Data output by clicking on icon Location of Water Level and Discharge gauges with links to metadata and NOW online web portal Location of Rainfall gauges with links to metadata and BoM online climate data portal – only included in Shoalhaven Scale 2 Location of STPs; type of STP, annual reports on discharge and nutrient production Metadata information on data collection, link to annual reports and link to online‐websites with latest values Historical data on water quality as per website OzCoast. Some locations have a large extent of parameters while others hardly have any data recorded for some locations Historical water quality information on scanned old report‐ created sampling point on map as per description in report to link to such resource Metadata information on management of each harvest area (HA) including opening and closures‐ reports from NSW FA and summary tables describing the number of days that a HA has been closed. Also information on SQAP‐algae data that compares all the algae sites (each represents one HA). Also it includes Oyster Biotoxin monitoring program. Metadata and Table‐ biotoxin results per month and year Metadata of monitoring program and plots of bacteriological, water quality and rainfall (Water Temperature, Salinity) for individual sampling points Metadata of monitoring program and graphs for each Heavy Metal parameter across years sampled‐ in most cases one point that represents the whole river Metadata of monitoring program and major harmful algae groups (diatoms; dinoflagellates) combined for all phytoplankton sites in one river (each one represents a Harvest Area). Graphs represent monthly variability with data combined for years 2005‐current Data source Microalgae/ Phytoplankton Layer in OIP NSW FA Shellfish Quality Assurance Program‐ Plankton Custodian NSW FA Type of icon Point Water quality PMHC water quality summary area PMHC/NRCMA (* only for Camden at this stage) Polygon Water quality (Physical, chemical and nutrients) <Council name> water quality Councils involved per LGA Points Water quality (Temperature and Salinity) NSW FA Shellfish Quality Assurance Program‐ Water/ Shellfish NSW FA Points Water quality (Temp, Sal, Uni of Wollongong WQ pH, DO, Turb) probe data UoW Points Water quality DECC and DEW Points Rubio, A (PhD) [Only for the Sholahaven] UoW/ SRCMA ( not in Camden) NSW DPI Fisheries Points Water quality Water Temperature Aquaculture leases OISAS priority leases Macrophytes OzCoasts water quality data Rubio_ANU_WQ Oyster Monitoring Program (OMP) NSW DPI Fisheries‐ Oyster leases NSW DPI Fisheries‐ Priority NSW DPI Fisheries oyster leases NSW DPI Aquatic Plants NSW DPI Polygon Data output Metadata of monitoring program and plots of specific algae species for individual sampling points including monthly Total algae counts (ie proxy for biomass) by year, main harmful algae groups (ie. Diatoms, dinoflagellates and others), main genus (Pseudo‐
nitzschia, Alexandrium, Prorocentrum, etc..) and plots for some of the most harmful species through time [Hawkesbury River – plots above only developed for Sites 31; 44 & 7; The rest of the NSW FA SQAP Phyto sites have been fully developed for other OPI rivers] Metadata of monitoring program and WQ graphs for sampling points within an area (time series of different sampling points) so that data can be compared across sampling points in one area. Metadata of monitoring program and Water Quality graphs for individual sampling points (time series). Current and historical information for some councils Metadata of monitoring program and plots of Bacteriological testing of water sampling sites within oyster growing areas including rainfall, water temperature and salinity (time series) Metadata of monitoring program and plots of water quality collected from research programs via an in‐situ logger (a subset) Metadata of the monitoring program and historical water quality data for sampling points Metadata of the monitoring program and some plots of the water quality ( some plots missing) Daily data from in‐situ Temperature loggers deployed in some of the oyster baskets part of the OMP Location of leases and their lease numbers Polygon Location of priority leases and status Polygon Location of aquatic macrophytes (Seagrass types, mangroves and saltmarshes) Polygon Data source Oyster performance Layer in OIP Oyster Monitoring Program (OMP) Custodian UoW/ SRCMA (* not available in Camden) Type of icon Points Oyster performance Research> ANU_Rubio (Shoalhaven) Research> Uni of Sydney (Hawkesbury) Points Oyster Disease (QX and POMS) ‐Uni of Sydney_POMS (Hawkesbury for POMS) ‐Hornsby Shire Council Land use types State Forest and National Parks Flood gates location Land use Location of State Forest and National Parks Flood mitigation ‐Rubio, A (PhD data in Shoalhaven, 1 year) ‐Paul‐Pont & Whittington (POMS data in Hawkesbury, 3months) ‐Paul‐Pont & Whittington (POMS data in Hawkesbury) ‐Hornsby Shire Council LPMA LPMA Dam Tallowa_Dam (and Warragamba Dam‐ in next version) Land categorised by risk of LPMA developing ASS Southern Rivers Catchment SRCMA Management Authority Acid Sulfate Soils Catchment Management work (streambank; riverbank; re‐vegetation; laneway; floodgate work; fencing; effluent) Estuary Drainage Office of Environment and Catchment Heritage Environmental Management Systems Oceanwatch_EMS Polygon Polygon {data only for the Hawkesbury} Metadata of the monitoring program and some plots of oyster mortality, disease window of infection, link to reports on these diseases, etc) Location of land use types Location of State Forest and National Parks Points Location of floodgates Points Location of Dam & graphs about water volumes, water releases and water quality downstream from dam Polygon Location of ASS Polygon Grid with catchment works‐ click on the line of the grid to get further information on the polygons where work has been done‐ description of how much work has been undertaken on each polygon OeH Polygon Oyster Industry/ Oceanwatch/CMAs Point Metadata associated with each polygon. It represents each of the drainage catchments‐ so that you can estimate which direction water will flow Information on EMS development and link to latest documents SCC (*only available for Shoalhaven) SCA Points/ Polygons Data output Metadata of monitoring program and plots of oyster growth and mortality. Oyster leases that are part of this program. This data can be linked to the Water Temperature Layer as part of the OMP Metadata of the monitoring program and some plots of oyster growth and mortality