1
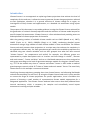
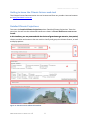
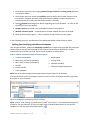
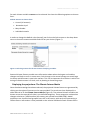
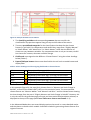
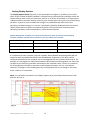
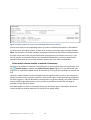
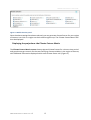
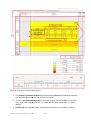
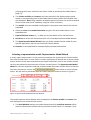
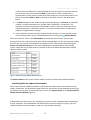
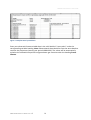
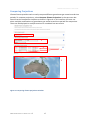
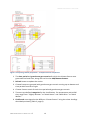
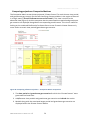
CLIMATE FUTURES TOOL
USER GUIDE
NRM Climate Futures: User Guide
NRM Climate Futures User Guide - Full v1
8
2
NRM Climate Futures: User Guide
Table of Contents
Introduction ....................................................................................................................... 4
Getting to know the Climate Futures web-tool .................................................................... 5
Detailed Climate Projections ............................................................................................... 5
Setting the classifying variables and seasons ................................................................................................................ 7
Displaying the projections: The Climate Futures Matrix............................................................................................ 8
Setting Display Options ..................................................................................................................................................... 10
Select which climate models to exclude if necessary .............................................................................................. 11
Displaying the projections: the Climate Futures Matrix ......................................................................................... 12
Selecting a representative model: Representative Model Wizard ...................................................................... 14
Exporting Data for Impact Assessments ...................................................................................................................... 15
Comparing Projections ...................................................................................................... 17
Add/Remove experiments and target periods........................................................................................................... 18
Comparing projections: multiple matrices.................................................................................................................. 18
Comparing projections: Composite Matrices............................................................................................................. 20
Glossary of Terms ............................................................................................................. 21
References ........................................................................................................................ 24
NRM Climate Futures User Guide - Full v1
8
3
NRM Climate Futures: User Guide
Introduction
Climate Futures is a new approach to exploring climate projections that reduces the level of
complexity for the end-user. It allows the user to generate climate change projections tailored
to their application, whether it is a general overview of climate change for a region, an
investigation of likely threats and opportunities, or a detailed risk assessment using impact
models.
The purpose of this document is to provide guidance in using the Climate Futures web-tool for
the generation of national climate projections and the selection of climate model output for
specific impact/risk assessments. Climate Futures is a free web-based tool providing access to
and exploration of climate projections for Australia.
With the growing number of available climate models such as CMIP3 (Meehl et al., 2007),
CMIP5 (Taylor et al., 2011), CORDEX (Giorgi et al., 2009), conducting detailed impact
assessments using a large number of these climate models is often not feasible. The Climate
Futures web-tool presents these projections in a unique way that reduces the complexity in
an application-relevant way. For each greenhouse gas scenario the available projections are
classified using two climate variables and are then grouped into what has been termed
“climate futures”. For temperature and rainfall, for example, the different groups are
represented by simple descriptions such as “warmer and little change in rainfall”, “warmer
and much wetter”, “hotter and drier” and so on. Likelihood statements are then assigned to
each group according to the level of agreement amongst models for the given climate future,
e.g. 75 % of the models may show a “warmer and wetter” future in 2055 under a medium
greenhouse gas scenario, while 25 % show a “hotter and much wetter” future. The most likely
climate future in this example is warmer and wetter.
Classifying climate projections, grouping them into climate futures, and allocating likelihoods
reduces the complexity for end-users. By using the Climate Futures web-tool it is also possible
to narrow the range of climate projections for specific applications, since it facilitates the
process of choosing a small number of representative climate models appropriate for a
designated application. The Climate Futures web-tool also ensures that data produced have
internal consistency, which is necessary for complex and scientifically sound impact
assessments involving multiple variables.
NRM Climate Futures User Guide - Full v1
8
4
NRM Climate Futures: User Guide
Getting to know the Climate Futures web-tool
The Climate Futures Demonstration site can be accessed from any modern internet browser
at: http://iav-devel.it.csiro.au
Detailed Climate Projections
To access the Detailed Climate Projections select ‘Detailed Climate Projections’ from the
menu bar. You will see the advanced interface as shown in Error! Reference source not
found..
In this interface, you are presented with the choice of greenhouse gas scenario, time period,
climate variables and seasons that are used to classify and group the climate futures, as well
as display options.
Figure A: Climate Futures Advanced interface.
NRM Climate Futures User Guide - Full v1
8
5
NRM Climate Futures: User Guide
NRM Climate Futures User Guide - Full v1
8
6
NRM Climate Futures: User Guide
1. Drop-down menus for selecting a greenhouse gas scenario and time period (defaults
are A1B and 2030).
2. Drop-down menus to select the classifiers used to define the climate futures matrix:
two climate variables and their associated seasons (default climate variables are
temperature and rainfall, and the default season is annual).
3. Blue
buttons providing more details regarding the input variables – or refer to the
Glossary of Terms on page 24.
4. Display options to create a more detailed Climate Futures Matrix.
5. Models selection panel – to decide which climate models you want to exclude.
6. Map of the Australia regions – click to explore climate futures for the region.
In the following sections, the features of the Advanced Mode are described in detail.
Setting the classifying variables and seasons
Two climate variables, called the classifying variables, are required to generate the projected
climate futures that will be displayed in the Climate Futures Matrix. By default, surface
temperature and rainfall are used. There are 10 variables to choose from:
Table A: Climate variables available in Climate Futures
•
•
•
Surface Temperature
Max. Daily Surface Temperature
Min. Daily Surface Temperature
•
•
Wind speed
Strong Wind
Relative Humidity
•
•
•
Rainfall
Heavy Rainfall
•
Potential Evapotranspiration
•
Solar Radiation
Note: Not all models and greenhouse gas scenarios have data for all variables.
Click on the arrow on the drop down menu to see a list of the 10 climate variables (Figure B)
then click on your selection:
Figure B: Selecting the classifying climate variables.
Note: “Heavy” and “Strong” are defined as the 99th percentile, i.e. the heaviest/strongest 1%
of events. See the Glossary of Terms on page 24 for a detailed description of the climate
variables or click the blue information button .
NRM Climate Futures User Guide - Full v1
8
7
NRM Climate Futures: User Guide
For each climate variable a season can be selected. You have the following options to choose
from:
Table B: Seasons to choose from
•
Annual (all seasons)
•
November-April
•
May-October
•
Individual months
In order to change the default value (annual) just click on the little arrows on the drop down
menu to show the seasons available and click on your choice (Figure C).
Figure C: Selecting seasons for the two chosen classifying variables.
Seasonal climate futures provide more information about when the largest and smallest
changes are likely to occur. In some cases, little change in the annual average can mask large
increases and decreases in particular seasons. This can be important for activities in which the
timing of climatic events is critical, such as planting or harvesting crops.
Displaying the projections: The Climate Futures Matrix
Once the above settings have been selected, the projected climate futures are generated by
clicking on the region of interest on the map provided. The results are then displayed in a
table referred to as the Climate Futures Matrix (Figure D). The selected climate variables are
shown across the top and left sides in pre-defined categories. These categories are based on
changes relative to a 1990 baseline (the twenty-year period from 1980-1999). Model
projections are classified and grouped into cells in the matrix, with each cell representing a
climate future. Information is also provided on the relative likelihood of each climate future.
NRM Climate Futures User Guide - Full v1
8
8
NRM Climate Futures: User Guide
Figure D: Example Climate Futures Matrix.
1. The classifying variables and corresponding seasons that are used for the
classification of projections appear along the top and left sides of the matrix.
2. There are pre-defined categories for the classification that describe the climate
futures (in grid cells). For temperature and rainfall they range from “Slightly Warmer”
to “Much Hotter” and “Much Drier” to “Much Wetter”. Note that the division of
classes can vary between variables. For temperature there is only an increase; rainfall
has classes for increase, decrease and little change.
3. Likelihoods are assigned to the different “climate futures” using the colour shadings
below (Table C).
4. Expand/Collapse buttons show more detail within the cell such as model names and
display data.
Table C: Colour shadings used for assigning likelihoods to climate futures
Nil
Very low
Low
Moderate
High
Very high
Not projected by any models
Projected by up to 10% of the models
Projected by more than 10%, up to 33% of the models
Projected by more than 33%, up to 66% of the models
Projected by more than 66%, up to 90% of the models
Projected by more than 90% of the models
In this example (Figure D), the most likely climate future is “Warmer and Little Change in
Rainfall”, as most of the models (66 %) fall into this particular future. The most extreme
climate futures are “Warmer Wetter” and “Warmer and Drier” and the climate future showing
the least change from the past is “Slightly Warmer and Little Change in Rainfall”. However, this
is only the case for the greenhouse gas scenario and time period that have been selected, as
displayed at the top of the page (See Error! Reference source not found.: 1-4).
In the Advanced Mode there are several display options that result in a more detailed results
and the chance to decide which models should be included in generating climate futures for a
region of interest.
NRM Climate Futures User Guide - Full v1
8
9
NRM Climate Futures: User Guide
Setting Display Options
The display options panel (Figure E) in the advanced view (Figure A: 4) allows you to select
which of the climate variables available in Climate Futures you would like to display within the
climate futures matrix. You can select one, several, or all of the 10 variables. It is important to
understand which variables ‘belong’ within a given climate future for a given pair of classifying
variables. In general, only variables that change in a predictable way when one of the
classifying variables changes (i.e. that are ‘correlated’) should be displayed within the matrix.
Table D shows which variables correspond with each of the three most commonly used
classifying variables, surface temperature, rainfall and wind speed.
Table D: Appropriate variables to use with each of the three most commonly used classifying
variables. Variables marked with an asterisk (*) will not always be correlated.
Surface Temperature
Rainfall
Wind Speed
Maximum Temperature
Heavy Rainfall*
Strong Wind*
Minimum Temperature
Solar Radiation
Evaporation
Relative Humidity
It is important to note, however, that the variables, Heavy Rainfall and Strong Wind will not
always be well correlated with Rainfall and Wind Speed, respectively. The nature of the
relationship between these variables can be investigated with the climate futures matrix. For
example, to investigate the relationship between Wind Speed and Strong Wind, set these two
variables as the classifying variables and examine the resultant matrix. If there is a tendency
for Strong Wind to increase or decrease as Wind Speed increases, there is a correlation.
However, if changes in one variable generally correspond to little or no change in the other,
there is little or no correlation.
Note: If no variables are ticked in the Display options panel, the climate futures matrix will
look the same as in
, page 9.
NRM Climate Futures User Guide - Full v1
8
10
NRM Climate Futures: User Guide
Figure E: Display options to create a more detailed climate futures matrix.
You can also choose a corresponding season of interest. Detailed information is available for
the whole year, individual months, as well as for seasons: November-April and May-October.
Note: This selection of climate variables and seasons affects the information displayed within
the cells of the matrix but not the classification of projections into Climate Futures (i.e. you
will still see the same climate futures and associated likelihoods). It merely provides more
detailed information for the climate variables chosen when the cells are expanded.
Select which climate models to exclude if necessary
By default, all models are selected. To exclude one or more models from the projections, click
the
expand button to display the model selection panel (Figure F), in the advanced view
(Figure A: 5). Individual models can be de-selected by clicking on the tick-boxes to remove the
tick.
However, models should only be excluded if there are good reasons to do so, for example if a
model has been shown to perform poorly in a particular region. When generating projections
for these regions, it may be desirable to exclude them. In general though, the climate futures
matrix should be generated with as many models as possible to ensure the full range of
possible climate futures is shown.
Excluded models can be re-included by clicking the tick-boxes again. Information about the
climate model can also be obtained by clicking on the model name.
NRM Climate Futures User Guide - Full v1
8
11
NRM Climate Futures: User Guide
Figure F: Model selection panel.
Once the above settings have been selected, you can generate climate futures for your region
of interest. Just click on a region on the Australia region map. The Climate Futures Matrix will
then be displayed.
Displaying the projections: the Climate Futures Matrix
The Climate Futures Matrix screen shows projected climate futures for a chosen time period
and greenhouse gas scenario for the two classifying climate variables in the region of interest,
with additional information displayed within each climate future cell. (Figure G).
NRM Climate Futures User Guide - Full v1
8
12
NRM Climate Futures: User Guide
Figure G: An example climate futures
utures matrix.
1. The classifying climate variables and corresponding seasons that you have selected
are found along the top and left sides of the matrix.
2. There are pre-defined categories for the classification. For temperature and rainfall
they range from “Slightly Warmer” to “Much Hotter” and “Much Drier” to “Much
Wetter”.
3. Likelihoods are assigned to each climate future based on the number of models
NRM Climate Futures User Guide - Full v1
8
13
NRM Climate Futures: User Guide
projecting this future, and these are colour-coded as previously described (Table C,
page 13).
4. The climate variables and seasons you have selected in the display options panel
appear in corresponding cells in the climate futures matrix when the individual cells
are expanded. Note: Large numbers of display options will cause the results to extend
off the screen and can be viewed by using the screen scroll bars.
5. The models you have included are displayed in the output matrix when the cells are
expanded.
6. Values for mean and standard deviation are given for each climate future in the
expanded cells.
7. Expand/Collapse buttons (+ / -) allow you to view details of the climate future.
8. Check box to select this climate future for use in the Representative Model Wizard.
9. The Representative Model Wizard helps you find a suitable climate model for your
specific application. See the next section for further details.
10. Statistics of all model data for selected display variables and seasons.
Selecting a representative model: Representative Model Wizard
In many impact assessments it is not practical to evaluate the impacts for all climate models
from each climate future. In such cases it is often appropriate to identify two or three climate
futures that are of the most relevance to the impact assessment. One or two climate models
can then be selected to represent each of these climate futures. The Representative Model
Wizard is a tool for objectively selecting a climate model from each climate future of interest.
To access this feature, click on the
button within a certain climate
future. You will then be presented with the model selection wizard as shown in Figure H:
Figure H: Representative Model Selection Wizard.
The model selection wizard displays each combination of climate variable and season that
was displayed in the climate futures matrix.
1. The Rank Method settings are used to determine which statistical measure will be
used to evaluate each model within a particular climate future. For example, if you
NRM Climate Futures User Guide - Full v1
8
14
NRM Climate Futures: User Guide
wish to select a model that is representative of the mid-range of a particular sub-set,
you should set the rank method to Mean. If you wish to select a model that is
representative of the upper or lower end of the range of a certain climate future, set
the rank method to Max or Min by clicking on the little arrows in the drop-down
boxes.
2. The Rank settings can be used to assign relative weightings or priorities to individual
variable - season combinations (if variable field is expanded – see point 3). For
example, if surface temperature in November to April is the most important for an
impact assessment, it would be ranked 1. The other variable-season combinations
would be assigned lower rankings.
3. Rank methods and rank priorities are grouped by variable. For finer grained control
each variable/season can be ranked separately by selecting the
expand button.
Once you are done, click on the Rank button at the bottom (not shown). You are then
presented with the ranked results for your chosen settings (Figure I). You see that each model
that fell into your chosen climate future is assigned a score. The climate model having the
lowest score (at the top) depicts the most representative model based on your ranking
criteria. Note that only models that can provide all of the variables selected under Display
Options will be ranked.
Figure I: Representative Model Wizard output.
The Export button next to each climate model and score can be used to download data.
Exporting Data for Impact Assessments
Once representative models have been selected for the climate futures of relevance to the
impact assessment, the projected change values for that model can be obtained directly from
the Climate Futures tool. To export data, just click on the Export button in the Representative
Model Selection Wizard (Figure I).
A download menu then opens up, providing the option to save a template Excel spreadsheet
to your computer. This spreadsheet will look similar to the one shown in Figure J (you will
need to adjust the column widths in order to view the data correctly).
NRM Climate Futures User Guide - Full v1
8
15
NRM Climate Futures: User Guide
Figure J: Template Excel spreadsheet.
Enter your observed climate variable data in the cells labelled “<insert obs>” under the
corresponding variable heading. Note: Observational data should be from the same baseline
used for the projections (twenty year period 1980-1999). The values will be automatically
scaled to the selected time period and greenhouse gas scenario under the heading Future
Climate.
NRM Climate Futures User Guide - Full v1
8
16
NRM Climate Futures: User Guide
Comparing Projections
Climate Futures provides tools to easily compare different greenhouse gas scenarios and time
periods. To compare projections, select Compare Climate Projections in the top menu bar.
You will see the comparison interface as shown in Figure K. In this interface, the user can
select multiple combinations of greenhouse gas scenarios and time periods for comparison.
These can be displayed as multiple matrices or combined into one matrix.
1
2
3
4
5
Figure K: Comparing climate projections window.
NRM Climate Futures User Guide - Full v1
8
17
NRM Climate Futures: User Guide
1. Drop-down menu to select comparison method (multiple or composite).
2. Drop-down menus to select the classifying variables used to define the climate
futures matrix: two climate variables and their associated season (default climate
variables are temperature and rainfall, and the default season is annual).
3. Drop down menus for selecting a greenhouse gas scenario and time period (defaults
are A1B and 2030).
4. Red circular Add/Remove buttons to determine target periods (greenhouse gas
scenario and time period).
5. Map of the Australia regions – click to explore climate futures.
Add/Remove experiments and target periods
Up to nine target periods and greenhouse gas scenarios can be added for comparison via the
Add button. Once the above settings have been selected, you can compare climate futures for
your region of interest. Just click on a region on the Australia region map. Depending on the
comparison method chosen you will be presented with either the Multiple Matrices (Figure L)
or a Composite Matrix (Figure M).
Note: Changes displayed in both the composite matrix and the multiple matrices are relative
to the period 1980 – 1999.
Comparing projections: multiple matrices
The Multiple Matrices screen (Figure L) shows projected climate futures for each chosen time
period and greenhouse gas scenario for the two classifying climate variables in the region of
interest. These are smaller versions of the full matrix view (Figure G) and only show the
spread of model results, and no model names or variable results can be obtained from this
view. This view can be used to quickly view how a climate projection changes over time or
how projections vary under different greenhouse gas scenarios. .
NRM Climate Futures User Guide - Full v1
8
18
NRM Climate Futures: User Guide
Figure L: Comparing climate projections – multiple matrices comparison.
1. The time period and greenhouse gas scenarios for which the climate futures were
generated are listed here, along with red circular Add/Remove buttons.
2. Refresh button to update the results.
3. Climate futures are grouped with greenhouse gas scenario running top to bottom and
time periods from left to right.
4. Climate Futures matrix for each time period and greenhouse gas scenario
5. There are pre-defined categories for the classification. For temperature and rainfall
they range from: “Slightly Warmer” to “Much Hotter” and “Much Drier” to “Much
Wetter”.
6. Likelihoods are assigned to the different “climate futures” using the colour shadings
described previously (Table C, page 9).
NRM Climate Futures User Guide - Full v1
8
19
NRM Climate Futures: User Guide
Comparing projections: Composite Matrices
The Composite Matrix screen shows projected “climate futures” for each chosen time period,
and greenhouse gas scenario for the two classifying climate variables in the region of interest
in a single matrix. (Error! Reference source not found.). This view is similar to the
advanced view (Figure J) with the exception that the associated time period and greenhouse
gas scenario are displayed alongside the corresponding model names. This view is useful for
looking at the combined likelihood of a climate future to see if certain climate futures only
occur under at certain time periods/greenhouse gas scenario.
Figure M: Comparing Climate Projections – Composite Matrix Comparison
1. The time period and greenhouse gas scenarios for which the “climate futures” were
generated are listed here.
2. Add/Remove time periods and greenhouse gas scenarios and refresh the results.
3. Models along with the associated target period and greenhouse gas scenario are
displayed within the Climate Futures Matrix.
NRM Climate Futures User Guide - Full v1
8
20
NRM Climate Futures: User Guide
Glossary of Terms
Throughout this Workbook and Climate Futures, you will encounter a number of terms. The
following terms are common to all three user modes.
Climate Future
A Climate Future is the description of a plausible future climate, both qualitative (for example:
warmer and wetter) and quantitative (for example: 10 of 18 models agree), as described by
the combination of two climate variables, for a particular time period and greenhouse gas
scenario. Climate futures can be assigned an indicative likelihood rating based on the
proportion of climate models that fall within the climate future. In Basic Mode, climate
futures are always described by the combination of annual-average surface temperature
change and annual-average rainfall change. In Advanced Mode, these variables can be
modified.
Climate variables
Surface temperature
Units of
change
°C
Maximum temperature
°C
Minimum temperature
°C
Rainfall
Heavy rainfall
%*
%*
Dry days
Relative humidity
%*
%*
Potential evapotranspiration
%*
Solar radiation
%*
Wind speed
%*
Strong wind
%*
Variable
Notes
Mean temperature as measured at 2 m above the
ground
Mean daily maximum temperature as measured at
2 m above the ground
Mean daily minimum temperature as measured at
2 m above the ground
Mean rainfall
99th percentile mean daily rainfall: equivalent to the
average of the four wettest days in a year, two
wettest days in 6-months, etc.
Mean number of days with <1 mm rainfall
Mean relative humidity as measured at 2 m above the
ground
Wet Areal Potential Evapotranspiration calculated
according to Morton (1983)
Surface downward shortwave radiation (equivalent to
‘global radiation’): a commonly used measure in
agriculture and energy applications.
Mean wind speed, calculated from eastward and
northward components at 10 m above the ground
99th percentile mean daily wind speed: equivalent to
the average of the four windiest days in a year, two
windiest days in 6-months, etc..
* Actual values may also be displayed if desired
Greenhouse Gas Scenario
Climate Futures provides projections based on the climate models used for the
Intergovernmental Panel on Climate Change’s Fourth Assessment Report (AR4) as well as
those that will be used for the Fifth Assessment Report (AR5) due for release in 2015.
Projections based on the AR4 models (also called the CMIP3 models) can be generated for
three greenhouse gas scenarios as described below (for further information, see the Special
Report on Greenhouse gas scenarios (Nakićenović and Swart, 2000; sometimes called the
SRES). Note that projections based on the AR5 models (CMIP5) use a new set of future
NRM Climate Futures User Guide - Full v1
8
21
NRM Climate Futures: User Guide
greenhouse gas concentration scenarios called Representative Concentration Pathways (refer
to the glossary entry for more detail).
A1B
The A1B greenhouse gas scenario is a specific case within the A1 scenario. The
A1 storyline describes a future world of very rapid economic growth, a global population
that peaks in mid-century and declines thereafter, and the rapid introduction of new
and more efficient technologies. Major underlying themes are convergence among
regions, capacity building and increased cultural and social interactions, with a
substantial reduction in regional differences in per capita income. The A1 storyline
develops into three scenario groups that describe alternative directions of technological
change in the energy system. They are distinguished by their technological emphasis:
fossil intensive (A1FI), non-fossil energy sources and technologies (A1T), or a balance
across all sources (A1B) (where balanced is defined as not relying too heavily on one
particular energy source, on the assumption that similar improvement rates apply to all
energy supply and end use technologies).
B1
The B1 storyline describes a convergent world with the same global population
as in the A1 storyline (one that peaks in midcentury and declines thereafter) but with
rapid change in economic structures toward a service and information economy, with
reductions in material intensity and the introduction of clean and resource efficient
technologies. The emphasis is on global solutions to economic, social and environmental
sustainability, including improved equity, but without additional climate initiatives.
A2
The A2 storyline describes a very heterogeneous world. The underlying theme
is self reliance and preservation of local identities. Fertility patterns across regions
converge very slowly, which results in continuously increasing population. Economic
development is primarily regionally oriented and per capita economic growth and
technological change more fragmented and slower than other storylines.
Key Climate Futures
A subset of the projected climate futures for a given location, classifying variables, time-period
and greenhouse gas scenario that are the most important for decision making. These are
usually described as “Best Case”, “Worst Case” and “Most Likely Case”. See also Climate
Future.
The following ‘key climate futures’, which are often relevant to risk assessments, are referred
to in the Advanced user training.
Most Likely Case
Of the climate futures projected (for a given location, classifying variables, time period
and greenhouse gas scenario), the Most Likely Climate Future is that represented by the
greatest number of climate models. It must be remembered, however that the climate
that does eventuate could lie outside the range of climates projected by any of the
climate models used in Climate Futures.
Least Change Case
Of the climate futures projected (for a given location, classifying variables, time period
and greenhouse gas scenario), the Least Change Climate Future is that which is closest
to the current (1980 – 1999) climate in terms of the selected variables.
NRM Climate Futures User Guide - Full v1
8
22
NRM Climate Futures: User Guide
Best Case
Of the climate futures projected (for a given location, classifying variables, time period
and greenhouse gas scenario), the Best Case climate future is that which would result in
the most positive (or least negative) impacts on the system being assessed. For
example, in an assessment of the possible impacts of changing climate on mosquitoborne diseases, the climate future with the least increase in temperature and a
decrease (or least increase) in rainfall is likely to represent the Best Case. Choosing the
Best Case climate future requires a good understanding of the system being studied.
Worst Case
Of the climate futures projected for a given time period and greenhouse gas scenario,
the Worst Case Climate Future is that which would result in the most negative (or least
positive) impacts on the system being assessed. For example, in an assessment of the
possible impacts of changing climate on mosquito-borne diseases, the climate future
with the greatest increase in temperature and the greatest increase (or least decrease)
in rainfall is likely to represent the Worst Case. Choosing the Worst Case climate future
requires a good understanding of the system being studied.
Lower Likelihood, Potentially High Impact
Of the climate futures projected for a given time period and greenhouse gas scenario
the lower likelihood potentially high impact are the largest changes in temperature and
rainfall that are projected. These could represent a best case and/or a worst case
depending on the impacts on the system being assessed.
Representative Concentration Pathways
Climate Futures provides projections based on the climate models used for the
Intergovernmental Panel on Climate Change’s Fourth Assessment Report (AR4) as well as
those that will be used for the Fifth Assessment Report (AR5) due for release in 2015.
Projections based on the AR4 models (also called the CMIP3 models) can be generated for
three greenhouse gas scenarios (for more detail see the Greenhouse gas scenarios glossary
entry above). Projections based on the AR5 models (CMIP5) use a new set of future
greenhouse gas concentration scenarios called Representative Concentration Pathways, or
RCPs.
The Representative Concentration Pathways (RCP) are based on selected scenarios from four
modelling teams working on integrated assessment modelling, climate modelling, and
modelling and analysis of impacts (Vuuren et al. 2011). Unlike the earlier (SRES) greenhouse
gas scenarios, the RCPs are not new, fully integrated scenarios (i.e., they are not a complete
package of socioeconomic, greenhouse gas, and climate projections). They are consistent sets
of projections of only the components of radiative forcing (the change in the balance between
incoming and outgoing radiation to the atmosphere caused primarily by changes in
atmospheric composition) that are meant to serve as input for climate modelling.
Conceptually, the process begins with pathways of radiative forcing, not detailed
socioeconomic narratives or scenarios. Central to the process is the concept that any single
radiative forcing pathway can result from a diverse range of socioeconomic and technological
development scenarios. Four RCPs were selected, defined and named according to their total
NRM Climate Futures User Guide - Full v1
8
23
NRM Climate Futures: User Guide
radiative forcing in 2100 (see table below).
RCP 8.5
Rising radiative forcing pathway leading to 8.5 W/m² in 2100.
RCP 6
Stabilization without overshoot pathway to 6 W/m² at stabilization after
2100
RCP 4.5
Stabilization without overshoot pathway to 4.5 W/m² at stabilization after
2100
RCP 2.6
Peak in radiative forcing at ~ 3 W/m² before 2100 and decline
Of these, Climate Futures provides projections for RCP4.5 and RCP 8.5.
Time Period
Climate Futures allows you to explore projections for up to 13 future time periods, in 10 year
increments from 2030 to 2090, depending on the greenhouse gas scenario selected.
References
CSIRO and Australian Bureau of Meteorology (2007): Climate Change in Australia. Technical
Report, www.climatechangeinaustralia.gov.au/technical_report.php, accessed 25/05/2011
Giorgi F, Jones C and Asrar GR (2009) Addressing climate information needs at the regional
level: the CORDEX framework. WMO Bulletin 58(3), 175-183.
Meehl GA, Boer GJ, Covey C, Latif M and Stouffer RJ (2000) The Coupled Model
Intercomparison Project (CMIP). Bulletin of the American Meteorological Society 81(2), 313318.
Morton FI (1983): Operational estimates of areal evapotranspiration and their significance to
the science and practice of hydrology, Journal of Hydrology 66, 1-76.
Nakićenović N, Swart R (2000) (Ed.): Special Report on Greenhouse gas Scenarios. A Special
Report of Working Group III of the Intergovernmental Panel on Climate Change, Cambridge
University Press: Cambridge, United Kingdom and New York, NY, USA.
Taylor KE, Stouffer RJ and Meehl GA (2011) An Overview of CMIP5 and the Experiment Design.
Bulletin of the American Meteorological Society 93(4), 485-498.
Australia (2011): Climate Change in the Australia, www.Australiaclimatechangescience.org,
available in November 2011, accessed 25/05/2011.
Vuuren DP, Edmonds J, Kainuma M, Riahi K, Thomson A, Hibbard K, Hurtt GC, Kram T, Krey V,
Lamarque J-F, Masui T, Meinshausen M, Nakicenovic N, Smith SJ and Rose SK (2011) The
representative concentration pathways: an overview. Climatic Change 109(1-2), 5-31.
NRM Climate Futures User Guide - Full v1
8
24