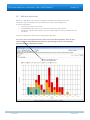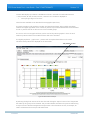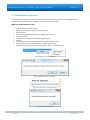
1
PCS Clinical Audit Tool – User Guide
Version 3.4
PART 2
FUNCTIONALITY
PCS Clinical Audit Tool – User Guide – Part 2 FUNCTIONALITY
Version 3.4
Company Contacts
Sydney (Head Office)
Pen Computer Systems
Level 1, 35 Moore St
Document Contact
Contact:
Project Officer
LEICHHARDT NSW 2040
Phone: +61 2 9506 3200
Fax:
+61 2 9566 1182
Email:
[email protected]
Web:
www.pencs.com.au
Christine Chidgey
Phone:
+61 3 9866 8477
Email:
[email protected]
Melbourne Office
Pen Computer Systems
Level 5
434 St Kilda Rd
MELBOURNE VIC 3004
Phone: +61 3 9866 8477
Fax:
+61 3 9866 5699
13 June 2012
PAGE 2 of 83
PCS Clinical Audit Tool – User Guide – Part 2 FUNCTIONALITY
Version 3.4
Document Control
Version
0-1
0-2
1-1
Date
26/02/2007
08/03/2007
13/03/2007
Modified By
Christine Chidgey
John Johnson
Christine Chidgey
Description
Initial
Review and Comment
Add Appendices for Conditions and Medications Mappings
1-2
1-3
1-4
1-5
1.6
25/07/2007
07/08/2007
24/09/2007
24/09/2007
01/03/2008
Christine Chidgey
Christine Chidgey
Christine Chidgey
Christine Chidgey
Christine Chidgey
Updates for revised functionality and screens
Add Cardiovascular Risk Calculator
Updates for revised functionality and screens
Update version number to match chm file
Additional information included in various sections
Add Home Medicine Review
Updates to Appendices
1.7
23/06/2008
Christine Chidgey
2.0
2.1
2.1.1
26/06/2008
26/06/2008
01/09/2008
John Johnston
Tarkan Shahho
Christine Chidgey
2.1.2
2.2.1
04/09/2008
14/10/2008
Christine Chidgey
Christine Chidgey
2.3.1
09/12/2008
Christine Chidgey
2.4
17/02/2009
Christine Chidgey
Updates to HMR for 0 meds
Updates for Version 2 release
Reviewed
Reviewed
Updates for new functionality
Immunisations
Data Summary Report
Cross Tabulation Report
Add revised screen shots for new functions
Updates for NPI Reports 2008-09
Clarification of BP results
Updates for version 2.3 release and in particular to
1) add a Results Date filter
2) provide ability to save filter criteria
3) improve Diabetes SIP graphs
The CAT User Guide has been split into 2 parts – this is Part 2
which covers the functionality of the application.
Updates for the APCC Report.
2.4.1
2.4.2
2.5
26/03/2009
27/04/2009
20/05/2009
Christine Chidgey
Christine Chidgey
Christine Chidgey
45-49 Check MBS 717 added for MD/Pracsoft3 users
Pap Smear Summary Report Card
The CAT User Guide Appendices B, C and D have been split
out into separate documents. These Appendices cover the
Clinical Desktop System data mappings for Medical Director,
Best Practice and Genie respectively.
Waist, BSLF (renamed FBG) graphs added
MBS Items graph added for MD/Pracsoft3 users
Additional Mental Health conditions and medications added
to Disease and Medications graphs. Refer to appendices for
mappings.
13 June 2012
PAGE 3 of 83
PCS Clinical Audit Tool – User Guide – Part 2 FUNCTIONALITY
2.5.1
22/06/2009
Christine Chidgey
2.5.2
08/07/2009
Christine Chidgey
Version 3.4
Updates for new CV Risk Calculator
Updates for new logos on screens
Rename BSLF graph to FBG (Fasting Blood Glucose)
Appendix E has been added as a separate document
covering the Clinical Desktop System Zedmed data
mappings.
2.5.3
06/08/2009
Christine Chidgey
Update MBS 45-59 Linkages Reports to 2008/09 FY
MBS Items not recorded graph added for MD/Pracsoft3
users
Update support information
2.6
29/09/2009
Christine Chidgey
Group some existing tabs to reduce scrolling
• Measures tab – contains BMI, Weight, BP
• Pathology tab – contains Lipids, eGFR, MALB, HbA1c,
FGB
Updates to General Filter selections
Add Alcohol
ACR graph has been replaced by MALB
eGFR calculation has been changed
Additional MBS Items have been added for MD/Pracsoft3
users
Condition Drug Abuse has been added
NPI CDM3 report has been amended in line with DoHA (BP
cut-off of <=130/80)
QAIHC Indicators report added for MD users
2.7
26/11/2009
Christine Chidgey
New conditions added to filter and APCC Reporting:
•
Peripheral Vascular Disease
•
Carotid Stenosis
•
Renal Artery Stenosis
•
Chronic Renal Failure
Immunisation chart for Swine flu
2.7.1
2.8
13 June 2012
15/12/2009
09/02/2010
Christine Chidgey
Christine Chidgey
Fix typo in CV Event Risk age range
Update document template.
Updates for new functionality: Tools menu option, Select All
report option, Age bracket changes, Diabetes SIP worksheet
improvements.
PAGE 4 of 83
PCS Clinical Audit Tool – User Guide – Part 2 FUNCTIONALITY
Version 3.4
2.9
17/05/2010
Christine Chidgey
Charts – ACR, INR added
Condition Atrial Fibrillation added
MBS Item changes (45-49 tab has been removed)
Timeline functionality
‘Send Data To’ functionality
2.9.2
01/07/2010
Christine Chidgey
Update the Ethnicity filter to include ‘Not Recorded’
2.10
6/09/2010
Christine Chidgey
QAIHC Report is available for MD and BP users
Filters – General: add Medicare Number, Conditions: add
extra Mental Health, Medications: add extra Mental Health
and Respiratory
Graphs – add Spirometry
Send Data To – an additional email option is available
Saved Filters – can set a default to be preloaded
2.11
04/01/2011
Christine Chidgey
Rename Gardasil Immunisation to HPV
Update the ACR graph information
Add practix compatibility
2.12
27/07/2011
Christine Chidgey
Add Communicare compatibility
Add Medinet compatibility
Updates for APCC revised screens
New filters for last visit, activity, postcode and suburb
Condition: Gestational Diabetes added
Medication: Dabigatran added
3.1
02/11/2011
Christine Chidgey
New ‘Screening’ tab – this includes subtabs for the screening
of Cervical and Colorectal (Cancer: Pap Smear and FOBT
respectively.
The Pap Smear tab is unchanged but has been moved under
the ‘Screening’ tab.
MBS Items added at 1st Nov 2011 for GP Mental Health
Careplan (2700, 2701, 2715, 2717)
MBS Item 11506 for Respiratory added
NT AHKPI report is available for all users and can be
submitted to the Improvement Foundation portal.
3.2
13 June 2012
24/11/2011
Christine Chidgey
National KPI report is available for all users and can be
submitted to the Improvement Foundation portal.
The IF data submission has moved to the main menu (from
the APCC Report)
Immunisations > Childhood Schedule has been added
PAGE 5 of 83
PCS Clinical Audit Tool – User Guide – Part 2 FUNCTIONALITY
3.3
14/02/2012
Christine Chidgey
Version 3.4
HMR tab has been removed. The ‘Medications per Patient’
graph is now under the Medications tab.
Filters for musculoskeletal conditions and medications have
been added.
Additional Pain Relief medications have been added.
New graphs/reports:
Medications > Medications Not Printed in Last 6mths
Musculoskeletal Risk Factors
The Communicare Patient Status flag has been added to the
General filter tab (Communicare Users only).
3.3.1
27/02/2012
Christine Chidgey
Data Quality tab providing a Clinical Data Self-Assessment
(CDSA) tool funded by NEHTA – comprises of a suite of
graphs and reports relating to data completeness
3.3.2
28/03/2012
Christine Chidgey
3.4
13/06/2012
Christine Chidgey
Patient name filter
Patient Report for individual measures
Extracting additional patients to meet reporting requirements
– refer under ‘Reports’ section
Patient status filter
13 June 2012
PAGE 6 of 83
PCS Clinical Audit Tool – User Guide – Part 2 FUNCTIONALITY
Version 3.4
Contents
COMPANY CONTACTS ............................................................................................................................................................. 2
Sydney (Head Office) ..................................................................................................................................................... 2
Melbourne Office .......................................................................................................................................................... 2
DOCUMENT CONTACT ............................................................................................................................................................ 2
DOCUMENT CONTROL ............................................................................................................................................................ 3
1
INTRODUCTION ....................................................................................................................................................10
1.1
1.2
1.3
1.4
1.5
CLINICAL AUDIT TOOL (CAT) ..................................................................................................................................... 10
USER GUIDE ........................................................................................................................................................... 10
NOTES ABOUT THIS USER GUIDE ................................................................................................................................. 11
DEFINITIONS, ACRONYMS AND ABBREVIATIONS .............................................................................................................. 11
RELATED DOCUMENTS .............................................................................................................................................. 12
2
SYSTEM REQUIREMENTS, INSTALLATION AND CONFIGURATION .........................................................................12
3
CAT USER INTERFACE ...........................................................................................................................................13
3.1
4
COLLECTING DATA SETS .......................................................................................................................................14
4.1
4.2
4.3
5
NAVIGATING THE CAT USER INTERFACE ....................................................................................................................... 13
WHAT DATA IS COLLECTED ......................................................................................................................................... 15
HOW IS THE DATA STORED ......................................................................................................................................... 15
EXISTING DATA SET COMPATIBILITY WITH CHANGES TO CAT ............................................................................................. 15
DATA FILTERING ...................................................................................................................................................16
5.1
DATA FILTERING OVERVIEW ....................................................................................................................................... 16
5.2
CHANGING FILTERS .................................................................................................................................................. 17
5.3
CLEARING FILTERS .................................................................................................................................................... 17
5.4
DEMOGRAPHIC FILTERING ......................................................................................................................................... 18
5.4.1
Demographic Filter Mappings with Clinical systems ................................................................................... 20
5.5
MEDICAL CONDITIONS FILTERING ................................................................................................................................ 20
5.5.1
Medical Conditions Filter Mappings with Clinical systems.......................................................................... 20
5.5.2
Pregnancy ................................................................................................................................................... 21
5.6
MEDICATIONS FILTERING ........................................................................................................................................... 21
5.6.1
Medications Filter Mappings with Clinical systems .................................................................................... 21
5.7
RESULTS FILTERING .................................................................................................................................................. 22
5.8
PATIENT NAME FILTERING ......................................................................................................................................... 22
5.9
PATIENT STATUS FILTERING........................................................................................................................................ 23
5.10 PROVIDER FILTERING ................................................................................................................................................ 23
5.10.1 Method of assigning a patient to a provider .............................................................................................. 23
5.11 SAVING FILTER CRITERIA............................................................................................................................................ 24
5.11.1 Creating a New Filter Name ........................................................................................................................ 24
5.11.2 Loading existing filters ................................................................................................................................ 26
5.11.3 Setting a default filter ................................................................................................................................. 27
6
ANALYSING A DATA SET .......................................................................................................................................28
6.1
DATA SET RESULTS OVERVIEW ................................................................................................................................... 28
13 June 2012
PAGE 7 of 83
PCS Clinical Audit Tool – User Guide – Part 2 FUNCTIONALITY
Version 3.4
6.2
DATA SET RESULTS GRAPHS AND REPORTS ................................................................................................................... 30
6.2.1
Demographics (and Bar Chart functions) .................................................................................................... 32
6.2.1.1
6.2.2
6.2.3
6.2.4
6.2.4.1
6.2.5
6.2.5.1
6.2.6
6.2.6.1
6.2.7
6.2.7.1
6.2.8
6.2.8.1
6.2.9
6.2.9.1
6.2.10
6.2.11
6.2.11.1
6.2.11.2
6.2.12
6.2.13
6.2.13.1
6.2.14
6.2.14.1
6.2.15
6.2.15.1
6.2.16
6.2.16.1
6.2.17
6.2.17.1
6.2.18
6.2.18.1
6.2.19
6.2.19.1
6.2.20
6.2.20.1
6.2.21
6.2.21.1
6.2.22
6.2.22.1
6.2.23
6.2.23.1
6.2.24
6.2.24.1
6.2.24.2
6.2.24.3
6.2.24.4
6.2.25
13 June 2012
Reidentify Report ...................................................................................................................................................... 35
Data Quality ................................................................................................................................................ 36
Patient Report ............................................................................................................................................. 37
Allergies (and Pie Chart functions) .............................................................................................................. 38
Allergies Mappings with Clinical systems .................................................................................................................. 40
Smoking ....................................................................................................................................................... 41
Smoking Mappings with Clinical systems .................................................................................................................. 41
Alcohol ........................................................................................................................................................ 41
Alcohol Mappings with Clinical systems ................................................................................................................... 41
BMI (Body Mass Index) ............................................................................................................................... 42
BMI Mappings with Clinical systems ......................................................................................................................... 43
Waist ........................................................................................................................................................... 43
Waist Mappings with Clinical systems ...................................................................................................................... 43
Disease ........................................................................................................................................................ 44
Disease Mappings with Clinical systems ................................................................................................................... 45
Screening (Cancer) ...................................................................................................................................... 45
Screening > Pap Smear ................................................................................................................................ 46
Pap Smear Mappings with Clinical systems .......................................................................................................... 46
Pap Smear Summary Report Card ........................................................................................................................ 46
Screening > Mammogram........................................................................................................................... 47
Screening > FOBT ........................................................................................................................................ 47
FOBT Mappings with Clinical systems................................................................................................................... 47
Lipids ........................................................................................................................................................... 48
Lipids Mappings with Clinical systems .................................................................................................................. 48
eGFR (Estimated Glomerular Filtration Rate) ............................................................................................. 49
eGFR Mappings with Clinical systems ................................................................................................................... 49
MALB (Microalbumin) ................................................................................................................................. 49
MALB Mappings with Clinical systems.................................................................................................................. 49
ACR (Microalbumin Creatinine Ratio) ......................................................................................................... 50
ACR Mappings with Clinical systems..................................................................................................................... 50
HBA1c .......................................................................................................................................................... 50
HbA1c Mappings with Clinical systems................................................................................................................. 50
BP (Blood Pressure) ..................................................................................................................................... 51
BP Mappings with Clinical systems ....................................................................................................................... 51
FBG (Fasting Blood Glucose) ....................................................................................................................... 51
FBG Mappings with Clinical systems..................................................................................................................... 51
INR (International Normalised Ratio).......................................................................................................... 51
INR Mappings with Clinical systems ..................................................................................................................... 51
Spirometry ................................................................................................................................................... 52
Spirometry Mappings with Clinical systems ......................................................................................................... 52
Medications................................................................................................................................................. 53
Medications Mappings with Clinical systems ....................................................................................................... 53
Diabetes SIP (Service Incentive Payment) Items ......................................................................................... 54
Cycle of Care by Item ............................................................................................................................................ 55
Cycle of Care by Patient ........................................................................................................................................ 55
The Diabetes SIP Worksheet................................................................................................................................. 56
Diabetes SIP Mappings with Clinical systems ....................................................................................................... 56
CKD (Chronic Kidney Disease) Management ............................................................................................... 57
PAGE 8 of 83
PCS Clinical Audit Tool – User Guide – Part 2 FUNCTIONALITY
6.2.26
6.2.27
6.2.28
6.2.28.1
6.2.29
7
Version 3.4
Musculoskeletal .......................................................................................................................................... 57
CV (Cardiovascular) Event Risk .................................................................................................................... 58
Immunisations............................................................................................................................................. 62
Immunisations Mappings with Clinical systems ................................................................................................... 62
MBS Items ................................................................................................................................................... 63
REPORTS ..............................................................................................................................................................65
7.1
STANDARD REPORTS................................................................................................................................................. 65
7.1.1
APCC (Australia Primary Care Collaboratives) Report ................................................................................. 66
7.1.2
NPI (National Performance Indicators) Report ........................................................................................... 68
7.1.3
Summary Report Card ................................................................................................................................. 69
7.1.4
Mental Health (MH) Summary Report Card................................................................................................ 69
7.1.5
QAIHC Indicators Report ............................................................................................................................. 70
7.1.6
Healthy For Life Report ............................................................................................................................... 70
7.1.7
NT AHKPI Indicators Report ........................................................................................................................ 70
7.1.8
National KPI Indicators Report .................................................................................................................... 71
7.1.8.1
Collecting Additional Patients in CAT for Reporting .................................................................................................. 71
7.2
CROSS TABULATION REPORT ...................................................................................................................................... 72
7.2.1
Clearing Report Selections .......................................................................................................................... 73
8
HOW TO IMPROVE DATA QUALITY USING CAT ....................................................................................................74
8.1
8.2
8.3
8.4
8.5
9
PATIENTS WITH NO DATE OF BIRTH ............................................................................................................................. 74
PATIENTS WITH NO GENDER....................................................................................................................................... 74
PATIENTS WITH NO ALLERGY STATUS RECORDED ............................................................................................................. 74
PATIENTS WITH NO SMOKING STATUS RECORDED ........................................................................................................... 74
PATIENTS WITH INCORRECT DIABETES CODING ............................................................................................................... 75
TIMELINE..............................................................................................................................................................76
10
10.1
10.2
11
‘SEND DATA TO’ FUNCTION ..............................................................................................................................77
CONFIGURING LOCATIONS.......................................................................................................................................... 77
SENDING DATA TO A LOCATION ................................................................................................................................... 80
CAT TOOLS MENU ............................................................................................................................................81
APPENDIX A1 - GENIE DATA COLLECTION .................................................................................................................... 82
APPENDIX A2 – PRACTIX DATA COLLECTION ................................................................................................................82
APPENDIX A3 – MEDINET DATA COLLECTION ..............................................................................................................82
APPENDIX B – MEDICAL DIRECTOR DATA CATEGORY MAPPINGS ................................................................................83
APPENDIX C – BEST PRACTICE DATA CATEGORY MAPPINGS ........................................................................................83
APPENDIX D – GENIE DATA CATEGORY MAPPINGS......................................................................................................83
APPENDIX E – ZEDMED DATA CATEGORY MAPPINGS ..................................................................................................83
APPENDIX F – PRACTIX DATA CATEGORY MAPPINGS ..................................................................................................83
APPENDIX G – COMMUNICARE DATA CATEGORY MAPPINGS ......................................................................................83
APPENDIX H – MEDINET DATA CATEGORY MAPPINGS ................................................................................................83
13 June 2012
PAGE 9 of 83
PCS Clinical Audit Tool – User Guide – Part 2 FUNCTIONALITY
Version 3.4
1 INTRODUCTION
1.1 Clinical Audit Tool (CAT)
The Clinical Audit Tool (CAT) analyses clinical information from GP Clinical Desktop Systems. It
translates data into real statistical and graphical information that is easy to understand and action.
This allows practitioners to assess and improve the quality and completeness of patient information.
The benefit to the practice is to assist with its ongoing accreditation and provide opportunities to
grow practice income. The emphasis of the tool is to help practice staff to take specific action to
improve patient coverage in chronic disease management and prevention.
Other benefits of CAT are many and include:
• targeting patients with particular needs
• targeting patients with specific health risk profiles
• improved compliance with statistical data collections
• extracting data to meet the needs of others
• meeting reporting requirements
Statistics that are required for the Australia Primary Care Collaboratives (APCC) program and the
DoHA Future Directions Key Performance Indicators for Divisions are a by-product of the use of the
system.
1.2 User Guide
The purpose of this document is to provide instructions on how to install and use the functionality
provided by the CAT.
This manual is split into 2 parts:
Part 1: Installation and Configuration including how to collect data sets
Part 2: Functionality
13 June 2012
PAGE 10 of 83
PCS Clinical Audit Tool – User Guide – Part 2 FUNCTIONALITY
Version 3.4
1.3 Notes about this User Guide
•
•
•
•
•
•
•
This User Guide describes the use of the PCS Clinical Audit Tool with reference to the following clinical
systems:
Medical Director: Health Communications Network – Medical Director ™ Clinical Desktop System
Best Practice: the Clinical Desktop System produced by Best Practice Software
Genie: the Clinical Desktop System produced by Genie Solutions
Zedmed: the Clinical Desktop System produced by Zedmed Medical Software Solutions
practiX: the Clinical Desktop System produced by iSoft
Communicare the Clinical Desktop System produced by Communicare Systems
Medinet: the Clinical Desktop System produced by Abaki
There are other Clinical Desktop Systems that may interoperate with the PCS Clinical Audit Tool in the
future and additions will be made to this User Guide when they are available.
1.4 Definitions, acronyms and abbreviations
Term
ACR
APCC
ATSI
BMI
BP
BP
BSLF
CAT
CHD
COPD
CV
Description
Microalbumin Creatinine Ratio
Australian Primary Care Collaboratives
Aboriginal Torres Strait Islander
Body Mass Index
Blood Pressure
Best Practice
Blood Sugar Level (Fasting) – more commonly called FBG
Clinical Audit Tool
Coronary Heart Disease
Chronic Obstructive Pulmonary Disease
Cardiovascular
CVD
DoHA
DVA
FBG
eGFR
HbA1c
HDL
HMR
IF
LDL
MD
NEHTA
NPCC
NPI
NVDPA
PCS
Cardiovascular Disease
Department of Health and Ageing
Department Veteran Affairs
Fasting Blood Glucose
Estimated Glomerular Filtration Rate
Haemoglobin A1c
High-density Lipoproteins
Home Medicine Review
Improvement Foundation
Low-density Lipoprotein
Medical Director
National E-Health Transition Authority
National Primary Care Collaboratives
National Performance Indicators
National Vascular Disease Prevention Alliance
Pen Computer Systems
13 June 2012
PAGE 11 of 83
PCS Clinical Audit Tool – User Guide – Part 2 FUNCTIONALITY
QAIHC
RACGP
SIP
Version 3.4
Queensland Aboriginal and Islander Health Council
Royal Australian College of General Practitioners
Service Incentive Payment
1.5 Related Documents
‘PCS Clinical Audit Tool – User Guide Part 1 – Installation and Configuration’
This User Guide provides instructions on how to use install and configure CAT.
This guide is available from
http://help.pencs.com.au/cat.htm
2 SYSTEM REQUIREMENTS, INSTALLATION AND CONFIGURATION
These sections are included in the ‘PCS Clinical Audit - User Guide Part 1 – Installation and
Configuration’.
13 June 2012
PAGE 12 of 83
PCS Clinical Audit Tool – User Guide – Part 2 FUNCTIONALITY
Version 3.4
3 CAT USER INTERFACE
Once the CAT software has been installed it is available from your Programs List.
• Click Start > All Programs > Pen Computer Systems > PCS Clinical Audit
• Enter your Account name and Authorisation key and click ‘OK’.
3.1 Navigating the CAT User Interface
Click the ‘View Extracts’ and the ‘View Filter’ buttons to display all the areas of the CAT user interface.
The screen is divided into 3 sections (Figure 3.1A):
• Data Snap-shots (or Extracts) collected for analysis (Left Hand Panel)
• Data Filters (Top Right Panel)
• Data Reports (Bottom Right Panel)
It is handy to be able to hide the data collection and data filter areas of the screen in order to make
best use of your screen space to view the data results. You can toggle between the View/Hide modes
at any time. Once you have logged in the screen below will display.
You will see the population figure is initially 0 because you have not yet collected data from your
clinical desktop system or loaded an existing extract file.
Figure 3.1A CAT User Interface
13 June 2012
PAGE 13 of 83
PCS Clinical Audit Tool – User Guide – Part 2 FUNCTIONALITY
Version 3.4
4 COLLECTING DATA SETS
NOTE:
Before you start collecting data sets ensure you have set up your preferences to point to the
correct clinical desktop system for your practice. (See ‘Setting Your Preferences’ for details about
how to do this.)
A data set is collected by clicking the ‘Collect’ button at the top left of the screen.
Once you click the ‘Collect’ button you will see the ‘status bar’ in the top right hand corner of the
screen flashing while the data is retrieved from the clinical desktop system.
•
Genie, practiX and Medinet users please note that the data collection is performed from
within your clinical application. Clicking the CAT ‘Collect’ button at the top left of the screen
will provide you with the summary steps on how this is done within your clinical application.
Step by step details are provided in the Appendices-A section of the Mappings document for
your clinical system.
The data set collected is saved in your preferred data folder (see ‘Setting Your Preferences’ for more
information).
When the data retrieval has completed you will see an entry in the left hand column (Click the ‘View
Extracts’ button if the column is not visible). The data is stored as a ‘snap-shot’ on your PC. You can
use this ‘snap-shot’ for analysis at any time in the future.
The data set will be loaded automatically if the collection has occurred within CAT. Genie, practiX and
Medinet user will need to click on the required data set to load it.
Tip: To refresh the list of ‘snap-shots’ toggle the Hide/View Extracts button.
‘Collect’ button
Status bar
Data set snap-shot
Figure 4A Collecting Data Sets
13 June 2012
PAGE 14 of 83
PCS Clinical Audit Tool – User Guide – Part 2 FUNCTIONALITY
Version 3.4
Figure 4B Data set entries
Each entry displays the date/time of collection, the number of records retrieved and the machine
name on which the collection was done (Figure 4B).
You can collect as many data sets as you wish over time. Each data set will be listed as an entry in the
left hand column.
To analyse a specific data set click on the entry for that data set. It will become highlighted and you
will see the ‘status bar’ in the top right hand corner of the screen flashing while the data is reloaded
from the ‘snap-shot’ into Clinical Audit.
4.1 What data is collected
Data is only collected for patients who are active in your Clinical system. Data for patients who are
deceased or have been made inactive is not collected unless it is required for reporting and the
practice has set this option on (available MD/BP only).
This means when you are analysing your data using CAT you are only seeing patients who are
currently marked as active in your Clinical system. You may find patients in CAT that you know are no
longer active at your practice. If you inactivate them in your Clinical system they will be excluded from
future data collections.
4.2 How is the data stored
The collect saves 2 xml data files to your preferred data folder. One file is pure Clinical data and has no
identifiable patient information. This is called the DATA file. The other file is the LINK file and contains
all the patient identifiable data. The LINK file is only used when you want to re-identify a list of
patients that make up a segment of a graph.
In your preferred data folder the files look like this (Figure 4.2A):
Figure 4.2A Data set XML file
4.3 Existing data set compatibility with changes to CAT
CAT version 2 has new filters and reports. Additional data is collected by version 2 for these new
functions. Your CAT version 1 extracts will not have the additional data needed to make these
functions work.
You can load up your version 1 extracts and analyse them as before - the new functionality will
inactivated for these extracts by being greyed out.
13 June 2012
PAGE 15 of 83
PCS Clinical Audit Tool – User Guide – Part 2 FUNCTIONALITY
Version 3.4
5 DATA FILTERING
5.1 Data Filtering Overview
Data can be filtered so that you can view graphs and reports for specific criteria.
The data filters are organised into a series of tabs:
• General (Demographics)
• Conditions (Medical)
• Medications
• Results
• Patient Name
• Providers
Another tab is provided for you to save your selected filter criteria:
• Saved Filters
To filter the data simply select the criteria you require to look at. This is usually done by ticking
selection boxes. The criteria you have selected will be displayed at the top of the Results panel. They
will be displayed even if you hide the filter panel.
Click ‘Recalculate’. You will see the ‘status bar’ in the top right hand corner of the screen flashing
while the filtered data is reloaded from the ‘snap-shot’ into Clinical Audit. This will limit your data to
look at only patients that match all the conditions ticked.
Example:
‘Filter By’ displays the criteria selected (eg. Male, Diabetes Type II, Aspirin)
Figure 5.1A Filtering example
Examples for each of the filter types are provided in the following sections.
13 June 2012
PAGE 16 of 83
PCS Clinical Audit Tool – User Guide – Part 2 FUNCTIONALITY
Version 3.4
5.2 Changing Filters
When you make changes to the filters the new selections do not become effective in the Reports until
you have clicked the ‘Recalculate’ button.
•
The ‘Recalculate’ button will turn red when the filter text has changed but the button has not
been clicked
•
If the ‘Recalculate’ button has not be clicked the correct previous filter text will display on any
printed graphs and reports
5.3 Clearing Filters
To clear filters that have been selected either:
•
Click the ‘Clear Filters’ button in the top right hand corner of the screen to clear all your filters.
The ‘Clear Filters’ dialogue box will appear.
Note: This dialogue box is also used to clear any Report Selections that have been made.
Refer to the ‘Cross Tabulation Report’ for details on this functionality.
The ‘Clear all Filter Selections’ will be pre-ticked. Click ‘OK’ to continue.
•
Click the ‘Clear …’ button at the bottom right hand corner of each tab to clear only the filters
for that tab.
NOTE:
Make sure you click ‘Recalculate’ when you have changed the filters.
13 June 2012
PAGE 17 of 83
PCS Clinical Audit Tool – User Guide – Part 2 FUNCTIONALITY
Version 3.4
5.4 Demographic Filtering
Figure 5.4a Demographic Filters
Patient data can be filtered as follows:
Gender
Male
Female
Other
No selection = All
Note: Ticking multiple boxes will create an OR criteria ie. Male OR Female.
Ethnicity
ATSI (Aboriginal Torres Strait Islander)
non ATSI
Not Recorded
No selection = All
Note: Ticking multiple boxes will create an OR criteria ie. ATSI OR non ATSI
DVA
DVA (Department Veteran Affairs)
non DVA
No selection = All
Age
1. Enter a numeric start age or end age to limit your selection
Choose Years (default) or Months as your search filter for start/end age.
[Note: choosing Months will display the Demographics graph in months.]
2. No Age ticked will search for patients with a missing date of birth
13 June 2012
Health
Cover
Medicare No. Recorded
Medicare No. Not Recorded
No selection = All
Status
A drop-down list of Communcare Patient Status flags
(Communicare Users only)
PAGE 18 of 83
PCS Clinical Audit Tool – User Guide – Part 2 FUNCTIONALITY
Last Visit
Version 3.4
The last visit date is the most recent date a patient contact has been recorded.
In Medical Director this is deemed to be the date of the most recent progress note.
Check the ‘General Data Mappings’ Appendices for each Clinical system.
Values for selection are:
• Any = the last visit was at any time (all patients will be selected)
• None = no last visit is recorded
• <15 mths = has visited in the last 15 months
• <30 mths = has visited in the last 30 months
• Date Range with from/to date selection = only patients whose most recent
visit occurred within a period of time. Patients with a visit after the ‘to
date’ will be excluded.
The ‘Date Range’ filter – to note:
The ‘Date Range’ filter cannot be used to retrospectively look at the data in a
‘snap-shot’. The ‘snap-shot’ is only valid for the point in time at which it was taken.
For example: If you filter on last visit between 1 and 2 years ago you will be
excluding patients you have had a visit more recently. These patients may or may
not have had a visit in the period of time you are selecting. You will not be
selecting all patients who visited within that period.
Activity
Activity is how often a patient visits the practice.
Values for selection are:
• Active = has had 3 visits in the last 2 years (RACGP definition)
• Not Active = a patient not meeting the RACGP definition of active
And/Or
• (Number of ) Visits in the last 6 mths
• Has not visited in the last X mths where X can be selected
Postcode
Enter a 4 digit postcode (you can use * as a wildcard) or
Multiple postcodes can be entered separated by a comma
This filter allows you to select whether the list of postcodes is for
• Include in the filter
Patients matching a postcode in the list will be selected
• Exclude from the filter
Patients matching a postcode will not be selected
The Exclude option allows practices to find patients that do not reside in their local
area and may be transient.
Suburb
13 June 2012
Enter a suburb
The same options as for postcode apply to suburb.
PAGE 19 of 83
PCS Clinical Audit Tool – User Guide – Part 2 FUNCTIONALITY
Version 3.4
5.4.1 Demographic Filter Mappings with Clinical systems
The demographic filter mappings are provided in the ‘General Data Mappings’ Appendices for each
Clinical system.
5.5 Medical Conditions Filtering
Conditions are divided into 3 tabs to allow for a greater number of conditions to be selected. These
are
• Conditions – Chronic
• Conditions – Mental Health
• Conditions - Other
Figure 5.5A Medical Conditions Filtering
Selecting Conditions by ticking the boxes will limit your data to look at only patients that match all the
conditions ticked:
Condition – Yes, No, no selection = All
You can select to filter by patients that
• Have a condition (tick the Yes box)
• Do not have a condition (tick the No box)
If you tick one of the main condition headings (bolded) the sub-heading selections will not be
available and all patients matching that broad condition category will be selected.
5.5.1 Medical Conditions Filter Mappings with Clinical systems
The conditions filter mappings are provided in the ‘Conditions Data Mappings’ Appendices for each
Clinical system.
Note that some conditions are flagged as true for a patient if the patient has ever had the condition
ie. the condition forms part of the patient history but is not currently listed as active (eg. heart
disease). Check the appendix for your Clinical system for details about how different conditions are
collected.
13 June 2012
PAGE 20 of 83
PCS Clinical Audit Tool – User Guide – Part 2 FUNCTIONALITY
5.5.2
Version 3.4
Pregnancy
Pregnancy is included under the Conditions > Other filter. Ticking this as ‘Yes’ will give you a list of the
patients who are currently flagged as pregnant in the Clinical System. Check the appendix for your
Clinical system for details about how this is checked.
5.6 Medications Filtering
Medications are divided into 3 tabs to allow for a greater number of medications to be selected. These
are
• Medications – Heart
• Medications - Respiratory
• Medications – Other
Figure 5.6B Medications – Heart Filtering
Selecting Medications by ticking the boxes Yes or No will limit your data to look at only patients that
match the medication status selected:
Medication – Yes, No, no selection = All
You can select to filter by patients that
• Have a current medication (tick the Yes box)
• Do not have a current medication (tick the No box)
If you tick one of the main medication headings (bolded) the sub-heading selections will not be
available and all patients matching that broad medication category will be selected.
5.6.1 Medications Filter Mappings with Clinical systems
The medications filter mappings are provided in the ‘Medications Data Mappings’ Appendices for
each Clinical system.
Medications are flagged as true if they are on the patient’s current medication list. The collection
process does not make any decisions about whether a medication should actually have been removed
from the current medication list. The GP is responsible for making sure the list of medications is
accurate.
13 June 2012
PAGE 21 of 83
PCS Clinical Audit Tool – User Guide – Part 2 FUNCTIONALITY
Version 3.4
5.7 Results Filtering
Figure 5.7A Results Filtering
This filter allows the user to view the last recorded result that falls within a specified time period or
date range. It is also applied to the MBS Items.
By selecting a date range of
• <= 6mths
• <=12 mths
• <=24 mths
• User defined range
the user can filter out results that have not been measured within the selected period.
Results outside the selected period are treated as ‘Not recorded’.
This will give a more meaningful picture for charts like HbA1c where old results are really not relevant.
The filter is only applicable to some charts. Where the filter has been applied the chart title will include
the selected period.
For example,
5.8
Patient Name Filtering
The patient name filter allows you to search by first name and/or surname text
13 June 2012
PAGE 22 of 83
PCS Clinical Audit Tool – User Guide – Part 2 FUNCTIONALITY
Version 3.4
5.9 Patient Status Filtering
This filter will only have available options if your extract contains patients that are archived or
deceased. Refer to the ‘CAT Extracting Additional Patients Quick Reference Guide’ available at
http://help.pencs.com.au/cat.htm for information about this functionality.
5.10 Provider Filtering
The provider filter allows you to filter patients by provider. This allows providers within your practice
to drill down to their own patients.
The provider filter tab displays a list of the practice clinicians with a provider number. You can filter by
• Practice – all providers are ticked
• One or more providers – tick those you wish to filter on and un-tick the ‘No Assigned
Provider’ box
• No Assigned Provider – to find patients that are not assigned to any provider
Providers with No Patients
There may be providers in your database that are not attached to any patients. For example, this can
occur in MD when a patient is imported from another practice and the providers attached to the
patient are imported as well to keep the patient history complete.
Providers with no patients attached to them are hidden by default. The checkbox ‘Hide Providers with
No Patients’ defaults to ticked.
• To see all Providers un-tick this box.
Figure 5.9A Provider Filtering
5.10.1 Method of assigning a patient to a provider
The method of Assigned Provider determination is provided in the ‘Assigned Providers’ Appendix for
each Clinical application.
13 June 2012
PAGE 23 of 83
PCS Clinical Audit Tool – User Guide – Part 2 FUNCTIONALITY
Version 3.4
5.11 Saving Filter Criteria
The ‘Saved Filters’ tab allows a set of filter criteria to be saved as a named search. Saved search names
can be reloaded at a later time and run. This gives the ability for practices to run the same filters over
intervals of time and compare results.
A saved filter can also be set as a default so it will be automatically loaded when CAT opens.
Figure 5.10A Saved Filters tab
5.11.1 Creating a New Filter Name
Initially the ‘Saved Filters’ tab will be empty. To create a filter:
•
•
Select some filter options eg. Active Patient with Diabetes
The ‘Save New Filter’ button will become available (Figure 5.10.1A)
Figure 5.10.1A Save New Filter button
•
•
13 June 2012
Click the ‘Save New Filter’ button
The ‘Filter Details’ dialogue box will open
• The filter options you have selected will be shown in the filter Description (Figure
5.10.1B)
PAGE 24 of 83
PCS Clinical Audit Tool – User Guide – Part 2 FUNCTIONALITY
Version 3.4
Figure 5.10.1B Filter Details - Description
•
Fill in the ‘Filter Name’ (Figure 5.10.1C)
Figure 5.10.1C Filter Details – Filter Name entry
•
•
Click ‘OK’
The new filter name will now be listed on the ‘Saved Filters’ tab (Figure 5.10.1D)
Figure 5.10.1D Saved Filters tab with new saved filter
The filter name can be changed using the ‘Edit’ button.
The filter can be deleted using the ‘Delete’ button.
13 June 2012
PAGE 25 of 83
PCS Clinical Audit Tool – User Guide – Part 2 FUNCTIONALITY
Version 3.4
5.11.2 Loading existing filters
To load a saved filter
• Click the ‘Saved Filters’ tab
• Click on the filter name required
• The filter details will be loaded into the other filter tabs and will display at the top of the
Results panel
• The ‘Recalculate button will turn red
Figure 5.10.2A Loading a saved filter
Click the ‘Recalculate’ button
13 June 2012
PAGE 26 of 83
PCS Clinical Audit Tool – User Guide – Part 2 FUNCTIONALITY
Version 3.4
5.11.3 Setting a default filter
A saved filter can also be set as a default so it will be automatically loaded when CAT opens.
•
From the ‘Default Filter’ drop-down list choose the filter you would like to have preloaded
Figure 5.10.3A Selecting a default filter
•
•
On reopening CAT the ‘Default Filter’ is preloaded
If you wish to clear the preloaded filter click the ‘Clear Filters’ button
Figure 5.10.3B The default filter is preloaded on opening CAT
13 June 2012
PAGE 27 of 83
PCS Clinical Audit Tool – User Guide – Part 2 FUNCTIONALITY
Version 3.4
6 ANALYSING A DATA SET
6.1 Data Set Results Overview
Once you have selected your data set snap-shot and your data filters click ‘Recalculate’. You will see
the ‘status bar’ in the top right hand corner of the screen flashing while the filtered data is reloaded
from the ‘snap-shot’ into Clinical Audit. Once this has finished you are ready to work with the data set
of patients that match all the conditions selected.
The data set for this exercise has 11795 patients and has been filtered on Gender = Female and
Condition = Asthma. 173 patients have been returned matching the filter (Figure 6.1A).
Example:
Total Patients , Filter , Selected Patients
Figure 6.1A Filtering a data set for analysis
13 June 2012
PAGE 28 of 83
PCS Clinical Audit Tool – User Guide – Part 2 FUNCTIONALITY
Version 3.4
Click the ‘View Pop.’ button at the top of the screen (Figure 6.1B) to get a list of the patients that have
been selected in this dataset. (Note this is the filtered dataset not the full dataset.)
Figure 6.1B View Pop button
This will pop up the Patient Reidentify Report with a list of patient details for the full filtered
population (Figure 6.1C). Use the
follow up, if required.
‘Export’ menu option to export the data to Excel format for
The far right column on the Population list will show you the patients last visit date.
Figure 6.1C Patient Re-identify Report for full filtered population
13 June 2012
PAGE 29 of 83
PCS Clinical Audit Tool – User Guide – Part 2 FUNCTIONALITY
Version 3.4
6.2 Data Set Results Graphs and Reports
Click the ‘Hide Extracts’ and ‘Hide Filter’ buttons to maximise the use of your screen for viewing
results.
The tabs along the top of the reports panel (Figure 6.2A) allow you to view various graphical
representations of your data set.
Figure 6.2A CAT Reports tabs
These are
• Demographics
• Data Quality (review patient data completeness and duplicate patients report)
• Allergies
• Smoking
• Alcohol
• Measures
o BMI (Body Mass Index),
o Waist
o BP (Blood Pressure)
• Pathology
o Lipids (includes Cholesterol, HDL, LDL, Triglycerides, Total Chol/HDL Ratio)
o eGFR (Estimated Glomerular Filtration Rate)
o ACR (Albumin Creatinine Ratio)
o MALB (Microalbumin)
o HBA1c
o FBG (Fasting Blood Glucose)
o INR (International Normalised Ratio)
• Disease (Count/Prevalence)
• Screening
o Pap Smear
o Mammogram
o FOBT
• Medications
o Count/Prevalence
o Medications per Patient
o Scripts Not Printed in Last 6mths
• Diabetes SIP (Service Incentive Payment) Items
• CKD Management
• Musculoskeletal
• CV (Cardiovascular) Event Risk
• Immunisations (includes Influenza, Swine flu, Pneumococcal, HPV, Pertussis, Child Schedule)
13 June 2012
PAGE 30 of 83
PCS Clinical Audit Tool – User Guide – Part 2 FUNCTIONALITY
•
Version 3.4
Standard Reports
o Indicator Sets
APCC (Australian Primary Care Collaboratives) Report
QAIHC Report
Healthy For Life
NT AHKPI
National KPI
o NPI (National Performance Indicators)
o Data Summary Report Cards
All views are of your filtered data set not your full data set except for the Indicator Sets Reports.
The Indicator Sets Reports will specify which population they are reporting on.
Some views are automatically filtered further to suit the data being represented. The graph header or
footer titles will specify the population that is displayed.
For example,
• Pap Smear and Mammogram – filters out gender=male
• CV Event Risk – filters out age = Non ATSI <45 or >74, ATSI <35 or >74,
condition=Cardiovascular disease (CVD)
• Immunisations > HPV – filters out gender=male and age<9
13 June 2012
PAGE 31 of 83
PCS Clinical Audit Tool – User Guide – Part 2 FUNCTIONALITY
Version 3.4
6.2.1 Demographics (and Bar Chart functions)
Demographics displays your data set as a breakdown of males/females and age group. The data is
displayed as a bar chart of the number of patients per age group. Age group defaults to years but can
be changed to months by selecting ‘Mths’ in the Age filter.
Choosing to view demographics in months allows children to be targeted.
Figure 6.2.1A Demographics Report
The bar chart report provides the following features:
• Select All checkbox
• Show Total Counts checkbox (only available where counts are not shown by default)
• Age bracket selection box (only available for bar charts grouped by age)
• Print button
• Export button
These are explained below.
13 June 2012
PAGE 32 of 83
PCS Clinical Audit Tool – User Guide – Part 2 FUNCTIONALITY
Version 3.4
Select All checkbox – click this checkbox to select all segments of the graph (legend is also selected)
Figure 6.2.1B Select All
Show Total Counts checkbox – click this checkbox to display the count in each group.
Figure 6.2.1C Show Total Counts
Age Bracket selection box – this allows you to select an age bracket value between 1 and 10 years.
The default value is 5 which displays ages grouped from 0-4, 5-9 etc. Changing this value, for example
to 10, would display as below. The change is effected immediately on the chart.
Figure 6.2.1D Age bracket selection
Print button – click the ‘Print’ button to print a copy of the graph.
Export button – this allows you to obtain a list of patients making up any segment of the bar chart. If
you click on any segment of the bar chart it will become highlighted and the ‘Export’ button in the
right hand corner of the results panel will become active. You can select more than one segment of
the graph (Figure 6.2.1E)
13 June 2012
PAGE 33 of 83
PCS Clinical Audit Tool – User Guide – Part 2 FUNCTIONALITY
Highlighted segment(s) of bar chart
Version 3.4
Export button active
Figure 6.2.1E Export Button
Click the ‘Export’ button to get a list of the patients that make up this group. (This works the same way
as the ‘View Pop.’ button except that you not looking at the filtered population but are drilling down
to a subset of it.)
This will pop up the Patient Reidentify Report with a list of patient details (Figure 6.2.1F). The specific
age value for each patient in the group selected will be provided in the last column.
Use the
‘Export’ menu option to export the data to Excel format for follow up, if required.
Figure 6.2.1F Patient Re-identify Report for selected report segments
13 June 2012
PAGE 34 of 83
PCS Clinical Audit Tool – User Guide – Part 2 FUNCTIONALITY
Version 3.4
6.2.1.1 Reidentify Report
The reidentify report allows you to identify a list of patient that make up
• the filtered population
• a segment of a pie or bar chart
The last column of the report will give you information specific to the graph you are looking at, for
example:
• population list will show you the patient last visit date
• demographics graph will show you age
• BMI graph will show you the BMI value
The ‘Refine Selection’ button lets you remove patients from the reidentified list for printing purposes.
This is helpful if you wish to target a small number of patients for follow up and only wish to print
those you are targeting:
• Click the ‘Refine Selection’ button (Figure 6.2.1.1A)
• From the pop-up list of patients untick those you do not wish to target
• Click OK (the reidentified list has removed the unticked patients)
Refine Selection button
Figure 6.2.1.1A Refine Selection button
13 June 2012
PAGE 35 of 83
PCS Clinical Audit Tool – User Guide – Part 2 FUNCTIONALITY
Version 3.4
6.2.2 Data Quality
The Clinical Data Self-Assessment (CDSA) Tool has been developed to report on the completeness of
patient demographic and health summary data within the general practice clinical system. It provides
the following reports:
•
‘Data Quality Dashboard’ Report to indicate the overall status of data quality based on the data
indicators.
•
‘Data Completeness’ Report to report the % of completeness for each data indicator.
•
‘Data Completeness Patient Graph’ to provide a graphical view of the data indicators and allow
•
‘Duplicate Patients Report’ to list patient records within the clinical system where a duplication is
re-identification of patients where data is missing.
suspected.
A Quick Reference Guide for this new tab is available with the CAT User Documentation at
http://help.pencs.com.au/cat.htm
13 June 2012
PAGE 36 of 83
PCS Clinical Audit Tool – User Guide – Part 2 FUNCTIONALITY
Version 3.4
6.2.3 Patient Report
This report details key health outcome measures for an individual patient.
•
Click the ‘Data Quality’ tab
•
Click the ‘Patient Data Report’ tab
•
A patient list matching the filter criteria you have selected will be displayed
o
20 patients per page will be displayed
o
Use the ‘Prev Page’ and ‘Next Page’ buttons to browse the list if it has more than 20
patients
•
Select the patient from list and click the ‘Patient Report’ button to display a report with the key
health outcome measures for this patient
The report is divided into 3 sections
o
Clinical Data Items
o
Medicare Items
o
Diabetes Care Plan Items (this section will only be displayed if the patient has a coded
diagnosis of Diabetes)
The patient report is designed to be able to be deidentified by hiding the patient name and data
values. The default settings are:
1) Patient name – this appears above the report and is not printed on the report
2) Data values – these are displayed as recorded/completed = yes/no ie. the data value details are
not displayed
Changing the report default display:
The ‘Show Name in Report’ button will toggle the name on in the report if you wish to have this
information printed.
The ‘Show Details in Report’ button will toggle the data values on in the report where they are
available if you wish to have this information printed.
13 June 2012
PAGE 37 of 83
PCS Clinical Audit Tool – User Guide – Part 2 FUNCTIONALITY
Version 3.4
6.2.4 Allergies (and Pie Chart functions)
Allergies displays your data as a breakdown of allergy status: Allergy Recorded, No Known Allergies,
Nothing Recorded. The data is displayed as a pie chart.
The patient count in each allergy status group is displayed for each segment of the pie chart.
Figure 6.2.4A Allergies Report
The report provides the following features:
• Select All checkbox
• Show Percentage checkbox
• Print button
• Export button
These are explained below
13 June 2012
PAGE 38 of 83
PCS Clinical Audit Tool – User Guide – Part 2 FUNCTIONALITY
Version 3.4
Select All checkbox – click this checkbox to select all segments of the graph (legend is also selected)
Figure 6.2.4B Select All
Show Percentage checkbox – click this checkbox to display the percentage in each group rather than
the count.
Figure 6.2.4C Show Percentage
Uncheck this checkbox to display count.
Print button – click the ‘Print’ button to print a copy of the graph.
Export button – if you click on any segment of the pie chart it will become highlighted and the
‘Export’ button in the right hand corner of the results panel will become active. You can select more
than one segment of the pie (Figure 6.2.4D).
13 June 2012
PAGE 39 of 83
PCS Clinical Audit Tool – User Guide – Part 2 FUNCTIONALITY
Highlighted segment of pie chart
Version 3.4
Export button active
Figure 6.2.2D Export Button
Click the ‘Export’ button to get a list of the patients that make up this group. (This works the same way
as the ‘View Pop.’ button except that you not looking at the filtered population but are drilling down
to a subset of it.)
This will pop up the Patient Reidentify Report with a list of patient details. The specific allergy value for
each patient in the group selected will be provided in the last column.
Use the
‘Export’ menu option to export the data to Excel format for follow up, if required.
6.2.4.1 Allergies Mappings with Clinical systems
The allergies mappings are provided in the ‘General Data Mappings’ Appendices for each Clinical
system.
13 June 2012
PAGE 40 of 83
PCS Clinical Audit Tool – User Guide – Part 2 FUNCTIONALITY
Version 3.4
6.2.5 Smoking
Smoking displays your data as a breakdown of smoking status: Daily Smoker, Irregular Smoker, Ex
Smoker, Never Smoked, Nothing Recorded. The data is displayed as a pie chart.
Functions available are as described for Allergies (Pie Chart).
6.2.5.1 Smoking Mappings with Clinical systems
The smoking mappings are provided in the ‘General Data Mappings’ Appendices for each Clinical
system.
6.2.6 Alcohol
Alcohol displays your data as a breakdown of alcohol status: Drinker, Non Drinker, Nothing Recorded.
The data is displayed as a pie chart.
Functions available are as described for Allergies (Pie Chart).
Alcohol level of risk is currently under discussion and will be added soon.
6.2.6.1 Alcohol Mappings with Clinical systems
The alcohol mappings are provided in the ‘General Data Mappings’ Appendices for each Clinical
system.
13 June 2012
PAGE 41 of 83
PCS Clinical Audit Tool – User Guide – Part 2 FUNCTIONALITY
Version 3.4
6.2.7 BMI (Body Mass Index)
Measures > BMI displays your data as a breakdown of BMI status: Morbid Obesity (40+),
Obese(30 to 40), Overweight(25 to 29.9), Healthy(18.5 to 24.9), Underweight(<18.5).
The data is displayed as
• Count per age range in a bar chart
• Average BMI per age range in a bar chart with the healthy range indicated
• Incomplete – where either of height, weight or height/weight are missing so BMI cannot be
calculated
Functions available are as described for Demographics (Bar Chart).
The ‘Count’ on the Count graph will show you the total of the patients graphed – this is the total
number of patients where BMI has been able to be calculated (Figure 6.2.7A). The Percentage
equivalent of Count is displayed in brackets.
Figure 6.2.7A BMI Count of patients where data is complete
13 June 2012
PAGE 42 of 83
PCS Clinical Audit Tool – User Guide – Part 2 FUNCTIONALITY
Version 3.4
6.2.7.1 BMI Mappings with Clinical systems
The BMI mappings are provided in the ‘General Data Mappings’ Appendices under Measurements for
each Clinical system.
6.2.8 Waist
Measures > Waist displays your data as a breakdown of risk status. The risk ranges differ depending
on whether you are measuring waist for risk of CVD or Diabetes. CAT provides 2 separate tabs:
• Waist > CVD Risk
• Waist > Diabetes Risk
Ranges:
CVD Risk
Male <93, 94-102, >102
Female <80, 80-88, >88
Diabetes Risk
Non ATSI Male < 102, 102-110, >110
Non ATSI Female <88, 88-100, >100
ATSI Male <90, 90-100, >100
ATSI Female <80, 80-90, >90
and No Waist Recorded.
Functions available are as described for Allergies (Pie Chart).
6.2.8.1 Waist Mappings with Clinical systems
The Waist mappings are provided in the ‘General Data Mappings’ Appendices under Measurements
for each Clinical application.
13 June 2012
PAGE 43 of 83
PCS Clinical Audit Tool – User Guide – Part 2 FUNCTIONALITY
Version 3.4
6.2.9 Disease
Disease is displayed as a count (the number of patients that have the disease) and the prevalence in
the population.
The Disease Prevalence is calculated by identifying the number of patients with a specific disease
diagnosis and expressing it as a percentage of the total population.
The disease categories are the same as the conditions provided in the conditions filter (except for
some Mental Health Conditions).
The data is displayed as:
• Count per condition in a bar chart
• Prevalence per condition as a percentage of this population in a bar chart
A bar is also provided on the chart for patients that have ‘None of these’ disease categories. This is
provided to assist practices in targeting patients for preventative care and miscoding.
Functions available are as described for Demographics (Bar Chart).
Figure 6.2.9A Disease Report
13 June 2012
PAGE 44 of 83
PCS Clinical Audit Tool – User Guide – Part 2 FUNCTIONALITY
Version 3.4
6.2.9.1 Disease Mappings with Clinical systems
The conditions (disease) mappings are provided in the ‘Conditions Data Mappings’ Appendices for
each Clinical system.
Note that some conditions are flagged as true for a patient if the patient has ever had the condition
ie. the condition forms part of the patient history but is not currently listed as active (eg. heart
disease). Check the appendix for your Clinical system for details about how different conditions are
collected.
6.2.10 Screening (Cancer)
General Practice Victoria has developed an electronic decision support (EDS) tool for the identification
of patients who meet the criteria for the screening of Cervical Cancer, Breast Cancer and Colorectal
Cancer. This tool will be available in early December 2011 via the PrimaryCare Sidebar® and will
provide point of care screening prompts for the three identified cancer screening groups and the
recording of screening details where those details are not held in the GP CIS (i.e. Mammogram date
and result).
CAT provides population based reporting for the tool under a new ‘Screening‘ tab which contains
three sub tabs for the various screening sections. These are:
•
Pap Smear
•
Mammogram (only available with compatible PrimaryCare Sidebar® functionality)
•
FOBT
Note: The Pap Smear tab is unchanged from the existing tab but has been moved under the new
‘Screening’ tab.
A Quick Reference Guide for this new tab is available with the CAT User Documentation at
http://help.pencs.com.au/cat.htm
13 June 2012
PAGE 45 of 83
PCS Clinical Audit Tool – User Guide – Part 2 FUNCTIONALITY
Version 3.4
6.2.11 Screening > Pap Smear
The pap smear tab automatically filters out the male population. The population figure displayed on
this tab is the number patients in your filtered dataset with gender female or other.
Pap Smear displays your data as a breakdown of:
• Pap Smear Recorded: Pap Smear Recorded, No Pap Smear Recorded, Ineligible*.
• Pap Smear Done Date (where Pap Smear Recorded): <1yr, 1-2yrs, 2-3yrs, 3-4yrs, >4yrs
and in a report format:
• Pap Smear Summary Report Card – this is explained below. This report is always derived from
your full dataset not you filtered dataset.
The data is displayed as a pie chart. Functions available are as described for Allergies (Pie Chart).
* The pap smear category of ‘Ineligible’ includes patients who are flagged in the clinical system as not
requiring a pap smear or who have a coded condition recorded that excludes them (eg.
hysterectomy). Check the pap smear mappings for your clinical system.
6.2.11.1 Pap Smear Mappings with Clinical systems
The pap smear mappings are provided in the ‘General Data Mappings’ Appendices for each Clinical
application.
6.2.11.2 Pap Smear Summary Report Card
The Pap Smear Summary Report Card is an initiative of the SA Cervix Screening Program (SACSP) to
improve the management of clinical information related to cervical screening and support increased
participation of women in screening.
It provides a report of eligible females aged 18-70, categorised by:
• Females with a last visit < 36 mths
• Active Females – Not pregnant, Pregnant and Total
Each category is broken down into subcategories by how long ago the last pap smear was recorded.
The subcategories match the pie chart breakdowns provided allowing patients for follow up to be
targeted.
• Not Recorded
• 4 years ago
• 3-4 years ago
• 2-3 years ago
• 1-2 years ago
• < 1 year ago
Within each subcategory there is a further breakdown by age range: 18-29, 30-39, 40-49, 50-59, 6070.
Total Count and Percentage is provided for each report line item.
• Percentage at the subcategory level is against the category total.
• Percentage at the age range level is against the subcategory total.
13 June 2012
PAGE 46 of 83
PCS Clinical Audit Tool – User Guide – Part 2 FUNCTIONALITY
Version 3.4
6.2.12 Screening > Mammogram
The Mammogram tab provides:
•
Mammogram Last Recorded
A pie chart displays the % of patients with a Mammogram Last Recorded in the following categories:
0-2 years, >2-3 years, >3-4 years,> 4 years, Not Recorded, Ineligible*.
Mammogram is recorded in the PrimaryCare Sidebar®. This graph will only display results if the PrimaryCare
Sidebar® is being used.
* The Mammogram category of ‘Ineligible’ includes patients that are no longer required to have an FOBT test
because they have a coded condition that implies exclusion. Check the mappings for your clinical system.
6.2.13 Screening > FOBT
The FOBT (Faecal occult blood test) tab provides 2 subtabs:
•
FOBT Last Recorded
A pie chart displays the % of patients with a FOBT Last Recorded in the following categories:
0-2 years, >2-3 years, >3-4 years,> 4 years, No FOBT Recorded, Ineligible*.
•
FOBT Orders and results
A pie chart displays the % of patients who are required to have an FOBT test (i.e. are not ineligible) and
have had an FOBT test order or result in the last 12 months in the following categories:
•
FOBT Order and result - an FOBT test result has been received in the last 12 months with an order
recorded within 6 months prior
•
FOBT Order only - an FOBT order has been recorded but no result has been received
•
FOBT Result only - an FOBT order has been received but no order is recorded
This graph allows the clinician to follow up patients who have had an order placed but where a result has
not been received.
* The FOBT category of ‘Ineligible’ includes patients that are no longer required to have an FOBT test because
they have a coded condition that implies exclusion. Check the mappings for your clinical system.
6.2.13.1 FOBT Mappings with Clinical systems
The FOBT smear mappings are provided in the ‘General Data Mappings’ Appendices for each Clinical
application.
13 June 2012
PAGE 47 of 83
PCS Clinical Audit Tool – User Guide – Part 2 FUNCTIONALITY
Version 3.4
6.2.14 Lipids
Pathology > Lipids displays your data as a breakdown of:
•
Cholesterol: <4.0, >4.0 and <=5.5, >5.5 and <=6.5, >6.5 and <=7.5, >7.5, No Cholesterol
Recorded.
•
HDL: <1.0, >1.0 and <=2.0, >2.0, No HDL Recorded
•
LDL: <2.5, >2.5 and <=4.0, >4.0, No LDL Recorded
•
Triglycerides: <2.0, >2.0 and <=4.0, >4.0, No Triglycerides Recorded
•
Total Chol/HDL Ratio: <3.5, >3.5 and <5.0, >5.0, No Total Chol/HDL Ratio Recorded
The data is displayed as a pie chart. Functions available are as described for Allergies (Pie Chart).
6.2.14.1 Lipids Mappings with Clinical systems
The lipids mappings are provided in the ‘General Data Mappings’ Appendices under Measurements
for each Clinical application.
If there are results for Cholesterol, HDL, LDL and/or Triglycerides then the most recent values will be
displayed. If there are results for HDL and cholesterol is recorded the most recent values will be used
by CAT to display the Chol/HDL ratio.
Where the LD results is missing CAT will calculate it if possible using the Friedewald equation:
LDL cholesterol (mmol/L) = total cholesterol - HDL cholesterol - triglyceride/2.2
13 June 2012
PAGE 48 of 83
PCS Clinical Audit Tool – User Guide – Part 2 FUNCTIONALITY
Version 3.4
6.2.15 eGFR (Estimated Glomerular Filtration Rate)
Pathology > eGFR displays your data as a breakdown of:
>100 = Normal
60-100mg/ml = Stage 1
30-60 mg/ml = Stage 2
15-30mg/ml = Stage 3
<=15mg/ml = Stage 4
No Data
eGFR (ml/min) is calculated using the MDRD revised formula from serum creatinine measurement (in
micromoles), age and gender. This formula is
The MDRD formula is for age >= 18.
For children the Schwartz equation is used:
GFR (mL/min/1.73 m2) = (0.41 x Height) / (Serum creatinine / 88))
The data is displayed as a pie chart. Functions available are as described for Allergies (Pie Chart).
6.2.15.1 eGFR Mappings with Clinical systems
The creatinine mappings are provided in the ‘General Data Mappings’ Appendices under
Measurements for each Clinical application.
6.2.16 MALB (Microalbumin)
Pathology > MALB displays your data as a breakdown of:
<= 15 mg/L
> 15 mg/L
No Data
The data is displayed as a pie chart. Functions available are as described for Allergies (Pie Chart).
6.2.16.1 MALB Mappings with Clinical systems
The microalbumin mappings are provided in the ‘General Data Mappings’ Appendices under
Measurements for each Clinical application
13 June 2012
PAGE 49 of 83
PCS Clinical Audit Tool – User Guide – Part 2 FUNCTIONALITY
Version 3.4
6.2.17 ACR (Microalbumin Creatinine Ratio)
Pathology > ACR displays your data as a breakdown of:
<= 2.5
2.5 – 3.5
> 3.5
No Data
ACR is either collected directly or is calculated as
ACR (mg/mmol) = microalbumin (mg/L) / urinary creatinine (mmol/L)
where microalbumin and urininary creatinine have the same date
The data is displayed as a pie chart. Functions available are as described for Allergies (Pie Chart).
6.2.17.1 ACR Mappings with Clinical systems
The ACR. microalbumin and urinary creatinine mappings are provided in the ‘General Data Mappings’
Appendices under Measurements for each Clinical application
6.2.18 HBA1c
Pathology > HBA1c displays your data as a breakdown of HBA1c status: <=7%, >7% and <=8%, >8%
and <10%, >=10%, No HBA1c Recorded. The data is displayed as a pie chart. Functions available are
as described for Allergies (Pie Chart).
6.2.18.1 HbA1c Mappings with Clinical systems
The HbA1c mappings are provided in the ‘General Data Mappings’ Appendices under Measurements
for each Clinical application.
13 June 2012
PAGE 50 of 83
PCS Clinical Audit Tool – User Guide – Part 2 FUNCTIONALITY
Version 3.4
6.2.19 BP (Blood Pressure)
Measures > BP displays your data as a breakdown of BP status: <=130/80, 130/80-140/90, >140/90,
No BP Recorded. The data is displayed as a pie chart. Functions available are as described for Allergies
(Pie Chart).
A patient’s BP must have both systolic and diastolic values recorded on the same day to be valid. The
most recent recording is used. If only one value is recorded this will be invalid and display in the ‘No
BP Recorded’ category.
A patient’s BP will be shown in the higher segment if either of the systolic or diastolic values is above
the cut-off. Eg. a BP of 141/85 will end up in the >140/90 category.
6.2.19.1 BP Mappings with Clinical systems
The BP mappings are provided in the ‘General Data Mappings’ Appendices under Measurements for
each Clinical application.
6.2.20 FBG (Fasting Blood Glucose)
Pathology > FBG displays your data as a breakdown of FBG status: <5.5%, 5.5 – 7.0, > 7.0%, No FBG
Recorded. The data is displayed as a pie chart. Functions available are as described for Allergies (Pie
Chart).
6.2.20.1 FBG Mappings with Clinical systems
The FBG mappings are provided in the ‘General Data Mappings’ Appendices under Measurements for
each Clinical application.
Note: Medical Director sometimes refers to FBG as BSLF (Blood Sugar Level Fasting).
6.2.21 INR (International Normalised Ratio)
Pathology > INR displays your data as a breakdown of INR status: <1.5, 1.5-2.0, 2.0-3.0, 3.0-4.0, >4.0,
No INR Recorded. The data is displayed as a pie chart. Functions available are as described for
Allergies (Pie Chart).
6.2.21.1 INR Mappings with Clinical systems
The INR mappings are provided in the ‘General Data Mappings’ Appendices under Measurements for
each Clinical application.
13 June 2012
PAGE 51 of 83
PCS Clinical Audit Tool – User Guide – Part 2 FUNCTIONALITY
Version 3.4
6.2.22 Spirometry
Measurements > Spirometry displays your data as a breakdown of date last recorded: <=6mths,
6mths-1yr, 1-2yrs, >2yrs, No Spirometry Recorded. The data is displayed as a pie chart. Functions
available are as described for Allergies (Pie Chart).
6.2.22.1 Spirometry Mappings with Clinical systems
The Spriometry mappings are provided in the ‘General Data Mappings’ Appendices under
Measurements for each Clinical application.
13 June 2012
PAGE 52 of 83
PCS Clinical Audit Tool – User Guide – Part 2 FUNCTIONALITY
Version 3.4
6.2.23 Medications
Medications count per category
Medications is displayed as a count by medication category (of patients that are currently taking a
medication in the category) and the prevalence in the population.
The Medication Prevalence is calculated by identifying the number of patients taking a specific
medication category and expressing it as a percentage of the total population.
The medication categories are the same as the medication groups provided in the medications filter
(except for some Mental Health Medications).
The data is displayed as:
• Count per medication category in a bar chart
• Prevalence per medication category as a percentage of this population in a bar chart
A bar is also provided on the chart for patients that have ‘None of these’ medications categories. This
is provided to assist practices in targeting patients for preventative care and miscoding.
Functions available are as described for Demographics (Bar Chart).
Medications count per patient
The ‘Medications Per Patient’ tab displays the current medication status as a breakdown of the
number of medications per patient: 0, 1, 2, 3, 4, 5, 6, 7, 8+. The number of medications is simply a
count of the medications listed as current for the patient.
The ‘Medications Not Printed in Last 6mths’ displays the number of scripts per patient that have not
been printed in the last 6 months ie. that may be out of date.
Functions available are as described for Allergies (Pie Chart).
Exporting the data to a patient list from this tab will show you exactly how many medications a patient
is on. Exporting this list to Excel will allow you to sort the data by medication count, allowing you to
target patients on the greatest number of medications.
6.2.23.1 Medications Mappings with Clinical systems
The medications mappings are provided in the ‘Medications Data Mappings’ Appendices for each
Clinical application.
Medications are flagged as true if they are on the patient’s current medication list. The collection
process does not make any decisions about whether a medication should actually have been removed
from the current medication list. The GP is responsible for making sure the list of medications is
accurate.
13 June 2012
PAGE 53 of 83
PCS Clinical Audit Tool – User Guide – Part 2 FUNCTIONALITY
Version 3.4
6.2.24 Diabetes SIP (Service Incentive Payment) Items
The Diabetes SIP graph is not automatically filtered by the patients with Diabetes.
To review your Diabetes SIP items you need to first filter on Condition = Diabetes.
The filtering is not done automatically as some of the items may be of interest for the
wider patient population eg. CHD patients who have not had a BP in the past 6 mths.
Diabetes SIP displays your data as a breakdown of diabetes care items:
HbA1c,
Eye Exam,
BMI < 6mths, BMI 6-12 mths,
BP < 6mths, BP 6-12 mths,
Foot Exam < 6mths, Foot Exam 6-12 mths,
Cholesterol,
Triglycerides,
HDL,
Microalbuminuria,
Smoking.
The data is displayed as:
• Count of Patients with Care Item Recorded in the Last x Months
• Count of Patients with No Care Item Recorded in the Last x Months
(ie. Items Remaining)
• Count of Items Completed per Patient
where x is the number of months within which an item is required to be recorded (6, 12 or 24 months)
NOTE:
Old Extract files did not contain data for BMI, BP and Foot Exam recorded in the last 6-12 months.
Where these are loaded CAT will display a message to alert the user that the extract file they are
viewing does not contain the data elements in the last 6-12mths. The bar segments of the chart for
these data elements will always be empty and show 0.
13 June 2012
PAGE 54 of 83
PCS Clinical Audit Tool – User Guide – Part 2 FUNCTIONALITY
Version 3.4
6.2.24.1 Cycle of Care by Item
The ‘Items Recorded’ and ‘Items Remaining’ graphs will help you to identify by item the areas of care
that still need to be recorded for a patient.
Functions available are as described for Demographics (Bar Chart).
6.2.24.2 Cycle of Care by Patient
The ‘Items Completed per Patient’ graph provides a view by patient of items that have been
completed or not.
Functions available are as described for Demographics (Bar Chart) but the ‘Export’ button is renamed
‘Worksheet’ for this graph as it gives a different style of re-identify report.
Figure 6.2.24.2A Diabetes SIP Worksheet button
13 June 2012
PAGE 55 of 83
PCS Clinical Audit Tool – User Guide – Part 2 FUNCTIONALITY
Version 3.4
6.2.24.3 The Diabetes SIP Worksheet
From the ‘Items Completed per Patient’ graph, click the ‘Worksheet’ button to get a list of the patients
in any segment(s) of the graph and view the list as a Diabetes SIP Worksheet.
The worksheet reports which items have been completed for a patient. For completed items it reports
in the item column either
i)
the value of an item where it can, or
ii)
a tick (√) where no value is available (eg. smoking).
In this example we have picked patients that have 10 items completed.
Figure 6.2.24.3A Diabetes SIP Worksheet
NOTE:
Old Extract Files will only have a possible maximum of 10 items counted. BMI, BP and Foot items in the
last 6-12mths have not been collected.
When claiming a SIP payment you should always check all requirements have been met
in your clinical software system.
6.2.24.4 Diabetes SIP Mappings with Clinical systems
The Diabetes SIP mappings are provided in the ‘Diabetes SIP Data Mappings’ Appendices for each
Clinical application.
13 June 2012
PAGE 56 of 83
PCS Clinical Audit Tool – User Guide – Part 2 FUNCTIONALITY
Version 3.4
6.2.25 CKD (Chronic Kidney Disease) Management
The CKD Manangement > Management Items graph has a target population of patients >= 15 years with a
CKD diagnosis and without a history of renal dialysis or kidney transplant.
It displays a stacked bar chart showing the % of patients that have a recorded value for each of the
management items: Blood Pressure, BMI, HbA1c (if Diabetic), LDL, Total Cholesterol, Smoking, ACE/ARB
prescribed, Statin prescribed.
Values are displayed as:
Recorded
Recorded and at target
Recorded and not at target
Not Recorded
A worksheet provides a report of all the management items for the target population.
More information about this graph is provided in the ‘CKD Management Quick Reference Guide’ available
from http://help.pencs.com.au/cat.htm
6.2.26 Musculoskeletal
The Musculoskeletal > Musculoskeletal Risk Factors graph provides a graph of ‘Musculoskeletal Risk Factors’.
These are:
Low BMI, Vitamin D deficiency, Smoking, High alcohol intake, Calcium deficiency, Fracture (minimal
trauma), Chronic kidney disease, Multiple myeloma
Selecting all segments of the graph and exporting to the reidentified patient list will provide a worksheet with
details of which risk factors each patient has.
This graph along with the new musculoskeletal condition and medication categories will allow patients at risk
to be identified for follow up:
•
Patients who have musculoskeletal risk factors and are not on a musculoskeletal medication
•
Patients who have musculoskeletal diagnosis and are not on a musculoskeletal medication
13 June 2012
PAGE 57 of 83
PCS Clinical Audit Tool – User Guide – Part 2 FUNCTIONALITY
Version 3.4
6.2.27 CV (Cardiovascular) Event Risk
The CV Event Risk graph displays your data as the % risk of a Cardiovascular Event in 5 years time. It is
a guide only based on population health statistics and is useful for clinicians to gain a high level view
of patients who are at risk for surveillance.
It is derived from the publication "National Vascular Disease Prevention Alliance. Guidelines for the
assessment of absolute cardiovascular disease risk. 2009" which is available from the websites of the
members of the National Vascular Disease Prevention Alliance (Heart Foundation, National Stroke
Foundation, Diabetes Australia and Kidney Health Australia).
About the Guidelines
The National Vascular Disease Prevention Alliance (NVDPA)1 Guidelines for the assessment of
absolute cardiovascular disease risk has been developed through an evidence and consensus-based
approach, and has received endorsement from the National Health and Medical Research Council.
This guideline is the first Australian guide with recommendations developed specifically for the
Australian population. The key recommendation is:
“Absolute cardiovascular risk assessment, using the Framingham Risk Equation to predict risk of a
cardiovascular event over the next 5 years, should be performed for all adults aged 45–74 years
without existing CVD or not already known to be at increased risk of CVD. Commence assessment in
Aboriginal and Torres Strait Islander adults at 35 years.”
In the guidelines, absolute risk is defined as the numerical probability of a cardiovascular event
occurring within a 5-year period. This is a more accurate prediction of a person’s ‘individualised’ risk of
CVD, compared with traditional methods based on single risk factor assessments (e.g. high
cholesterol, high blood pressure etc).
This release represents an important step towards improving health outcomes by establishing a more
integrated approach to cardiovascular disease prevention in Australia. Clinical decisions based on
absolute CVD risk will help direct lifestyle advice and medicines to those who have the most to
benefit.
Health professionals can access the following from www.heartfoundation.org.au (Professional
Information, Clinical Practice page):
Full guidelines (Guidelines for the assessment of absolute cardiovascular disease risk)
• Quick Reference Guide
• Risk assessment charts
• Online risk calculator
• Consumer information.
For more information, contact the Heart Foundation on 1300 36 27 87.
1
The National Vascular Disease Prevention Alliance (NVDPA) includes the Heart Foundation, National Stroke Foundation, Kidney Health
Australia and Diabetes Australia.
13 June 2012
PAGE 58 of 83
PCS Clinical Audit Tool – User Guide – Part 2 FUNCTIONALITY
Version 3.4
The Framingham Risk Equation (FRE)
The FRE predicts the risk of a cardiovascular event over the next 5 years. The calculation can be found
in the Absolute CVD Risk Resources provided in the Heart Foundation website in the ‘Technical report:
review of the evidence and evidence-based recommendations for practice’.
The calculation excludes patients who have:
•
•
Age: Non ATSI <45 or >74, ATSI <35 or >74
Condition: CVD
The data items used in the calculation are:
•
•
•
•
•
•
•
•
2
Age
Gender
Systolic BP (mm Hg)
Total Cholesterol (Mg/dL)
HDL (Mg/dL)
Smoking Status (Smoker/Non-smoker)
Diabetes
ECG-LVH (always set to 0) 2
ECG-LVH: ECG (Echocardiogram) is a test and LVH (Left Ventricular Hypertrophy) is a condition that is detected by
this test. If LVH is detected as definite this value in the FRE is set to 1, otherwise it is set to 0. Currently the outcome of
this test is not recorded as a coded value in the clinical software packages and therefore cannot be extracted. Hence,
this value is always set to 0.
13 June 2012
PAGE 59 of 83
PCS Clinical Audit Tool – User Guide – Part 2 FUNCTIONALITY
Version 3.4
CV Event Risk displays your data as a breakdown of the % 5 Year Risk of a Cardiovascular Event:
>=30%, 25-29%, 20-24%, 16-19%, 10-15%, 5-9% and <5%. The data is displayed as
• Count per age range in a bar chart
Chart functions available are as described for Demographics (Bar Chart).
The graph provides a total population number (the filtered population) and an eligible population
number. The eligible population is the number of patients in your filtered dataset that can be assessed
for risk ie. patients that do not fall into one of the excluded groups.
The ‘Count’ on the Count graph will show you the total of the patients graphed – this is the total
number of patients where CV Event Risk has been able to be calculated.
The eligible population – graph count = patients with incomplete data where no risk can be
calculated. These patients are displayed on the second tab.
106 patients counted
Figure 6.2.27A CV Event Risk Report
By selecting the high risk sections of the bar chart and clicking the ‘Export’ button a list of the patients
that make up this group can be obtained. This provides valuable information for practice staff working
to improve chronic disease management and prevention. The information can also, for example, be
used to substantiate the 45-49 year old health check.
13 June 2012
PAGE 60 of 83
PCS Clinical Audit Tool – User Guide – Part 2 FUNCTIONALITY
Version 3.4
Within the eligible population a patient may have incomplete results for the data items used in the
calculation. The % risk therefore cannot be calculated for these patients.
This data is displayed under the tab
• Excluded and Incomplete
Excluded patient details
Incomplete patient details
Incomplete data
This horizontal bar chart helps practice staff improve their data quality by identifying patients with
missing data. The Export button can be used for this purpose as described above.
Excluded data
The number of patients that have been excluded is provided in order of exclusion category: <35 (<45
non ATSI), >74, CVD. Once a patient is excluded for meeting an exclusion category they are not
counted in subsequent categories.
The content from the publication "National Vascular Disease Prevention Alliance. Guidelines for the
assessment of absolute cardiovascular disease risk. 2009" was used with permission from the Heart
Foundation (copyright material).
13 June 2012
PAGE 61 of 83
PCS Clinical Audit Tool – User Guide – Part 2 FUNCTIONALITY
Version 3.4
6.2.28 Immunisations
The Immunisations tab contains sub-tabs for Influenza, Pneumococcal, HPV, Pertrussis, Swine Flu and
Child Schedule (Figure 6.2.19A). The charts are all pie charts.
•
Influenza, Pneumococcal, Pertussis and Swine flu all display the most recent date the patient
had the immunisation or if no immunisation is recorded.
•
HPV displays the number of doses a patient has had or if no dose is recorded. The
reidentification report includes the date of the last immunisation.
•
Child Schedule provides a pie chart for children aged 0-7 years with their immunization status:
Fully immunised (a child has received all the immunisations required for their age), Up to date
(a child is not fully immunised but no dose is due), Due (immunisations are due now), Overdue
(immunisations are overdue). A reidentification worksheet provides details for each
immunisation in the schedule. More information is available in the CAT Childhood
Immunisations Quick Reference Guide available at http://help.pencs.com.au/cat.htm .
Immunisation tab
Immunisation charts
Figure 6.2.28A Immunisations tab
Functions available are as described for Allergies (Pie Chart).
6.2.28.1 Immunisations Mappings with Clinical systems
The immunisation mappings are provided in the ‘Medications Data Mappings’ Appendices for each
Clinical application.
13 June 2012
PAGE 62 of 83
PCS Clinical Audit Tool – User Guide – Part 2 FUNCTIONALITY
Version 3.4
6.2.29 MBS Items
The MBS Items tab is available when the clinical and billing systems are provided by the same vendor and the
data extract for the clinical system is version 1_5 or above. The ‘PCS Clinical Audit - User Guide Part 1 –
Installation and Configuration’ explains how to configure your preferences to collect billing data as well as
clinical data.
The data is displayed as a bar graph of:
•
Count of MBS items recorded
•
Count of MBS items not recorded
Notes
1.
You can use the Results filter to find the most recent MBS items that have been billed in a specific
2.
Old item numbers are still collected and displayed in the appropriate bar segment of the graph. Refer
time period.
to the table below. The item number will be viewable via the Reidentify report.
MBS Items currently collected are:
HC 75+
where HC includes item numbers:
701, 703, 705 and 707
HC 45-49
HC 3-5 (HKC)
HC Other
715 (ATSI 55+ HC)
715 (ATSI 15-54 HC)
715 (ATSI <15 HC)
721 – CDM - GP Management Plan
723 – CDM - Team Care Arrangement
732 – CDM Review
900 – DMMR
903 – RMMR
GP MH Care Plan – includes item numbers:
2700, 2701, 2715, 2717 (from 1st Nov 2011)
2712 – GP MH Care Plan Review
2713 – GP MH Care Consultation
Diabetes SIP – includes item numbers:
2517, 2518, 2521, 2522, 2525, 2526
2620, 2622, 2624, 2631, 2633, 2635
Asthma COC – includes item numbers:
2546, 2547, 2552, 2553, 2558, 2559, 2664,
2666, 2668, 2673, 2675 and 2677
11506 - Respiratory
13 June 2012
Old item numbers still collected
700 – 75+ Health Check
702 – 75+ Health Check (home)
717 – 45-49 Health Check
704/706 – ATSI 55+ AHC
710 – ATSI 15-54 AHC
708 – ATSI CHC
725 – GP Management Plan Review
727 – Team Care Arrangement Review
2702 – GP MH Care Plan
2710 – GP MH Care Plan
PAGE 63 of 83
PCS Clinical Audit Tool – User Guide – Part 2 FUNCTIONALITY
Version 3.4
Some item numbers have a follow up item number attached. For example, patients who have had a
2710 (Mental Health Plan) should have a follow up 2712 (Review of Mental Health Plan). You are able
to identify patients that have not had the follow up item number by using selecting item 2710 from
the recorded tab and item 2712 from the not recorded tab and using the ‘Report’ button to do a
cross-tabulation.
13 June 2012
PAGE 64 of 83
PCS Clinical Audit Tool – User Guide – Part 2 FUNCTIONALITY
Version 3.4
7 Reports
7.1 Standard Reports
A number of reports are available under the ‘Standard Reports’ tab.
These are:
•
Indicator Sets
Some reports have been grouped under a tab ‘Indicator Sets’. This is to indicate to users that the data
provided by this reports is able to be submitted to the Improvement Foundation web portal.
o
o
o
o
o
APCC (Australian Primary Care Collaboratives) Report
Queensland Aboriginal and Islander Health Council (QAIHC) Indicators Report
Healthy For Life
NT AHKPI (Northern Territory Aboriginal Health Key Performance Indicators)
National KPI
More information about the submission process for these reports is available in the ‘PCS Clinical
Audit User Guide –APCC Report and IF Submission’ available from
http://help.pencs.com.au/cat.htm
•
•
•
NPI (National Performance Indicators)
Summary Report Card
Mental Health (MH) Summary Report Card
Please note that the ‘Pap Smear Summary Report Card’ is found under the ‘Pap Smear’ tab.
13 June 2012
PAGE 65 of 83
PCS Clinical Audit Tool – User Guide – Part 2 FUNCTIONALITY
Version 3.4
7.1.1 APCC (Australia Primary Care Collaboratives) Report
The APCC Report is available under the ‘Standard Reports > Indicator Sets’ tab.
NOTE: For this report to collect Assessment Data from the PrimaryCare Sidebar® you must have your
Prompts Preferences > Patient Data Storage Shared Directory set. Refer to the APCC Guide advised at
the end of this section for instructions.
The APCC Report is always derived from your full data set not your filtered data set. It will always show
the practice total number for your registers Diabetes, CHD and COPD patients. This report provides
you with summary statistics for these patients.
This report cannot be filtered by date. It is applicable only to the date at which the data
collection was extracted. The date of extract will appear on the report.
The reason is because CAT collects a ‘snap-shot’ of a patient’s current results at the date of extract. It
does not collect a full patient history and hence it is not possible to create an APCC report
retrospectively.
The report shows a breakdown of patients by ATSI, Non ATSI and Not Recorded.
Figure 7.1.1A APCC Report
13 June 2012
PAGE 66 of 83
PCS Clinical Audit Tool – User Guide – Part 2 FUNCTIONALITY
Version 3.4
APCC participating practices
For practices participating in the APCC program, the APCC has developed a process where the report,
along with a set of manually entered measures, can be submitted to the Improvement Foundation (IF)
web portal. CAT provides functionality along with the APCC report to support this process.
APCC participating practices will be provided with a ‘Health Service Token’ which is entered via the
CAT Preferences screen.
The APCC Report functionality is available from a set of menu options contained at the top of the
APCC Report tab.
‘APCC Report’ tab with menu options
‘Standard Reports’ tab
A report toolbar is available which provides functions to view, print and export the document.
Figure 7.1.1B APCC Report functionality
The ‘APCC’ Report menu options are:
• Prepare Report – this option has been replaced by the Data Submission main menu option
which will guide the user through the data transmission process
•
•
•
View History – allows the user to view a list of previous reports that have been submitted
Manual Measures – a data entry screen for the manual measures
Prevention Measure – a data entry screen for the prevention measures that are not collected
Practices that are not participating in the APCC program will be able to use the report but will not be
able to submit any data.
APCC participating practices should refer to the ‘PCS Clinical Audit User Guide –APCC
Report and IF Submission’ which provides detailed information about the report and
submission process.
This guide is available from http://help.pencs.com.au/cat.htm
13 June 2012
PAGE 67 of 83
PCS Clinical Audit Tool – User Guide – Part 2 FUNCTIONALITY
Version 3.4
7.1.2 NPI (National Performance Indicators) Report
The NPI Reports are available under the ‘Standard Reports’ tab.
The NPI Reports are always derived from your full data set not your filtered data set.
The following NPI Reports for 2009-10 are available:
• CDM 2 for reporting on Diabetes patients HbA1c results in last 12mths
• CDM 3 for reporting on CHD patients with BP <= 130/80 in last 12 mths
• PREV 4 for reporting on female patients aged 20-69 with a pap smear in last 2 yrs
These reports cannot be filtered by date. They are applicable only to the date at which the data
collection was extracted. The date of extract will appear on the reporst.
The reason is because CAT collects a ‘snap-shot’ of a patient’s current results at the date of extract. It
does not collect a full patient history and hence it is not possible to create NPI reports retrospectively.
A report toolbar is available which provides functions to view, print and export the document.
Figure 7.1.2A NPI Reports
13 June 2012
PAGE 68 of 83
PCS Clinical Audit Tool – User Guide – Part 2 FUNCTIONALITY
Version 3.4
7.1.3 Summary Report Card
The Summary Report Card is available under the ‘Standard Reports’ tab.
This report provides an instant snapshot of GP data quality across most of the graphs provided. This
means the user doesn't have to go to each tab and write the figures down.
The report can be exported to Excel so the user can create a month by month set of figures if they
choose. [Note the user needs to collect new extract files for each monthly report.]
The user can also use the filters to target specific populations.
This report is found under the ‘Standard Reports’ tab > ‘Summary Report Card’ tab
Figure 7.1.3A Summary Report Card tab
7.1.4 Mental Health (MH) Summary Report Card
The MH Summary Report Card is available under the ‘Standard Reports’ tab.
This report provides a snapshot of GP data relating to Mental Health. It is designed to encourage GPs
to review and update their management strategies for patients diagnosed with mental health
disorders, specifically schizophrenia, in their practices. These new management strategies are in line
with the Royal Australian and New Zealand College of Psychiatrists (RANZCP) guidelines and take into
account the International Diabetes Federation criteria for metabolic syndrome.
How to use this report
This report is designed to be used in conjunction with the CAT filters. Some medications can increase
a patient’s metabolic risks and this report highlights areas of patient care that may need further
management.
Some suggested filters are:
1. Filter on Condition = Schizophrenia
2: Filter on Medications = Antipsychotics
Where the filtered population shows increased risk or a lack of data for physical measures like BP, BMI
and Waist the practice may need to consider their overall management strategies for these patients.
The report can be exported to Excel.
13 June 2012
PAGE 69 of 83
PCS Clinical Audit Tool – User Guide – Part 2 FUNCTIONALITY
Version 3.4
7.1.5 QAIHC Indicators Report
The Queensland Aboriginal and Islander Health Council (QAIHC) have a set of core indicators
designed to support quality improvement initiatives. A subset of these indicators is provided in the
CAT QAIHC Indicators report.
The CAT QAIHC Report is available for clinical systems where the CAT data extract meets the CAT data
specifications version 1_6 or higher. MBS Item Indicators in the report are available where the clinical
and billing systems are provided by the same vendor.
More information is available in the CAT QAIHC Indicators Quick Reference Guide available at
http://help.pencs.com.au/cat.htm .
7.1.6 Healthy For Life Report
Healthy for Life (HFL) is a program funded by the Office of Aboriginal and Torres Strait Islander Health
(OATSIH) which aims to improve the health outcomes of Aboriginal and Torres Strait Islander peoples.
10 essential indicators have been developed for reporting purposes. These indicators cover the areas
of:
•
Maternal and Antenatal (indicators 1-4)
•
Child Health (indicators 5-6)
•
Adult Health (indicators 6-10)
The CAT HFL Report is available for clinical systems where the CAT data extract meets the CAT data
specifications version 1_6 or higher. MBS Item Indicators in the report are available where the clinical
and billing systems are provided by the same vendor.
More information is available in the CAT HFL Quick Reference Guide available at
http://help.pencs.com.au/cat.htm .
7.1.7 NT AHKPI Indicators Report
The NT AHKPI (Northern Territory Aboriginal Health Key Performance Indicators) is a collaboration
between the Northern Territory Aboriginal Health Forum (AHF) partners to develop a Northern
Territory wide primary health care performance reporting system for collecting and reporting key
performance indicator (KPI) data. These KPI’s were developed to provide information to support
health services in planning activities and in contributing to evidence based reporting requirements.
The CAT NT AHKPI Report is available for clinical systems where the CAT data extract meets the CAT
data specifications version 1_6 or higher. MBS Item Indicators in the report are available where the
clinical and billing systems are provided by the same vendor.
More information is available in the CAT NT AHKPI Indicators Quick Reference Guide available at
http://help.pencs.com.au/cat.htm .
13 June 2012
PAGE 70 of 83
PCS Clinical Audit Tool – User Guide – Part 2 FUNCTIONALITY
Version 3.4
7.1.8 National KPI Indicators Report
As part of the National Indigenous Reform Agreement (NIRA), the Council of Australian Governments
(COAG) agreed that the Department of Health and Ageing, in partnership with the state and territory
health departments and in collaboration with the Australian Institute of Health and Welfare (AIHW),
would develop a set of national key performance indicators (KPIs) for Indigenous specific primary
health care services. AIHW have provided specifications for these indicators.
The CAT National KPI Report is available for clinical systems where the CAT data extract meets the CAT
data specifications version 1_6 or higher. MBS Item Indicators in the report are available where the
clinical and billing systems are provided by the same vendor.
More information is available in the CAT National KPI Indicators Quick Reference Guide available at
http://help.pencs.com.au/cat.htm .
7.1.8.1 Collecting Additional Patients in CAT for Reporting
Practices submitting data for the National KPI report will need to extract additional patients to meet
the population base required for the report. The report requires that all patients who have visited the
practice in the last 2 years should be included. This definition includes archived and deceased patients.
The Medical Director and Best Practice preference tabs now include a new option ‘Extract Archived
and Deceased Patients’ which can be set to ‘Yes’ to enable this functionality. The default selection will
be set to 'No'.
For practices where this set to 'No' there will be no change to the way CAT functions.
For practices where this set to 'Yes' the default population loaded will exclude patients that are
archived and deceased, enabling practices to continue working with CAT in the same way they always
have. The NKPI Report will include the additional patients and this will be noted at the top of the
report. (Note for the 30th June 2012 collection deceased patients will not be included in the report to
align the figures reported with Communicare. Not all Communicare users will have been upgraded to
extract deceased patients.)
More information about this functionality is provided in the CAT Extracting Additional Patients Quick
Reference Guide available at http://help.pencs.com.au/cat.htm .
13 June 2012
PAGE 71 of 83
PCS Clinical Audit Tool – User Guide – Part 2 FUNCTIONALITY
Version 3.4
7.2 Cross Tabulation Report
The cross tabulation report provides the ability to find patients who appear on more than one graph this assists with the identification of target population risk groups.
For example: Highlight the graphs segment for BMI >30, Smoker, BP >140/90, Cholesterol level >7.5
and view which patients meet all these criteria.
As you highlight report chart segments you will see 2 pieces of information on the screen
1. A ● will appear on the tab where you have made a chart segment selection
2. A new line will appear underneath where the filter details display. This line will provide details
of which chart segments are selected. The example below shows BMI (Obese, Morbid),
Smoking (Daily), BP (>140/90). Lipids – Cholesterol (>7.5) .
You will see that the ‘Report’ button has become active.
Figure 7..2A Multiple report selections for cross-tabulation
•
Click the ‘Report’ button
The standard Reidentify Report will display in an adjusted format to allow the data values for
the chart selections you have made to be provided (Figure 7.2B).
Figure 7..2B Cross tabulation Reidentify Report
13 June 2012
PAGE 72 of 83
PCS Clinical Audit Tool – User Guide – Part 2 FUNCTIONALITY
Version 3.4
7.2.1 Clearing Report Selections
To clear the Report Chart Segments you have selected click the ‘Clear Filters’ button at the top right
hand corner of the CAT screen. The ‘Clear Filters’ dialogue box will appear.
The ‘Clear all Report Selections’ tick box will be pre-selected if report segment selections have been
made. Click ‘OK’.
Figure 7.2.1A Clear Filters dialogue box
The ● which appears on the tabs with selected report segments will be cleared. The text line with
selected report segments information will be cleared.
13 June 2012
PAGE 73 of 83
PCS Clinical Audit Tool – User Guide – Part 2 FUNCTIONALITY
Version 3.4
8 How to improve data quality using CAT
There are a number of ways that CAT can be used to improve the data quality of your clinical desktop
system. Some of these are listed below.
8.1 Patients with no Date of Birth
To find patients with no date of birth (DOB) use the age filter.
•
•
•
•
Tick Age = No Age
Click the ‘Recalculate’ button
Click the ‘View Pop.’ Button
The Patient report for this filtered group will be displayed and you will see that the DOB
column is empty
8.2 Patients with no Gender
Patients with no gender will have their gender as something other than ‘M’ or ‘F’ in the data set –
probably it will be blank. To find them use the gender filter.
•
•
•
•
Tick Gender = Other
Click the ‘Recalculate’ button
Click the ‘View Pop.’ Button
The Patient report for this filtered group will be displayed and you will see that the sex column
is empty or has something other than ‘M’ or ‘F’
8.3 Patients with no Allergy status recorded
The Allergies tab displays your data as a breakdown of allergy status: Allergy Recorded, No Known
Allergies, Nothing Recorded.
Use this tab to identify patients with the status of ‘Nothing Recorded’.
Refer to the section on Allergies.
8.4 Patients with no Smoking status recorded
Smoking displays your data as a breakdown of smoking status: Daily Smoker, Irregular Smoker, Ex
Smoker, Never Smoked, Nothing Recorded.
Use this tab to identify patients with the status of ‘Nothing Recorded’.
You may need to use the age filter to exclude patients under 10 years old.
Refer to the section on Smoking.
13 June 2012
PAGE 74 of 83
PCS Clinical Audit Tool – User Guide – Part 2 FUNCTIONALITY
Version 3.4
8.5 Patients with incorrect Diabetes coding
Patients with Diabetes should be coded with a Diagnosis of Type I or Type II.
To find incorrect coding search for
1.
Patients with both Type I and Type II recorded
•
•
•
•
•
2.
Patients with an Undefined only diagnosis recorded – patients should have a primary diagnosis of
Type I or Type II recorded
•
•
•
•
•
•
13 June 2012
Tick the Diabetes ‘Type I’ checkbox
Tick the Diabetes ‘Type II’ checkbox
Click the ‘Recalculate’ button
Click the ‘View Pop.’ Button
The Patient report for this filtered group will have both diagnosis recorded
Tick the Diabetes ‘Type I’ NO checkbox
Tick the Diabetes ‘Type II’ NO checkbox
Tick the Diabetes ‘Undefined’ checkbox
Click the ‘Recalculate’ button
Click the ‘View Pop.’ Button
The Patient report for this filtered group will no primary Diabetes diagnosis recorded
PAGE 75 of 83
PCS Clinical Audit Tool – User Guide – Part 2 FUNCTIONALITY
Version 3.4
9 Timeline
The Timeline functionality allows you to view changes in your data extracts over time. Most graphs have a
‘Timeline’ button at the top right near the ‘Export’ and ‘Print’ buttons.
Note that the timeline only shows data from the total patient population – it does not work with filters.
•
Click segments from any graph(s) you like
•
The ‘Timeline’ button of a graph becomes active when a segment is selected on that graph
•
Click any active ‘Timeline’ button
•
The Timeline graph is loaded into the ‘new Timeline’ tab at the far right of the tabs
Figure 9A Timeline for Pap Smear Recorded
TIPS:
1.
If you add or remove graph segments you can return to the ‘Timeline’ tab and click the Timeline
‘Recalculate’ button to refresh the graph
2.
The ‘From’ and ‘To’ Dates default to cover a year before the extract date. Adjust these to include older
extracts if you have them. If an extract does not appear you may simply need to reload it – this will
create summary data for the timeline which may not have previously been created.
13 June 2012
PAGE 76 of 83
PCS Clinical Audit Tool – User Guide – Part 2 FUNCTIONALITY
Version 3.4
10 ‘Send Data To’ function
The ‘Send Data To’ function allows practices to send a CAT data file from within CAT to an external location of
their choice. Only the data file is sent using this function. The link file is NOT sent.
The function allows data to be sent securely via 1) Email (MAPI or Other) or 2) Secure FTP.
10.1 Configuring locations
A new menu option ‘Edit’ > ‘Send Data Extracts Locations’ allows practices to configure locations they are
happy to send data to.
Figure 10.1A Send Data configuration menu option
Figure 10.1B Send Data configuration screen
To configure a new email location
•
Select ‘Edit’ > ‘Send Data Extracts Locations’ from the menu bar (Figure 10.1A)
•
The ‘Send Data Extracts Locations’ configuration screen will be displayed
•
If you use Outlook, select ‘Email-MAPI’ from the drop-down ‘Send Data Method’ list (Figure 10.1B)
•
Enter a location name that describes where the data will be sent
•
Click Add
Otherwise, select ‘Email-SMTP’
13 June 2012
PAGE 77 of 83
PCS Clinical Audit Tool – User Guide – Part 2 FUNCTIONALITY
•
Version 3.4
A new location tab will added to the ‘Send Data Extracts Locations’ window with the location name
you have provided
•
•
MAPI - Fill in the mandatory fields (Figure 10.1C)
o
Email To Address
o
Practice ID and Practice Name
SMTP – Additional mail server fields will be required to be completed. You may need to check with
your service provider or system administrator to configure the settings correctly.
•
Other fields are optional
•
If you wish to encrypt the zipped data file tick ‘Enable Encrypt’ and provide a password. You will need
•
Click the ‘Test’ button to check a test email is successfully sent and received
•
Click ‘OK’
to let the receiver know what this password is so they can un-encrypt the file when they receive it.
Figure 10.1C Send data email configuration
13 June 2012
PAGE 78 of 83
PCS Clinical Audit Tool – User Guide – Part 2 FUNCTIONALITY
Version 3.4
To configure a new ftp location
•
Select ‘Edit’ > ‘Send Data Extracts Locations’ from the menu bar (Figure 10.1A)
•
The ‘Send Data Extracts Locations’ configuration screen will be displayed
•
Select ‘Secure FTP’ from the drop-down ‘Send Data Method’ list
•
Enter a location name that describes where the data will be sent
•
Click Add
•
A new location tab will added to the ‘Send Data Extracts Locations’ window with the location name
you have provided
•
•
Fill in the mandatory fields (Figure 10.1D)
o
FTP Address
o
Practice ID and Practice Name
Other fields are optional – you should check with the receiving location and to which additional FTP
fields are required
o
•
Port, Username and Password
If you wish to encrypt the zipped data file tick ‘Enable Encrypt’ and provide a password. You will need
to let the receiver know what this password is so they can un-encrypt the file when they receive it.
•
Click the ‘Test’ button to check a test file is successfully sent and received
•
Click ‘OK’
Figure 10.1D Send data secure ftp configuration
13 June 2012
PAGE 79 of 83
PCS Clinical Audit Tool – User Guide – Part 2 FUNCTIONALITY
Version 3.4
10.2 Sending data to a location
Once a dataset from the ‘Extracts’ panel is loaded the right-click function is available. This will display the list
of send to locations that have been configured for the practice to choose from.
NOTE: Only deidentified data is sent.
•
•
•
•
•
•
•
•
•
•
Load the data set you wish to send
Right-click on the extract listed in the extracts panel
Select ‘Send To’
The list of configured locations will be available (Figure 10.2A)
Select the location
A confirmation dialogue box will appear (Figure 10.2B)
Click OK
A progress bar will display while the send is in progress (Figure 10.2C)
Once completed a status message will be provided (Figure 10.2D)
A history record will be written under menu option: Tools > Send Data History
Figure 10.2A Send To location selections
Figure 10.2B Send To location confirmation
Figure 10.2C Send To location sending progress
Figure 10.2D Send To location sent
13 June 2012
PAGE 80 of 83
PCS Clinical Audit Tool – User Guide – Part 2 FUNCTIONALITY
Version 3.4
11 CAT Tools Menu
Figure 11A CAT Tools menu
The CAT Tools menu (Figure 11A) provides the following useful options:
Deidentify Dataset
A data extract can be deidentified using the Deidentify tool menu option within CAT. You must load the data
set you wish to deidentify before running the tool.
• Click Tools > Deidentify Dataset
• You will receive a confirmation message once the process had completed (Figure 11B)
• Click OK
• The new deidentified dataset will appear in your list of extracts (Figure 11C)
Figure 11B Completed deidentify message
Figure 11C Original and deidentified datasets in extracts list
Check for Updates
If a practice has ‘skipped’ the option to take updates available for CAT they will not be prompted again when
new updates are released. This has caused problems for practices in the past.
This menu option has been added to allow practices to check for updates in case some have been missed:
Tools > Check for Updates
Note: the practice must have installed a minimum of CAT 2.8 for this option to be available.
13 June 2012
PAGE 81 of 83
PCS Clinical Audit Tool – User Guide – Part 2 FUNCTIONALITY
Version 3.4
APPENDIX A1 - GENIE DATA COLLECTION
For Genie users the data set collection is performed from within the Genie software application.
Clicking the CAT ‘Collect’ button at the top left of the screen will provide you with the summary steps
on how this is done within Genie.
For details of the steps in this process please refer to the Genie data Mappings document available
from http://help.pencs.com.au/cat.htm
APPENDIX A2 – PRACTIX DATA COLLECTION
For practiX users the data set collection is performed from within the practIX software application.
Clicking the CAT ‘Collect’ button at the top left of the screen will provide you with the summary steps
on how this is done within pratiX.
For details of the steps in this process please refer to the practiX data Mappings document available
from http://help.pencs.com.au/cat.htm
APPENDIX A3 – MEDINET DATA COLLECTION
For Medinet users the data set collection is performed from within the Medinet software application.
Clicking the CAT ‘Collect’ button at the top left of the screen will provide you with the summary steps
on how this is done within Medinet.
For details of the steps in this process please refer to the Medinet data Mappings document available
from http://help.pencs.com.au/cat.htm
13 June 2012
PAGE 82 of 83
PCS Clinical Audit Tool – User Guide – Part 2 FUNCTIONALITY
Version 3.4
APPENDIX B – MEDICAL DIRECTOR DATA CATEGORY MAPPINGS
APPENDIX C – BEST PRACTICE DATA CATEGORY MAPPINGS
APPENDIX D – GENIE DATA CATEGORY MAPPINGS
APPENDIX E – ZEDMED DATA CATEGORY MAPPINGS
APPENDIX F – PRACTIX DATA CATEGORY MAPPINGS
APPENDIX G – COMMUNICARE DATA CATEGORY MAPPINGS
APPENDIX H – MEDINET DATA CATEGORY MAPPINGS
The Appendices for each Clinical Desktop System’s Data Mappings are provided separately.
They are available from
http://help.pencs.com.au/cat.htm
13 June 2012
PAGE 83 of 83