1
Monitoring
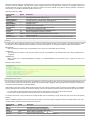
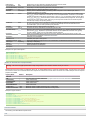
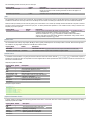
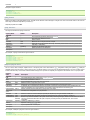
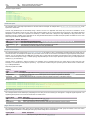
Monitoring in Flume is still a work in progress. Changes can happen very often. Several Flume components report metrics to the JMX platform MBean
server. These metrics can be queried using Jconsole.
Ganglia Reporting
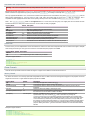
Flume can also report these metrics to Ganglia 3 or Ganglia 3.1 metanodes. To report metrics to Ganglia, a flume agent must be started with this
support. The Flume agent has to be started by passing in the following parameters as system properties prefixed by flume.monitoring., and can be
specified in the flume-env.sh:
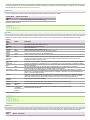
Property Name
type
hosts
pollFrequency
isGanglia3
Default
–
–
60
false
Description
The component type name, has to be ganglia
Comma-separated list of hostname:port of Ganglia servers
Time, in seconds, between consecutive reporting to Ganglia server
Ganglia server version is 3. By default, Flume sends in Ganglia 3.1 format
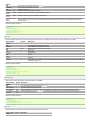
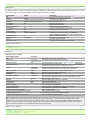
We can start Flume with Ganglia support as follows:
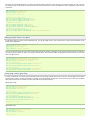
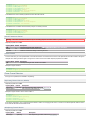
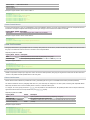
$ bin/flume-ng agent --conf-file example.conf --name a1 -Dflume.monitoring.type=ganglia -Dflume.monitoring.hosts=com.example:1234,com.example2:5455
JSON Reporting
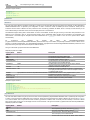
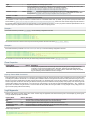
Flume can also report metrics in a JSON format. To enable reporting in JSON format, Flume hosts a Web server on a configurable port. Flume reports
metrics in the following JSON format:
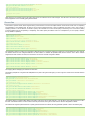
{
"typeName1.componentName1" : {"metric1" : "metricValue1", "metric2" : "metricValue2"},
"typeName2.componentName2" : {"metric3" : "metricValue3", "metric4" : "metricValue4"}
}
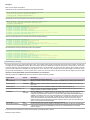
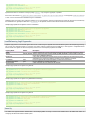
Here is an example:
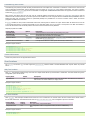
{
"CHANNEL.fileChannel":{"EventPutSuccessCount":"468085",
"Type":"CHANNEL",
"StopTime":"0",
"EventPutAttemptCount":"468086",
"ChannelSize":"233428",
"StartTime":"1344882233070",
"EventTakeSuccessCount":"458200",
"ChannelCapacity":"600000",
"EventTakeAttemptCount":"458288"},
"CHANNEL.memChannel":{"EventPutSuccessCount":"22948908",
"Type":"CHANNEL",
"StopTime":"0",
"EventPutAttemptCount":"22948908",
"ChannelSize":"5",
"StartTime":"1344882209413",
"EventTakeSuccessCount":"22948900",
"ChannelCapacity":"100",
"EventTakeAttemptCount":"22948908"}
}
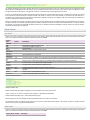
Property Name
type
port
Default Description
–
The component type name, has to be
41414 The port to start the server on.
http
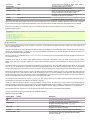
We can start Flume with JSON Reporting support as follows:
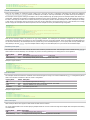
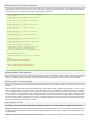
$ bin/flume-ng agent --conf-file example.conf --name a1 -Dflume.monitoring.type=http -Dflume.monitoring.port=34545
Metrics will then be available at http://<hostname>:<port>/metrics webpage. Custom components can report metrics as mentioned in the Ganglia
section above.
Custom Reporting
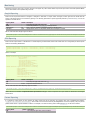
It is possible to report metrics to other systems by writing servers that do the reporting. Any reporting class has to implement the interface,
org.apache.flume.instrumentation.MonitorService. Such a class can be used the same way the GangliaServer is used for reporting. They can poll the
platform mbean server to poll the mbeans for metrics. For example, if an HTTP monitoring service called HTTPReporting can be used as follows:
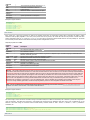
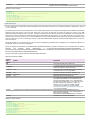
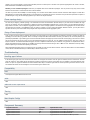
$ bin/flume-ng agent --conf-file example.conf --name a1 -Dflume.monitoring.type=com.example.reporting.HTTPReporting -Dflume.monitoring.node=com.exa
Property Name
type
Default Description
–
The component type name, has to be FQCN