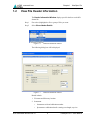
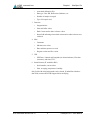
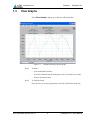
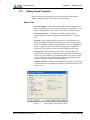
1
ViewSpec Pro™ User Manual ASD Document 600555 Rev. A © 2008 by ASD Inc. www.asdi.com www.asdi.com Trademark Information ASD Inc. 2555 55th Street Boulder, CO 80301 USA Phone: (303) 444-6522 www.asdi.com FieldSpec®, LabSpec®, QualitySpec®, TerraSpec®, AgriSpec®, RxSpec®, ViewSpec™, RS3™, Indico™, and goLab™ are registered, and unregistered trademarks, and the intellectual property of ASD Inc. All trademarks used or displayed in this document are the property of ASD, its affiliates, or third party owners. Unauthorized use of these trademarks is illegal and punishable by law. Nothing contained in this document is to be construed as granting, by implication, estoppel, or otherwise, any license or right of use of any such trademark without the prior and express written permission of ASD, or such third party owner. This document contains proprietary information protected by copyright law and may not be reproduced in any manner without the express written approval of ASD Inc. The information and specifications contained in this manual are subject to change without notice. ASD Inc. shall not be held liable for technical, editorial omissions, or errors made herein; nor for incidental or consequential damages resulting from furnishing, performance, or use of this material. Technical Support If you have any questions or concerns, please contact ASD Inc. by phone, fax, or email: Phone: 303-444-6522 X-144 Fax: 303-444-6825 email: [email protected] Web: www.asdi.com ftp: ftp.asdi.com Technical support is committed to providing you with a timely response to your questions. We will work with you to provide solutions to your applications. Technical support is available to answer your questions Monday thru Friday, 8 am to 5 pm Mountain Standard Time. We will happily respond to your e-mail queries as well. ASD Document 600555 Rev. A ii ViewSpec Pro™ User Manual www.asdi.com Table of Contents Trademark Information . . . . . . . . . . . . . . . . . . . . . . . . . . . . . . . . . . . . . . . . . . . ii Technical Support . . . . . . . . . . . . . . . . . . . . . . . . . . . . . . . . . . . . . . . . . . . . . . . ii ViewSpec Setup . . . . . . . . . . . . . . . . . . . . . . . . . . . . . . . . . . . . . . . . . . . . . . . 1 View File Header Information . . . . . . . . . . . . . . . . . . . . . . . . . . . . . . . . . . . . . 4 View Graphs . . . . . . . . . . . . . . . . . . . . . . . . . . . . . . . . . . . . . . . . . . . . . . . . . . 6 Editing Graph Properties . . . . . . . . . . . . . . . . . . . . . . . . . . . . . . . . . . . . . 7 General Tab . . . . . . . . . . . . . . . . . . . . . . . . . . . . . . . . . . . . . . . . . . . . . . 7 Plot Tab . . . . . . . . . . . . . . . . . . . . . . . . . . . . . . . . . . . . . . . . . . . . . . . . . 9 Subsets Tab. . . . . . . . . . . . . . . . . . . . . . . . . . . . . . . . . . . . . . . . . . . . . . 9 Axis Tab . . . . . . . . . . . . . . . . . . . . . . . . . . . . . . . . . . . . . . . . . . . . . . . . 11 Font Tab . . . . . . . . . . . . . . . . . . . . . . . . . . . . . . . . . . . . . . . . . . . . . . . 11 Color Tab . . . . . . . . . . . . . . . . . . . . . . . . . . . . . . . . . . . . . . . . . . . . . . . 12 Style Tab . . . . . . . . . . . . . . . . . . . . . . . . . . . . . . . . . . . . . . . . . . . . . . . 13 Legend . . . . . . . . . . . . . . . . . . . . . . . . . . . . . . . . . . . . . . . . . . . . . . . . . . 14 Format . . . . . . . . . . . . . . . . . . . . . . . . . . . . . . . . . . . . . . . . . . . . . . . . . . 14 Print . . . . . . . . . . . . . . . . . . . . . . . . . . . . . . . . . . . . . . . . . . . . . . . . . . . . 15 Export . . . . . . . . . . . . . . . . . . . . . . . . . . . . . . . . . . . . . . . . . . . . . . . . . . . 15 Processing files in ViewSpec . . . . . . . . . . . . . . . . . . . . . . . . . . . . . . . . . . . . 16 INDEX . . . . . . . . . . . . . . . . . . . . . . . . . . . . . . . . . . . . . . . . . . . . . . . . . . . . . . . XXI ASD Document 600555 Rev. A iii ViewSpec Pro™ User Manual Chapter 1 ViewSpec Pro The ViewSpec™ application is a program used for post-processing spectra files that were saved using an ASD instrument. You can initiate ViewSpec Pro by using one of the following: 1.1 • From the RS3 Software: Control->ViewSpec Pro... pull-down menu. [Alt+C,V] • Clicking on the ViewSpec Pro icon from the desktop. ViewSpec Setup Step 1 Select the input directory for the spectra files. The input directory is the location where your spectra data files reside, as well as your calibration files. For the input files, use: • Setup->Input Directory... pull-down menu item. • Alt+S, I key combination. Figure 1-1 © 2008 ASD Inc. Setup pull-down menu. 1 ViewSpec Pro™ User Manual www.asdi.com Chapter 1 ViewSpec Pro When selecting a new input directory, a window will open asking if you want the output directory to be the same as the input directory. Figure 1-2 Step 2 Output Directory Option window. The input and output directories do not have to be the same directory. To select a different output directory for the spectra files. For the output files, use: • Setup->Output Directory... pull-down menu item. • Alt+S, O key combination. The input and output directories do not have to be the same directory. The current input and output directories are shown on the bottom of the ViewSpec window, as shown below. Figure 1-3 Step 3 Input and Output Directory Location. Select File->Open on the main menu bar and then choose the files for post-processing. RS3 files will have different extensions (three digit numbers) depending on the file format or how they were generated. Figure 1-4 ASD Document 600555 Rev. A File pull-down menu. 2 ViewSpec Pro™ User Manual www.asdi.com Chapter 1 ViewSpec Pro The following dialog box will be displayed, automatically taking you to the directory selected in step 1. Figure 1-5 Step 4 Input File Selection window. Select the file(s) from the list available in the directory. • Use the 'Shift' or 'Ctrl' keys in conjunction with the mouse click to select multiple files. • Use the 'Files of type' combo box to show only files with certain file extensions. Step 5 When you have selected the files you desire, click 'Open'. Step 6 To close files in ViewSpec Pro select File->Close on the main menu bar. ASD Document 600555 Rev. A 3 ViewSpec Pro™ User Manual www.asdi.com 1.2 Chapter 1 ViewSpec Pro View File Header Information The Header Information Window displays specific details to each ASD format file. Step 1 First select (highlight) the file or group of files you want. Step 2 Select View->Header Details Figure 1-6 Header Information window. The following dialog box will be displayed: Figure 1-7 Header Information window. Details include: 1 File name and Directory location 2 Instrument • Instrument serial and calibration number • Spectrometer calibration details: starting wavelength, step size ASD Document 600555 Rev. A 4 ViewSpec Pro™ User Manual www.asdi.com 3 4 5 Chapter 1 • Associated calibration files • Data type - Raw DN, Reflectance, Radiance, etc. • Number of samples averaged • Type of foreoptic used. Detectors • Integration time • Gain and Offset values • Dark Current and/or white reference values • Status field indicating when a dark current and/or white reference was collected. Misc. • Comments • Min/max axes values • Date and time spectra was saved • Program version and file version. GPS • 6 ViewSpec Pro GPS Data - Latitude and Longitude (in decimal minutes), Elevation (in meters), and time (UTC). Smart Detector (IF enabled in RS3) • Serial number, current values • Gain, averaging, temperature, humidity. Only fields with white backgrounds can be altered. If unfamiliar with these data fields, contact ASD Field Support before modifying. ASD Document 600555 Rev. A 5 ViewSpec Pro™ User Manual www.asdi.com 1.3 Chapter 1 ViewSpec Pro View Graphs Select View->Graph to display up to fourteen ASD format files. Figure 1-8 Step 1 Step 2 Example showing a spectral graph. To Zoom: • Press and hold the Shift key. • Press the left mouse button and drag the cursor to select the new extents. • Release the mouse button. To Undo the Zoom: Press the Z key or use the popup menu to select the Undo Zoom menu item. ASD Document 600555 Rev. A 6 ViewSpec Pro™ User Manual www.asdi.com 1.3.1 Chapter 1 ViewSpec Pro Editing Graph Properties Double clicking on the graph will open the Spectral Data Customization window, allowing changes to be made to the graph format. General Tab • Title and subtitles - These two edit-boxes allow editing, and deletion of main and sub titles. If no title is present, entering one will add one. If you remove all the characters from a title it will be deleted from the image. • Grid characteristics - The Graph can contain vertical grid lines, horizontal grid lines, both vertical and horizontal grid lines, or no grid lines. • Font Size - The Graph supports three font sizes, Large, Medium, and Small. Depending on the size of the graph, the user can select the font size that is most readable. When printing the graph, a font size of Medium or Small is suggested. There are occasions the graph may automatically reduce the size of the font in order to produce a higher quality image. • Viewing style - This customization allows you to quickly adjust the image to best suite printing on a monochrome printer. The Graph supports two sets of color parameters, a monochrome and a Color color set.If four or more subsets are to be included in the graph, then Monochrome with Symbols will help distinguish the different subsets. • Numeric Precision - When placing information into a table, or exporting Text/Data from the Export Dialog, the number of decimal positions can be between 0 to 3. Figure 1-9 ASD Document 600555 Rev. A General graph customization window. 7 ViewSpec Pro™ User Manual www.asdi.com Chapter 1 ViewSpec Pro Customization buttons • OK - Accepts changes made and closes the customization window. • Cancel - Accepts all but the last change made and closes the customization window. • Apply - The Apply button is similar to the OK button but does not close the customization dialog. • Help - Not used at this time. • Original - By pressing the Original Button the display will be shown with the Original set of parameters. • Export - Graphs can export the following formats to the listed destinations. • • File Destination - If information is to be exported to a file, then you must enter a target filename. Click the mouse over the Browse button to show the File Save As Dialog. Enter a filename and select OK to close the File Save As dialog. • Printer Destination - If you’re exporting a metafile to the printer, pressing the Print button will show the Print Dialog. Use the Print Dialog to make changes to the selected printer, orientation, paper bin, and other printer options. • Exporting Text /Data - When exporting Text/Data, pressing the Export button launches the Text/Data Export Dialog. Maximize - Maximizing resizes the display to use the entire video display. The display is actually copied to a maximized dialog window. The dialog (maximized object) can be closed by pressing 'Escape' or by using the mouse to Click the title bar. Making customizations to the maximized object will not effect the original (non-maximized) object. ASD Document 600555 Rev. A 8 ViewSpec Pro™ User Manual www.asdi.com Chapter 1 ViewSpec Pro Plot Tab Adjusts the plot style: Line, points and line, or points and spline. Figure 1-10 Plot Customization window. Subsets Tab Will display the highlighted files and also adjusts how many subsets are displayed of the plotted data. The highlighted files are placed at the top of the plotted data. Figure 1-11 ASD Document 600555 Rev. A Subsets Customization window. 9 ViewSpec Pro™ User Manual www.asdi.com Chapter 1 ViewSpec Pro This group allows the user to view subset information in a variety of ways. • If nothing is selected in the listbox and Scrolling Subsets equals zero, then the object will display all subset information (14 subsets graph maximum, and no limit on the amount of subsets tabled.) • If there are selections in the listbox and Scrolling Subsets equals zero, then the object will display only those subsets selected. • If nothing is selected in the listbox and Scrolling Subsets is non-zero, then the object will scroll through subset information by the amount defined by Scrolling Subsets. • If there are selections in the listbox and Scrolling Subsets is non-zero, then the object will maintain those selected subsets as permanent subsets and revolve through the remaining subsets in increments of Scrolling Subsets. The following table summarizes the Subsets to Graph variations. Selected Subsets Scrolling Subsets no no Display all subsets. yes no Display only those selected subsets. no yes Scroll through all subsets. yes yes Permanent selected subsets & scroll through remaining subsets. ASD Document 600555 Rev. A 10 Result ViewSpec Pro™ User Manual www.asdi.com Chapter 1 ViewSpec Pro Axis Tab Linear or log scaling and Min/max control of both the X and Y axis. Depending upon the Auto, Min, Max, and Min/Max item selected, the appropriate text boxes will be enabled allowing you to set the axis range. Figure 1-12 Axis Customization window. Font Tab Font control of the Main title, Sub-title, and Axis labeling. The graphed data only supports True Type fonts (because they’re scalable). For the Main Title, Sub Title, and Labels, the user can also select font attributes of Boldness, Italics, and Underline. Figure 1-13 ASD Document 600555 Rev. A Font Customization window. 11 ViewSpec Pro™ User Manual www.asdi.com Chapter 1 ViewSpec Pro Color Tab Color control of foreground, background and shadowing. Figure 1-14 Color Customization window. To adjust colors: 1 Select the desired graph attribute in the Graph Attributes section. The corresponding color for that attribute will be highlighted in the color selection grid. 2 To change the color, either use the mouse to click an alternate color, or use the keyboard arrow keys to move to adjacent colors. As the highlighted color selection changes position, the sample image will be updated with the newly selected color. 3 Finally, Pressing the OK button will update the color parameters of the object. Graph Attributes Desk Background This is the color that surrounds the bounding rectangle of the graph's grid. Desk Foreground This is the color that is used when placing text onto the Desk Background. This includes the main title, sub title, subset/point labels, grid numbers, and axis labels. Shadow Color The rectangles that make up the graph's grid and table and bounded at the bottom/right edges with shadows. To remove the shadows, choose the same color as the Desk Background. ASD Document 600555 Rev. A 12 ViewSpec Pro™ User Manual www.asdi.com Chapter 1 ViewSpec Pro Graph Background This is the color used as the background color of the graph's grid. Graph Foreground This is the color used for the bounding rectangles of the grid, the grid-lines of the graph, and lines that are used to bound some of the plotting methods (like the bounding line around bars of the Bar Plotting Method). Table Background This is the color used in filling the table's rectangle. Table Foreground This is the color used in bounding the table's rectangle, and for the text inside the table. Style Tab Allows control over each plotted spectral line’s point type, line type, and color. Figure 1-15 ASD Document 600555 Rev. A Style Customization window. 13 ViewSpec Pro™ User Manual www.asdi.com 1.3.2 Chapter 1 ViewSpec Pro Legend Clicking on the legend button in the upper right hand corner will open a display window showing the file name(s) and the associated plots. Figure 1-16 1.3.3 Legend Display window. Format After having graphed data change the viewed format of the plotted data by using the Format menu. This is required when using the version 7 file format (.asd) to display anything other than DN. Figure 1-17 Format Spectral Data window. Using the format menu only changes the graphed data and does not create a processed file. ASD Document 600555 Rev. A 14 ViewSpec Pro™ User Manual www.asdi.com 1.3.4 Chapter 1 ViewSpec Pro Print The graphed data can be printed. The printer setup is dependent on the printer drivers installed. Figure 1-18 1.3.5 Print Spectral Data window. Export The graphed data can be exported as a picture or data file. The type of file and picture size can be configured in the export window. Figure 1-19 ASD Document 600555 Rev. A Export Spectral Data window. 15 ViewSpec Pro™ User Manual www.asdi.com 1.4 Chapter 1 ViewSpec Pro Processing files in ViewSpec From the Process pull-down menu, an applicable post-processing option for the selected spectra file(s) can be selected. Figure 1-20 Process pull-down menu. Reflectance/Transmittance: The ratio of the total amount of radiation, as of light, reflected by a surface to the total amount of radiation incident on the surface. Radiometric Calibration: Converts RawDN to radiance or irradiance. Applies only to FieldSpec and HandHeld. Requires additional calibration files that can be purchased from ASD. Please contact your sales associate. The software formula for (ir)radiance spectra is: lampfile calpanelfile inputfile calITG L = ------------------------------------------------------------------------------------------------------------------------------------ calibrationfile inputITG where: • L is the radiance to be calculated (on a channel by channel basis) • lampfile is the calibrated irradiance file for the lamp. • calpanelfile is the calibrated Spectralon reflectance file • inputfile is the unknown, dark current corrected input file ASD Document 600555 Rev. A 16 ViewSpec Pro™ User Manual www.asdi.com Chapter 1 ViewSpec Pro • calITG is the integration time and/or gain of the calibration file • calibrationfile is the dark current corrected raw data collected at ASD • inputITG is the integration time and/or gain of the input file The divisor of is automatically left out in the calculation of an Irradiance (E) measurement. The software “knows” which formula to use by looking at the foreoptic specified in the header of the data file. 1 Irradiance (E), which is the radiant flux () per unit of area, or E = d/dA, given in W/m2. This term is only definable at a given distance from a given radiant energy source, or through a given surface in space, without regard to sources. 2 Radiance (L) is the radiant flux emitted from a source per unit of solid angle () per unit area. Log 1/R (1/T): Converts reflectance or transmittance to absorbance. Absorbance = log(1/Transmittance.) A commonly used math pretreatment, useful for linearizing reflectance data. This expression is often abbreviated as log(1/R). In most cases it is possible to find a linear correlation of log(1/R) data to concentration of an analyte in the target matrix. However, a general derivation relating reflectance to concentration cannot be rigorously derived, such as, the Bouguer-Lambert-Beer law for transmittance. 1st Derivative: Takes the first derivative of the data. The algorithm uses a specified gap distance to skip that number of points to take the differences instead of adjacent data points. Figure 1-21 Derivative gap window. Derivative Spectrum: A spectrum that is the result of applying a derivative transform to the data of the original spectrum. Derivatives of spectra are very useful for two reasons: ASD Document 600555 Rev. A 17 ViewSpec Pro™ User Manual www.asdi.com Chapter 1 ViewSpec Pro 1. First, and second derivatives may swing with greater amplitude than the primary spectra. For example, a spectrum suddenly changes from a positive slope to a negative slope, such as at the peak of a narrow feature (see the figure below). The more distinguishable derivatives are especially useful for separating out peaks of overlapping bands. Sud den chang e in the cu rv e Absorba nce spe ctru m First de r ivative Se con d d eriv ative Figure 1-22 Derivative peaks. 2. In some cases derivative spectra can be a good noise filter since changes in base line have negligible effect on derivatives. For example, scattering increases with wavelength for some biologically active macromolecules causing an increasing slope of the absorbance baseline. The approximation used for the first derivative is: F= [F ( + ) - F ( - )] / 2. A more accurate approximation of the first and higher order derivatives is presented in thorough explanations by Whitaker1 and Morrey2. Still other methods involve a best fit match to the curve on the features of interest and performing higher order derivatives with numerical analysis. 1. Stephen Whitaker and R. L. Pigford, "Numerical Differentiation of Experimental Data", Industrial and Engineering Chemistry, vol. 52, no. 2 February 1960, pp.185 - 187. 2. J. R. Morrey, "On Determining Spectral Peak Positions from Composit Spectra with a Digital Computer", Analytical Chemistry, vol. 40, no. 6, May 1968, pp. 905 - 914. ASD Document 600555 Rev. A 18 ViewSpec Pro™ User Manual www.asdi.com Chapter 1 ViewSpec Pro Derivative spectra yield good signal-to-noise ratios only if the difference of noise levels at the endpoints of the interval is small enough to yield a noise equivalent dF/d calculation much smaller than the absorbance. 2nd Derivative: Takes the second derivative of the data. Parabolic Correction: Background: ASD Full Range instruments should be “warmed up” before being used to collect radiometric data. The reason for this is the inherent variations in detector sensitivity when used under different ambient temperatures. The variations occur in the VNIR array and the SWIR2 detector, but do not appear to be pronounced in the SWIR1 detector (~1000 to 1800 nm). Ratio of Instrument Responses at 10, 30, and 50 minutes to 80 minute warmup period. Figure 1-23 ASD Document 600555 Rev. A Detector Responses during warmup period. 19 ViewSpec Pro™ User Manual www.asdi.com Chapter 1 ViewSpec Pro A sufficient warmup period can be difficult to achieve when the instrument is used in the field – particularly when using battery power alone. The stability of the SWIR1 detector offers a possible solution: Using the endpoints of SWIR1 and the shape of the response change curves, it is possible to mathematically characterize and adjust for the temperature-dependent sensitivities of the two variable ranges. Since the varying spectral regions appear somewhat parabolic, a pair of partial parabolas inserted into what otherwise is an identity matrix can be used to correct the temperature sensitive channels. This is known as Parabolic Correction (see ftp://ftp.asdi.com/Technical Documents/pcorrect.pdf for further details). This process integrates data by applying parabolic corrections at the splice point between the spectrometers for radiance and irradiance only. Input files selected for this process must be ASD binary Radiance or Irradiance files. During this operation the following dialog will be displayed: Figure 1-24 Splice Point Vertex window. Choose the VNIR vertex point (wavelength) for the parabolic correction. Then choose the SWIR2 vertex for its parabolic correction. Splice Correction: A bias value is calculated for the VNIR and SWIR2 regions and they are offset to match the SWIR1 at the splice point. This is usually done only for presentations and documentation or when using data to match against a spectral library, it is not meant to correct the data. Lambda Integration: Integrates or averages wavelengths over a certain area that is set by the end user. Quantum Intensity: Converts from Irradiance (w/m^2/nm/sr) to Micro Einsteins (µE/s/m^2/nm). ASD Document 600555 Rev. A 20 ViewSpec Pro™ User Manual www.asdi.com Chapter 1 ViewSpec Pro Interpolate: Interpolates data to 1 nm intervals and will truncate data to a user specified spectral range. This feature is especially useful for Dual UV/VNIR target and reference comparisons. Input files selected for this process must be ASD binary data files. When interpolation is complete, the following dialog will be displayed: Figure 1-25 Interpolation Result window. Statistics: This process applies standard statistical functions; Mean, Median and Standard Deviation to the selected files. Mean, Standard Deviation, and Median distinguishes the noise of each spectrometer. These statistical operations cannot be performed on single files. Figure 1-26 Statistics window. NEDL: Noise Equivalent Delta Radiance- a measure of sensor performance and radiometric precision. To collect data for the NEDL (Noise Equivalent change in Radiance) properties of the instrument, no foreoptic is attached, in the configuration for calibration with bare fiber, at 10 spectrum averaging. 30 spectra are saved and the standard deviations from the means at all channels are calculated and converted to radiance data. This data will tell what the true performance of the unit is like and that it is meeting noise specifications. ASD Document 600555 Rev. A 21 ViewSpec Pro™ User Manual www.asdi.com Chapter 1 ViewSpec Pro ASCII Export: This process converts data files into ASCII text files. Files can be exported Individually or similar files can be combined into an array and conveniently output as a single file. Header data can also be included with the data files or exported independently. Files exported with this utility can be imported into many analysis, spreadsheet or database programs. When ASCII Export is selected, the following Dialog Box is displayed: Figure 1-27 ASCII Export window. Import ASCII X,Y: Converts XY (wavelength, data value) text file to ASD binary file format. ASD Document 600555 Rev. A 22 ViewSpec Pro™ User Manual www.asdi.com Chapter 1 ViewSpec Pro Jcamp-DX Export: This process converts data files into JCAMP-DX text files. Files can be exported Individually or similar files can be combined into an array and conveniently output as a single file. Header data can not be exported in JCAMP-DX format. Files exported with this utility can be imported into many Chemometrics and multivariate analysis programs such as The Unscrambler from CAMO or GRAMS/32 from Galactic Industries. Contact the marketing department at ASD (303-444-6522) for more information about the application of this technology. The following dialog box is shown when JCAMP-DX is selected. Figure 1-28 Jcamp-DX Export window. Custom…: Several functions have been provided to enable some limited data manipulation. These functions will multiply, divide, add or subtract the data in the selected binary data file(s) by a constant OR by the data in a single binary data file. At this time, it is NOT possible to select the input files into the denominator of a ratio (divide) operation. ASD Document 600555 Rev. A 23 ViewSpec Pro™ User Manual www.asdi.com Figure 1-29 ASD Document 600555 Rev. A Chapter 1 ViewSpec Pro Custom Functions window. 24 ViewSpec Pro™ User Manual www.asdi.com INDEX INDEX Numerics P 1st Derivative 17 2nd Derivative 19 Parabolic Correction 19 Plot Tab 9 Print 15 Processing files in ViewSpec 16 A Apply 8 ASCII Export 22 Axis Tab 11 Q Quantum Intensity 20 C R Color Tab 12 Custom 23 Radiometric Calibration 16 Reflectance/Transmittance 16 E S Export 8, 15 Font Size 7 Font Tab 11 Format 14 Setup 1 Splice Correction 20 Statistics 21 Style Tab 13 Subsets Tab 9 support ii G T General Tab 7 graph 6 properties 7 Graph Attributes 12 Grid characteristics 7 technical support ii Title and subtitles 7 trademarks ii F I Import ASCII X,Y 22 Interpolate 21 J V View File Header Information 4 Viewing style 7 Z Zoom 6 Jcamp-DX Export 23 L Lambda Integration 20 Legend 14 Log 1/R (1/T) 17 M Maximize 8 N NEDL 21 Numeric Precision 7 O Original 8 ASD Document 600555 Rev. A XXI ViewSpec Pro™ User Manual