1
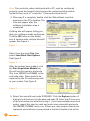
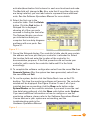
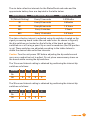
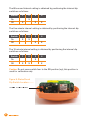
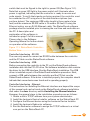
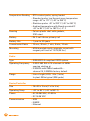
StatusCheck™ Quick Start Guide
and Operators Manual
StatusCheck™ 2.4GHz
StatusCheck™ Quick Start Guide and
Operators Manual
Disclaimer:
This manual is provided for information purposes. Timken makes no
warranty of any kind with regard to
this material. Timken will not be
held liable for omissions or inconsistencies that may be found within
this manual or for incidental or
consequential damages in connection with this manual. Information
in this manual is subject to change
without notice. The information in
this manual is not all-inclusive.
Product Support:
Should you have any questions
regarding this material or items
that were not covered in this
manual please contact Timken's
StatusCheck™ product support
group at +1-330-471-3369 or at
[email protected].
In the event that you are not able to
solve a problem related to this
product, technical help is available
for those who purchased the
product support package from
Timken. Product support is available
for one year from date of purchase.
To better serve you, please have
the hardware serial numbers and
software version of your system
available. Be prepared to explain
the exact nature of the problem.
Returns:
A Return Goods Authorization
(RGA) number is required for all
product returns. Please call the
Product Support Group at +1-330471-3369 for an RGA# and return
shipping instructions.
Internet:
www.timken.com
Software:
You have the non-exclusive right to
use this software on only one
device at a time. For network
systems, you have the nonexclusive right to install this
software on only one server per
license purchased. Read/write
access is limited to the number of
licenses purchased.
Software upgrades will periodically
be made available to the registered
users. These upgrades will be free
to registered users who have
purchased the product support
package offered with this system.
To purchase a support contract,
please contact your Timken sales
representative.
StatusCheck Quick Start Guide
This guide assumes that you have all of the components supplied with this
system including a serial or USB cable, a controller, at least one
StatusCheck™ end node, and a monitoring software installation disk.
To install this system you will need your own PC running Windows® 2000 (or
above) that has a CD drive and at least one available serial or USB port. You
also will need at least one machine or device that needs monitoring.
As an overview of the installation, you will mount StatusCheck end nodes
on the machines or devices that need monitored. Next, you will connect
the controller to the PC with a serial cable. Then install the monitoring
software on your PC and configure the monitoring software to recognize
the StatusCheck components in your system. After which, you will test the
monitoring system.
1. Mount the StatusCheck end nodes on the machines or devices that
you want to monitor. Make a note of each StatusCheck end node’s ID
so that you can configure the software that you will install in step 3.
You can use the magnetic mounting option to place each StatusCheck
end node, see the Hardware Operations Manual for more details or for
other mounting methods. Using the toggle switch on the bottom of the
end nodes, turn the units on before you mount them. When the units
are turned on, you will see a light blink on the top of the end nodes.
Once the locations are verified, you may want to permanently mount
the units and adjust the data collection interval as desired. Please see
the hardware manual for additional details on mounting and data
collection interval adjustments.
2. Insert the software installation disk in the CD drive of the PC. The
installation software should auto load, if it does not, run the
executable file on the installation disk called SCCMS_X_XX_XXX.exe.
The X’s are replaced by version numbers on the software CD. Follow
the installation instructions as they appear on the PC screen. Taking
all the defaults will produce a functional system. Do not forget to
remove the installation CD from the drive when this step is done.
3. Install the serial or USB cable between the controller and the PC, see
operators manual for controller data interface details. Connect the line
cord, supplied with the controller, to line power. Turn the controller’s
power switch on (to the right). The LED in the power switch will
illuminate when power is applied.
1
Note: The controller, when interfaced with a PC, must be configured
properly; open the hinged lid and ensure the router/controller switch
inside the box is set to “controller.” Close and secure the lid.
4. After step 3 is complete, double click the StatusCheck icon that
appears on the PC’s desktop. The
icon will appear after the
software installation step is
completed.
A dialog box will appear telling you
that your software needs configured.
Click the OK button on the dialog
box. A window with multiple tabs will
appear. See Figure 1.
Figure 1 ————————————
Select from the menu File, then
select Load Quick Start Options.
See Figure 2.
Figure 2 ————————————
After the options have loaded, click
the Data Acquisition Module tab.
You will see five generic end node
ID’s, from FEE0001 to FEE0005, in the
end node table. These need to be
replaced by the ID numbers specific
to your system. See Figure 3.
Figure 3 ————————————
5. Select the row with end node ID FEE0001. Click the Replace button. A
dialog box will ask you for the new end node ID. Enter the ID from one
of the end nodes you installed in step 1. If you have installed more end
nodes, repeat this step for each end node using rows with end node
IDs FEE0002, FEE0003, and so on. If there are rows present that do not
represent end nodes you have placed in the field, double click on the
2
activation/deactivation field column for each non-functional end node.
The Yes field will change to No. Also, note that if more than five units
are being installed, you must add rows to represent these additional
units. See the Software Operations Manual for more details.
6. Select the first row in the
controller table. Click the Delete
button. Click the Find button. A
Notepad file is displayed
showing all of the com ports
scanned in finding the controller.
The Notepad display can show
you information about your
computer that can help diagnose
problems with com ports. See
Figure 3.1.
Figure 3.1 ———————————
7. Cancel the Notepad display. The controller’s table should now contain
the address and com port that your controller is attached to. Select
the location field and enter the location of the controller for
documentation purposes. If the Find procedure did not locate your
controller, add a row to the controller table and fill in the fields
accordingly.
8. To complete the software configuration select from the menu File then
Generate System. After the system has been generated, select from
the menu File and Exit.
9. To run the system, double click the StatusCheck icon on the PC’s
desktop. This time the monitoring software will execute. The controller
window will be displayed. See Figure 4 below. To see if all of your
installed devices are working click the Show radio button under
System Monitor on the controller window. If you want to see the realtime data being gathered, click the Show radio button under Grapher.
If you need additional information on how to configure or use the
monitoring software, please refer to the Software Operations Manual.
If some devices in your system are not working, see the
troubleshooting guide in the
Hardware Operations Manual.
Figure 4 ————————————
3
StatusCheck Operators Manual
System Overview:
This manual provides the necessary documentation for the installation and
operation of the Timken StatusCheck™ Condition Monitoring System. The
StatusCheck System is a cost-effective online monitoring system for
predicting the health and operating condition of machinery components.
The StatusCheck end node is self-contained with battery powered sensors
and electronics. The end node attaches directly to the outer frame or
housing of a machine. It uses wireless radio frequency (RF)
communications to transmit sensed physical characteristics (vibration
parameters and temperatures) of the machine. A transmission distance of
up to one kilometer (1⁄2 mile) line-of-sight (open field) or 300 meters (328
yards) in a typical plant environment can be achieved. Multiple
StatusCheck end nodes (up to 100) can be in use on one or more
machines, all of which send their signals back to a controller.
The controller connects through a serial, USB or Ethernet port to a PC that
displays the data. The data consists of ambient temperature, probe
temperature and vibration parameters from a dual axis accelerometer in
acceleration or velocity. The StatusCheck software is used for real-time
monitoring, data logging and triggering alarms once the collected data
exceeds user-defined thresholds indicated by yellow and red conditions.
By observing the data over time, the user can evaluate the operating
condition of the machines. The data plotted in Figure 5 versus time either
can be operating temperature or a vibration measurement. The machine
measurement trends increase as the machine approaches a failure mode.
The yellow line indicates a warning condition, whereas the red line
represents a critical alarm condition. The goal is to detect conditions that
require maintenance action before a problem becomes severe and causes
unplanned machine downtime or collateral damage.
Applications:
The StatusCheck monitoring system is suitable for a wide range of
applications. The machines that can be monitored include pumps, fans,
rolls, gearboxes, motors, bearings or other industrial applications requiring
the measurement of steady-state temperature and vibration.
4
Figure 5: Operation of StatusCheck™
How it Works:
The StatusCheck system collects
temperature and vibration signals for
a one second period during a
transmission cycle. The vibration signal consists of 4,096 data points over
this time interval. The vibration data is then statistically parameterized into
five main statistical readings for each accelerometer axis. This
parameterized data, along with the temperature readings, is transmitted to
a controller, which connects to a PC for analysis. The StatusCheck realtime tracking software compares the parameterized data to adjustable
user-defined thresholds and to trigger alarms. This technique allows easy
interpretation of a machine’s operating condition over time.
It is important to note that this system will not indicate the exact system
problem only that a problem exists. A more advanced diagnostic system
can be used once a problem is identified. This system is fully turn-key and
installs quickly, with minimal required training, for a simple assessment of
a machine’s operating condition.
System Components:
At a minimum, the system is composed of one controller, one end node
and one software package. Routers may be required to extend the range
from the end node(s) to the controller. The system can be composed of a
maximum of 100 end nodes per controller. Mounting fittings, mounting
plates, spare o-rings, cabling and spare batteries also are available from
Timken. Contact your Timken representative to obtain these items.
End Node:
The StatusCheck end node operates in the 2.4 GHz ISM band and is a
direct sequence spread spectrum. There are many benefits to using a
spread spectrum transmission scheme. The StatusCheck device complies
with FCC- and EU-based RF requirements and will typically not interfere
with other wireless devices.
Testing has been successfully performed in plant environments without
significant loss of data. Transmission distance is decreased and data loss
is increased with obstructions and noise interference.
5
Figure 6: StatusCheck
end node and a listing of the
main components.
LED Indicator
Lid
Battery
Temperature
Probe
Signal Processing
Board
Transmitter
Board
Gasket
Base
Accelerometer Type and Measurement Axes:
The accelerometer is a dual axis, 18 G,
cantilevered beam, MEMS device and is
located on the center post of the end node.
The accelerometer is used for sensing
mechanical vibrations. The two axes of
measurement are referenced in Figure 7.
Figure 7: Vibration Sensing Axis Designation
Data Collection Intervals:
Five different data collection intervals are available for use with this
product. For example, a 15-second data collection interval denotes that
once every 15 seconds the end node will activate and collect 4,096 data
points over an approximate one second period. Next, it will parameterize
and transmit data prior to returning inactive. A 60-second data collection
interval denotes that once every 60 seconds the end node will activate
and collect 4,096 data points over an approximate one second period.
Next, it will parameterize and transmit data prior to returning inactive.
The data collection interval and environmental conditions will determine
the life of the battery. The factory interval setting is every 15 seconds. It is
recommended that you initially retain the factory setting for network
configuration then switch to a longer data collection interval to conserve
battery life.
6
The six data collection intervals for the StatusCheck end node and the
approximate battery lives are depicted in the table below:
Interval Setting
Data Collection Interval
Approx. Battery Life
15 (Default Setting)
Every 15 seconds
4.5 Months
30
Every 30 seconds
9 Months
60
Every 60 seconds
1.5 Years
300
Every 5 minutes
3 Years
600
Every 10 minutes
4.5 Years
The data collection interval is adjusted using dip switches located on the
signal processing board inside the end node case. As shown in Figure 8,
the dip switches are located on the left side of the board and can be
switched on or off using a pencil tip or small screwdriver (the ON position
is up). These switches are adjusted according to the tables below to
obtain the desired data collection intervals.
Caution: Turn the unit power OFF before adjusting the dip switches and
use a non-conductive tool to adjust. Do not place unnecessary stress on
the boards while moving the dip switches.
The 15-second interval setting is obtained by positioning the internal dip
switches as follows:
Switch
On
Off
1
2
3
I I I I
X
X
X
4
X
The 30-second interval setting is obtained by positioning the internal dip
switches as follows:
Switch
On
Off
1
2
3
I I I I
4
X
X
X
X
7
The 60-second interval setting is obtained by positioning the internal dip
switches as follows:
Switch
On
Off
1
2
3
I I I I
4
X
X
X
X
The five-minute interval setting is obtained by positioning the internal dip
switches as follows:
Switch
On
Off
1
2
3
I I I I
X
4
X
X
X
The 10-minute interval setting is obtained by positioning the internal dip
switches as follows:
Switch
On
Off
1
2
3
I I I I
4
X
X
X
X
Caution: Do not move switch four to the ON position (up); this position is
used for calibration only.
Figure 8: StatusCheck
Dip Switch Location ——
Location of Dip Switches
8
End Node Accelerometer Offset Adjustment:
1. Turn switch unit OFF (LED is not blinking).
2. Turn switch four to the ON position. Remaining switches do not require
adjustment.
3. Turn end node power ON.
4. Within five seconds, position the end node as shown in Figure 8.1
until the LED light flashes.
5. Turn end node power OFF.
6. Turn switch four to the OFF position.
7. While looking at LED light, turn end node power ON. LED light should
flash at least one time.
8. Offset adjustments are complete.
Figure 8.1: StatusCheck End Node
Accelerometer Offset Adjustment
Orientation ———————————
Temperature Probe Description:
The StatusCheck end node has an external spring-loaded temperature
probe that measures the surface temperature of the machinery to which it
is attached. The RTD element, positioned at the probe tip, contacts the
machine for quick temperature measurement.
The temperature probe is available in three different versions:
S = Standard (magnetic flush mount or with use of tack weld plate)
L = Long Probe (for use with threaded nipples or for internal
temperature measurements)
CXX = Custom (C followed by exact length from uncompressed tip to
bottom of flange)
Note: The custom length option gives customers the ability to extend the
range of the probe to contact internal interfaces of a monitored machine.
This feature can be used to obtain bearing cup O.D. temperatures as well
as other important internal temperature values. Temperature probe length
is specified when placing a StatusCheck end node order.
9
Mounting Methods:
The StatusCheck end node attaches externally to the frame of the
monitored machine. End node mounting must not interfere with normal
machine operations.
The StatusCheck end node can be mounted at any location along the
machinery frame or housing. For best results, it should be positioned as
close as possible to the source of vibration. This provides the best signal.
The StatusCheck end node can be
permanently or temporarily secured
to the monitored machine. The
magnet mounting allows movement
of the end node to other locations for
quick testing, however the
recommended mounting methods
are the threaded nipple or tack weld
plate. Threaded mounting options
are shown on Figure 9.
Figure 9: Threaded Mounting Options
Installation of the End Node:
The end node can be mounted to a machine using the magnet, the
threaded nipple or tack weld plate. Testing has shown that the use of
threaded mounting results in improved accuracy of high frequency
vibration measurement. Therefore, the threaded mount method is
recommended.
Caution: The magnet pull force is 110 N (25 lbs.), which may not be
sufficient to hold the end node in place on vibrating machinery. This may
create an overhead drop hazard.
Threaded mounts are available in 16M threaded fittings or plates that are
tack-welded or riveted to the machine. If the plate is used, it should be
rigidly attached to a relatively flat portion of the machine surface. When
using the threaded mount, a torque of 3.95Nm (35 in-lbs.) will yield
accurate measurements. Torque in excess of 3.95Nm (35 in-lbs.) may
damage unit housing.
The end node can be mounted in any orientation. The end node axes
should be parallel to the desired measurement axes. Refer to Figure 7 for
end node axes orientation. The Z-axis is parallel to the direction of the
temperature probe. The X-axis is positioned along the direction of the
10
word “Timken” shown on the end node case. For tracking purposes, the
customer should also keep track of the mounting location of each unit so
that this information can be entered into the software package.
End Node Power:
Located on the bottom of the end node is an ON/OFF
toggle switch that must be flipped for transmissions to
commence. Note that a red LED light on top of the end
node blinks after each transmission. The first
communication occurs upon power ON.
OFF
I
ON
End Node Battery Replacement:
1. The StatusCheck software will give notification that an end node has a
low battery. After initial notification, there are still several weeks until
the end node will stop operating. Please use part number SCVT589001
when ordering a replacement battery.
2. Remove the end node from the machine.
3. Turn off the end node.
4. Take the unit to a clean environment and wipe off the exterior prior to
opening the cover.
5. Open the end node by loosening the four cross tip screws visible from
the bottom housing.
6. Remove the C-size battery and dispose of in accordance with local
procedures.
7. A 3.0 VDC lithium battery must be used. See Figure 10 for proper
orientation.
8. Replace the cover, making sure the housing gasket is properly seated
and that the light pipe (tube) is positioned over the square white LED
on the main electronics board.
Reinsert the screws and tighten to
1.13 Nm (10 in-lbs).
9. Power the end node on and verify
that the unit LED flashes at least
once.
10. Re-install the end node on
monitored machine.
Figure 10: StatusCheck End Node
Battery Orientation ————————
RF Network Overview:
The StatusCheck System uses radio frequencies (RF) to transmit the data
from the end nodes to the data collection computer. The network uses
11
IEEE 802.15.4 radios with Timken-designed network software. The radios
operate at one of 16 channels between 2.400 and 2.483 GHz and use Direct
Sequence Spread Spectrum (DSSS). The system is designed to form point
to multi-point networks or cluster-tree networks. The network is self
forming and requires minimal actions by the customer.
The minimum hardware required to form a network includes end nodes, a
controller and a computer for data collection and storage. The point-to-point
network will work as long as all end nodes are within transmission distance
of the controller. Routers, sometimes called repeaters, are added to the
network to increase the distance from the controller to an end node. The
routers allow a branch structure to be added to the network, with the end
nodes attaching to the network along the branches formed by the routers.
Network Set-Up:
The network is auto-configuring. Turn on the controller and the end nodes.
End nodes that require a router will not be received. Add routers until all
end nodes are received.
The StatusCheck Controller:
The StatusCheck controller is
packaged in a box with dimensions of
18 x 23 x 15 cm (7 x 9 x 5 inches) and
is shown in Figure 11. The box is IP65
rated so that it can be mounted in
harsh environments. It can be
configured for RS-232, USB or
Ethernet data link. A power line and a
data cable connect to the controller.
No external antenna is allowed.
Figure 11: StatusCheck Controller ——
Controller:
The controller is the device that gathers the data from the end nodes and
transfers it to a PC running the StatusCheck software. The device in Figure
11 can function as a controller or a router node. To use the device as a
controller, open the hinged lid and set the router/controller switch inside
the box to “controller.” After the router/controller switch position has been
changed, the power switch must be turned off then on again to establish
the new router/controller switch setting. Close and secure the lid.
The controller, supplied in AC and DC versions, connects to an appropriate
power source. Located on the bottom of the controller is an ON/OFF toggle
12
switch that must be flipped to the right for power ON (See Figure 11.1).
Note that a green LED light in the power switch will illuminate when
power is applied, indicating that the controller is ready to receive end
node signals. To verify that signals are being received, the controller must
be connected to a PC using one of the data interface options (see
sections below). The maximum USB cable length is three meters (nine
feet) and the maximum RS-232 cable is 15 meters (50 feet). If using the
Ethernet option, use an RJ-45 Ethernet cable. The StatusCheck software
package must be installed prior to viewing the real time end node data on
the PC. A description and
explanation of the software is
included on page 14 of this manual.
Please refer to the Software
Operating Manual for further details
on operation of the software.
Figure 11.1: StatusCheck Controller –
Bottom View ——————————
Controller Interfacing - RS-232:
The user only needs to connect an RS-232 cable between the controller
and the PC that runs the StatusCheck software.
Controller Interfacing - USB:
Before connecting the controller to the PC, put the StatusCheck software
installation disk into the PC’s CD drive. The software installation disk contains
the driver for the USB interface. Run the StatusCheck installation. The USB
driver is installed as part of the StatusCheck installation procedure. Next,
connect a USB cable between the controller and the PC that runs the
StatusCheck software. If the driver is installed properly, the computer should
indicate that a new device was found and is operating properly.
Controller Interfacing - Ethernet:
The instructions for installing the Ethernet interface are beyond the scope
of this manual and can be found on the StatusCheck software installation
disk under the docs directory entitled Installing the Ethernet Interface.
However, the general steps in the installation procedure are as follows:
1. Obtain a static TCP/IP address from your system administrator.
2. Install the Lantronix Device Installer software on the StatusCheck PC.
3. Configure the Ethernet device using the Lantronix Device Installer.
4. Install the Lantronix Redirector software.
5. Run the Redirector software to assign the TCP/IP address to a virtual
com port on the StatusCheck PC.
13
Using Router Nodes:
The router node is a device that is used to extend the range of the radio
messages sent from the end nodes to the controller. The router receives
radio messages from the end nodes and transmits them toward the
controller. To use the device as a router, open the hinged lid and set the
router/controller switch inside the box to “router” (see Figure 11).
After the router/controller switch position has been changed, the
power switch must be turned off then on again to establish the new
router/controller switch setting. Close and secure the lid.
The router, supplied in AC and DC versions, connects to an appropriate
power source. Located on the bottom of the router is an ON/OFF toggle
switch that must be flipped to the right for power ON (see Figure 11.1).
Note that a green LED light in the power switch will illuminate when power
is applied, indicating that the router is ready to receive end node signals.
For the router to be effective, it must be within RF range of the end nodes
it services as well as within range of the controller. If the router is not in
range of the controller, it must be in range of another router that is in
range of the controller. The router indicates that it is not in range of the
controller by flashing its power switch LED. When the router is within
range, the LED stops flashing and is continuously lit.
You can determine if the end node signals are traveling through the router
to the controller by viewing the System Monitor display in the StatusCheck
software. If the signals are not being delivered through the router, the
System Monitor display will indicate that the end nodes and the router
services are not working. Move the router or add more routers to your
system if the end node signal is not reaching the controller.
You can use the battery power supplied with the router while moving it into
its best RF reception position. After the best RF position is determined, the
customer should wire the router to the appropriate main power supply.
Timken StatusCheck Software:
The Timken StatusCheck software is a user-friendly, Windows-based
package used to trend temperature and vibration data to monitor the
health of industrial machinery. A wireless end node sends data from the
machine being monitored to the controller, which is connected to a PC via
a data interface. Timken StatusCheck software is fully OPC compliant.
The Timken StatusCheck software is used for real time monitoring, data
logging and triggering alarms once customer-defined thresholds are
14
exceeded. Alarms can generate e-mail messages that may then be routed
to pagers, cell phones or PDA’s for maintenance notification.
Description of Parameterized Data:
The following parameterized data is collected:
• Z-Axis acceleration: mean, peak, standard deviation, kurtosis
• Z-Axis velocity: RMS
• X-Axis acceleration: mean, peak, standard deviation, kurtosis
• X-Axis velocity: RMS
• Ambient temperature (located inside enclosure on signal
processing board)
• External probe temperature (located at tip of spring-loaded probe)
The software includes a date/time stamp for each data point received.
Description of Vibration Parameters:
Refer to Figure 12 for a visual description of the vibration parameters.
The mean signal indicates the orientation of the StatusCheck unit relative
to gravity. The mean signal will not change even as the monitored
machine enters fault condition. A mean signal of -1 to +1 G is expected.
The peak signal is the highest level signal recorded during data collection
and is measured in Gs. This is a key parameter that will show substantial
increases as the monitored machine enters fault condition. Only the single
largest data point taken from all the samples is used to determine this
value. Note also that peak is the distance from the mean axis and is a
positive reading.
The standard deviation is calculated over the data collection interval and
is measured in Gs. This parameter increases as the monitored machine
enters fault condition.
The Kurtosis is an indication of the sharp peaks in the distribution of the
collected data and is unit less. This parameter is a more sensitive
indicator of failure mode. This parameter is often useful in detecting
impulsive forces even when superimposed on stronger, lower frequency
components.
RMS velocity is derived from acceleration data using an FFT and
calculated as an RMS value.
15
Figure 12: StatusCheck Vibration Parameters
Approximating Alarm Settings:
For a first approximation of alarm settings, gather data for base line
measurements on normally operating machines and record the readings
over about 20 minutes of data collection. Average the base line data. Set
the vibration warning threshold to be 1.5 times the base line average and
set the vibration critical thresholds to be 2.0 times the base line average
for the alarm conditions. These guidelines were established based on
previous lab and field test results and should be customized for specific
customer applications.
The user establishes alarm thresholds after determining the base line
measurements of a normally operating system. For example, if normal
operation of a machine is at a peak acceleration of 2 Gs with a standard
deviation of 0.6, a Kurtosis of 8, a velocity RMS of 7.62mm/s (0.3"/second)
and a temperature of 82.2° C (180° F), then alarm points could be set based
on these readings as follows:
Peak acceleration warning threshold = 1.5 x average = 3 G
Peak acceleration critical threshold = 2 x average = 4 G
Standard deviation warning threshold = 1.5 x average = .9 G
Standard deviation critical threshold = 2 x average = 1.2 G
Kurtosis warning threshold = 1.5 x average = 12
Kurtosis critical threshold = 2 x average = 16
Velocity RMS warning threshold =1.5 x average = 11.4mm/s
Velocity RMS critical threshold = 2 x average = 15.2mm/s
16
Temperature warning threshold = 1.2 x average = 102° C (216° F)
Temperature critical threshold = 1.5 x average = 132° C (270° F)
It is important to note that these alarm threshold guidelines are possible
starting points.
Care and experience are required to determine thresholds. The goal is to
identify problems before causing damage to equipment and/or material.
Trending software shows data points versus time to determine variations
from the established base line. Additional trending information can be
found in the Software Operations Manual.
System Software Installation Requirements:
Windows 2000, NT or XP
Free hard drive disk space of 50 MB
Accessible RS-232, USB or Ethernet
Installation of the Software:
The software installation disk is set up to be as user friendly as possible.
Once the installation disk is accessed, a series of questions are asked to
allow the user to obtain the proper installation. For most customers, the
default values can be selected. Reference the Software Operations
Manual and Quick Start Instructions for further details.
Using End Node ID Numbers to Configure Software:
To configure the software the user will need to enter the serial numbers of
all the end nodes that you plan to install. The serial numbers can be found
on the part number label located on bottom of the end node base. The user
also will need to enter the location of each end node to facilitate tracking.
Product Technical Specifications:
End Node:
Size
• 10 x 10 x 6 cm (4 x 4 x 2.2 in)
Operating Temp
• -40° to 85° C (-40° to185° F)
Accelerometer
• 18G MEMs cantilevered beam
2-axis accelerometers
• 0 to 1.5 KHz bandwidth, 57mV/g Sensitivity
Parameterized data – acceleration – mean,
peak, standard deviation, kurtosis and
velocity – RMS
17
Temperature Reading • RTD contact probe, spring loaded
• Standard probe: low thermal mass temperature
range -40° to 177° C (-40° to 350° F)
• Stainless probe: -40° to 232° C (-40° to 450° F)
• Ambient temperature with Board mounted IC
-40° to 85° C (-40° to 180°F) +/- 2° C
Housing
• Celcon plastic shell with gaskets,
IP67 rated
Battery
• 3V C-cell lithium primary cell
Battery Life
• 1 year to 4.5 years
Transmission Rates
• 15 sec., 30 sec., 1 min., 5 min., 10 min.
Mounting
• M16 threaded nipple, magnetic mount with
magnet pull force of 110 N (25 lbs.)
Radio:
Type
• IEEE 802.15.4 compliant DSSS system
Operating Frequency • 2.400-2.483 GHz in 16 channels at 5MHz
spacing starting at
• 2.405GHz with 2MHz bandwidth –
channel 15, 2.425GHz factory default
Range
• Line-of-sight (LOS): 1 Km (1 mile)
In plant: 300m typical (328 yards)
Router/Controller
Size
18
• 18 x 23 x 15 cm (7 x 9 x 5 in.)
Operating Temp
• -40° to 85° C (-40° to185° F)
Power
• AC 95-260 VAC, 47-63 Hz
• DC 18-36 VDC
Communication
• USB
• EIA232
• Ethernet
Troubleshooting:
End node does not turn on:
• Be sure toggle switch is in the ON position.
• Replace battery.
• Check for lose connection between battery and the electronics board
• If none of the above suggestions corrects the problem, then the unit is
damaged and should be replaced.
Loss of signal:
An end node signal can be lost for numerous reasons:
• Because the end nodes are battery operated, they will have a limited life.
After a certain predictable period of operation, these batteries will need
to be replaced. This will become apparent from the software, as a
warning signal will be generated indicating that the end node battery
voltage is low. This will allow a convenient scheduling of battery
replacement prior to the loss of the RF signal.
• If the end node is located too far away from the controller (especially if
not in line of sight). In this case, an additional router can be added to the
system or the placement of the original controller can be revised to
re-acquire the signal.
• Damaged end node. The end node assembly may be damaged due to
over-heating, compromised seals, loose battery wire, smashed, etc. If
damage occurs, the current end node will need to be replaced and the
PC software will need to be informed of the switch. This ensures it will
look for the new end node ID number rather than the old one. The
software allows for switching out damaged end nodes with new ones by
using the Replace Option. It also allows for the addition of new end
nodes in the StatusCheck software configuration routine.
Data distortion:
If the data that is being collected seems distorted it could be caused by:
• Water contamination in the end node. Check to see if water has gotten
internal to the packaging.
• Operations around a large source of EMF that interferes with some or all
of the transmitted data. If the data looks suspect, try moving the unit to a
new location to see if the problem still exists.
19
Inability to catch problems:
• Be sure that the thresholds are set appropriately for each given
operating condition.
• Be sure that the proper selection of the accelerometer internal to the
end node is being used for each operating condition.
• Be sure the end node is mounted properly and in a location as close to
the source of vibration (or heat) as possible.
• Determine if the machine that is being monitored fails in a way that can
be monitored by these devices.
Too many false alarms:
• Be sure thresholds are set properly.
• Check that the transient conditions of the application are accounted for.
This might mean trending more data points or adjusting the number of
consecutive data points that must surpass the threshold prior to
alarming.
Controller not receiving:
• Be sure the router/controller switch, located inside the box, is set to
“controller.”
• Be sure line power is connected to the controller. Move power switch,
located on bottom of controller, to the on (right) position. A green LED
should illuminate with power on.
• Check for proper data interface connections. If using USB cable as a
data interface, be sure drivers are installed.
• Be sure the proper com port is selected in the StatusCheck software.
See step 6 in the quick start guide.
20
Bearings • Steel •
Precision Components • Lubrication •
Seals • Remanufacture and Repair •
Industrial Services
www.timken.com
StatusCheck™ is a trademark of
The Timken Company
Windows® and Windows NT®
are registered trademarks of
The Microsoft Corporation
Timken® is the registered trademark of
The Timken Company.
©2006 The Timken Company
Printed in USA
100 10-06-29 Order No. 10077