1
Oracle® Database
Real Application Testing User’s Guide
11g Release 2 (11.2)
E16540-03
October 2010
Oracle Database Real Application Testing User's Guide, 11g Release 2 (11.2)
E16540-03
Copyright © 2008, 2010, Oracle and/or its affiliates. All rights reserved.
Primary Author:
Immanuel Chan
Contributors: Ashish Agrawal, Lance Ashdown, Pete Belknap, Supiti Buranawatanachoke, Romain Colle,
Karl Dias, Kurt Engeleiter, Leonidas Galanis, Prabhaker Gongloor, Shantanu Joshi, Mughees Minhas,
Valarie Moore, Yujun Wang, Keith Wong, Khaled Yagoub, Hailing Yu
This software and related documentation are provided under a license agreement containing restrictions on
use and disclosure and are protected by intellectual property laws. Except as expressly permitted in your
license agreement or allowed by law, you may not use, copy, reproduce, translate, broadcast, modify,
license, transmit, distribute, exhibit, perform, publish, or display any part, in any form, or by any means.
Reverse engineering, disassembly, or decompilation of this software, unless required by law for
interoperability, is prohibited.
The information contained herein is subject to change without notice and is not warranted to be error-free. If
you find any errors, please report them to us in writing.
If this software or related documentation is delivered to the U.S. Government or anyone licensing it on
behalf of the U.S. Government, the following notice is applicable:
U.S. GOVERNMENT RIGHTS Programs, software, databases, and related documentation and technical data
delivered to U.S. Government customers are "commercial computer software" or "commercial technical
data" pursuant to the applicable Federal Acquisition Regulation and agency-specific supplemental
regulations. As such, the use, duplication, disclosure, modification, and adaptation shall be subject to the
restrictions and license terms set forth in the applicable Government contract, and, to the extent applicable
by the terms of the Government contract, the additional rights set forth in FAR 52.227-19, Commercial
Computer Software License (December 2007). Oracle USA, Inc., 500 Oracle Parkway, Redwood City, CA
94065.
This software is developed for general use in a variety of information management applications. It is not
developed or intended for use in any inherently dangerous applications, including applications which may
create a risk of personal injury. If you use this software in dangerous applications, then you shall be
responsible to take all appropriate fail-safe, backup, redundancy, and other measures to ensure the safe use
of this software. Oracle Corporation and its affiliates disclaim any liability for any damages caused by use of
this software in dangerous applications.
Oracle is a registered trademark of Oracle Corporation and/or its affiliates. Other names may be trademarks
of their respective owners.
This software and documentation may provide access to or information on content, products, and services
from third parties. Oracle Corporation and its affiliates are not responsible for and expressly disclaim all
warranties of any kind with respect to third-party content, products, and services. Oracle Corporation and
its affiliates will not be responsible for any loss, costs, or damages incurred due to your access to or use of
third-party content, products, or services.
Contents
Preface ................................................................................................................................................................ vii
Audience...................................................................................................................................................... vii
Documentation Accessibility .................................................................................................................... vii
Related Documents ................................................................................................................................... viii
Conventions ............................................................................................................................................... viii
1
Introduction to Oracle Real Application Testing
SQL Performance Analyzer.................................................................................................................... 1-1
Database Replay ....................................................................................................................................... 1-2
Part I
2
SQL Performance Analyzer
Introduction to SQL Performance Analyzer
Capturing the SQL Workload ................................................................................................................
Setting Up the Test System ....................................................................................................................
Creating a SQL Performance Analyzer Task ......................................................................................
Measuring the Pre-Change SQL Performance....................................................................................
Making a System Change .......................................................................................................................
Measuring the Post-Change SQL Performance..................................................................................
Comparing Performance Measurements .............................................................................................
Fixing Regressed SQL Statements ........................................................................................................
3
2-3
2-4
2-4
2-5
2-7
2-7
2-7
2-8
Creating an Analysis Task
Creating an Analysis Task Using Enterprise Manager..................................................................... 3-1
Using the Parameter Change Workflow......................................................................................... 3-3
Using the Optimizer Statistics Workflow....................................................................................... 3-6
Using the Exadata Simulation Workflow ....................................................................................... 3-9
Using the Guided Workflow ......................................................................................................... 3-12
Creating an Analysis Task Using APIs ............................................................................................. 3-13
Running the Exadata Simulation Using APIs ............................................................................. 3-14
4
Creating a Pre-Change SQL Trial
Creating a Pre-Change SQL Trial Using Enterprise Manager......................................................... 4-2
Creating a Pre-Change SQL Trial Using APIs .................................................................................... 4-4
iii
5
Creating a Post-Change SQL Trial
Creating a Post-Change SQL Trial Using Oracle Enterprise Manager .......................................... 5-2
Creating a Post-Change SQL Trial Using APIs .................................................................................. 5-3
6
Comparing SQL Trials
Comparing SQL Trials Using Oracle Enterprise Manager .............................................................. 6-2
Analyzing SQL Performance Using Oracle Enterprise Manager................................................ 6-2
Reviewing the SQL Performance Analyzer Report Using Oracle Enterprise Manager .......... 6-3
Tuning Regressed SQL Statements Using Oracle Enterprise Manager ..................................... 6-8
Comparing SQL Trials Using APIs.................................................................................................... 6-10
Analyzing SQL Performance Using APIs.................................................................................... 6-10
Reviewing the SQL Performance Analyzer Report Using APIs .............................................. 6-12
Comparing SQL Tuning Sets Using APIs.................................................................................... 6-17
Tuning Regressed SQL Statements Using APIs.......................................................................... 6-22
Tuning Regressed SQL Statements From a Remote SQL Trial Using APIs ........................... 6-24
Creating SQL Plan Baselines Using APIs .................................................................................... 6-26
Using SQL Performance Analyzer Views.................................................................................... 6-26
7
Testing a Database Upgrade
Upgrading from Oracle9i Database and Oracle Database 10g Release 1 ...................................... 7-1
Enabling SQL Trace on the Production System............................................................................. 7-3
Creating a Mapping Table ................................................................................................................ 7-4
Building a SQL Tuning Set ............................................................................................................... 7-4
Testing Database Upgrades from Oracle9i Database and Oracle Database 10g Release 1...... 7-6
Upgrading from Oracle Database 10g Release 2 and Newer Releases ....................................... 7-10
Testing Database Upgrades from Oracle Database 10g Release 2 and Newer Releases ...... 7-11
Tuning Regressed SQL Statements After Testing a Database Upgrade .................................... 7-15
Part II
8
Database Replay
Introduction to Database Replay
Workload Capture ....................................................................................................................................
Workload Preprocessing .........................................................................................................................
Workload Replay......................................................................................................................................
Analysis and Reporting...........................................................................................................................
9
Capturing a Database Workload
Prerequisites for Capturing a Database Workload............................................................................
Workload Capture Options ....................................................................................................................
Restarting the Database.....................................................................................................................
Using Filters with Workload Capture.............................................................................................
Setting Up the Capture Directory ....................................................................................................
Workload Capture Restrictions .............................................................................................................
Enabling and Disabling the Workload Capture Feature..................................................................
Capturing a Database Workload Using Enterprise Manager ..........................................................
iv
8-2
8-3
8-3
8-3
9-1
9-2
9-2
9-3
9-3
9-3
9-4
9-5
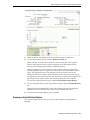
Monitoring Workload Capture Using Enterprise Manager..........................................................
Monitoring an Active Workload Capture ...................................................................................
Stopping an Active Workload Capture .......................................................................................
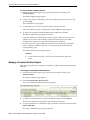
Managing a Completed Workload Capture................................................................................
Capturing a Database Workload Using APIs ..................................................................................
Defining Workload Capture Filters..............................................................................................
Starting a Workload Capture ........................................................................................................
Stopping a Workload Capture ......................................................................................................
Exporting AWR Data for Workload Capture .............................................................................
Monitoring Workload Capture Using Views ..................................................................................
10
9-10
9-10
9-11
9-12
9-13
9-14
9-14
9-15
9-16
9-16
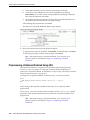
Preprocessing a Database Workload
Preprocessing a Database Workload Using Enterprise Manager ................................................ 10-1
Preprocessing a Database Workload Using APIs ........................................................................... 10-4
Running the Workload Analyzer Command-Line Interface .................................................... 10-5
11
Replaying a Database Workload
Setting Up the Test System .................................................................................................................
Restoring the Database...................................................................................................................
Resetting the System Time.............................................................................................................
Steps for Replaying a Database Workload.......................................................................................
Setting Up the Replay Directory ...................................................................................................
Resolving References to External Systems ..................................................................................
Remapping Connections ................................................................................................................
Specifying Replay Options ............................................................................................................
Using Filters with Workload Replay............................................................................................
Setting Up Replay Clients ..............................................................................................................
Replaying a Database Workload Using Enterprise Manager .......................................................
Monitoring Workload Replay Using Enterprise Manager..........................................................
Monitoring an Active Workload Replay ...................................................................................
Viewing a Completed Workload Replay...................................................................................
Replaying a Database Workload Using APIs ................................................................................
Initializing Replay Data................................................................................................................
Connection Remapping................................................................................................................
Setting Workload Replay Options ..............................................................................................
Defining Workload Replay Filters and Replay Filter Sets ......................................................
Setting the Replay Timeout Action.............................................................................................
Starting a Workload Replay.........................................................................................................
Pausing a Workload Replay ........................................................................................................
Resuming a Workload Replay.....................................................................................................
Cancelling a Workload Replay....................................................................................................
Exporting AWR Data for Workload Replay..............................................................................
Monitoring Workload Replay Using APIs.....................................................................................
Retrieving Information About Diverged Calls .........................................................................
Monitoring Workload Replay Using Views..............................................................................
11-1
11-1
11-2
11-2
11-2
11-2
11-3
11-3
11-4
11-5
11-8
11-13
11-13
11-14
11-18
11-19
11-19
11-20
11-21
11-23
11-24
11-25
11-25
11-25
11-25
11-26
11-26
11-26
v
12
Analyzing Replayed Workload
Using Workload Capture Reports ......................................................................................................
Generating Workload Capture Reports Using Enterprise Manager .......................................
Generating Workload Capture Reports Using APIs..................................................................
Reviewing Workload Capture Reports........................................................................................
Using Workload Replay Reports........................................................................................................
Generating Workload Replay Reports Using Enterprise Manager .........................................
Generating Workload Replay Reports Using APIs....................................................................
Reviewing Workload Replay Reports..........................................................................................
Using Compare Period Reports ..........................................................................................................
Generating Compare Period Reports Using Enterprise Manager ...........................................
Generating Compare Period Reports Using APIs......................................................................
Reviewing Replay Compare Period Reports ..............................................................................
Index
vi
12-1
12-1
12-2
12-3
12-3
12-3
12-4
12-5
12-6
12-6
12-7
12-9
Preface
This preface contains the following topics:
■
Audience
■
Documentation Accessibility
■
Related Documents
■
Conventions
Audience
This document provides information about how to assure the integrity of database
changes using Oracle Real Application Testing. This document is intended for
database administrators, application designers, and programmers who are responsible
for performing real application testing on Oracle Database.
Documentation Accessibility
Our goal is to make Oracle products, services, and supporting documentation
accessible to all users, including users that are disabled. To that end, our
documentation includes features that make information available to users of assistive
technology. This documentation is available in HTML format, and contains markup to
facilitate access by the disabled community. Accessibility standards will continue to
evolve over time, and Oracle is actively engaged with other market-leading
technology vendors to address technical obstacles so that our documentation can be
accessible to all of our customers. For more information, visit the Oracle Accessibility
Program Web site at http://www.oracle.com/accessibility/.
Accessibility of Code Examples in Documentation
Screen readers may not always correctly read the code examples in this document. The
conventions for writing code require that closing braces should appear on an
otherwise empty line; however, some screen readers may not always read a line of text
that consists solely of a bracket or brace.
Accessibility of Links to External Web Sites in Documentation
This documentation may contain links to Web sites of other companies or
organizations that Oracle does not own or control. Oracle neither evaluates nor makes
any representations regarding the accessibility of these Web sites.
vii
Access to Oracle Support
Oracle customers have access to electronic support through My Oracle Support. For
information, visit http://www.oracle.com/support/contact.html or visit
http://www.oracle.com/accessibility/support.html if you are hearing
impaired.
Related Documents
For more information about some of the topics discussed in this document, see the
following documents in the Oracle Database Release 11.2 documentation set:
■
Oracle Database 2 Day DBA
■
Oracle Database 2 Day + Performance Tuning Guide
■
Oracle Database Administrator's Guide
■
Oracle Database Concepts
■
Oracle Database Performance Tuning Guide
Conventions
The following text conventions are used in this document:
viii
Convention
Meaning
boldface
Boldface type indicates graphical user interface elements associated
with an action, or terms defined in text or the glossary.
italic
Italic type indicates book titles, emphasis, or placeholder variables for
which you supply particular values.
monospace
Monospace type indicates commands within a paragraph, URLs, code
in examples, text that appears on the screen, or text that you enter.
1
1
Introduction to Oracle Real Application
Testing
Oracle Real Application Testing option enables you to perform real-world testing of
Oracle Database. By capturing production workloads and assessing the impact of
system changes before production deployment, Oracle Real Application Testing
minimizes the risk of instabilities associated with changes.
Oracle Real Application Testing comprises two components:
■
SQL Performance Analyzer
■
Database Replay
SQL Performance Analyzer and Database Replay are complementary solutions that
can be used for real application testing. Depending on the nature and impact of the
system change, and on which system the test will be performed (production or test),
you can use either one to perform your testing.
The use of SQL Performance Analyzer and Database Replay
requires the Oracle Real Application Testing licensing option. For
more information, see Oracle Database Licensing Information.
Note:
SQL Performance Analyzer
System changes—such as a upgrading a database or adding an index—may cause
changes to execution plans of SQL statements, resulting in a significant impact on SQL
performance. In some cases, the system changes may cause SQL statements to regress,
resulting in performance degradation. In other cases, the system changes may improve
SQL performance. Being able to accurately forecast the potential impact of system
changes on SQL performance enables you to tune the system beforehand, in cases
where the SQL statements regress, or to validate and measure the performance gain in
cases where the performance of the SQL statements improves.
SQL Performance Analyzer automates the process of assessing the overall effect of a
change on the full SQL workload by identifying performance divergence for each SQL
statement. A report that shows the net impact on the workload performance due to the
change is provided. For regressed SQL statements, SQL Performance Analyzer also
provides appropriate executions plan details along with tuning recommendations. As
a result, you can remedy any negative outcome before the end users are affected.
Furthermore, you can validate—with significant time and cost savings—that the
system change to the production environment will result in net improvement.
You can use the SQL Performance Analyzer to analyze the impact on SQL
performance of any type of system changes, including:
Introduction to Oracle Real Application Testing
1-1
Database Replay
■
Database upgrade
■
Configuration changes to the operating system or hardware
■
Schema changes
■
Changes to database initialization parameters
■
Refreshing optimizer statistics
■
SQL tuning actions
See Also:
■
Part I, "SQL Performance Analyzer" for information about using
SQL Performance Analyzer
Database Replay
Before system changes are made, such as hardware and software upgrades, extensive
testing is usually performed in a test environment to validate the changes. However,
despite the testing, the new system often experiences unexpected behavior when it
enters production because the testing was not performed using a realistic workload.
The inability to simulate a realistic workload during testing is one of the biggest
challenges when validating system changes.
Database Replay enables realistic testing of system changes by essentially re-creating
the production workload environment on a test system. Using Database Replay, you
can capture a workload on the production system and replay it on a test system with
the exact timing, concurrency, and transaction characteristics of the original workload.
This enables you to fully assess the impact of the change, including undesired results,
new contention points, or plan regressions. Extensive analysis and reporting is
provided to help identify any potential problems, such as new errors encountered and
performance divergence.
Database Replay performs workload capture of external client workload at the
database level and has negligible performance overhead. Capturing the production
workload eliminates the need to develop simulation workloads or scripts, resulting in
significant cost reduction and time savings. By using Database Replay, realistic testing
of complex applications that previously took months using load simulation tools can
now be completed in days. This enables you to rapidly test changes and adopt new
technologies with a higher degree of confidence and at lower risk.
You can use Database Replay to test any significant system changes, including:
■
■
Database and operating system upgrades
Configuration changes, such as conversion of a database from a single instance to
an Oracle Real Application Clusters (Oracle RAC) environment
■
Storage, network, and interconnect changes
■
Operating system and hardware migrations
See Also:
■
Part II, "Database Replay" for information about using Database
Replay
1-2 Oracle Database Real Application Testing User's Guide
Part I
Part I
SQL Performance Analyzer
SQL Performance Analyzer enables you to assess the impact of system changes on the
response time of SQL statements.
Part I contains the following chapters:
■
Chapter 2, "Introduction to SQL Performance Analyzer"
■
Chapter 3, "Creating an Analysis Task"
■
Chapter 4, "Creating a Pre-Change SQL Trial"
■
Chapter 5, "Creating a Post-Change SQL Trial"
■
Chapter 6, "Comparing SQL Trials"
■
Chapter 7, "Testing a Database Upgrade"
2
2
Introduction to SQL Performance Analyzer
You can run SQL Performance Analyzer on a production system or a test system that
closely resembles the production system. Testing a system change on a production
system will impact the system’s throughput because SQL Performance Analyzer must
execute the SQL statements that you are testing. Any global changes made on the
system to test the performance effect may also affect other users of the system. If the
system change does not impact many sessions or SQL statements, then running SQL
Performance Analyzer on the production system may be acceptable. However, for
systemwide changes—such as a database upgrade—using a production system is not
recommended. Instead, consider running SQL Performance Analyzer on a separate
test system so that you can test the effects of the system change without affecting the
production system. Using a test system also ensures that other workloads running on
the production system will not affect the analysis performed by SQL Performance
Analyzer. Running SQL Performance Analyzer on a test system is the recommended
approach and the methodology described here. If you choose to run the SQL
Performance Analyzer on the production system, then substitute the production
system for the test system where applicable.
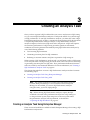
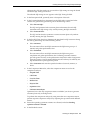
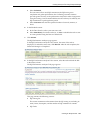
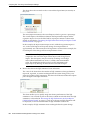
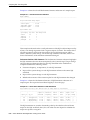
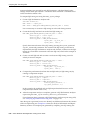
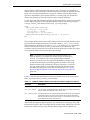
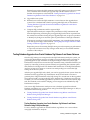
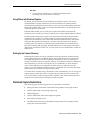
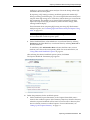
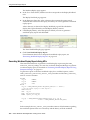
Analyzing the SQL performance effect of system changes using SQL Performance
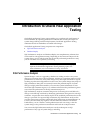
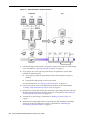
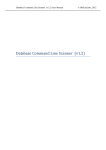
Analyzer involves the following steps, as illustrated in Figure 2–1:
Introduction to SQL Performance Analyzer
2-1
Figure 2–1 SQL Performance Analyzer Workflow
1.
Capture the SQL workload that you intend to analyze and store it in a SQL tuning
set, as described in "Capturing the SQL Workload" on page 2-3.
2.
If you plan to use a test system separate from your production system, then
perform the following steps:
a.
Set up the test system to match the production environment as closely as
possible.
b.
Transport the SQL tuning set to the test system.
For more information, see "Setting Up the Test System" on page 2-4.
3.
On the test system, create a SQL Performance Analyzer task, as described in
"Creating a SQL Performance Analyzer Task" on page 2-4.
4.
Build the pre-change SQL trial by test executing or generating execution plans for
the SQL statements stored in the SQL tuning set, as described in "Measuring the
Pre-Change SQL Performance" on page 2-5
5.
Perform the system change, as described in "Making a System Change" on
page 2-7
6.
Build the post-change SQL trial by re-executing the SQL statements in the SQL
tuning set on the post-change test system, as described in "Measuring the
Post-Change SQL Performance" on page 2-7
2-2 Oracle Database Real Application Testing User's Guide
Capturing the SQL Workload
7.
Compare and analyze the pre-change and post-change versions of performance
data, and generate a report to identify the SQL statements that have improved,
remained unchanged, or regressed after the system change, as described in
"Comparing Performance Measurements" on page 2-7
8.
Tune any regressed SQL statements that are identified, as described in "Fixing
Regressed SQL Statements" on page 2-8.
9.
Ensure that the performance of the tuned SQL statements is acceptable by
repeating steps 6 through 8 until your performance goals are met.
For each comparison, you can use any previous SQL trial as the pre-change SQL
trial and the current SQL trial as the post-change SQL trial. For example, you may
want to compare the first SQL trial to the current SQL trial to assess the total
change, or you can compare the most recent SQL trial to the current SQL trial to
assess just the most recent change.
Oracle Enterprise Manager provides automated workflows for
steps 3 through 9 to simplify this process.
Note:
Capturing the SQL Workload
Before running SQL Performance Analyzer, capture a set of SQL statements on the
production system that represents the SQL workload which you intend to analyze.
The captured SQL statements should include the following information:
■
SQL text
■
Execution environment
■
–
SQL binds, which are bind values needed to execute a SQL statement and
generate accurate execution statistics
–
Parsing schema under which a SQL statement can be compiled
–
Compilation environment, including initialization parameters under which a
SQL statement is executed
Number of times a SQL statement was executed
Capturing a SQL workload has a negligible performance impact on your production
system and should not affect throughput. A SQL workload that contains more SQL
statements will better represent the state of the application or database. This will
enable SQL Performance Analyzer to more accurately forecast the potential impact of
system changes on the SQL workload. Therefore, you should capture as many SQL
statements as possible. Ideally, you should capture all SQL statements that are either
called by the application or are running on the database.
You can store captured SQL statements in a SQL tuning set and use it as an input
source for SQL Performance Analyzer. A SQL tuning set is a database object that
includes one or more SQL statements, along with their execution statistics and
execution context. SQL statements can be loaded into a SQL tuning set from different
sources, including the cursor cache, Automatic Workload Repository (AWR), and
existing SQL tuning sets. Capturing a SQL workload using a SQL tuning set enables
you to:
■
■
Store the SQL text and any necessary auxiliary information in a single, persistent
database object
Populate, update, delete, and select captured SQL statements in the SQL tuning set
Introduction to SQL Performance Analyzer
2-3
Setting Up the Test System
■
■
■
Load and merge content from various data sources, such as the Automatic
Workload Repository (AWR) or the cursor cache
Export the SQL tuning set from the system where the SQL workload is captured
and import it into another system
Reuse the SQL workload as an input source for other advisors, such as the SQL
Tuning Advisor and the SQL Access Advisor
See Also:
■
■
Oracle Database 2 Day + Performance Tuning Guide for information
about creating SQL tuning sets using Oracle Enterprise Manager
Oracle Database Performance Tuning Guide for information about
creating SQL tuning sets using APIs
Setting Up the Test System
After you have captured the SQL workload into a SQL tuning set on the production
system, you can conduct SQL Performance Analyzer analysis on the same database
where the workload was captured or on a different database. Because the analysis is
resource-intensive, it is recommended that you capture the workload on a production
database and transport it to a separate test database where the analysis can be
performed. To do so, export the SQL tuning set from the production system and
import it into a separate system where the system change will be tested.
There are many ways to create a test database. For example, you can use the
DUPLICATE command of Recovery Manager (RMAN), Oracle Data Pump, or
transportable tablespaces. Oracle recommends using RMAN because it can create the
test database from pre-existing backups or from the active production datafiles. The
production and test databases can reside on the same host or on different hosts.
You should configure the test database environment to match the database
environment of the production system as closely as possible. In this way, SQL
Performance Analyzer can more accurately forecast the effect of the system change on
SQL performance.
After the test system is properly configured, export the SQL tuning set from the
production system to a staging table, then import it from the staging table into the test
system.
See Also:
■
■
■
Oracle Database Backup and Recovery User's Guide for information
about duplicating a database with RMAN
Oracle Database 2 Day + Performance Tuning Guide for information
about transporting SQL tuning sets using Oracle Enterprise
Manager
Oracle Database Performance Tuning Guide for information about
transporting SQL tuning sets using APIs
Creating a SQL Performance Analyzer Task
After the SQL workload is captured and transported to the test system, and the initial
database environment is properly configured, you can run SQL Performance Analyzer
to analyze the effects of a system change on SQL performance.
2-4 Oracle Database Real Application Testing User's Guide
Measuring the Pre-Change SQL Performance
To run SQL Performance Analyzer, you must first create a SQL Performance Analyzer
task. A task is a container that encapsulates all of the data about a complete SQL
Performance Analyzer analysis. A SQL Performance Analyzer analysis comprises of at
least two SQL trials and a comparison. A SQL trial encapsulates the execution
performance of a SQL tuning set under specific environmental conditions. When
creating a SQL Performance Analyzer task, you will need to select a SQL tuning set as
its input source. When building SQL trials using the test execute or explain plan
methods, the SQL tuning set will be used as the source for SQL statements. The SQL
Performance Analyzer analysis will show the impact of the environmental differences
between the two trials.
See Also:
■
Chapter 3, "Creating an Analysis Task" for information about how
to create a SQL Performance Analyzer task
Measuring the Pre-Change SQL Performance
Create a pre-change SQL trial before making the system change. You can use the
following methods to generate the performance data needed for a SQL trial with SQL
Performance Analyzer:
■
Test execute
This method test executes SQL statements through SQL Performance Analyzer.
This can be done on the database running SPA Performance Analyzer or on a
remote database.
■
Explain plan
This method generates execution plans only for SQL statements through SQL
Performance Analyzer. This can be done on the database running SPA
Performance Analyzer or on a remote database. Unlike the EXPLAIN PLAN
statement, SQL trials using the explain plan method take bind values into account
and generate the actual execution plan.
■
Convert SQL tuning set
This method converts the execution statistics and plans stored in a SQL tuning set.
This is only supported for APIs.
The test execute method runs each of the SQL statements contained in the workload to
completion. During execution, SQL Performance Analyzer generates execution plans
and computes execution statistics for each SQL statement in the workload. Each SQL
statement in the SQL tuning set is executed separately from other SQL statements,
without preserving their initial order of execution or concurrency. This is done at least
twice for each SQL statement, for as many times as possible until the execution times
out (up to a maximum of 10 times). The first execution is used to warm the buffer
cache. All subsequent executions are then used to calculate the run-time execution
statistics for the SQL statement based on their averages. The actual number of times
that the SQL statement is executed depends on how long it takes to execute the SQL
statement. Long-running SQL statement will only be executed a second time, and the
execution statistics from this execution will be used. Other (faster-running) SQL
statements are executed multiple times, and their execution statistics are averaged
over these executions (statistics from the first execution are not used in the
calculation). By averaging statistics over multiple executions, SQL Performance
Analyzer can calculate more accurate execution statistics for each SQL statement. To
avoid a potential impact to the database, DDLs are not supported. By default, only the
query portion of DMLs is executed. Using APIs, you can execute the full DML by
Introduction to SQL Performance Analyzer
2-5
Measuring the Pre-Change SQL Performance
using the EXECUTE_FULLDML task parameter. Parallel DMLs are not supported and
the query portion is not executed unless the parallel hints are removed.
Depending on its size, executing a SQL workload can be time and resource intensive.
With the explain plan method, you can choose to generate execution plans only,
without collecting execution statistics. This technique shortens the time to run the trial
and lessens the effect on system resources, but a comprehensive performance analysis
is not possible because only the execution plans will be available during the analysis.
However, unlike generating a plan with the EXPLAIN PLAN command, SQL
Performance Analyzer provides bind values to the optimizer when generating
execution plans, which provides a more reliable prediction of what the plan will be
when the SQL statement is executed.
In both cases, you can execute the SQL workload remotely on a separate database
using a database link. SQL Performance Analyzer will establish a connection to the
remote database using the database link, execute the SQL statements on that database,
collect the execution plans and run-time statistics for each SQL statement, and store
the results in a SQL trial on the local database that can be used for later analysis. This
method is useful in cases where you want to:
■
■
■
■
■
Test a database upgrade
Execute the SQL workload on a system running another version of Oracle
Database
Store the results from the SQL Performance Analyzer analysis on a separate test
system
Perform testing on multiple systems with different hardware configurations
Use the newest features in SQL Performance Analyzer even if you are using an
older version of Oracle Database on your production system
Once the SQL workload is executed, the resulting execution plans and run-time
statistics are stored in a SQL trial.
You can also build a SQL trial using the execution statistics and plan stored in a SQL
tuning set. While this method is only supported for APIs, it may be useful in cases
where you have another method to run your workload (such as Database Replay or
another application testing tool), and you do not need SQL Performance Analyzer to
drive the workload on the test system. In such cases, if you capture a SQL tuning set
during your test runs, you can build SQL trials from these SQL tuning sets using SQL
Performance Analyzer to view a more comprehensive analysis report. Unlike a
standard SQL Performance Analyzer report—which has only one execution plan in
each trial and one set of execution statistics generated by executing the SQL statement
with one set of binds—you can generate a report that compares SQL trials built from
SQL tuning sets that show all execution plans from both trials with potentially many
different sets of binds across multiple executions.
See Also:
■
■
Chapter 4, "Creating a Pre-Change SQL Trial" for information
about how to measure the pre-change performance
Chapter 7, "Testing a Database Upgrade" for information about
executing a SQL workload on a remote system to test a database
upgrade
2-6 Oracle Database Real Application Testing User's Guide
Comparing Performance Measurements
Making a System Change
Make the change whose effect on SQL performance you intend to measure. SQL
Performance Analyzer can analyze the effect of many types of system changes. For
example, you can test a database upgrade, new index creation, initialization parameter
changes, or optimizer statistics refresh. If you are running SQL Performance Analyzer
on the production system, then consider making a change using a private session to
avoid affecting the rest of the system.
Measuring the Post-Change SQL Performance
After performing the system change, create a post-change SQL trial. It is highly
recommended that you create the post-change SQL trial using the same method as the
pre-change SQL trial. Once built, the post-change SQL trial represents a new set of
performance data that can be used to compare to the pre-change version. The results
are stored in a new, or post-change, SQL trial.
See Also:
■
Chapter 5, "Creating a Post-Change SQL Trial" for information
about how to measure the post-change performance
Comparing Performance Measurements
SQL Performance Analyzer compares the performance of SQL statements before and
after the change and produces a report identifying any changes in execution plans or
performance of the SQL statements.
SQL Performance Analyzer measures the impact of system changes both on the overall
execution time of the SQL workload and on the response time of every individual SQL
statement in the workload. By default, SQL Performance Analyzer uses elapsed time
as a metric for comparison. Alternatively, you can choose the metric for comparison
from a variety of available SQL run-time statistics, including:
■
CPU time
■
User I/O time
■
Buffer gets
■
Physical I/O
■
Optimizer cost
■
I/O interconnect bytes
■
Any combination of these metrics in the form of an expression
If you chose to generate explain plans only in the SQL trials, then SQL Performance
Analyzer will use the optimizer cost stored in the SQL execution plans.
Once the comparison is complete, the resulting data is generated into a SQL
Performance Analyzer report that compares the pre-change and post-change SQL
performance. The SQL Performance Analyzer report can be viewed as an HTML, text,
or active report. Active reports provides in-depth reporting using an interactive user
interface that enables you to perform detailed analysis even when disconnected from
the database or Oracle Enterprise Manager.
Introduction to SQL Performance Analyzer
2-7
Fixing Regressed SQL Statements
See Also:
■
Chapter 6, "Comparing SQL Trials" for information about
comparing performance measurements and reporting
Fixing Regressed SQL Statements
If the performance analysis performed by SQL Performance Analyzer reveals
regressed SQL statements, then you can make changes to remedy the problem. For
example, you can fix regressed SQL by running SQL Tuning Advisor or using SQL
plan baselines. You can then repeat the process of executing the SQL statements and
comparing its performance to the first execution. Repeat these steps until you are
satisfied with the outcome of the analysis.
See Also:
■
Chapter 6, "Comparing SQL Trials" for information about fixing
regressed SQL statements
2-8 Oracle Database Real Application Testing User's Guide
3
3
Creating an Analysis Task
Once you have captured a SQL workload that you want to analyze into a SQL tuning
set, you can run SQL Performance Analyzer to analyze the effects of a system change
on SQL performance. To run SQL Performance Analyzer, you must first create a SQL
Performance Analyzer task. A task is a container that encapsulates all of the data about
a complete SQL Performance Analyzer analysis. A SQL Performance Analyzer
analysis comprises of at least two SQL trials and a comparison. A SQL trial captures
the execution performance of a SQL tuning set under specific environmental
conditions and can be generated automatically using SQL Performance Analyzer by
one of the following methods:
■
Test executing SQL statements
■
Generating execution plans for SQL statements
■
Referring to execution statistics and plans captured in a SQL tuning set
When creating a SQL Performance Analyzer task, you will need to select a SQL tuning
set as its input source. The SQL tuning set will be used as the source for test executing
or generating execution plans for SQL trials. Thus, performance differences between
trials are caused by environmental differences. For more information, see "Creating a
SQL Performance Analyzer Task" on page 2-4.
This chapter described how to create a SQL Performance Analyzer task and contains
the following topics:
■
Creating an Analysis Task Using Enterprise Manager
■
Creating an Analysis Task Using APIs
Note: The primary interface for running SQL Performance Analyzer
is Oracle Enterprise Manager. If for some reason Oracle Enterprise
Manager is unavailable, you can run SQL Performance Analyzer
using the DBMS_SQLPA PL/SQL package.
Tip: Before running SQL Performance Analyzer, capture the SQL
workload to be used in the performance analysis into a SQL tuning set
on the production system, then transport it to the test system where
the performance analysis will be performed, as described in
"Capturing the SQL Workload" on page 2-3.
Creating an Analysis Task Using Enterprise Manager
There are several workflows available in Oracle Enterprise Manager for creating a SQL
Performance Analyzer task.
Creating an Analysis Task 3-1
Creating an Analysis Task Using Enterprise Manager
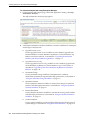
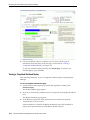
To create an analysis task using Enterprise Manager:
1. On the Software and Support page, under Real Application Testing, click SQL
Performance Analyzer.
The SQL Performance Analyzer page appears.
2.
Under SQL Performance Analyzer Workflows, select the workflow for creating the
desired type of analysis task:
■
Upgrade from 9i or 10.1
Use the upgrade from 9i or 10.1 workflow to test a database upgrade from
Oracle9i Database or Oracle Database 10g Release 1 to Oracle Database 10g
Release 2 and newer releases, as described in "Upgrading from Oracle9i
Database and Oracle Database 10g Release 1" on page 7-1.
■
Upgrade from 10.2 or 11g
Use the upgrade from 10.2 or 11g workflow to test a database upgrade from
Oracle Database 10g Release 2 or Oracle Database 11g to a later release, as
described in "Upgrading from Oracle Database 10g Release 2 and Newer
Releases" on page 7-10.
■
Parameter Change
Use the parameter change workflow to determine how a database
initialization parameter change will affect SQL performance, as described in
"Using the Parameter Change Workflow" on page 3-3.
■
Optimizer Statistics
Use the optimizer statistics workflow to analyze how changes to optimizer
statistics will affect SQL performance, as described in "Using the Optimizer
Statistics Workflow" on page 3-6.
■
Exadata Simulation
Use the Exadata simulation workflow to simulate how using Oracle Exadata
will affect SQL performance, as described in "Using the Exadata Simulation
Workflow" on page 3-9.
■
Guided workflow
Use the guided workflow to compare SQL performance for all other types of
system changes, as described in "Using the Guided Workflow" on page 3-12.
3-2 Oracle Database Real Application Testing User's Guide
Creating an Analysis Task Using Enterprise Manager
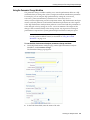
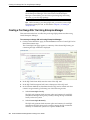
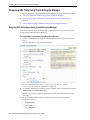
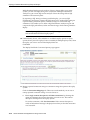
Using the Parameter Change Workflow
The parameter change workflow enables you to test the performance effect on a SQL
workload when you change the value of a single environment initialization parameter.
For example, you can compare SQL performance by setting the OPTIMIZER_
FEATURES_ENABLE initialization parameter set to 10.2.0.4 and 11.2.0.1.
After you select a SQL tuning set and a comparison metric, SQL Performance Analyzer
creates a task and performs a trial with the initialization parameter set to the original
value. SQL Performance Analyzer then performs a second trial with the parameter set
to the changed value by issuing an ALTER SESSION statement. The impact of the
change is thus contained locally to the testing session. Any regression or change in
performance is reported in a system-generated SQL Performance Analyzer report.
Note: To create an analysis task for other types of system changes,
use the guided workflow instead, as described in "Using the Guided
Workflow" on page 3-12.
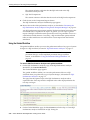
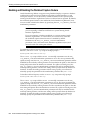
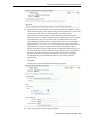
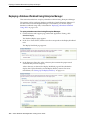
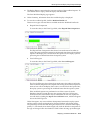
To use the SQL Performance Analyzer parameter change workflow:
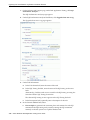
1. On the SQL Performance Analyzer page, under SQL Performance Analyzer
Workflows, click Parameter Change.
The Parameter Change page appears.
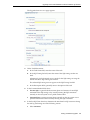
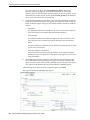
2.
In the Task Name field, enter the name of the task.
Creating an Analysis Task 3-3
Creating an Analysis Task Using Enterprise Manager
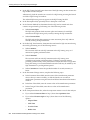
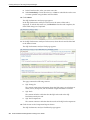
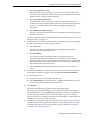
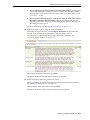
3.
In the SQL Tuning Set field, enter the name of the SQL tuning set that contains the
SQL workload to be analyzed.
Alternatively, click the search icon to search for a SQL tuning set using the Search
and Select: SQL Tuning Set window.
The selected SQL tuning set now appears in the SQL Tuning Set field.
4.
In the Description field, optionally enter a description of the task.
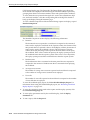
5.
In the Creation Method list, determine how the SQL trial is created and what
contents are generated by performing one of the following actions:
■
Select Execute SQLs.
The SQL trial generates both execution plans and statistics for each SQL
statement in the SQL tuning set by actually running the SQL statements.
■
Select Generate Plans.
The SQL trial invokes the optimizer to create execution plans only without
actually running the SQL statements.
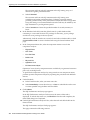
6.
In the Per-SQL Time Limit list, determine the time limit for SQL execution during
the trial by performing one of the following actions:
■
Select 5 minutes.
The execution will run each SQL statement in the SQL tuning set up to 5
minutes and gather performance data.
■
Select Unlimited.
The execution will run each SQL statement in the SQL tuning set to
completion and gather performance data. Collecting execution statistics
provides greater accuracy in the performance analysis but takes a longer time.
Using this setting is not recommended because the task may be stalled by one
SQL statement for a prolonged time period.
■
7.
8.
Select Customize and enter the specified number of seconds, minutes, or
hours.
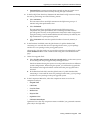
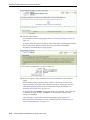
In the Parameter Change section, complete the following steps:
a.
In the Parameter Name field, enter the name of the initialization parameter
whose value you want to modify, or click the Search icon to select an
initialization parameter using the Search and Select: Initialization Parameters
window.
b.
In the Base Value field, enter the current value of the initialization parameter.
c.
In the Changed Value field, enter the new value of the initialization
parameter.
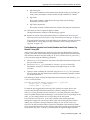
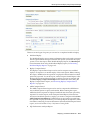
In the Comparison Metric list, select the comparison metric to use for the analysis:
■
■
If you selected Generate Plans in Step 5, then select Optimizer Cost.
If you selected Execute SQLs in Step 5, then select one of the following
options:
–
Elapsed Time
–
CPU Time
–
User I/O Time
–
Buffer Gets
3-4 Oracle Database Real Application Testing User's Guide
Creating an Analysis Task Using Enterprise Manager
–
Physical I/O
–
Optimizer Cost
–
I/O Interconnect Bytes
To perform the comparison analysis by using more than one comparison metric,
perform separate comparison analyses by repeating this procedure using different
metrics.
9.
In the Schedule section:
a.
In the Time Zone list, select your time zone code.
b.
Select Immediately to start the task now, or Later to schedule the task to start
at a time specified using the Date and Time fields.
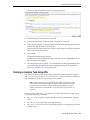
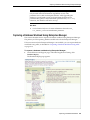
10. Click Submit.
The SQL Performance Analyzer page appears.
In the SQL Performance Analyzer Tasks section, the status of this task is
displayed. To refresh the status icon, click Refresh. After the task completes, the
Status field changes to Completed.
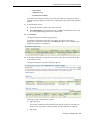
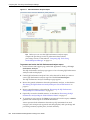
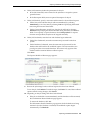
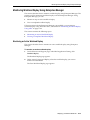
11. In the SQL Performance Analyzer Tasks section, select the task and click the link
in the Name column.
The SQL Performance Analyzer Task page appears.
This page contains the following sections:
■
SQL Tuning Set
This section summarizes information about the SQL tuning set, including its
name, owner, description, and the number of SQL statements it contains.
■
SQL Trials
Creating an Analysis Task 3-5
Creating an Analysis Task Using Enterprise Manager
This section includes a table that lists the SQL trials used in the SQL
Performance Analyzer task.
■
SQL Trial Comparisons
This section contains a table that lists the results of the SQL trial comparisons
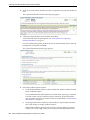
12. Click the icon in the Comparison Report column.
The SQL Performance Analyzer Task Result page appears.
13. Review the results of the performance analysis, as described in "Reviewing the
SQL Performance Analyzer Report Using Oracle Enterprise Manager" on page 6-3.
14. In cases when regression are identified, click the icon in the SQL Tune Report
column to view a SQL tuning report.
Using the Optimizer Statistics Workflow
The optimizer statistics workflow enables you to analyze the effects of optimizer
statistics changes on the performance of a SQL workload.
SQL Performance Analyzer tests the effect of new optimizer statistics by enabling
pending optimizer statistics in the testing session. The first SQL trial measures the
baseline SQL tuning set performance; the second SQL trial uses the pending optimizer
statistics. You can then run a comparison report for the two SQL trials.
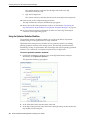
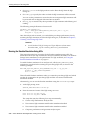
To use the optimizer statistics workflow:
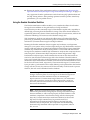
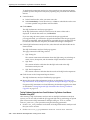
1. On the SQL Performance Analyzer page, under SQL Performance Analyzer
Workflows, click Optimizer Statistics.
The Optimizer Statistics page appears.
2.
In the Task Name field, enter the name of the task.
3.
In the SQL Tuning Set field, enter the name of the SQL tuning set that contains the
SQL workload to be analyzed.
3-6 Oracle Database Real Application Testing User's Guide
Creating an Analysis Task Using Enterprise Manager
Alternatively, click the search icon to search for a SQL tuning set using the Search
and Select: SQL Tuning Set window.
The selected SQL tuning set now appears in the SQL Tuning Set field.
4.
In the Description field, optionally enter a description of the task.
5.
In the Creation Method list, determine how the SQL trial is created and what
contents are generated by performing one of the following actions:
■
Select Execute SQLs.
The SQL trial generates both execution plans and statistics for each SQL
statement in the SQL tuning set by actually running the SQL statements.
■
Select Generate Plans.
The SQL trial invokes the optimizer to create execution plans only without
actually running the SQL statements.
6.
In the Per-SQL Time Limit list, determine the time limit for SQL execution during
the trial by performing one of the following actions:
■
Select 5 minutes.
The execution will run each SQL statement in the SQL tuning set up to 5
minutes and gather performance data.
■
Select Unlimited.
The execution will run each SQL statement in the SQL tuning set to
completion and gather performance data. Collecting execution statistics
provides greater accuracy in the performance analysis but takes a longer time.
Using this setting is not recommended because the task may be stalled by one
SQL statement for a prolonged time period.
■
7.
Select Customize and enter the specified number of seconds, minutes, or
hours.
In the Comparison Metric list, select the comparison metric to use for the
comparison analysis:
–
Elapsed Time
–
CPU Time
–
User I/O Time
–
Buffer Gets
–
Physical I/O
–
Optimizer Cost
–
I/O Interconnect Bytes
Optimizer Cost is the only comparison metric available if you chose to generate
execution plans only in the SQL trials.
To perform the comparison analysis by using more than one comparison metric,
perform separate comparison analyses by repeating this procedure with different
metrics.
8.
Ensure that pending optimizer statistics are collected, and select Pending
optimizer statistics collected.
9.
In the Schedule section:
Creating an Analysis Task 3-7
Creating an Analysis Task Using Enterprise Manager
a.
In the Time Zone list, select your time zone code.
b.
Select Immediately to start the task now, or Later to schedule the task to start
at a time specified using the Date and Time fields.
10. Click Submit.
The SQL Performance Analyzer page appears.
In the SQL Performance Analyzer Tasks section, the status of this task is
displayed. To refresh the status icon, click Refresh. After the task completes, the
Status field changes to Completed.
11. In the SQL Performance Analyzer Tasks section, select the task and click the link
in the Name column.
The SQL Performance Analyzer Task page appears.
This page contains the following sections:
■
SQL Tuning Set
This section summarizes information about the SQL tuning set, including its
name, owner, description, and the number of SQL statements it contains.
■
SQL Trials
This section includes a table that lists the SQL trials used in the SQL
Performance Analyzer task.
■
SQL Trial Comparisons
This section contains a table that lists the results of the SQL trial comparisons
12. Click the icon in the Comparison Report column.
The SQL Performance Analyzer Task Result page appears.
3-8 Oracle Database Real Application Testing User's Guide
Creating an Analysis Task Using Enterprise Manager
13. Review the results of the performance analysis, as described in "Reviewing the
SQL Performance Analyzer Report Using Oracle Enterprise Manager" on page 6-3.
Any regressions found in performance can be fixed using SQL plan baselines and
the SQL Tuning Advisor. If the pending optimizer statistics produce satisfactory
performance, you can publish for use.
Using the Exadata Simulation Workflow
The Exadata simulation workflow enables you to simulate the effects of an Exadata
Storage Server installation on the performance of a SQL workload.
Oracle Exadata provides extremely large I/O bandwidth coupled with a capability to
offload SQL processing from the database to storage. This allows Oracle Database to
significantly reduce the volume of data sent through the I/O interconnect, while at the
same time offloading CPU resources to the Exadata storage cells.
SQL Performance Analyzer can analyze the effectiveness of Exadata SQL offload
processing by simulating an Exadata Storage Server installation and measuring the
reduction in I/O interconnect usage for the SQL workload.
Running the Exadata simulation does not require any hardware or configuration
changes to your system. After you select a SQL tuning set, SQL Performance Analyzer
creates a task and performs an initial trial with the Exadata Storage Server simulation
disabled. SQL Performance Analyzer then performs a second trial with the Exadata
Storage Server simulation enabled. SQL Performance Analyzer then compares the two
trials using the I/O Interconnect Bytes comparison metric and generates a SQL
Performance Analyzer report, which estimates the amount of data that would not
need to be sent from the Exadata storage cells to the database if Oracle Exadata is
being used. In both SQL trials, the SQL statements are executed to completion and I/O
interconnect bytes measurements are taken as the actual and simulated Exadata values
for the first and second trials, respectively. The measured change in I/O interconnect
bytes provides a good estimate of how much filtering can be performed in the Exadata
storage cells and, in turn, the amount of CPU that normally would be used to process
this data, but now can be offloaded from the database.
Using the Exadata simulation will not result in any plan
changes. Execution plans do not change in an Exadata Storage Server
installation because the simulation focuses on measuring the
improvement in I/O interconnect usage. Moreover, I/O interconnect
bytes will not increase, except when data compression is used (see
next note), because Oracle Exadata will only decrease the amount of
data sent to the database.
Note:
Because I/O interconnect bytes is the only metric used to
measure the performance change impact of using an Exadata Storage
Server installation, it will not work properly if Oracle Exadata is used
with data compression. Since Exadata storage cells also decompress
data, the I/O interconnect bytes with Oracle Exadata (or the second
SQL trial) of a SQL statement may be greater than the I/O
interconnect bytes without Oracle Exadata (or the first SQL trial)
where the data is compressed. This comparison will be misleading
because the SQL statement will be reported as a regression; when in
fact, it is not.
Note:
Creating an Analysis Task 3-9
Creating an Analysis Task Using Enterprise Manager
The Exadata simulation workflow is used to simulate an
Exadata Storage Server installation on non-Exadata hardware. To test
changes on Exadata hardware, use the standard SQL Performance
Analyzer workflows.
Note:
The Exadata simulation is supported for DSS and data
warehouse workloads only.
Note:
To use the SQL Performance Analyzer Exadata simulation workflow:
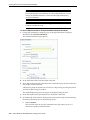
1. On the SQL Performance Analyzer page, under SQL Performance Analyzer
Workflows, click Exadata Simulation.
The Exadata Simulation page appears.
2.
In the Task Name field, enter the name of the task.
3.
In the SQL Tuning Set field, enter the name of the SQL tuning set that contains the
SQL workload to be analyzed.
Alternatively, click the search icon to search for a SQL tuning set using the Search
and Select: SQL Tuning Set window.
The selected SQL tuning set now appears in the SQL Tuning Set field.
4.
In the Description field, optionally enter a description of the task.
5.
In the Per-SQL Time Limit list, determine the time limit for SQL execution during
the trial by performing one of the following actions:
■
Select 5 minutes.
The execution will run each SQL statement in the SQL tuning set up to 5
minutes and gather performance data.
3-10 Oracle Database Real Application Testing User's Guide
Creating an Analysis Task Using Enterprise Manager
■
Select Unlimited.
The execution will run each SQL statement in the SQL tuning set to
completion and gather performance data. Collecting execution statistics
provides greater accuracy in the performance analysis but takes a longer time.
Using this setting is not recommended because the task may be stalled by one
SQL statement for a prolonged time period.
■
6.
7.
Select Customize and enter the specified number of seconds, minutes, or
hours.
In the Schedule section:
a.
In the Time Zone list, select your time zone code.
b.
Select Immediately to start the task now, or Later to schedule the task to start
at a time specified using the Date and Time fields.
Click Submit.
The SQL Performance Analyzer page appears.
In the SQL Performance Analyzer Tasks section, the status of this task is
displayed. To refresh the status icon, click Refresh. After the task completes, the
Status field changes to Completed.
8.
In the SQL Performance Analyzer Tasks section, select the task and click the link
in the Name column.
The SQL Performance Analyzer Task page appears.
This page contains the following sections:
■
SQL Tuning Set
This section summarizes information about the SQL tuning set, including its
name, owner, description, and the number of SQL statements it contains.
■
SQL Trials
Creating an Analysis Task 3-11
Creating an Analysis Task Using Enterprise Manager
This section includes a table that lists the SQL trials used in the SQL
Performance Analyzer task.
■
SQL Trial Comparisons
This section contains a table that lists the results of the SQL trial comparisons
9.
Click the icon in the Comparison Report column.
The SQL Performance Analyzer Task Result page appears.
10. Review the results of the performance analysis, as described in "Reviewing the
SQL Performance Analyzer Report Using Oracle Enterprise Manager" on page 6-3.
Any SQL performance improvement with the Exadata simulation between the first
and second trials is captured in the report. In general, you can expect a greater
impact if the SQL workload contains queries that scan a large number of rows or a
small subset of table columns. Conversely, a SQL workload that queries indexed
tables or tables with fewer rows will result in a lesser impact from the Exadata
simulation.
Using the Guided Workflow
The guided workflow enables you to test the performance effect of any types of system
changes on a SQL workload, as listed in "SQL Performance Analyzer" on page 1-1.
Note: To create an analysis task to test database initialization
parameter changes, use the simplified parameter change workflow
instead, as described in "Using the Parameter Change Workflow" on
page 3-3.
To use the SQL Performance Analyzer task guided workflow:
1. On the SQL Performance Analyzer page, under SQL Performance Analyzer
Workflows, click Guided Workflow.
The Guided Workflow page appears.
The guided workflow enables you to test the performance effect on a SQL
workload when you perform any type of system changes, as described in "SQL
Performance Analyzer" on page 1-1.
This page lists the required steps in the SQL Performance Analyzer task in
sequential order. Each step must be completed in the order displayed before the
next step can begin.
2.
On the Guided Workflow page, click the Execute icon for the Step 1: Create SQL
Performance Analyzer Task based on SQL Tuning Set.
3-12 Oracle Database Real Application Testing User's Guide
Creating an Analysis Task Using APIs
The Create SQL Performance Analyzer Task page appears.
3.
In the Name field, enter the name of the task.
4.
In the Description field, optionally enter a description of the task.
5.
Under SQL Tuning Set, in the Name field, enter the name the SQL tuning set that
contains the SQL workload to be analyzed.
Alternatively, click the search icon to select a SQL tuning set from the Search and
Select: SQL Tuning Set window.
6.
Click Create.
The Guided Workflow page appears.
The Status icon of this step has changed to a check mark and the Execute icon for
the next step is now enabled.
7.
Once the analysis task is created, you can build the pre-change performance data
by executing the SQL statements stored in the SQL tuning set, as described in
Chapter 4, "Creating a Pre-Change SQL Trial".
Creating an Analysis Task Using APIs
This section describes how to create a SQL Performance Analyzer task by using the
DBMS_SQLPA.CREATE_ANALYSIS_TASK function. A task is a database container for
SQL Performance Analyzer execution inputs and results.
Tip: Before proceeding, capture the SQL workload to be used in the
performance analysis into a SQL tuning set on the production system,
then transport it to the test system where the performance analysis
will be performed, as described in "Capturing the SQL Workload" on
page 2-3.
Call the CREATE_ANALYSIS_TASK function to prepare the analysis of a SQL tuning
set using the following parameters:
■
■
■
Set task_name to specify an optional name for the SQL Performance Analyzer
task.
Set sqlset_name to the name of the SQL tuning set.
Set sqlset_owner to the owner of the SQL tuning set. The default is the current
schema owner.
Creating an Analysis Task 3-13
Creating an Analysis Task Using APIs
■
■
Set basic_filter to the SQL predicate used to filter the SQL from the SQL
tuning set.
Set order_by to specify the order in which the SQL statements will be executed.
You can use this parameter to ensure that the more important SQL statements will
be processed and not skipped if the time limit is reached.
■
Set top_sql to consider only the top number of SQL statements after filtering and
ranking.
The following example illustrates a function call:
VARIABLE t_name VARCHAR2(100);
EXEC :t_name := DBMS_SQLPA.CREATE_ANALYSIS_TASK(sqlset_name => 'my_sts', task_name => 'my_spa_task');
Once the analysis task is created, you can build the pre-change performance data by
executing the SQL statements stored in the SQL tuning set, as described in Chapter 4,
"Creating a Pre-Change SQL Trial".
See Also:
■
Oracle Database PL/SQL Packages and Types Reference to learn more
about the DBMS_SQLPA.CREATE_ANALYSIS_TASK function
Running the Exadata Simulation Using APIs
This section describes how to run the Oracle Exadata simulation using APIs. For
information about how SQL Performance Analyzer simulates the effects of an Exadata
Storage Server installation on the performance of a SQL workload, see "Using the
Exadata Simulation Workflow" on page 3-9.
To enable Exadata simulation for an analysis task, call the SET_ANALYSIS_TASK_
PARAMETER procedure before creating the post-change SQL trial, as shown in the
following example:
EXEC DBMS_SQLPA.SET_ANALYSIS_TASK_PARAMETER(task_name => 'my_spa_task', parameter => 'CELL_SIMULATION_ENABLED', value => 'TRUE');
This will enable Exadata simulation when you create the post-change SQL trial, which
can then be compared to the pre-change SQL trial that was created with Exadata
simulation disabled.
Alternatively, you can run the Exadata simulation using the tcellsim.sql script:
1.
At the SQL prompt, enter:
@$ORACLE_HOME/rdbms/admin/tcellsim.sql
2.
Enter the name and owner of the SQL tuning set to use:
Enter value for sts_name: MY_STS
Enter value for sts_owner: IMMCHAN
The script then runs the following four steps automatically:
■
Creates a SQL Performance Analyzer task
■
Test executes SQL statements with Exadata simulation disabled
■
Test executes SQL statements with Exadata simulation enabled
■
Compares performance and generates analysis report
3-14 Oracle Database Real Application Testing User's Guide
4
4
Creating a Pre-Change SQL Trial
After creating a SQL Performance Analyzer task and selecting a SQL tuning set as the
input source, you need to establish the initial environment on the test system.
Establishing the database environment on the test system involves manually making
any necessary environmental changes that affect SQL optimization and performance.
These changes may include changing initialization parameters, gathering or setting
optimizer statistics, and creating indexes. It is recommended that you build a test
system that is as similar to the production system as possible. The dedicated
workflows in Enterprise Manager simplifies this process by creating both SQL trials
automatically and performing the change restricted to the testing session. For
information about setting up the database environment, see "Setting Up the Test
System" on page 2-4.
Note: You can optionally run SQL trials on a remote system by
providing access to a public database link. When conducting remote
SQL trials, the database version of the remote database where the SQL
statements are executed must be less than or equal to the database
version of the database to which it connects. Starting with Oracle
Database release 11.2.0.2, the remote database can be a read-only
database, such as an Oracle Active Data Guard instance.
Once the environment on the test system is properly configured, you can build the
pre-change version of performance data before performing the system change. You
can build SQL trials using SQL Performance Analyzer by using one of the following
methods:
■
Executing the SQL statements in the workload
■
Generating execution plans for the SQL statements in the workload
■
Loading performance data and execution plans from a SQL tuning set (APIs only)
For more information, see "Measuring the Pre-Change SQL Performance" on page 2-5
This chapter described how to create the pre-change SQL trial and contains the
following topics:
■
Creating a Pre-Change SQL Trial Using Enterprise Manager
■
Creating a Pre-Change SQL Trial Using APIs
Creating a Pre-Change SQL Trial
4-1
Creating a Pre-Change SQL Trial Using Enterprise Manager
Note: The primary interface for creating a pre-change SQL trial is
Oracle Enterprise Manager. If for some reason Oracle Enterprise
Manager is unavailable, you can create a pre-change SQL trial using
the DBMS_SQLPA PL/SQL package.
Tip: Before creating a pre-change SQL trial, you need to create a SQL
Performance Analyzer task, as described in Chapter 3, "Creating an
Analysis Task".
Creating a Pre-Change SQL Trial Using Enterprise Manager
This section describes how to collect the pre-change SQL performance data using
Oracle Enterprise Manager.
To create a pre-change SQL trial using Enterprise Manager:
1. On the Guided Workflow page, click the Execute icon for the Create SQL Trial in
Initial Environment step.
The Create SQL Trial page appears. A summary of the selected SQL tuning set
containing the SQL workload is displayed.
2.
In the SQL Trial Name field, enter the name of the SQL trial.
3.
In the SQL Trial Description field, enter a description of the SQL trial.
4.
In the Creation Method list, determine how the SQL trial is created and what
contents are generated by performing one of the following actions:
■
Select Execute SQLs Locally.
The SQL trial generates both execution plans and statistics for each SQL
statement in the SQL tuning set by actually running the SQL statements
locally on the test system.
■
Select Execute SQLs Remotely.
The SQL trial generates both execution plans and statistics for each SQL
statement in the SQL tuning set by actually running the SQL statements
remotely on another test system over a public database link.
4-2 Oracle Database Real Application Testing User's Guide
Creating a Pre-Change SQL Trial Using Enterprise Manager
■
Select Generate Plans Locally.
The SQL trial invokes the optimizer to create execution plans locally on the
test system, after taking bind values and optimizer configuration into account,
without actually running the SQL statements.
■
Select Generate Plans Remotely.
The SQL trial invokes the optimizer to create execution plans remotely on
another test system, after taking bind values and optimizer configuration into
account, over a public database link without actually running the SQL
statements.
■
Select Build From SQL Tuning Set.
The SQL trial copies the execution plans and statistics from the SQL tuning set
directly into the trial.
For more information about the different methods, see "Measuring the Pre-Change
SQL Performance" on page 2-5.
5.
In the Per-SQL Time Limit list, determine the time limit for SQL execution during
the trial by performing one of the following actions:
■
Select 5 minutes.
The execution will run each SQL statement in the SQL tuning set up to 5
minutes and gather performance data.
■
Select Unlimited.
The execution will run each SQL statement in the SQL tuning set to
completion and gather performance data. Collecting execution statistics
provides greater accuracy in the performance analysis but takes a longer time.
Using this setting is not recommended because the task may be stalled by one
SQL statement for a prolonged period.
■
Select Customize and enter the specified number of seconds, minutes, or
hours.
6.
Ensure that the database environment on the test system matches the production
environment as closely as possible, and select Trial environment established.
7.
In the Schedule section:
8.
a.
In the Time Zone list, select your time zone code.
b.
Select Immediately to start the task now, or Later to schedule the task to start
at a time specified using the Date and Time fields.
Click Submit.
The Guided Workflow page appears when the execution begins.
The status icon of this step changes to a clock while the execution is in progress.
To refresh the status icon, click Refresh. Depending on the options selected and
the size of the SQL workload, the execution may take a long time to complete.
After the execution is completed, the Status icon will change to a check mark and
the Execute icon for the next step is enabled.
9.
Once the pre-change performance data is built, you can make the system change
and build the post-change performance data by re-executing the SQL statements
in the SQL tuning set on the post-change test system, as described in Chapter 5,
"Creating a Post-Change SQL Trial".
Creating a Pre-Change SQL Trial
4-3
Creating a Pre-Change SQL Trial Using APIs
Creating a Pre-Change SQL Trial Using APIs
This section describes how to build the pre-change performance data by using the
DBMS_SQLPA.EXECUTE_ANALYSIS_TASK procedure.
Call the EXECUTE_ANALYSIS_TASK procedure using the following parameters:
■
■
■
■
Set the task_name parameter to the name of the SQL Performance Analyzer task
that you want to execute.
Set the execution_type parameter in one of the following ways:
–
Set to EXPLAIN PLAN to generate execution plans for all SQL statements in
the SQL tuning set without executing them.
–
Set to TEST EXECUTE (recommended) to execute all statements in the SQL
tuning set and generate their execution plans and statistics. When TEST
EXECUTE is specified, the procedure generates execution plans and execution
statistics. The execution statistics enable SQL Performance Analyzer to
identify SQL statements that have improved or regressed. Collecting
execution statistics in addition to generating execution plans provides greater
accuracy in the performance analysis, but takes longer.
–
Set to CONVERT SQLSET to refer to a SQL tuning set for the execution
statistics and plans for the SQL trial. Values for the execution parameters
SQLSET_NAME and SQLSET_OWNER should also be specified.
Specify a name to identify the execution using the execution_name parameter.
If not specified, then SQL Performance Analyzer automatically generates a name
for the task execution.
Specify execution parameters using the execution_params parameters. The
execution_params parameters are specified as (name, value) pairs for the
specified execution. For example, you can set the following execution parameters:
–
The time_limit parameter specifies the global time limit to process all SQL
statements in a SQL tuning set before timing out.
–
The local_time_limit parameter specifies the time limit to process each
SQL statement in a SQL tuning set before timing out.
–
To perform a remote test execute, set the DATABASE_LINK task parameter to
the global name of a public database link connecting to a user with the
EXECUTE privilege for the DBMS_SQLPA package and the ADVISOR privilege
on the test system.
–
To fully execute DML statements—including acquiring row locks and
modifying row—set the EXECUTE_FULLDML parameter to TRUE. SQL
Performance Analyzer will issue a rollback after executing the DML
statements to prevent persistent changes from being made. The default value
for this parameter is FALSE, which executes only the query portion of the
DML statement without modifying the data.
–
To restore the relevant captured init.ora settings during a test execute, set
the APPLY_CAPTURED_COMPILENV parameter to TRUE. This is not the default
behavior because typically you are running SQL trials to test changes when
changing the environment. However, this method may be used in cases when
the init.ora settings are not being changed (such as creating an index). This
method is not supported for remote SQL trials.
The following example illustrates a function call made before a system change:
EXEC DBMS_SQLPA.EXECUTE_ANALYSIS_TASK(task_name => 'my_spa_task', -
4-4 Oracle Database Real Application Testing User's Guide
Creating a Pre-Change SQL Trial Using APIs
execution_type => 'TEST EXECUTE', execution_name => 'my_exec_BEFORE_change');
Once the pre-change performance data is built, you can make the system change and
build the post-change performance data by re-executing the SQL statements in the
SQL tuning set on the post-change test system, as described in Chapter 5, "Creating a
Post-Change SQL Trial".
See Also:
■
Oracle Database PL/SQL Packages and Types Reference to learn about
the DBMS_SQLPA.EXECUTE_ANALYSIS_TASK function
Creating a Pre-Change SQL Trial
4-5
Creating a Pre-Change SQL Trial Using APIs
4-6 Oracle Database Real Application Testing User's Guide
5
5
Creating a Post-Change SQL Trial
After computing the pre-change SQL performance data, you can perform the system
change on the test system. Before making the system change, ensure that you have
executed the SQL workload in the initial environment to generate the pre-change
performance data. For example, if you are testing how changing a database
initialization parameter will affect SQL performance, execute the SQL workload once
before changing the database initialization parameter to a new value. Depending on
the type of change you are making, it may be necessary to reconfigure the
environment on the test system to match the new environment for which you want to
perform SQL performance analysis. For more information, see "Making a System
Change" on page 2-7.
Note: You can optionally run SQL trials on a remote system by
providing access to a public database link. When conducting remote
SQL trials, the database version of the remote database where the SQL
statements are executed must be less than or equal to the database
version of the database to which it connects. Starting with Oracle
Database release 11.2.0.2, the remote database can be a read-only
database, such as an Oracle Active Data Guard instance.
"SQL Performance Analyzer" on page 1-1 lists examples of possible system changes
that can be analyzed using SQL Performance Analyzer. For example, you may want to
determine how a database initialization parameter change or database upgrade will
affect SQL performance. You may also decide to change the system based on
recommendations from an advisor such as Automatic Database Diagnostic Monitor
(ADDM), SQL Tuning Advisor, or SQL Access Advisor.
After you have made the system change, you can build the post-change version of
performance data by executing the SQL workload again. SQL Performance Analyzer
will store the results from executing the SQL statements in a post-change SQL trial. For
more information, see "Measuring the Post-Change SQL Performance" on page 2-7.
This section described how to create the post-change SQL trial and contains the
following topics:
■
Creating a Post-Change SQL Trial Using Oracle Enterprise Manager
■
Creating a Post-Change SQL Trial Using APIs
Creating a Post-Change SQL Trial
5-1
Creating a Post-Change SQL Trial Using Oracle Enterprise Manager
The primary interface for creating a post-change SQL trial is
Oracle Enterprise Manager. If for some reason Oracle Enterprise
Manager is unavailable, you can create a post-change SQL trial using
the DBMS_SQLPA PL/SQL package.
Note:
Tip: Before making the system change creating a post-change SQL
trial, you need to create a pre-change SQL trial, as described in
Chapter 4, "Creating a Pre-Change SQL Trial".
Creating a Post-Change SQL Trial Using Oracle Enterprise Manager
This section describes how to collect the post-change SQL performance data using
Oracle Enterprise Manager.
To create a post-change SQL trial using Enterprise Manager:
1. On the Guided Workflow page, click the Execute icon for the Create SQL Trial in
Changed Environment step.
The Create SQL Trial page appears.
2.
In the SQL Trial Name field, enter the name of the SQL trial.
3.
In the SQL Trial Description field, enter a description of the SQL trial.
4.
In the Creation Method list, determine how the SQL trial is created and what
contents are generated by performing one of the following actions:
■
Select Execute SQLs Locally.
The SQL trial generates both execution plans and statistics for each SQL
statement in the SQL tuning set by actually running the SQL statements
locally on the test system.
■
Select Execute SQLs Remotely.
The SQL trial generates both execution plans and statistics for each SQL
statement in the SQL tuning set by actually running the SQL statements
remotely on another test system over a public database link.
■
Select Generate Plans Locally.
The SQL trial invokes the optimizer to create execution plans locally on the
test system without actually running the SQL statements.
■
Select Generate Plans Remotely.
The SQL trial invokes the optimizer to create execution plans remotely on
another test system over a public database link without actually running the
SQL statements.
For each of these creation methods, the application schema and data should
already exist on the local or remote test system.
5.
In the Per-SQL Time Limit list, determine the time limit for SQL execution during
the trial by performing one of the following actions:
■
Select 5 minutes.
The execution will run each SQL statement in the SQL tuning set up to 5
minutes and gather performance data.
5-2 Oracle Database Real Application Testing User's Guide
Creating a Post-Change SQL Trial Using APIs
■
Select Unlimited.
The execution will run each SQL statement in the SQL tuning set to
completion and gather performance data. Collecting execution statistics
provides greater accuracy in the performance analysis but takes a longer time.
Using this setting is not recommended because the task may be stalled by one
SQL statement for a prolonged time period.
■
Select Customize and enter the specified number of seconds, minutes, or
hours.
6.
Ensure that the system change you are testing has been performed on the test
system, and select Trial environment established.
7.
In the Schedule section:
8.
a.
In the Time Zone list, select your time zone code.
b.
Select Immediately to start the task now, or Later to schedule the task to start
at a time specified using the Date and Time fields.
Click Submit.
The Guided Workflow page appears when the execution begins.
The status icon of this step changes to a clock while the execution is in progress.
To refresh the status icon, click Refresh. Depending on the options selected and
the size of the SQL workload, the execution may take a long time to complete.
After the execution is completed, the Status icon will change to a check mark and
the Execute icon for the next step is enabled.
9.
Once the post-change performance data is built, you can compare the pre-change
SQL trial to the post-change SQL trial by running a comparison analysis, as
described in Chapter 6, "Comparing SQL Trials".
Creating a Post-Change SQL Trial Using APIs
This section describes how to collect the post-change SQL performance data using the
DBMS_SQLPA.EXECUTE_ANALYSIS_TASK procedure.
If you are running the SQL statements remotely on another
test system over a database link, the remote user calling this
procedure needs to have the EXECUTE privilege for the DBMS_SQLPA
package.
Note:
Call the EXECUTE_ANALYSIS_TASK procedure using the parameters described in
"Creating a Pre-Change SQL Trial Using APIs" on page 4-4. Be sure to specify a
different value for the execution_name parameter. It is also highly recommended
that you create the post-change SQL trial using the same method as the pre-change
SQL trial by using the same value for the execution_type parameter.
If you want to run an Oracle Exadata simulation, you should
first set the CELL_SIMULATION_ENABLED task parameter to TRUE.
For more information, see "Running the Exadata Simulation Using
APIs" on page 3-14.
Note:
The following example illustrates a function call made after a system change:
Creating a Post-Change SQL Trial
5-3
Creating a Post-Change SQL Trial Using APIs
EXEC DBMS_SQLPA.EXECUTE_ANALYSIS_TASK(task_name => 'my_spa_task', execution_type => 'TEST EXECUTE', execution_name => 'my_exec_AFTER_change');
Once the post-change performance data is built, you can compare the pre-change SQL
trial to the post-change SQL trial by running a comparison analysis, as described in
Chapter 6, "Comparing SQL Trials".
See Also:
■
Oracle Database PL/SQL Packages and Types Reference to learn about
the DBMS_SQLPA.EXECUTE_ANALYSIS_TASK function
5-4 Oracle Database Real Application Testing User's Guide
6
6
Comparing SQL Trials
After the post-change SQL performance data is built, you can compare the
performance data collected in the pre-change SQL trial to the post-change SQL trial by
running a comparison analysis using SQL Performance Analyzer. After the
comparison analysis is completed, you can generate a report to identify the SQL
statements that have improved, remained unchanged, or regressed due to the system
change. The SQL Performance Analyzer report calculates two chief impact
measurements for the change in performance of each SQL statement:
■
Impact on workload
This represents the percentage of impact that this change to the SQL statement has
on the cumulative execution time of the workload, after accounting for execution
frequency. For example, a change that causes a SQL statement’s cumulative
execution time to improve from 101 seconds to 1 second—where the rest of the
workload had a total execution time of 99 seconds before the change—would have
a 50% (2x) value for this measurement.
■
Impact on SQL
This represents the percentage of impact that this change to the SQL statement has
on the SQL statement’s response time. For example, a change that causes a SQL
statement’s response time to improve from 10 seconds to 1 second will have a 90%
(10x) value for this measurement.
For more information, see "Comparing Performance Measurements" on page 2-7.
This chapter describes how to compare and analyze the performance data from the
pre-change and post-change SQL trials and contains the following topics:
■
Comparing SQL Trials Using Oracle Enterprise Manager
■
Comparing SQL Trials Using APIs
The primary interface for comparing SQL trials is Oracle
Enterprise Manager. If for some reason Oracle Enterprise Manager is
unavailable, you can compare SQL trials using the DBMS_SQLPA
PL/SQL package.
Note:
Tip: Before comparing SQL trials, you need to create a post-change
SQL trial, as described in Chapter 5, "Creating a Post-Change SQL
Trial".
Comparing SQL Trials
6-1
Comparing SQL Trials Using Oracle Enterprise Manager
Comparing SQL Trials Using Oracle Enterprise Manager
Comparing SQL trials using Oracle Enterprise Manager involves the following steps:
■
■
■
Analyzing SQL Performance Using Oracle Enterprise Manager
Reviewing the SQL Performance Analyzer Report Using Oracle Enterprise
Manager
Tuning Regressed SQL Statements Using Oracle Enterprise Manager
Analyzing SQL Performance Using Oracle Enterprise Manager
This section describes how to analyze SQL performance before and after the system
change using Oracle Enterprise Manager.
To analyze SQL performance using Enterprise Manager:
1. On the Guided Workflow page, click the Execute icon for Compare Step 2 and
Step 3.
The Run SQL Trial Comparison page appears.
In this example, the SQL_TRIAL_1241213421833 and SQL_TRIAL_
1241213881923 trials are selected for comparison.
2.
To compare trials other than those listed by default, select the desired trials in the
Trial 1 Name and Trial 2 Name lists.
Note that you cannot compare a statistical trial with a trial that tests the explain
plan only.
3.
In the Comparison Metric list, select the comparison metric to use for the
comparison analysis:
–
Elapsed Time
–
CPU Time
–
User I/O Time
6-2 Oracle Database Real Application Testing User's Guide
Comparing SQL Trials Using Oracle Enterprise Manager
–
Buffer Gets
–
Physical I/O
–
Optimizer Cost
–
I/O Interconnect Bytes
Optimizer Cost is the only comparison metric available if you generated execution
plans only in the SQL trials.
To perform the comparison analysis by using more than one comparison metric,
perform separate comparison analyses by repeating this procedure with different
metrics.
4.
5.
In the Schedule section:
a.
In the Time Zone list, select your time zone code.
b.
Select Immediately to start the task now, or Later to schedule the task to start
at a time specified using the Date and Time fields.
Click Submit.
The Guided Workflow page appears when the comparison analysis begins.
The status icon of this step changes to an arrow icon while the comparison
analysis is in progress. To refresh the status icon, click Refresh. Depending on the
amount of performance data collected from the pre-change and post-change
executions, the comparison analysis may take a long time to complete. After the
comparison analysis is completed, the Status icon changes to a check mark and the
Execute icon for the next step is enabled.
6.
Once SQL Performance Analyzer has analyzed the pre-change and post-change
performance data, generate a SQL Performance Analyzer report that you can use
for further analysis.
On the Guided Workflow page, click the Execute icon for View Trial Comparison
Report.
The SQL Performance Analyzer Task Report page appears. Review the report, as
described in "Reviewing the SQL Performance Analyzer Report Using Oracle
Enterprise Manager" on page 6-3.
Reviewing the SQL Performance Analyzer Report Using Oracle Enterprise Manager
When a SQL Performance Analyzer task is completed, the resulting data is generated
into a SQL Performance Analyzer report that compares the pre-change and
post-change SQL performance.
Figure 6–1 shows a sample SQL Performance Analyzer report. This sample report uses
the elapsed time comparison metric to compare the pre-change and post-change
executions of a SQL workload.
Comparing SQL Trials
6-3
Comparing SQL Trials Using Oracle Enterprise Manager
Figure 6–1 SQL Performance Analyzer Report
Tip: Before you can view the SQL Performance Analyzer report,
compare the pre-change version of performance data with the
post-change version, as described in "Comparing SQL Trials Using
Oracle Enterprise Manager" on page 6-2
To generate and review the SQL Performance Analyzer report:
1. On the Software and Support page, under Real Application Testing, click SQL
Performance Analyzer.
The SQL Performance Analyzer page appears. A list of existing SQL Performance
Analyzer tasks are displayed.
2.
Under SQL Performance Analyzer Tasks, select the task for which you want to
view a SQL Performance Analyzer report and click View Latest Report.
The SQL Performance Analyzer Task Report page appears.
3.
Review the general information about the performance analysis, as described in
"Reviewing the SQL Performance Analyzer Report: General Information" on
page 6-5.
4.
Review general statistics, as described in "Reviewing the SQL Performance
Analyzer Report: Global Statistics" on page 6-5.
5.
Optionally, review the detailed statistics, as described in "Reviewing the SQL
Performance Analyzer Report: Global Statistics Details" on page 6-7.
6.
To generate an active report, click Save to generate and save the report, or Mail to
generate and mail the report as an HTML attachment.
Active reports include information about the top SQL statements from each
category (such as improved, regressed, and changed plans) with pre-change and
post-change statistics, explain plans, and task summary.
6-4 Oracle Database Real Application Testing User's Guide
Comparing SQL Trials Using Oracle Enterprise Manager
For more information, see "About SQL Performance Analyzer Active Reports" on
page 6-7.
Reviewing the SQL Performance Analyzer Report: General Information
The General Information section contains basic information and metadata about the
workload comparison performed by SQL Performance Analyzer.
To review general information:
1. On the SQL Performance Analyzer Task Report page, review the summary at the
top of the page.
This summary includes the following information:
■
■
■
2.
The name and owner of the SQL tuning set
The total number of SQL statements in the tuning set and the number of SQL
statements that had errors, are unsupported, or timed out
The names of the SQL trials and the comparison metric used
Optionally, click the link next to SQL Tuning Set Name.
The SQL Tuning Set page appears.
This page contains information—such as SQL ID and SQL text—about every SQL
statement in the SQL tuning set.
3.
Click the link next to SQL Statements With Errors if errors were found.
The Errors table reports all errors that occurred while executing a given SQL
workload. An error may be reported at the SQL tuning set level if it is common to
all SQL executions in the SQL tuning set, or at the execution level if it is specific to
a SQL statement or execution plan.
4.
Review the global statistics, as described in "Reviewing the SQL Performance
Analyzer Report: Global Statistics" on page 6-5.
Reviewing the SQL Performance Analyzer Report: Global Statistics
The Global Statistics section reports statistics that describe the overall performance of
the entire SQL workload. This section is a very important part of the SQL Performance
Analyzer analysis, because it reports on the impact of the system change on the overall
performance of the SQL workload. Use the information in this section to understand
the tendency of the workload performance, and determine how it will be affected by
the system change.
To review global statistics:
1. Review the chart in the Projected Workload Elapsed Time subsection.
The name of the subsection may vary based on the comparison
metric that is selected.
Note:
Comparing SQL Trials
6-5
Comparing SQL Trials Using Oracle Enterprise Manager
The chart shows the two trials on the x-axis and the elapsed time (in seconds) on
the y-axis.
The most important statistic is the overall impact, which is given as a percentage.
The overall impact is the difference between the improvement impact and the
regression impact. You can click the link for any impact statistic to obtain more
details, as described in "Reviewing the SQL Performance Analyzer Report: Global
Statistics Details" on page 6-7.
In this example, the improvement impact is 20%, while the regression impact is
-2%, so the overall impact of the system change is an improvement of
approximately 18%. This means that if all regressions are fixed in this example, the
overall impact of the change will be an improvement of 20%.
The overall impact percentage may sometimes be off by 1%
compared to the sum of the improvement impact and the regression
impact. This discrepancy may be caused by rounding or if the SQL
and workload time limits are set at 1%, which is the recommended
value. This enables the analysis to focus on SQL statements with
higher impact by filtering out those that have a minimal impact.
Note:
2.
Review the chart in the SQL Statement Count subsection.
The x-axis of the chart shows the number of SQL statements whose performance
improved, regressed, or remain unchanged after the system change. The y-axis
shows the number of SQL statements. The chart also indicates whether the explain
plans changed for the SQL statements.
This chart enables you to quickly weigh the relative performance of the SQL
statements. You can click any bar in the chart to obtain more details about the SQL
statements, as described in "Reviewing the SQL Performance Analyzer Report:
Global Statistics Details" on page 6-7. Only up to the top 100 SQL statements will
be displayed, even if the actual number of SQL statements exceeds 100.
In this example, all SQL statements were unchanged after the system change.
6-6 Oracle Database Real Application Testing User's Guide
Comparing SQL Trials Using Oracle Enterprise Manager
Reviewing the SQL Performance Analyzer Report: Global Statistics Details
You can use the SQL Performance Analyzer Report to obtain detailed statistics for the
SQL workload comparison. The details chart enables you to drill down into the
performance of SQL statements that appears in the report. Use the information in this
section to investigate why the performance of a particular SQL statement regressed.
The report displays only up to the top 100 SQL statements,
even if the actual number of SQL statements exceeds 100.
Note:
To review global statistics details:
1. In the Projected Workload Elapsed Time subsection, click the impact percentage of
the SQL statements for which you want to view details. To view SQL statements
whose performance:
■
Improved, click the percentage for Improvement Impact
■
Regressed, click the percentage for Regression Impact
■
Improved or regressed, click the percentage for Overall Impact
A table including the detailed statistics appears. Depending on the type of SQL
statements chosen, the following columns are included:
■
SQL ID
This column indicates the ID of the SQL statement.
■
Net Impact on Workload (%)
This column indicates the impact of the system change relative to the
performance of the SQL workload.
■
Elapsed Time
This column indicates the total time (in seconds) of the SQL statement
execution.
■
Net Impact on SQL (%)
This column indicates the local impact of the change on the performance of a
particular SQL statement.
■
New Plan
This column indicates whether the SQL execution plan changed.
2.
To view details about a particular SQL statement, click the SQL ID link for the SQL
statement that you are interested in.
The SQL Details page appears.
You can use this page to access the SQL text and obtain low-level details about the
SQL statement, such as its execution statistics and execution plan.
About SQL Performance Analyzer Active Reports
SQL Performance Analyzer active reports are HTML files that display all reporting
data using a Web-hosted interactive user interface. Similar to the SQL Performance
Analyzer reports available in Oracle Enterprise Manager, active reports include
information about the top SQL statements from each category (such as improved,
regressed, and changed plans) with pre-change and post-change statistics, explain
plans, and task summary.
Comparing SQL Trials
6-7
Comparing SQL Trials Using Oracle Enterprise Manager
SQL Performance Analyzer active reports are more useful than traditional HTML or
text reports because they offer a similar user interface as Oracle Enterprise Manager,
yet they can be viewed even when the database is unavailable, or even after a database
is dropped. Hence active reports offer the advantages of traditional reporting and
dynamic Oracle Enterprise Manager analysis, but eliminates the disadvantages of
both. Moreover, active reports contain more information about the comparison
analysis and provide more user interactive options. It is strongly recommended that
you use active reports instead of HTML or text reports.
The active report user interface components are very similar to those displayed in
Oracle Enterprise Manager. For descriptions of the user interface components, see the
related sections described in "Reviewing the SQL Performance Analyzer Report Using
Oracle Enterprise Manager" on page 6-3.
Tuning Regressed SQL Statements Using Oracle Enterprise Manager
After reviewing the SQL Performance Analyzer report, you should tune any regressed
SQL statements that are identified after comparing the SQL performance. If there are
large numbers of SQL statements that appear to have regressed, you should try to
identify the root cause and make system-level changes to rectify the problem. In cases
when only a few SQL statements have regressed, consider using one of the following
tuning methods to implement a point solution for them:
■
Creating SQL Plan Baselines
■
Running SQL Tuning Advisor
After tuning the regressed SQL statements, you should test these changes using SQL
Performance Analyzer. Run a new SQL trial on the test system, followed by a second
comparison (between this new SQL trial and the first SQL trial) to validate your
results. Once SQL Performance Analyzer shows that performance has stabilized, the
testing is complete. Implement the fixes from this step to your production system.
Starting with Oracle Database 11g Release 1, SQL Tuning Advisor performs an
alternative plan analysis when tuning a SQL statement. SQL Tuning Advisor searches
the current system for previous execution plans, including the plans from the first SQL
trial. If the execution plans from the first SQL trial differ from those of the second SQL
trial, SQL Tuning Advisor will recommend the plans from the first SQL trial. If these
execution plans produce better performance, you can create plan baselines using the
plans from the first SQL trial.
SQL Performance Analyzer does not provide the option to
create SQL plan baselines or run SQL Tuning Advisor directly after
after completing a remote SQL trial. In such cases, you need to use
APIs to manually transport the SQL tuning set and complete the
appropriate procedure on the remote database.
Note:
See Also:
■
Oracle Database Performance Tuning Guide for information about
alternative plan analysis
Creating SQL Plan Baselines
Creating SQL plan baselines enables the optimizer to avoid performance regressions
by using execution plans with known performance characteristics. If a performance
6-8 Oracle Database Real Application Testing User's Guide
Comparing SQL Trials Using Oracle Enterprise Manager
regression occurs due to plan changes, a SQL plan baseline can be created and used to
prevent the optimizer from picking a new, regressed execution plan.
To create SQL plan baselines:
1. On the SQL Performance Analyzer Task Result page, under Recommendations,
click Create SQL Plan Baselines.
The Create SQL Plan Baselines page appears. The Regressed SQL Statements
section lists the regressed SQL statements that will be associated with the new
SQL plan baselines.
2.
3.
Under Job Parameters, specify the parameters for the job:
a.
In the Job Name field, enter a name for the job.
b.
In the Description field, optionally enter a description for the job.
Under Schedule, select:
■
■
4.
Immediately to start the job now.
Later to schedule the job to start at a time specified using the Time Zone, Date,
and Time fields.
Click OK.
The SQL Performance Analyzer Task Result page appears. A message is displayed
to inform you that the job has been submitted successfully.
See Also:
■
Oracle Database 2 Day + Performance Tuning Guide for information
about creating and managing SQL plan baselines
Running SQL Tuning Advisor
The SQL Tuning Advisor performs an in-depth analysis of regressed SQL statements
and attempts to fix the root cause of the problem.
To run SQL Tuning Advisor:
1. On the SQL Performance Analyzer Task Result page, under Recommendations,
click Run SQL Tuning Advisor.
The Schedule SQL Tuning Task page appears.
2.
In the Tuning Task Name field, enter a name for the SQL tuning task.
3.
In the Tuning Task Description field, optionally enter a name for the SQL tuning
task.
4.
Under Schedule, select:
■
■
5.
Immediately to start the job now.
Later to schedule the job to start at a time specified using the Time Zone, Date,
and Time fields.
Click OK.
The SQL Performance Analyzer Task Result page appears. A link to the SQL
tuning report appears under Recommendations.
6.
To view the SQL tuning report, click the SQL Tune Report link.
The SQL Tuning Results page appears.
Comparing SQL Trials
6-9
Comparing SQL Trials Using APIs
See Also:
■
Oracle Database 2 Day + Performance Tuning Guide for information
about running the SQL Tuning Advisor
Comparing SQL Trials Using APIs
Comparing SQL trials using APIs involves the following steps:
■
Analyzing SQL Performance Using APIs
■
Reviewing the SQL Performance Analyzer Report Using APIs
■
Comparing SQL Tuning Sets Using APIs
■
Tuning Regressed SQL Statements Using APIs
■
Tuning Regressed SQL Statements From a Remote SQL Trial Using APIs
■
Creating SQL Plan Baselines Using APIs
■
Using SQL Performance Analyzer Views
Analyzing SQL Performance Using APIs
After the post-change SQL performance data is built, you can compare the pre-change
version of performance data to the post-change version. Run a comparison analysis
using the DBMS_SQLPA.EXECUTE_ANALYSIS_TASK procedure or function.
To compare the pre-change and post-change SQL performance data:
1.
Call the EXECUTE_ANALYSIS_TASK procedure or function using the following
parameters:
■
■
■
■
Set the task_name parameter to the name of the SQL Performance Analyzer
task.
Set the execution_type parameter to COMPARE PERFORMANCE. This
setting will analyze and compare two versions of SQL performance data.
Specify a name to identify the execution using the execution_name
parameter. If not specified, it will be generated by SQL Performance Analyzer
and returned by the function.
Specify two versions of SQL performance data using the execution_params
parameters. The execution_params parameters are specified as (name,
value) pairs for the specified execution. Set the execution parameters that are
related to comparing and analyzing SQL performance data as follows:
–
Set the execution_name1 parameter to the name of the first execution
(before the system change was made). This value should correspond to the
value of the execution_name parameter specified in "Creating a
Pre-Change SQL Trial Using APIs" on page 4-4.
–
Set the execution_name2 parameter to the name of the second
execution (after the system change was made). This value should
correspond to the value of the execution_name parameter specified in
"Creating a Post-Change SQL Trial Using APIs" on page 5-3 when you
executed the SQL workload after the system change. If the caller does not
specify the executions, then by default SQL Performance Analyzer will
always compare the last two task executions.
6-10 Oracle Database Real Application Testing User's Guide
Comparing SQL Trials Using APIs
–
Set the comparison_metric parameter to specify an expression of
execution statistics to use in the performance impact analysis. Possible
values include the following metrics or any combination of them:
elapsed_time (default), cpu_time, buffer_gets, disk_reads,
direct_writes, optimizer_cost, and io_interconnect_bytes.
For other possible parameters that you can set for comparison, see the
description of the DBMS_SQLPA package in Oracle Database PL/SQL Packages
and Types Reference.
The following example illustrates a function call:
EXEC DBMS_SQLPA.EXECUTE_ANALYSIS_TASK(task_name => 'my_spa_task', execution_type => 'COMPARE PERFORMANCE', execution_name => 'my_exec_compare', execution_params => dbms_advisor.arglist('comparison_metric', 'buffer_gets'));
2.
Call the REPORT_ANALYSIS_TASK function using the following parameters:
■
■
Set the task_name parameter to the name of the SQL Performance Analyzer
task.
Set the execution_name parameter to the name of the execution to use. This
value should match the execution_name parameter of the execution for
which you want to generate a report.
To generate a report to display the results of:
–
Execution plans generated for the SQL workload, set this value to match
the execution_name parameter of the desired EXPLAIN PLAN
execution.
–
Execution plans and execution statistics generated for the SQL workload,
set this parameter to match the value of the execution_name parameter
used in the desired TEST EXECUTE execution.
–
A comparison analysis, set this value to match the execution_name
parameter of the desired ANALYZE PERFORMANCE execution.
If unspecified, SQL Performance Analyzer generates a report for the last
execution.
■
Set the type parameter to specify the type of report to generate. Possible
values include TEXT (default), HTML, XML, and ACTIVE.
Active reports provides in-depth reporting using an interactive user interface
that enables you to perform detailed analysis even when disconnected from
the database or Oracle Enterprise Manager. It is recommended that you use
active reports instead of HTML or text reports when possible.
For information about active reports, see "About SQL Performance Analyzer
Active Reports" on page 6-7.
■
■
Set the level parameter to specify the format of the recommendations.
Possible values include TYPICAL (default), ALL, BASIC, CHANGED, CHANGED_
PLANS, ERRORS, IMPROVED, REGRESSED, TIMEOUT, UNCHANGED,
UNCHANGED_PLANS, and UNSUPPORTED.
Set the section parameter to specify a particular section to generate in the
report. Possible values include SUMMARY (default) and ALL.
Comparing SQL Trials 6-11
Comparing SQL Trials Using APIs
■
Set the top_sql parameter to specify the number of SQL statements in a SQL
tuning set to generate in the report. By default, the report shows the top 100
SQL statements impacted by the system change.
To generate an active report, run the following script:
set trimspool on
set trim on
set pages 0
set linesize 1000
set long 1000000
set longchunksize 1000000
spool spa_active.html
SELECT DBMS_SQLPA.REPORT_ANALYSIS_TASK(task_name => 'my_spa_task',
type => 'active', section => 'all') FROM dual;
spool off
The following example illustrates a portion of a SQL script that you could use to
create and display a comparison summary report in text format:
VAR rep
CLOB;
EXEC :rep := DBMS_SQLPA.REPORT_ANALYSIS_TASK('my_spa_task', 'text', 'typical', 'summary');
SET LONG 100000 LONGCHUNKSIZE 100000 LINESIZE 130
PRINT :rep
3.
Review the SQL Performance Analyzer report, as described in "Reviewing the SQL
Performance Analyzer Report Using APIs" on page 6-12.
See Also:
■
Oracle Database PL/SQL Packages and Types Reference for
information about the DBMS_SQLPA.EXECUTE_ANALYSIS_TASK
and DBMS_SQLPA.REPORT_ANALYSIS_TASK functions
Reviewing the SQL Performance Analyzer Report Using APIs
The SQL Performance Analyzer report is divided into the following sections:
■
General Information
■
Result Summary
■
Result Details
This section uses a sample report to illustrate how to review the SQL Performance
Analyzer report. The sample report uses buffer_gets as the comparison metric to
compare the pre-change and post-change executions of a SQL workload.
General Information
The General Information section contains basic information and metadata about the
SQL Performance Analyzer task, the SQL tuning set used, and the pre-change and
post-change executions. Example 6–1 shows the General Information section of a
sample report.
Example 6–1 General Information
--------------------------------------------------------------------------------------------General Information
--------------------------------------------------------------------------------------------Task Information:
6-12 Oracle Database Real Application Testing User's Guide
Workload Information:
Comparing SQL Trials Using APIs
--------------------------------------------Task Name
: my_spa_task
Task Owner
: APPS
Description :
--------------------------------------------SQL Tuning Set Name
: my_sts
SQL Tuning Set Owner
: APPS
Total SQL Statement Count : 101
Execution Information:
--------------------------------------------------------------------------------------------Execution Name : my_exec_compare
Started
: 05/21/2007 11:30:09
Execution Type : ANALYZE PERFORMANCE
Last Updated
: 05/21/2007 11:30:10
Description
:
Global Time Limit
: UNLIMITED
Scope
: COMPREHENSIVE
Per-SQL Time Limit : UNUSED
Status
: COMPLETED
Number of Errors
: 0
Analysis Information:
--------------------------------------------------------------------------------------------Comparison Metric: BUFFER_GETS
-----------------Workload Impact Threshold: 1%
-------------------------SQL Impact Threshold: 1%
---------------------Before Change Execution:
After Change Execution:
--------------------------------------------- --------------------------------------------Execution Name
: my_exec_BEFORE_change
Execution Name
: my_exec_AFTER_change
Execution Type
: TEST EXECUTE
Execution Type
: TEST EXECUTE
Description
:
Description
:
Scope
: COMPREHENSIVE
Scope
: COMPREHENSIVE
Status
: COMPLETED
Status
: COMPLETED
Started
: 05/21/2007 11:22:06
Started
: 05/21/2007 11:25:56
Last Updated
: 05/21/2007 11:24:01
Last Updated
: 05/21/2007 11:28:30
Global Time Limit
: 1800
Global Time Limit
: 1800
Per-SQL Time Limit : UNUSED
Per-SQL Time Limit : UNUSED
Number of Errors
: 0
Number of Errors
: 0
---------------------------------------------------------------------------------------------
In Example 6–1, the Task Information section indicates that the task name is my_spa_
task. The Workload Information section indicates that the task compares executions
of the my_sts SQL tuning set, which contains 101 SQL statements. As shown in the
Execution Information section, the comparison execution is named my_exec_
compare.
The Analysis Information sections shows that SQL Performance Analyzer compares
two executions of the my_sts SQL tuning set, my_exec_BEFORE_change and my_
exec_AFTER_change, using buffer_gets as a comparison metric.
Result Summary
The Result Summary section summarizes the results of the SQL Performance Analyzer
task. The Result Summary section is divided into the following subsections:
■
Overall Performance Statistics
■
Performance Statistics of SQL Statements
■
Errors
Overall Performance Statistics The Overall Performance Statistics subsection displays
statistics about the overall performance of the entire SQL workload. This section is a
very important part of the SQL Performance Analyzer analysis because it shows the
impact of the system change on the overall performance of the SQL workload. Use the
information in this section to understand the change of the workload performance,
and determine whether the workload performance will improve or degrade after
making the system change.
Comparing SQL Trials 6-13
Comparing SQL Trials Using APIs
Example 6–2 shows the Overall Performance Statistics subsection of a sample report.
Example 6–2 Overall Performance Statistics
Report Summary
--------------------------------------------------------------------------------------------Projected Workload Change Impact:
------------------------------------------Overall Impact
:
47.94%
Improvement Impact :
58.02%
Regression Impact
: -10.08%
SQL Statement Count
------------------------------------------SQL Category SQL Count Plan Change Count
Overall
101
6
Improved
2
2
Regressed
1
1
Unchanged
98
3
.
.
.
---------------------------------------------------------------------------------------------
This example indicates that the overall performance of the SQL workload improved by
47.94%, even though regressions had a negative impact of -10.08%. This means that if
all of the regressions are fixed in this example, the overall change impact will be
58.02%. After the system change, 2 of the 101 SQL statements ran faster, while 1 ran
slower. Performance of 98 statements remained unchanged.
Performance Statistics of SQL Statements The Performance Statistics subsection highlights
the SQL statements that are the most impacted by the system change. The pre-change
and post-change performance data for each SQL statement in the workload are
compared based on the following criteria:
■
■
Execution frequency, or importance, of each SQL statement
Impact of the system change on each SQL statement relative to the entire SQL
workload
■
Impact of the system change on each SQL statement
■
Whether the structure of the execution plan for each SQL statement has changed
Example 6–3 shows the Performance Statistics of SQL Statements subsection of a
sample report. The report has been altered slightly to fit on the page.
Example 6–3 Performance Statistics of SQL Statements
SQL Statements Sorted by their Absolute Value of Change Impact on the Workload
----------------------------------------------------------------------------------------------------------------------------------------------------------------------------------------|
|
| Impact on | Execution | Metric | Metric | Impact | Plan
|
| object_id | sql_id
| Workload | Frequency | Before | After
| on SQL | Change |
--------------------------------------------------------------------------------------------|
205
| 73s2sgy2svfrw |
29.01% |
100000 | 1681683 | 220590 | 86.88% |
y
|
|
206
| gq2a407mv2hsy |
29.01% |
949141 | 1681683 | 220590 | 86.88% |
y
|
|
204
| 2wtgxbjz6u2by | -10.08% |
478254 | 1653012 | 2160529 | -30.7% |
y
|
---------------------------------------------------------------------------------------------
The SQL statements are sorted in descending order by the absolute value of the net
impact on the SQL workload, that is, the sort order does not depend on whether the
impact was positive or negative.
6-14 Oracle Database Real Application Testing User's Guide
Comparing SQL Trials Using APIs
Errors The Errors subsection reports all errors that occurred during an execution. An
error may be reported at the SQL tuning set level if it is common to all executions in
the SQL tuning set, or at the execution level if it is specific to a SQL statement or
execution plan.
Example 6–4 shows an example of the Errors subsection of a SQL Performance
Analyzer report.
Example 6–4 Errors
---------------------------------------------------------------------------------SQL STATEMENTS WITH ERRORS
---------------------------------------------------------------------------------SQL ID
Error
------------- -------------------------------------------------------------------47bjmcdtw6htn ORA-00942: table or view does not exist
br61bjp4tnf7y ORA-00920: invalid relational operator
----------------------------------------------------------------------------------
Result Details
The Result Details section represents a drill-down into the performance of SQL
statements that appears in the Result Summary section of the report. Use the
information in this section to investigate why the performance of a particular SQL
statement regressed.
This section will contain an entry of every SQL statement processed in the SQL
performance impact analysis. Each entry is organized into the following subsections:
■
SQL Details
■
Execution Statistics
■
Execution Plans
SQL Details This section of the report summarizes the SQL statement, listing its
information and execution details.
Example 6–5 shows the SQL Details subsection of a sample report.
Example 6–5 SQL Details
SQL Details:
----------------------------Object ID
: 204
Schema Name
: APPS
SQL ID
: 2wtgxbjz6u2by
Execution Frequency : 1
SQL Text
: SELECT /* my_query_14_scott */ /*+ ORDERED INDEX(t1)
USE_HASH(t1) */ 'B' || t2.pg_featurevalue_05_id
pg_featurevalue_05_id, 'r' || t4.elementrange_id
pg_featurevalue_15_id, 'G' || t5.elementgroup_id
pg_featurevalue_01_id, 'r' || t6.elementrange_id . . .
.
.
.
---------------------------------------------------------------------------------------------
In Example 6–5, the report summarizes the regressed SQL statement whose ID is
2wtgxbjz6u2by and corresponding object ID is 204.
Comparing SQL Trials 6-15
Comparing SQL Trials Using APIs
Execution Statistics The Execution Statistics subsection compares execution statistics of
the SQL statement from the pre-change and post-change executions and then
summarizes the findings.
Example 6–6 shows the Execution Statistics subsection of a sample report.
Example 6–6 Execution Statistics
Execution Statistics:
------------------------------------------------------------------------------------------------------------------|
| Impact on | Value
| Value
| Impact
| % Workload | % Workload |
| Stat Name
| Workload | Before | After
| on SQL
| Before
| After
|
--------------------------------------------------------------------------------------| elapsed_time |
-95.54%| 36.484 | 143.161 |
-292.39% |
32.68% |
94.73% |
| parse_time
|
-12.37%|
.004 |
.062 |
-1450% |
.85% |
11.79% |
| exec_elapsed |
-95.89%|
36.48 | 143.099 |
-292.27% |
32.81% |
95.02% |
| exec_cpu
|
-19.73%| 36.467 | 58.345 |
-59.99% |
32.89% |
88.58% |
| buffer_gets |
-10.08%| 1653012 | 2160529 |
-30.7% |
32.82% |
82.48% |
| cost
|
12.17%|
11224 |
2771 |
75.31% |
16.16% |
4.66% |
| reads
| -1825.72%|
4091 | 455280 | -11028.82% |
16.55% |
96.66% |
| writes
|
-1500%|
0 |
15 |
-1500% |
0% |
100% |
| rows
|
|
135 |
135 |
|
|
|
--------------------------------------------------------------------------------------Notes:
----------------------------Before Change:
1. The statement was first executed to warm the buffer cache.
2. Statistics shown were averaged over next 9 executions.
After Change:
1. The statement was first executed to warm the buffer cache.
2. Statistics shown were averaged over next 9 executions.
Findings (2):
----------------------------1. The performance of this SQL has regressed.
2. The structure of the SQL execution plan has changed.
---------------------------------------------------------------------------------------------
Execution Plans The Execution Plans subsection displays the pre-change and
post-change execution plans for the SQL statement. In cases when the performance
regressed, this section also contains findings on root causes and symptoms.
Example 6–7 shows the Execution Plans subsection of a sample report.
Example 6–7 Execution Plans
Execution Plan Before Change:
----------------------------Plan Id
: 1
Plan Hash Value : 3412943215
---------------------------------------------------------------------------------------------------------| Id
| Operation
| Name
| Rows
| Bytes
| Cost | Time
|
---------------------------------------------------------------------------------------------------------|
0 | SELECT STATEMENT
|
|
1 |
126 | 11224 | 00:02:15 |
|
1 |
HASH GROUP BY
|
|
1 |
126 | 11224 | 00:02:15 |
|
2 |
NESTED LOOPS
|
|
1 |
126 | 11223 | 00:02:15 |
| * 3 |
HASH JOIN
|
|
1 |
111 | 11175 | 00:02:15 |
| * 4 |
TABLE ACCESS FULL
| LU_ELEMENTGROUP_REL |
1 |
11 |
162 | 00:00:02 |
| * 5 |
HASH JOIN
|
|
487 |
48700 | 11012 | 00:02:13 |
|
6 |
MERGE JOIN
|
|
14 |
924 | 1068 | 00:00:13 |
6-16 Oracle Database Real Application Testing User's Guide
Comparing SQL Trials Using APIs
|
7 |
SORT JOIN
|
|
5391 | 274941 | 1033 | 00:00:13 |
| * 8 |
HASH JOIN
|
|
5391 | 274941 |
904 | 00:00:11 |
| * 9 |
TABLE ACCESS FULL
| LU_ELEMENTGROUP_REL |
123 |
1353 |
175 | 00:00:03 |
| * 10 |
HASH JOIN
|
|
5352 | 214080 |
729 | 00:00:09 |
| * 11 |
TABLE ACCESS FULL
| LU_ITEM_293
|
5355 | 128520 |
56 | 00:00:01 |
| * 12 |
TABLE ACCESS FULL
| ADM_PG_FEATUREVALUE |
1629 |
26064 |
649 | 00:00:08 |
| * 13 |
FILTER
|
|
|
|
|
|
| * 14 |
SORT JOIN
|
|
1 |
15 |
36 | 00:00:01 |
| * 15 |
TABLE ACCESS FULL
| LU_ELEMENTRANGE_REL |
1 |
15 |
35 | 00:00:01 |
|
16 |
INLIST ITERATOR
|
|
|
|
|
|
| * 17 |
TABLE ACCESS BY INDEX ROWID | FACT_PD_OUT_ITM_293 | 191837 | 6522458 | 9927 | 00:02:00 |
|
18 |
BITMAP CONVERSION TO ROWIDS |
|
|
|
|
|
| * 19 |
BITMAP INDEX SINGLE VALUE | FACT_274_PER_IDX
|
|
|
|
|
| * 20 |
TABLE ACCESS FULL
| LU_ELEMENTRANGE_REL |
1 |
15 |
49 | 00:00:01 |
---------------------------------------------------------------------------------------------------------.
.
.
Execution Plan After Change:
----------------------------Plan Id
: 102
Plan Hash Value : 1923145679
-----------------------------------------------------------------------------------------------------| Id
| Operation
| Name
| Rows | Bytes | Cost | Time
|
-----------------------------------------------------------------------------------------------------|
0 | SELECT STATEMENT
|
|
1 |
126 | 2771 | 00:00:34 |
|
1 |
HASH GROUP BY
|
|
1 |
126 | 2771 | 00:00:34 |
|
2 |
NESTED LOOPS
|
|
1 |
126 | 2770 | 00:00:34 |
| * 3 |
HASH JOIN
|
|
1 |
111 | 2722 | 00:00:33 |
| * 4 |
HASH JOIN
|
|
1 |
100 | 2547 | 00:00:31 |
| * 5 |
TABLE ACCESS FULL
| LU_ELEMENTGROUP_REL |
1 |
11 | 162 | 00:00:02 |
|
6 |
NESTED LOOPS
|
|
|
|
|
|
|
7 |
NESTED LOOPS
|
| 484 | 43076 | 2384 | 00:00:29 |
| * 8 |
HASH JOIN
|
|
14 |
770 | 741 | 00:00:09 |
|
9 |
NESTED LOOPS
|
|
4 |
124 | 683 | 00:00:09 |
| * 10 |
TABLE ACCESS FULL
| LU_ELEMENTRANGE_REL |
1 |
15 |
35 | 00:00:01 |
| * 11 |
TABLE ACCESS FULL
| ADM_PG_FEATUREVALUE |
4 |
64 | 649 | 00:00:08 |
| * 12 |
TABLE ACCESS FULL
| LU_ITEM_293
| 5355 | 128520 |
56 | 00:00:01 |
|
13 |
BITMAP CONVERSION TO ROWIDS |
|
|
|
|
|
| * 14 |
BITMAP INDEX SINGLE VALUE | FACT_274_ITEM_IDX
|
|
|
|
|
| * 15 |
TABLE ACCESS BY INDEX ROWID | FACT_PD_OUT_ITM_293 |
36 |
1224 | 2384 | 00:00:29 |
| * 16 |
TABLE ACCESS FULL
| LU_ELEMENTGROUP_REL | 123 |
1353 | 175 | 00:00:03 |
| * 17 |
TABLE ACCESS FULL
| LU_ELEMENTRANGE_REL |
1 |
15 |
49 | 00:00:01 |
------------------------------------------------------------------------------------------------------
Comparing SQL Tuning Sets Using APIs
You can compare two SQL tuning sets using SQL Performance Analyzer APIs. For
example, while using Database Replay, you may have captured a SQL tuning set on
the production system during workload capture, and another SQL tuning set on a test
system during workload replay. You can then use SQL Performance Analyzer to
compare these SQL tuning sets, without having to re-execute the SQL statements. This
is useful in cases where you already have another utility to run your workload before
and after making the system change, such as a custom script.
When comparing SQL tuning sets, SQL Performance Analyzer uses the runtime
statistics captured in the SQL tuning sets to perform its comparison analysis, and
reports on any new or missing SQL statements that are found in one SQL tuning set,
but not in the other. Any changes in execution plans between the two SQL tuning sets
are also reported. For each SQL statement in both SQL tuning sets, improvement and
Comparing SQL Trials 6-17
Comparing SQL Trials Using APIs
regression findings are reported for each SQL statement—calculated based on the
average statistic value per execution—and for the entire workload—calculated based
on the cumulative statistic value.
To compare SQL tuning sets using the DBMS_SQLPA package:
1.
Create a SQL Performance Analyzer task:
VAR aname varchar2(30);
EXEC :aname := 'compare_s2s';
EXEC :aname := DBMS_SQLPA.CREATE_ANALYSIS_TASK(task_name => :aname);
It is not necessary to associate a SQL tuning set to the task during creation.
2.
Create the first SQL trial and convert the first SQL tuning set:
EXEC DBMS_SQLPA.EXECUTE_ANALYSIS_TASK(task_name => :aname, execution_type => 'convert sqlset', execution_name => 'first trial', execution_params => DBMS_ADVISOR.ARGLIST(
'sqlset_name', 'my_first_sts', 'sqlset_owner', 'APPS'));
Specify the name and owner of the SQL tuning set using the SQLSET_NAME and
SQLSET_OWNER task parameters. The content of the SQL tuning set will not be
duplicated by the SQL Performance Analyzer task. Instead, a reference to the SQL
tuning set is recorded in association to the new SQL trial, which in this example is
"first trial".
3.
Create a second SQL trial and associate it to the second SQL tuning second to
which you want to compare:
EXEC DBMS_SQLPA.EXECUTE_ANALYSIS_TASK(task_name => :aname, execution_type => 'convert sqlset', execution_name => 'second trial', execution_params => DBMS_ADVISOR.ARGLIST(
'sqlset_name', 'my_second_sts', 'sqlset_owner', 'APPS'));
4.
Compare the performance data from the two SQL trials (or SQL tuning sets) by
running a comparison analysis:
EXEC DBMS_SQLPA.EXECUTE_ANALYSIS_TASK(task_name => :aname, execution_type => 'compare', execution_name => 'comparison', execution_params => DBMS_ADVISOR.ARGLIST(
'workload_impact_threshold', 0, 'sql_impact_threshold', 0));
In this example, the workload and per-SQL impact threshold are set to 0% for
comparison (the default value is 1%).
5.
After the comparison analysis is complete, generate a SQL Performance Analyzer
report using the DBMS_SQLPA.REPORT_ANALYSIS_TASK function.
For information about generating a SQL Performance Analyzer report using APIs,
see "Analyzing SQL Performance Using APIs" on page 6-10.
Once the report is generated, review it to identify any differences between the contents
of the two SQL tuning sets. Example 6–8 shows the Analysis Information and Report
Summary sections of a sample report generated by comparing two SQL tuning sets:
6-18 Oracle Database Real Application Testing User's Guide
Comparing SQL Trials Using APIs
Example 6–8 Analysis Information and Report Summary
Analysis Information:
-----------------------------------------------------------------------------------------------Before Change Execution:
After Change Execution:
----------------------------------------------------------------------------------------Execution Name
: first trial
Execution Name
: second trial
Execution Type
: CONVERT SQLSET
Execution Type
: CONVERT SQLSET
Status
: COMPLETED
Status
: COMPLETED
Started
: …
Last Updated
: …
Before Change Workload:
--------------------------------------------SQL Tuning Set Name
: my_first_sts
SQL Tuning Set Owner
: APPS
Total SQL Statement Count : 5
After Change Workload:
--------------------------------------------SQL Tuning Set Name
: my_second_sts
SQL Tuning Set Owner
: APPS
Total SQL Statement Count : 6
-----------------------------------------------------------------------------------------------Report Summary
-----------------------------------------------------------------------------------------------Projected Workload Change Impact:
------------------------------------------Overall Impact
: 72.32%
Improvement Impact : 47.72%
Regression Impact
:
-.02%
Missing-SQL Impact :
33.1%
New-SQL Impact
: -8.48%
SQL Statement Count
------------------------------------------SQL Category
SQL Count Plan Change Count
Overall
7
1
Common
4
1
Improved
3
1
Regressed
1
0
Different
3
0
Missing SQL
1
0
New SQL
2
0
As shown in Example 6–8, this report contains two additional categories that are not
found in standard SQL Performance Analyzer reports; both categories are grouped
under the heading Different:
■
Missing SQL
This category represents all SQL statements that are present in the first SQL tuning
set, but are not found in the second SQL tuning set. In this example, only one SQL
statement is missing. As shown in Example 6–9, this SQL statement has:
■
–
A sql_id value of gv7xb8tyd1v91
–
A performance impact on the workload of 33.1% based on the change
–
No performance impact on the SQL statement based on the change because its
"Total Metric After" change value is missing
New SQL
This category represents all SQL statements that are present in the second SQL
tuning set, but are not found in the first SQL tuning set. In this example, only two
Comparing SQL Trials 6-19
Comparing SQL Trials Using APIs
SQL statements are new in the second SQL tuning set. As shown in Example 6–9,
these SQL statements have:
–
sql_id values of 4c8nrqxhtb2sf and 9utadgu5udmh4
–
A total performance impact on the workload of -8.48%
–
Missing "Total Metric Before" change values
Example 6–9 shows a table in the sample report that lists the missing and new SQL
statements, as well as other top SQL statements as determined by their impact on the
workload:
Example 6–9 Top 7 SQL Sorted by Absolute Value of Change Impact on the Workload
Top 7 SQL Sorted by Absolute Value of Change Impact on the Workload
----------------------------------------------------------------------------------------------------------------------------------------------------------------------------------|
|
| Impact on | Total Metric | Total Metric | Impact | Plan
|
| object_id | sql_id
| Workload |
Before
|
After
| on SQL | Change |
-----------------------------------------------------------------------------------------|
4 | 7gj3w9ya4d9sj |
41.04% |
812791 |
36974 |
95% | y
|
|
7 | gv7xb8tyd1v91 |
33.1% |
625582 |
|
| n
|
|
2 | 4c8nrqxhtb2sf |
-8.35% |
|
157782 |
| n
|
|
1 | 22u3tvrt0yr6g |
4.58% |
302190 |
215681 | 28.63% | n
|
|
6 | fgdd0fd56qmt0 |
2.1% |
146128 |
106369 | 27.21% | n
|
|
5 | 9utadgu5udmh4 |
-.13% |
|
2452 |
| n
|
|
3 | 4dtv43awxnmv3 |
-.02% |
3520 |
3890 | -47.35% | n
|
------------------------------------------------------------------------------------------
Once you have identified a SQL statement of interest, you can generate a report for the
SQL statement to perform more detailed investigation. For example, you may want to
investigate the SQL statement with the sql_id value of 7gj3w9ya4d9sj and object_
id value of 4 because it has the highest impact on the workload:
SELECT DBMS_SQLPA.REPORT_ANALYSIS_TASK(task_name => :aname, object_id => 4) rep
FROM dual;
Example 6–10 shows a sample report generated for this SQL statement:
Example 6–10
Sample Report for SQL Statement
SQL Details:
----------------------------Object ID : 4
SQL ID
: 7gj3w9ya4d9sj
SQL Text
: /* my_csts_query1 */ select * FROM emp where empno=2
SQL Execution Statistics (average):
----------------------------------------------------------------------------------------------|
| Impact on | Value
| Value
| Impact |
| Stat Name
| Workload | Before | After
| on SQL |
--------------------------------------------------------| elapsed_time |
41.04% | .036945 | .001849 |
95% |
| cpu_time
|
13.74% | .004772 | .00185 | 61.24% |
| buffer_gets |
9.59% |
8 |
2 | 69.01% |
| cost
|
11.76% |
1 |
1 |
10% |
| reads
|
4.08% |
0 |
0 | 63.33% |
| writes
|
0% |
0 |
0 |
0% |
| rows
|
|
0 |
0 |
|
| executions
|
|
22 |
20 |
|
6-20 Oracle Database Real Application Testing User's Guide
Comparing SQL Trials Using APIs
| plan_count
|
|
3 |
2 |
|
--------------------------------------------------------Findings (2):
----------------------------1. The performance of this SQL has improved.
2. The structure of the SQL execution plan has changed.
Plan Execution Statistics (average):
-----------------------------------------------------------------------------------------------------------------------| Statistic Name | Plans Before Change
| Plans After Change
|
---------------------------------------------------------------------------------| plan hash value | 440231712 571903972 3634526668 | 571903972 3634526668
|
| --------------- | --------- --------- ---------- | --------- ---------|
| schema name
| APPS1
APPS2
APPS2
| APPS2
APPS2
|
| executions
| 7
5
10
| 10
10
|
| cost
| 2
1
2
| 1
2
|
| elapsed_time
| .108429
.000937
.00491
| .000503
.003195
|
| cpu_time
| .00957
.0012
.0032
| .0005
.0032
|
| buffer_gets
| 18
0
5
| 0
5
|
| reads
| 0
0
0
| 0
0
|
| writes
| 0
0
0
| 0
0
|
| rows
| 0
0
0
| 0
0
|
---------------------------------------------------------------------------------Execution Plans Before Change:
----------------------------Plan Hash Value : 440231712
--------------------------------------------------------------------------| Id | Operation
| Name
| Rows | Bytes | Cost | Time
|
--------------------------------------------------------------------------| 0 | SELECT STATEMENT
|
|
|
|
2 |
|
| 1 |
PX COORDINATOR
|
|
|
|
|
|
| 2 |
PX SEND QC (RANDOM) | :TQ10000 |
1 |
87 |
2 | 00:00:01 |
| 3 |
PX BLOCK ITERATOR |
|
1 |
87 |
2 | 00:00:01 |
| 4 |
TABLE ACCESS FULL | EMP
|
1 |
87 |
2 | 00:00:01 |
--------------------------------------------------------------------------Note
----- dynamic sampling used for this statement
Plan Hash Value : 571903972
---------------------------------------------------------------------------------| Id | Operation
| Name
| Rows | Bytes | Cost | Time
|
---------------------------------------------------------------------------------| 0 | SELECT STATEMENT
|
|
|
|
1 |
|
| 1 |
TABLE ACCESS BY INDEX ROWID | EMP
|
1 |
87 |
1 |00:00:01|
| 2 |
INDEX UNIQUE SCAN
| MY_EMP_IDX |
1 |
|
0 |
|
---------------------------------------------------------------------------------Plan Hash Value : 3634526668
-------------------------------------------------------------------| Id | Operation
| Name | Rows | Bytes | Cost | Time
|
-------------------------------------------------------------------| 0 | SELECT STATEMENT
|
|
|
|
2 |
|
| 1 |
TABLE ACCESS FULL | EMP |
1 |
87 |
2 | 00:00:01 |
-------------------------------------------------------------------Note
----- dynamic sampling used for this statement
Executions Plan After Change:
-----------------------------
Comparing SQL Trials 6-21
Comparing SQL Trials Using APIs
Plan Hash Value : 571903972
---------------------------------------------------------------------------------| Id | Operation
| Name
| Rows | Bytes | Cost | Time
|
---------------------------------------------------------------------------------| 0 | SELECT STATEMENT
|
|
|
|
1 |
|
| 1 |
TABLE ACCESS BY INDEX ROWID | EMP
|
1 |
87 |
1 |00:00:01|
| 2 |
INDEX UNIQUE SCAN
| MY_EMP_IDX |
1 |
|
0 |
|
---------------------------------------------------------------------------------Plan Hash Value : 3634526668
-------------------------------------------------------------------| Id | Operation
| Name | Rows | Bytes | Cost | Time
|
-------------------------------------------------------------------| 0 | SELECT STATEMENT
|
|
|
|
2 |
|
| 1 |
TABLE ACCESS FULL | EMP |
1 |
87 |
2 | 00:00:01 |
-------------------------------------------------------------------Note
----- dynamic sampling used for this statement
----------------------------------------------------------------------------------
The SQL Execution Statistics section shows the average runtime statistics (per
execution) of the SQL statement. The data in this table reveals that this SQL statement
is present in both SQL tuning sets, but that it has only three execution plans in the first
SQL tuning set and two execution plans in the second SQL tuning set. Furthermore,
the SQL statement was executed 22 times in the first SQL tuning set, but only 20 times
in the second SQL tuning set.
The Plan Execution Statistics section shows runtime statistics per execution plan (or
plan hash value). The Plans Before Change column lists plans and their associated
execution statistics for the first SQL tuning set; the Plans After Change columns lists
these values for the second SQL tuning set. Execution plans structures for both SQL
tuning sets are shown at the end of the report.
You can use these sections in the report to identify changes in execution plans between
two SQL tuning sets. This is important because changes in execution plans may be a
result of test changes that can have a direct impact to performance. When comparing
two SQL tuning sets, SQL Performance Analyzer reports execution plan changes when
a SQL statement has:
■
One plan in both SQL tuning sets, but the plan structure is different
■
More than one plan, and the number of plans in both SQL tuning sets are:
–
The same, but at least one plan in the second SQL tuning set is different from
all plans in the first SQL tuning set
–
Different
After evaluating the SQL statement and plan changes, determine if further action is
required. If the SQL statement has regressed, perform one of the following actions:
■
■
Tune the regressed SQL statement, as described in "Tuning Regressed SQL
Statements Using APIs" on page 6-22
Create SQL plan baselines, as described in "Creating SQL Plan Baselines Using
APIs" on page 6-26
Tuning Regressed SQL Statements Using APIs
After reviewing the SQL Performance Analyzer report, you should tune any regressed
SQL statements that are identified after comparing the SQL performance. If there are
6-22 Oracle Database Real Application Testing User's Guide
Comparing SQL Trials Using APIs
large numbers of SQL statements that appear to have regressed, you should try to
identify the root cause and make system-level changes to rectify the problem. In cases
when only a few SQL statements have regressed, consider using the SQL Tuning
Advisor to implement a point solution for them, or creating SQL plan baselines to
instruct the optimizer to select the original execution plan in the future.
To tune regressed SQL statements reported by SQL Performance Analyzer using APIs,
create a SQL tuning task for the SQL Performance Analyzer execution by using the
CREATE_TUNING_TASK function in the DBMS_SQLTUNE package:
BEGIN
DBMS_SQLTUNE.CREATE_TUNING_TASK(
spa_task_name => 'my_spa_task',
spa_task_owner => 'immchan',
spa_compare_exec => 'my_exec_compare');
DBMS_SQLTUNE.EXECUTE_TUNING_TASK(spa_task_name => 'my_spa_task');
END;
/
This example creates and executes a SQL tuning task to tune the SQL statements that
regressed in the compare performance execution named my_exec_compare of the
SQL Performance Analyzer task named my_spa_task. In this case, it is important to
use this version of the CREATE_TUNING_TASK function call. Otherwise, SQL
statements may be tuned in the environment from the production system where they
were captured, which will not reflect the system change.
If you chose to execute the SQL workload remotely on a
separate database, you should not use this version of the CREATE_
TUNING_TASK function call to tune regressed SQL statements.
Instead, you should tune any regressions identified by the SQL trials
on the remote database, because the application schema is not on the
database running SQL Performance Analyzer. Therefore, you need to
run SQL Tuning Advisor on the database where the schema resides
and where the change was made. For more information, see "Tuning
Regressed SQL Statements From a Remote SQL Trial Using APIs" on
page 6-24.
Note:
Table 6–1 lists the SQL Performance Analyzer parameters that can be used with the
DBMS_SQLTUNE.CREATE_TUNING_TASK function.
Table 6–1
CREATE_TUNING_TASK Function SQL Performance Analyzer Parameters
Parameter
Description
SPA_TASK_NAME
Name of the SQL Performance Analyzer task.
SPA_TASK_OWNER
Owner of the specified SQL Performance Analyzer task. If unspecified,
this parameter will default to the current user.
SPA_COMPARE_EXEC Execution name of the compare performance trial for the specified SQL
Performance Analyzer task. If unspecified, this parameter defaults to
the most recent execution of the COMPARE PERFORMANCE type for the
given SQL Performance Analyzer task.
After tuning the regressed SQL statements, you should test these changes using SQL
Performance Analyzer. Run a new SQL trial on the test system, followed by a second
comparison (between this new SQL trial and the first SQL trial) to validate your
Comparing SQL Trials 6-23
Comparing SQL Trials Using APIs
results. Once SQL Performance Analyzer shows that performance has stabilized,
implement the fixes from this step to your production system.
Starting with Oracle Database 11g Release 2, SQL Tuning Advisor performs an
alternative plan analysis when tuning a SQL statement. SQL Tuning Advisor reviews
the execution history of the SQL statement, including any historical plans stored in the
Automatic Workload Repository. If SQL Tuning Advisor finds alternate plans, it
allows you to choose a specific plan and create a plan baseline to ensure that the
desired execution plan is used for that SQL statement.
See Also:
■
■
■
Oracle Database Performance Tuning Guide for information about
using the SQL Tuning Advisor
Oracle Database Performance Tuning Guide for information about
alternative plan analysis
Oracle Database PL/SQL Packages and Types Reference for
information about the DBMS_SQLTUNE package
Tuning Regressed SQL Statements From a Remote SQL Trial Using APIs
If you chose to execute the SQL workload remotely on a separate database, then you
should tune any regressions identified by the SQL trials on the remote database,
instead of the system where the SQL Performance Analyzer task resides.
To tune regressed SQL statements from a remote SQL trial:
1.
On the system running SQL Performance Analyzer, create a subset of the
regressed SQL statements as a SQL tuning set:
DECLARE
sqlset_cur DBMS_SQLTUNE.SQLSET_CURSOR;
BEGIN
DBMS_SQLTUNE.CREATE_SQLSET('SUB_STS1', 'test purpose');
OPEN sqlset_cur FOR
SELECT value(p)
FROM table(
DBMS_SQLTUNE.SELECT_SQLPA_TASK(
task_name => 'SPA_TASK1',
execution_name => 'COMP',
level_filter => 'REGRESSED')) p;
DBMS_SQLTUNE.LOAD_SQLSET('SUB_STS1', sqlset_cur);
CLOSE sqlset_cur;
END;
/
Other than 'REGRESSED', you can use other filters to select SQL statements for
the SQL tuning set, such as 'CHANGED', 'ERRORS', or 'CHANGED_PLANS'. For
more information, see Oracle Database PL/SQL Packages and Types Reference.
2.
Create a staging table to where the SQL tuning set will be exported:
BEGIN
DBMS_SQLTUNE.CREATE_STGTAB_SQLSET(
table_name => 'STG_TAB1',
schema_name => 'JOHNDOE',
tablespace_name => 'TBS_1',
6-24 Oracle Database Real Application Testing User's Guide
Comparing SQL Trials Using APIs
db_version => DBMS_SQLTUNE.STS_STGTAB_11_1_VERSION);
END;
/
Use the db_version parameter to specify the appropriate database version to
where the SQL tuning set will be exported and tuned. In this example, the staging
table will be created with a format so that it can be exported to a system running
Oracle Database 11g Release 1, where it will later be tuned using SQL Tuning
Advisor. For other database versions, see Oracle Database PL/SQL Packages and
Types Reference for that release.
3.
Export the SQL tuning set into the staging table:
BEGIN
DBMS_SQLTUNE.PACK_STGTAB_SQLSET(
sqlset_name => 'SUB_STS1',
sqlset_owner => 'JOHNDOE',
staging_table_name => 'STG_TAB1',
staging_schema_owner => 'JOHNDOE',
db_version => DBMS_SQLTUNE.STS_STGTAB_11_1_VERSION);
END;
/
4.
Move the staging table to the remote database (where the SQL workload was
executed) using the mechanism of choice (such as Oracle Data Pump or database
link).
5.
On the remote database, import the SQL tuning set from the staging table:
BEGIN
DBMS_SQLTUNE.UNPACK_STGTAB_SQLSET(
sqlset_name => 'SUB_STS1',
staging_table_name => 'STG_TAB1',
replace => TRUE);
END;
/
6.
Tune the regressed SQL statements in the SQL tuning set by running SQL Tuning
Advisor:
BEGIN
sts_name := 'SUB_STS1';
sts_owner := 'JOHNDOE';
tune_task_name := 'TUNE_TASK1';
tname := DBMS_SQLTUNE.CREATE_TUNING_TASK(sqlset_name => sts_name,
sqlset_owner => sts_owner,
task_name
=> tune_task_name);
EXEC DBMS_SQLTUNE.SET_TUNING_TASK_PARAMETER(:tname,
’APPLY_CAPTURED_COMPILENV’,
’FALSE’);
exec_name := DBMS_SQLTUNE.EXECUTE_TUNING_TASK(tname);
END;
/
Note: The APPLY_CAPTURED_COMPILENV parameter used in this
example is only supported by Oracle Database 11g Release 1 and
newer releases. If you are testing a database upgrade from an earlier
version of Oracle Database, SQL Tuning Advisor will use the
environment variables stored in the SQL tuning set instead.
Comparing SQL Trials 6-25
Comparing SQL Trials Using APIs
After tuning the regressed SQL statements, you should test these changes using SQL
Performance Analyzer. Run a new SQL trial on the test system, followed by a second
comparison (between this new SQL trial and the first SQL trial) to validate your
results. Once SQL Performance Analyzer shows that performance has stabilized,
implement the fixes from this step to your production system.
See Also:
■
■
Oracle Database Performance Tuning Guide for information about
using the SQL Tuning Advisor and transporting SQL tuning sets
Oracle Database PL/SQL Packages and Types Reference for
information about the DBMS_SQLTUNE package
Creating SQL Plan Baselines Using APIs
Creating SQL plan baselines for regressed SQL statements with plan changes is
another option to running the SQL Tuning Advisor. Doing so instructs the optimizer
to use the original execution plans for these SQL statements in the future.
To create SQL plan baselines for the original plans, first create a subset of a SQL tuning
set of only the regressed SQL statements. Next, create SQL plan baselines for this
subset of SQL statements by loading their plans using the LOAD_PLANS_FROM_
SQLSET function of the DBMS_SPM package, as shown in the following example:
DECLARE
my_plans PLS_INTEGER;
BEGIN
my_plans := DBMS_SPM.LOAD_PLANS_FROM_SQLSET(
sqlset_name => 'regressed_sql');
END;
/
See Also:
■
■
Oracle Database Performance Tuning Guide for information about
using SQL plan baselines
Oracle Database PL/SQL Packages and Types Reference for
information about the DBMS_SPM package
Using SQL Performance Analyzer Views
You can query the following views to monitor SQL Performance Analyzer and view
its analysis results:
The information available in these views are also contained in
the SQL Performance Analyzer report. It is recommended that you
use the SQL Performance Analyzer report to view analysis results
instead. Consider using these views only for performing more
advanced analysis of the results.
Note:
■
■
The DBA_ADVISOR_TASKS and USER_ADVISOR_TASKS views display
descriptive information about the SQL Performance Analyzer task that was
created.
The DBA_ADVISOR_EXECUTIONS and USER_ADVISOR_EXECUTIONS views
display information about task executions. SQL Performance Analyzer creates at
6-26 Oracle Database Real Application Testing User's Guide
Comparing SQL Trials Using APIs
least three executions to analyze the SQL performance impact caused by a
database change on a SQL workload. The first execution collects a pre-change
version of the performance data. The second execution collects a post-change
version of the performance data. The third execution performs the comparison
analysis.
■
■
■
■
The DBA_ADVISOR_FINDINGS and USER_ADVISOR_FINDINGS views display
the SQL Performance Analyzer findings. SQL Performance Analyzer generates the
following types of findings:
–
Problems, such as performance regression
–
Symptoms, such as when the structure of an execution plan has changed
–
Errors, such as nonexistence of an object or view
–
Informative messages, such as when the structure of an execution plan in the
pre-change version is different than the one stored in the SQL tuning set
The DBA_ADVISOR_SQLPLANS and USER_ADVISOR_SQLPLANS views display a
list of all execution plans.
The DBA_ADVISOR_SQLSTATS and USER_ADVISOR_SQLSTATS views display a
list of all SQL compilations and execution statistics.
The V$ADVISOR_PROGRESS view displays the operation progress of SQL
Performance Analyzer. Use this view to monitor how many SQL statements have
completed or are awaiting execution in a SQL trial. The SOFAR column indicates
the number of SQL statements processed so far, and the TOTAL WORK column
shows the total number of SQL statements to be processed by the task execution.
You must have the SELECT_CATALOG_ROLE role to access the DBA views.
See Also:
■
Oracle Database Reference for information about the DBA_
ADVISOR_TASKS, DBA_ADVISOR_EXECUTIONS, and DBA_
ADVISOR_SQLPLANS views
Comparing SQL Trials 6-27
Comparing SQL Trials Using APIs
6-28 Oracle Database Real Application Testing User's Guide
7
7
Testing a Database Upgrade
SQL Performance Analyzer supports testing database upgrades from Oracle9i and
later releases to Oracle Database 10g Release 2 or newer releases. The methodology
used to test a database upgrade from Oracle9i Database and Oracle Database 10g
Release 1 is slightly different from the one used to test a database upgrade from Oracle
Database 10g Release 2 and later releases, so both methodologies are described here.
This chapter describes how to use SQL Performance Analyzer in a database upgrade
and contains the following sections:
■
Upgrading from Oracle9i Database and Oracle Database 10g Release 1
■
Upgrading from Oracle Database 10g Release 2 and Newer Releases
■
Tuning Regressed SQL Statements After Testing a Database Upgrade
For information about using SQL Performance Analyzer in
other cases, see "SQL Performance Analyzer" on page 1-1
Note:
Upgrading from Oracle9i Database and Oracle Database 10g Release 1
As illustrated in Figure 7–1, SQL Performance Analyzer supports testing database
upgrades of Oracle9i Database and Oracle Database 10g Release 1 to Oracle Database
10g Release 2 and later releases by building a SQL tuning set from SQL trace files
captured on the production system, executing the SQL tuning set on the upgraded
database remotely over a database link, and then comparing the results to those
captured on the production system. Because SQL Performance Analyzer only accepts a
set of SQL statements stored in a SQL tuning set as its input source, and SQL tuning
sets are not supported in Oracle9i Database, a SQL tuning set must be constructed so
that it can be used as an input source for SQL Performance Analyzer if you are
upgrading from Oracle9i Database.
Testing a Database Upgrade
7-1
Upgrading from Oracle9i Database and Oracle Database 10g Release 1
Figure 7–1 SQL Performance Analyzer Workflow for Database Upgrade from Oracle9i to
Oracle Database 10g Release 2
The production system which you are upgrading from should be running Oracle9i or
Oracle Database 10g Release 1. The test system which you are upgrading to should be
running Oracle Database 10g Release 2 or a newer release. The database version can be
release 10.2.0.2 or higher. If you are upgrading to Oracle Database 10g release 10.2.0.2,
10.2.0.3, or 10.2.0.4, you will also need to install a one-off patch before proceeding.
To ensure that the analysis made by SQL Performance Analyzer is accurate, the test
system should resemble the production system as closely as possible because the
performance on both systems will be compared to each other. Furthermore, the
hardware configurations on both systems should also be as similar as possible.
Next, you will need to set up a separate SQL Performance Analyzer system running
Oracle Database 11g Release 2. You will be using this system to build a SQL tuning set
and to run SQL Performance Analyzer. Neither your production data or schema need
to be available on this system, since the SQL tuning set will be built using statistics
stored in the SQL trace files from the production system. SQL Performance Analyzer
tasks will be executed remotely on the test system to generate the execution plan and
statistics for the SQL trial over a database link that you specify. The database link must
be a public database link that connects to a user with the EXECUTE privilege for the
DBMS_SQLPA package and the ADVISOR privilege on the test system. You should also
drop any existing PLAN_TABLE from the user’s schema on the test system.
Once the upgrade environment is configured as described, perform the steps as
described in the following procedure to use SQL Performance Analyzer in a database
upgrade from Oracle9i or Oracle Database 10g Release 1 to a newer release.
1.
Enable the SQL Trace facility on the production system, as described in "Enabling
SQL Trace on the Production System" on page 7-3.
To minimize the performance impact on the production system and still be able to
fully capture a representative set of SQL statements, consider enabling SQL Trace
for only a subset of the sessions, for as long as required, to capture all important
SQL statements at least once.
7-2 Oracle Database Real Application Testing User's Guide
Upgrading from Oracle9i Database and Oracle Database 10g Release 1
2.
On the production system, create a mapping table, as described in "Creating a
Mapping Table" on page 7-4.
This mapping table will be used to convert the user and object identifier numbers
in the SQL trace files to their string equivalents.
3.
Move the SQL trace files and the mapping table from the production system to the
SQL Performance Analyzer system, as described in "Creating a Mapping Table" on
page 7-4.
4.
On the SQL Performance Analyzer system, construct a SQL tuning set using the
SQL trace files, as described in "Building a SQL Tuning Set" on page 7-4.
The SQL tuning set will contain the SQL statements captured in the SQL trace
files, along with their relevant execution context and statistics.
5.
On the SQL Performance Analyzer system, use SQL Performance Analyzer to
create a SQL Performance Analyzer task and convert the contents in the SQL
tuning set into a pre-upgrade SQL trial that will be used as a baseline for
comparison, then remotely test execute the SQL statements on the test system over
a database link to build a post-upgrade SQL trial, as described in "Testing
Database Upgrades from Oracle9i Database and Oracle Database 10g Release 1" on
page 7-6.
6.
Compare SQL performance and fix regressed SQL.
SQL Performance Analyzer compares the performance of SQL statements read
from the SQL tuning set during the pre-upgrade SQL trial to those captured from
the remote test execution during the post-upgrade SQL trial. A report is produced
to identify any changes in execution plans or performance of the SQL statements.
If the report reveals any regressed SQL statements, you can make further changes
to fix the regressed SQL, as described in "Tuning Regressed SQL Statements After
Testing a Database Upgrade" on page 7-15.
Repeat the process of executing the SQL tuning set and comparing its performance
to a previous execution to test any changes made until you are satisfied with the
outcome of the analysis.
Enabling SQL Trace on the Production System
Oracle9i uses the SQL Trace facility to collect performance data on individual SQL
statements. The information generated by SQL Trace is stored in SQL trace files. SQL
Performance Analyzer consumes the following information from these files:
■
SQL text and username under which parse occurred
■
Bind values for each execution
■
CPU and elapsed times
■
Physical reads and logical reads
■
Number of rows processed
■
Execution plan for each SQL statement (only captured if the cursor for the SQL
statement is closed)
Although it is possible to enable SQL Trace for an instance, it is recommended that
you enable SQL Trace for a subset of sessions instead. When the SQL Trace facility is
enabled for an instance, performance statistics for all SQL statements executed in the
instance are stored into SQL trace files. Using SQL Trace in this way can have a severe
performance impact and may result in increased system overhead, excessive CPU
Testing a Database Upgrade
7-3
Upgrading from Oracle9i Database and Oracle Database 10g Release 1
usage, and inadequate disk space. It is required that trace level be set to 4 to capture
bind values, along with the execution plans.
For production systems running Oracle Database 10g Release 1, use the DBMS_
MONITOR.SESSION_TRACE_ENABLE procedure to enable SQL Trace transparently in
another session. You should also enable binds explicitly by setting the binds
procedure parameter to TRUE (its default value is FALSE).
After enabling SQL Trace, identify the SQL trace files containing statistics for a
representative set of SQL statements that you want to use with SQL Performance
Analyzer. You can then copy the SQL trace files to the SQL Performance Analyzer
system. Once the SQL workload is captured in the SQL trace files, disable SQL Trace
on the production system.
See Also:
■
■
Oracle Database Performance Tuning Guide for additional
considerations when using SQL Trace, such as setting
initialization parameters to manage SQL trace files
Oracle Database PL/SQL Packages and Types Reference for
information about the DBMS_MONITOR package
Creating a Mapping Table
To convert the user and object identifier numbers stored in the SQL trace files to their
respective names, you need to provide a table that specifies each mapping. The SQL
Performance Analyzer system will read this mapping table when converting the trace
files into a SQL tuning set.
To create a mapping table, run the following SQL statements on the production
database:
CREATE TABLE mapping AS
SELECT object_id id, owner, SUBSTR(object_name, 1, 30) name FROM dba_objects
WHERE object_type NOT IN ('CONSUMER GROUP', 'EVALUATION CONTEXT', ’FUNCTION’,
'INDEXTYPE', 'JAVA CLASS', ’JAVA DATA’,
'JAVA RESOURCE', 'LIBRARY', ’LOB’, ’OPERATOR’,
'PACKAGE', 'PACKAGE BODY', ’PROCEDURE’, ’QUEUE’,
'RESOURCE PLAN', ’SYNONYM’, 'TRIGGER', ’TYPE’,
’TYPE BODY’)
UNION ALL
SELECT user_id id, username owner, null name FROM dba_users;
Once the mapping table is created, you can use Data Pump to transport it to the SQL
Performance Analyzer system.
See Also:
■
Oracle Database Utilities for information about using Data Pump
Building a SQL Tuning Set
Once the SQL trace files and mapping table are moved to the SQL Performance
Analyzer system, you can build a SQL tuning set using the DBMS_SQLTUNE package.
To build a SQL tuning set:
1.
Copy the SQL trace files to a directory on the SQL Performance Analyzer system.
2.
Create a directory object for this directory.
7-4 Oracle Database Real Application Testing User's Guide
Upgrading from Oracle9i Database and Oracle Database 10g Release 1
3.
Use the DBMS_SQLTUNE.SELECT_SQL_TRACE function to read the SQL
statements from the SQL trace files.
For each SQL statement, only information for a single execution is collected. The
execution frequency of each SQL statement is not captured. Therefore, when
performing a comparison analysis for a production system running Oracle
Database 10g Release 1 and older releases, you should ignore the workload-level
statistics in the SQL Performance Analyzer report and only evaluate performance
changes on an execution level.
The following example reads the contents of SQL trace files stored in the sql_
trace_prod directory object and loads them into a SQL tuning set.
DECLARE
cur sys_refcursor;
BEGIN
DBMS_SQLTUNE.CREATE_SQLSET(’my_sts_9i’);
OPEN cur FOR
SELECT VALUE (P)
FROM table(DBMS_SQLTUNE.SELECT_SQL_TRACE('sql_trace_prod', ’%ora%’)) P;
DBMS_SQLTUNE.LOAD_SQLSET(’my_sts_9i’, cur);
CLOSE cur;
END;
/
The syntax for the SELECT_SQL_TRACE function is as follows:
DBMS_SQLTUNE.SELECT_SQL_TRACE (
directory
IN VARCHAR2,
file_name
IN VARCHAR2 := NULL,
mapping_table_name
IN VARCHAR2 := NULL,
mapping_table_owner
IN VARCHAR2 := NULL,
select_mode
IN POSITIVE := SINGLE_EXECUTION,
options
IN BINARY_INTEGER := LIMITED_COMMAND_TYPE,
pattern_start
IN VARCHAR2 := NULL,
parttern_end
IN VARCHAR2 := NULL,
result_limit
IN POSITIVE := NULL)
RETURN sys.sqlset PIPELINED;
Table 7–1 describes the available parameters for the SELECT_SQL_TRACE function.
Table 7–1
DBMS_SQLTUNE.SELECT_SQL_TRACE Function Parameters
Parameter
Description
directory
Specifies the directory object pointing to the directory where the
SQL trace files are stored.
file_name
Specifies all or part of the name of the SQL trace files to process.
If unspecified, the current or most recent trace file in the
specified directory will be used. % wildcards are supported for
matching trace file names.
mapping_table_name
Specifies the name of the mapping table. If set to the default
value of NULL, mappings from the current database will be used.
Note that the mapping table name is not case-sensitive.
mapping_table_owner
Specifies the schema where the mapping table resides. If set to
NULL, the current schema will be used.
Testing a Database Upgrade
7-5
Upgrading from Oracle9i Database and Oracle Database 10g Release 1
Table 7–1 (Cont.) DBMS_SQLTUNE.SELECT_SQL_TRACE Function Parameters
Parameter
Description
select_mode
Specifies the mode for selecting SQL statements from the trace
files. The default value is SINGLE_EXECUTION. In this mode,
only statistics for a single execution per SQL statement will be
loaded into the SQL tuning set. The statistics are not cumulative,
as is the case with other SQL tuning set data source table
functions.
options
Specifies the options for the operation. The default value is
LIMITED_COMMAND_TYPE, only SQL types that are meaningful
to SQL Performance Analyzer (such as SELECT, INSERT,
UPDATE, and DELETE) are returned from the SQL trace files.
pattern_start
Specifies the opening delimiting pattern of the trace file sections
to consider. This parameter is currently not used.
pattern_end
Specifies the closing delimiting pattern of the trace file sections
to process. This parameter is currently not used.
result_limit
Specifies the top SQL from the (filtered) source. The default
value is 231, which represents unlimited.
See Also:
■
Oracle Database PL/SQL Packages and Types Reference for
information about the DBMS_SQLTUNE package
Testing Database Upgrades from Oracle9i Database and Oracle Database 10g Release 1
Once the SQL tuning set is built, you can use SQL Performance Analyzer to build a
pre-upgrade SQL trial from the execution plans and run-time statistics in the SQL
tuning set. After the pre-upgrade SQL trial is built, you need to perform a test execute
or generate plans of SQL statements in the SQL tuning set on the test system to build a
post-upgrade SQL trial. SQL Performance Analyzer test executes the SQL statements
using a public database link that you specify by connecting to the test system remotely
and generating the execution plans and statistics for the SQL trial. The database link
should exist on the SQL Performance Analyzer system and connect to a remote user
with privileges to execute the SQL tuning set on the test system.
You can run SQL Performance Analyzer to test a database upgrade from Oracle9i
Database or Oracle Database 10g Release 1 using Oracle Enterprise Manager or APIs,
as described in the following sections:
■
■
Testing Database Upgrades from Oracle9i Database and Oracle Database 10g
Release 1 Using Enterprise Manager
Testing Database Upgrades from Oracle9i Database and Oracle Database 10g
Release 1 Using APIs
Testing Database Upgrades from Oracle9i Database and Oracle Database 10g
Release 1 Using Enterprise Manager
To test a database upgrade from Oracle9i Database or Oracle Database 10g Release 1
using SQL Performance Analyzer:
1.
On the Software and Support page, under Real Application Testing, click SQL
Performance Analyzer.
The SQL Performance Analyzer page appears.
2.
Under SQL Performance Analyzer Workflows, click Upgrade from 9i or 10.1.
7-6 Oracle Database Real Application Testing User's Guide
Upgrading from Oracle9i Database and Oracle Database 10g Release 1
The Upgrade from 9i or 10.1 page appears.
3.
Under Task Information:
a.
In the Task Name field, enter the name of the task.
b.
In the SQL Tuning Set field, enter the name of the SQL tuning set that was
built.
Alternatively, click the search icon to search for the SQL tuning set using the
Search and Select: SQL Tuning Set window.
The selected SQL tuning set now appears in the SQL Tuning Set field.
c.
4.
In the Creation Method field, select:
■
■
5.
In the Description field, optionally enter a description of the task.
Execute SQLs to generate both execution plans and statistics for each SQL
statement in the SQL tuning set by actually running the SQL statements
remotely on the test system over a public database link.
Generate Plans to create execution plans remotely on the test system over a
public database link without actually running the SQL statements.
In the Per-SQL Time Limit list, determine the time limit for SQL execution during
the trial by performing one of the following actions:
■
Select 5 minutes.
Testing a Database Upgrade
7-7
Upgrading from Oracle9i Database and Oracle Database 10g Release 1
The execution will run each SQL statement in the SQL tuning set up to 5
minutes and gather performance data.
■
Select Unlimited.
The execution will run each SQL statement in the SQL tuning set to
completion and gather performance data. Collecting execution statistics
provides greater accuracy in the performance analysis but takes a longer time.
Using this setting is not recommended because the task may be stalled by one
SQL statement for a prolonged time period.
■
6.
Select Customize and enter the specified number of seconds, minutes, or
hours.
In the Database Link field, enter the global name of a public database link
connecting to a user with the EXECUTE privilege for the DBMS_SQLPA package
and the ADVISOR privilege on the test system.
Alternatively, click the search icon to search for and select a database link, or click
Create Database Link to create a database link using the Create Database Link
page.
7.
In the Comparison Metric list, select the comparison metric to use for the
comparison analysis:
–
Elapsed Time
–
CPU Time
–
User I/O Time
–
Buffer Gets
–
Physical I/O
–
Optimizer Cost
–
I/O Interconnect Bytes
Optimizer Cost is the only comparison metric available if you generated execution
plans only in the SQL trials.
To perform the comparison analysis by using more than one comparison metric,
perform separate comparison analyses by repeating this procedure with different
metrics.
8.
9.
Under Schedule:
a.
In the Time Zone list, select your time zone code.
b.
Select Immediately to start the task now, or Later to schedule the task to start
at a time specified using the Date and Time fields.
Click Submit.
The SQL Performance Analyzer page appears.
In the SQL Performance Analyzer Tasks section, the status of this task is
displayed. To refresh the status icon, click Refresh. After the task completes, the
Status field changes to Completed.
10. Under SQL Performance Analyzer Tasks, select the task and click the link in the
Name column.
The SQL Performance Analyzer Task page appears.
This page contains the following sections:
7-8 Oracle Database Real Application Testing User's Guide
Upgrading from Oracle9i Database and Oracle Database 10g Release 1
■
SQL Tuning Set
This section summarizes information about the SQL tuning set, including its
name, owner, description, and the number of SQL statements it contains.
■
SQL Trials
This section includes a table that lists the SQL trials used in the SQL
Performance Analyzer task.
■
SQL Trial Comparisons
This section contains a table that lists the results of the SQL trial comparisons
11. Click the icon in the Comparison Report column.
The SQL Performance Analyzer Task Result page appears.
12. Review the results of the performance analysis, as described in "Reviewing the
SQL Performance Analyzer Report Using Oracle Enterprise Manager" on page 6-3.
If regressed SQL statements are found following the database upgrade, tune them
as described in "Tuning Regressed SQL Statements After Testing a Database
Upgrade" on page 7-15.
Testing Database Upgrades from Oracle9i Database and Oracle Database 10g
Release 1 Using APIs
After creating a SQL Performance Analyzer task on the SQL Performance Analyzer
system, you can use APIs to build the pre-upgrade SQL trial from the execution plans
and run-time statistics in the SQL tuning set. To do so, call the EXECUTE_ANALYSIS_
TASK procedure using the following parameters:
■
■
■
Set the task_name parameter to the name of the SQL Performance Analyzer task
that you want to execute.
Set the execution_type parameter to CONVERT SQLSET to direct SQL
Performance Analyzer to treat the statistics in the SQL tuning set as a trial
execution.
Specify a name to identify the execution using the execution_name parameter.
If not specified, then SQL Performance Analyzer automatically generates a name
for the task execution.
The following example executes the SQL Performance Analyzer task named my_spa_
task as a trial execution:
EXEC DBMS_SQLPA.EXECUTE_ANALYSIS_TASK(task_name => 'my_spa_task', execution_type => 'CONVERT SQLSET', execution_name => 'my_trial_9i');
To build the post-upgrade SQL trial using APIs, perform an explain plan or test
execute using the SQL Performance Analyzer system by calling the EXECUTE_
ANALYSIS_TASK procedure. Set the DATABASE_LINK task parameter to the global
name of a public database link connecting to a user with the EXECUTE privilege for the
DBMS_SQLPA package and the ADVISOR privilege on the test system.
If you choose to use EXPLAIN PLAN, only execution plans will be generated.
Subsequent comparisons will only be able to yield a list of changed plans without
making any conclusions about performance changes. If you choose to use TEST
EXECUTE, the SQL workload will be executed to completion. This effectively builds
the post-upgrade SQL trial using the statistics and execution plans generated from the
test system. Using TEST EXECUTE is recommended to capture the SQL execution
Testing a Database Upgrade
7-9
Upgrading from Oracle Database 10g Release 2 and Newer Releases
plans and performance data at the source, thereby resulting in a more accurate
analysis.
The following example performs a test execute of the SQL statements remotely over a
database link:
EXEC DBMS_SQLPA.EXECUTE_ANALYSIS_TASK(task_name => 'my_spa_task', execution_type => 'TEST EXECUTE', execution_name => 'my_remote_trial_10g', execution_params => dbms_advisor.arglist(’database_link’,
'LINK.A.B.C.BIZ.COM'));
Upgrading from Oracle Database 10g Release 2 and Newer Releases
You can use SQL Performance Analyzer to test the impact on SQL response time of a
database upgrade from Oracle Database 10g Release 2 or a newer release to any later
release by capturing a SQL tuning set on the production system, then executing it
twice remotely over a database link on a test system—first to create a pre-change SQL
trial, then again to create a post-change SQL trial.
The production system which you are upgrading from should be running Oracle
Database 10g Release 2 or a newer release. Initially, the test system should also be
running the same release. To ensure that the analysis made by SQL Performance
Analyzer is accurate, the test system should contain an exact copy of the production
data found on the production system. Furthermore, the hardware configuration
should also be as similar to the production system as possible.
Next, you will need to set up a separate SQL Performance Analyzer system running
Oracle Database 11g Release 2. You will be using this system to run SQL Performance
Analyzer. Neither your production data or schema need to be available on this system,
since the SQL tuning set will be built using statistics stored in the SQL trace files from
the production system. SQL Performance Analyzer tasks will be executed remotely on
the test system to generate the execution plan and statistics for the SQL trial over a
database link that you specify. The database link must be a public database link that
connects to a user with the EXECUTE privilege for the DBMS_SQLPA package and the
ADVISOR privilege on the test system. You should also drop any existing PLAN_
TABLE from the user’s schema on the test system.
Once the upgrade environment is configured as described, perform the steps as
described in the following procedure to use SQL Performance Analyzer in a database
upgrade from Oracle Database 10g Release 2 or a newer release to any later release.
1.
On the production system, capture the SQL workload that you intend to analyze
and store it in a SQL tuning set, as described in "Capturing the SQL Workload" on
page 2-3.
2.
Set up the test system so that it matches the production environment as closely as
possible, as described in "Setting Up the Test System" on page 2-4.
3.
Transport the SQL tuning set to the SQL Performance Analyzer system.
For information about transporting SQL tuning sets using:
■
■
4.
Oracle Enterprise Manager, see Oracle Database 2 Day + Performance Tuning
Guide
APIs, see Oracle Database Performance Tuning Guide
On the SQL Performance Analyzer system, create a SQL Performance Analyzer
task using the SQL tuning set as its input source.
7-10 Oracle Database Real Application Testing User's Guide
Upgrading from Oracle Database 10g Release 2 and Newer Releases
Remotely test execute the SQL statements in the SQL tuning set on the test system
over a database link to build a pre-upgrade SQL trial that will be used as a
baseline for comparison, as described in "Testing Database Upgrades from Oracle
Database 10g Release 2 and Newer Releases" on page 7-11.
5.
Upgrade the test system.
6.
Remotely test execute the SQL statements a second time on the upgraded test
system over a database link to build a post-upgrade SQL trial, as described in
"Testing Database Upgrades from Oracle Database 10g Release 2 and Newer
Releases" on page 7-11.
7.
Compare SQL performance and fix regressed SQL.
SQL Performance Analyzer compares the performance of SQL statements read
from the SQL tuning set during the pre-upgrade SQL trial to those captured from
the remote test execution during the post-upgrade SQL trial. A report is produced
to identify any changes in execution plans or performance of the SQL statements.
If the report reveals any regressed SQL statements, you can make further changes
to fix the regressed SQL, as described in "Tuning Regressed SQL Statements After
Testing a Database Upgrade" on page 7-15.
Repeat the process of executing the SQL tuning set and comparing its performance
to a previous execution to test any changes made until you are satisfied with the
outcome of the analysis.
Testing Database Upgrades from Oracle Database 10g Release 2 and Newer Releases
Once the SQL tuning set is transported to the SQL Performance Analyzer system, you
can use SQL Performance Analyzer to build a pre-upgrade SQL trial by executing or
generating plans of SQL statements in the SQL tuning set on the test system. SQL
Performance Analyzer test executes the SQL statements using a database link that you
specify by connecting to the test system remotely and generating the execution plans
and statistics for the SQL trial. The database link should exist on the SQL Performance
Analyzer system and connect to a remote user with privileges to execute the SQL
tuning set on the test system.
After the pre-upgrade SQL trial is built, you need to upgrade the test system. Once the
database has been upgraded, SQL Performance Analyzer will need to execute or
generate plans of SQL statements in the SQL tuning set a second time on the upgraded
test system to build a post-upgrade SQL trial. Alternatively, if hardware resources are
available, you can use another upgraded test system to execute the second remote SQL
trial. This method can be useful in helping you investigate issues identified by SQL
Performance Analyzer.
You can run SQL Performance Analyzer to test a database upgrade from Oracle
Database 10g Release 2 or a newer release using Oracle Enterprise Manager or APIs, as
described in the following sections:
■
■
Testing Database Upgrades from Oracle Database 10g Release 2 and Newer
Releases Using Enterprise Manager
Testing Database Upgrades from Oracle Database 10g Release 2 and Newer
Releases Using APIs
Testing Database Upgrades from Oracle Database 10g Release 2 and Newer
Releases Using Enterprise Manager
To test a database upgrade from Oracle Database 10g Release 2 or a newer release
using SQL Performance Analyzer:
Testing a Database Upgrade
7-11
Upgrading from Oracle Database 10g Release 2 and Newer Releases
1.
On the Software and Support page, under Real Application Testing, click SQL
Performance Analyzer.
The SQL Performance Analyzer page appears.
2.
Under SQL Performance Analyzer Workflows, click Upgrade from 10.2 or 11g.
The Upgrade from 10.2 or 11g page appears.
3.
Under Task Information:
a.
In the Task Name field, enter the name of the task.
b.
In the SQL Tuning Set field, enter the name of the SQL tuning set that was
built.
Alternatively, click the search icon to search for the SQL tuning set using the
Search and Select: SQL Tuning Set window.
The selected SQL tuning set now appears in the SQL Tuning Set field.
c.
4.
In the Description field, optionally enter a description of the task.
In the Creation Method field, select:
■
Execute SQLs to generate both execution plans and statistics for each SQL
statement in the SQL tuning set by actually running the SQL statements
remotely on the test system over a public database link.
7-12 Oracle Database Real Application Testing User's Guide
Upgrading from Oracle Database 10g Release 2 and Newer Releases
■
5.
Generate Plans to create execution plans remotely on the test system over a
public database link without actually running the SQL statements.
In the Per-SQL Time Limit list, determine the time limit for SQL execution during
the trial by performing one of the following actions:
■
Select 5 minutes.
The execution will run each SQL statement in the SQL tuning set up to 5
minutes and gather performance data.
■
Select Unlimited.
The execution will run each SQL statement in the SQL tuning set to
completion and gather performance data. Collecting execution statistics
provides greater accuracy in the performance analysis but takes a longer time.
Using this setting is not recommended because the task may be stalled by one
SQL statement for a prolonged time period.
■
6.
Select Customize and enter the specified number of seconds, minutes, or
hours.
In the Database Link field, enter the global name of a public database link
connecting to a user with the EXECUTE privilege for the DBMS_SQLPA package
and the ADVISOR privilege on the pre-upgrade system.
Alternatively, click the search icon to search for and select a database link, or click
Create Database Link to create a database link using the Create Database Link
page.
7.
Under Post-upgrade Trial:
a.
Select Use the same system as in the pre-upgrade trial to use the same system
for executing both the pre-upgrade and post-upgrade trials.
Oracle recommends using this option to avoid possible errors due to different
system configurations. When using this option, you will need to upgrade the
test database to the higher database version before the post-upgrade trial is
executed.
b.
8.
In the Database Link field, enter the global name of a public database link
connecting to a user with the EXECUTE privilege for the DBMS_SQLPA package
and the ADVISOR privilege on the post-upgrade system.
In the Comparison Metric list, select the comparison metric to use for the
comparison analysis:
–
Elapsed Time
–
CPU Time
–
User I/O Time
–
Buffer Gets
–
Physical I/O
–
Optimizer Cost
–
I/O Interconnect Bytes
Optimizer Cost is the only comparison metric available if you generated execution
plans only in the SQL trials.
Testing a Database Upgrade
7-13
Upgrading from Oracle Database 10g Release 2 and Newer Releases
To perform the comparison analysis by using more than one comparison metric,
perform separate comparison analyses by repeating this procedure with different
metrics.
9.
Under Schedule:
a.
In the Time Zone list, select your time zone code.
b.
Select Immediately to start the task now, or Later to schedule the task to start
at a time specified using the Date and Time fields.
10. Click Submit.
The SQL Performance Analyzer page appears.
In the SQL Performance Analyzer Tasks section, the status of this task is
displayed. To refresh the status icon, click Refresh.
If you are using the same system to execute both the pre-upgrade and
post-upgrade trials, you will need to upgrade the database after the pre-upgrade
trial step is completed. After the database is upgraded, the post-upgrade trial can
be executed. After the task completes, the Status field changes to Completed.
11. Under SQL Performance Analyzer Tasks, select the task and click the link in the
Name column.
The SQL Performance Analyzer Task page appears.
This page contains the following sections:
■
SQL Tuning Set
This section summarizes information about the SQL tuning set, including its
name, owner, description, and the number of SQL statements it contains.
■
SQL Trials
This section includes a table that lists the SQL trials used in the SQL
Performance Analyzer task.
■
SQL Trial Comparisons
This section contains a table that lists the results of the SQL trial comparisons
12. Click the icon in the Comparison Report column.
The SQL Performance Analyzer Task Result page appears.
13. Review the results of the performance analysis, as described in "Reviewing the
SQL Performance Analyzer Report Using Oracle Enterprise Manager" on page 6-3.
If regressed SQL statements are found following the database upgrade, tune them
as described in "Tuning Regressed SQL Statements After Testing a Database
Upgrade" on page 7-15.
Testing Database Upgrades from Oracle Database 10g Release 2 and Newer
Releases Using APIs
After creating a SQL Performance Analyzer task on the SQL Performance Analyzer
system, you can use APIs to build the pre-upgrade SQL trial by performing an explain
plan or test execute of SQL statements in the SQL tuning set. To do so, call the
EXECUTE_ANALYSIS_TASK procedure using the following parameters:
■
■
Set the task_name parameter to the name of the SQL Performance Analyzer task
that you want to execute.
Set the execution_type parameter to EXPLAIN PLAN or TEST EXECUTE.
7-14 Oracle Database Real Application Testing User's Guide
Tuning Regressed SQL Statements After Testing a Database Upgrade
If you choose to use EXPLAIN PLAN, only execution plans will be generated.
Subsequent comparisons will only be able to yield a list of changed plans without
making any conclusions about performance changes. If you choose to use TEST
EXECUTE, the SQL workload will be executed to completion. This effectively
builds the pre-upgrade SQL trial using the statistics and execution plans generated
from the test system. Using TEST EXECUTE is recommended to capture the SQL
execution plans and performance data at the source, thereby resulting in a more
accurate analysis.
■
■
Specify a name to identify the execution using the execution_name parameter.
If not specified, then SQL Performance Analyzer automatically generates a name
for the task execution.
Set the DATABASE_LINK task parameter to the global name of a public database
link connecting to a user with the EXECUTE privilege for the DBMS_SQLPA
package and the ADVISOR privilege on the test system.
The following example executes the SQL Performance Analyzer task named my_spa_
task and performs a test execute of the SQL statements remotely over a database link:
EXEC DBMS_SQLPA.EXECUTE_ANALYSIS_TASK(task_name => 'my_spa_task', execution_type => 'TEST EXECUTE', execution_name => 'my_remote_trial_10g', execution_params => dbms_advisor.arglist(’database_link’,
'LINK.A.B.C.BIZ.COM'));
To build the post-upgrade SQL trial using APIs, perform an explain plan or test
execute using the SQL Performance Analyzer system by calling the EXECUTE_
ANALYSIS_TASK procedure with the DATABASE_LINK task parameter set to the
global name of a public database link connecting to a user with the EXECUTE privilege
for the DBMS_SQLPA package and the ADVISOR privilege on the test system. If you
choose to use EXPLAIN PLAN, only execution plans will be generated. Subsequent
comparisons will only be able to yield a list of changed plans without making any
conclusions about performance changes. If you choose to use TEST EXECUTE, the
SQL workload will be executed to completion. This effectively builds the post-upgrade
SQL trial using the statistics and execution plans generated from the test system.
Using TEST EXECUTE is recommended to capture the SQL execution plans and
performance data at the source, thereby resulting in a more accurate analysis.
The following example performs a test execute of the SQL statements remotely over a
database link:
EXEC DBMS_SQLPA.EXECUTE_ANALYSIS_TASK(task_name => 'my_spa_task', execution_type => 'TEST EXECUTE', execution_name => 'my_remote_trial_11g', execution_params => dbms_advisor.arglist(’database_link’,
'LINK.A.B.C.BIZ.COM'));
Tuning Regressed SQL Statements After Testing a Database Upgrade
In some cases, SQL Performance Analyzer may identify SQL statements whose
performance regressed after you upgrade the database on the test system.
You can tune the regressed SQL statements by using the SQL Tuning Advisor or SQL
plan baselines, as described in Chapter 6, "Comparing SQL Trials". This involves using
APIs to build a subset of a SQL tuning set with only the regressed SQL statements,
transport this subset of regressed SQL statements to the remote database, and running
the SQL Tuning Advisor on the remote database.
Testing a Database Upgrade
7-15
Tuning Regressed SQL Statements After Testing a Database Upgrade
Oracle Enterprise Manager does not provide support for fixing regressions after
running SQL Performance Analyzer involving one or more remote SQL trials. For
more information, see "Tuning Regressed SQL Statements From a Remote SQL Trial
Using APIs" on page 6-24.
If you are upgrading from Oracle Database 10g Release 2 and newer releases, you can
also create SQL plan baselines to instruct the optimizer to select existing execution
plans in the future. For more information, see "Creating SQL Plan Baselines Using
APIs" on page 6-26.
7-16 Oracle Database Real Application Testing User's Guide
Part II
Part II
Database Replay
Database Replay enables you to replay a full production workload on a test system to
assess the overall impact of system changes. This part contains information about how
to capture, preprocess, and replay a database workload using Database Replay, as well
as how to analyze the results of a replayed workload.
Part II contains the following chapters:
■
Chapter 8, "Introduction to Database Replay"
■
Chapter 9, "Capturing a Database Workload"
■
Chapter 10, "Preprocessing a Database Workload"
■
Chapter 11, "Replaying a Database Workload"
■
Chapter 12, "Analyzing Replayed Workload"
8
8
Introduction to Database Replay
You can use Database Replay to capture a workload on the production system and
replay it on a test system with the exact timing, concurrency, and transaction
characteristics of the original workload. This enables you to test the effects of a system
change without affecting the production system.
Database Replay supports workload capture on a system running Oracle Database 10g
Release 2 and newer releases. In order to capture a workload on a system running
Oracle Database 10g Release 2, the database version can be 10.2.0.4 or higher.
Workload replay is only supported on systems running Oracle Database 11g Release 1
and newer releases.
To use the workload capture feature on a system running
Oracle9i Database or an earlier version of Oracle Database 10g Release
2, contact Oracle Support for more information.
Note:
Analyzing the effect of system changes using Database Replay involves the following
steps, as illustrated in Figure 8–1:
Introduction to Database Replay 8-1
Workload Capture
Figure 8–1 Database Replay Workflow
1.
On the production system, capture the workload into capture files, as described in
"Workload Capture" on page 8-2.
2.
Copy the capture files to the test system and preprocess them, as described in
"Workload Preprocessing" on page 8-3.
3.
On the test system, replay the preprocessed files, as described in "Workload
Replay" on page 8-3.
4.
Using the reports generated by Database Replay, perform detailed analysis of both
the workload capture and workload replay, as described in "Analysis and
Reporting" on page 8-3.
Workload Capture
The first step in using Database Replay is to capture the production workload.
Capturing a workload involves recording all requests made by external clients to
Oracle Database.
When workload capture is enabled, all external client requests directed to Oracle
Database are tracked and stored in binary files—called capture files—on the file
system. You can specify the location where the capture files will be stored. Once
workload capture begins, all external database calls are written to the capture files.
The capture files contain all relevant information about the client request, such as SQL
8-2 Oracle Database Real Application Testing User's Guide
Analysis and Reporting
text, bind values, and transaction information. Background activities and database
scheduler jobs are not captured. These capture files are platform independent and can
be transported to another system.
See Also:
■
Chapter 9, "Capturing a Database Workload" for information
about how to capture a workload on the production system
Workload Preprocessing
Once the workload has been captured, the information in the capture files need to be
preprocessed. Preprocessing creates all necessary metadata needed for replaying the
workload. This must be done once for every captured workload before they can be
replayed. After the captured workload is preprocessed, it can be replayed repeatedly
on a replay system running the same version of Oracle Database. Typically, the
capture files should be copied to another system for preprocessing. As workload
preprocessing can be time consuming and resource intensive, it is recommended that
this step be performed on the test system where the workload will be replayed.
See Also:
■
Chapter 10, "Preprocessing a Database Workload" for information
about how to preprocess a captured workload
Workload Replay
After a captured workload has been preprocessed, it can be replayed on a test system.
During the workload replay phase, Oracle Database performs the actions recorded
during the workload capture phase on the test system by re-creating all captured
external client requests with the same timing, concurrency, and transaction
dependencies of the production system.
Database Replay uses a client program called the replay client to re-create all external
client requests recorded during workload capture. Depending on the captured
workload, you may need one or more replay clients to properly replay the workload.
A calibration tool is provided to help determine the number of replay clients needed
for a particular workload. Because the entire workload is replayed—including DML
and SQL queries—the data in the replay system should be as logically similar to the
data in the capture system as possible. This will minimize replay divergence and
enable a more reliable analysis of the replay.
See Also:
■
Chapter 11, "Replaying a Database Workload" for information
about how to replay a preprocessed workload on the test system
Analysis and Reporting
Once the workload is replayed, in-depth reporting is provided for you to perform
detailed analysis of both workload capture and replay.
The workload capture report and workload replay report provide basic information
about the workload capture and replay, such as errors encountered during replay and
data divergence in rows returned by DML or SQL queries. A comparison of several
statistics—such as database time, average active sessions, and user calls—between the
workload capture and the workload replay is also provided.
Introduction to Database Replay 8-3
Analysis and Reporting
The replay compare period report can be used to perform a high-level comparison of
one workload replay to its capture or to another replay of the same capture. A
divergence summary with an analysis of whether any data divergence occurred and if
there were any significant performance changes is also provided. Furthermore,
Automatic Database Diagnostic Monitor (ADDM) findings are incorporated into these
reports.
For advanced analysis, Automatic Workload Repository (AWR) reports are available
to enable detailed comparison of performance statistics between the workload capture
and the workload replay. The information available in these reports is very detailed,
and some differences between the workload capture and replay can be expected.
The SQL Performance Analyzer report can be used to compare a SQL tuning set from
a workload capture to another SQL tuning set from a workload replay, or two SQL
tuning sets from two workload replays. Comparing SQL tuning sets with Database
Replay provides more information than SQL Performance Analyzer test-execute
because it considers and shows all execution plans for each SQL statement, while SQL
Performance Analyzer test-execute generates only one execution plan per SQL
statement for each SQL trial. Moreover, the SQL statements are executed in a more
authentic environment because Database Replay captures all bind values and
reproduces dynamic session state such as PL/SQL package state more accurately. It is
recommended that you run SQL Performance Analyzer test-execute first as a sanity
test to ensure SQL statements have not regressed and the test system is set up properly
before using Database Replay to perform load and currency testing.
Besides using replay divergence information to analyze replay characteristics of a
given system change, you should also use an application-level validation procedure to
assess the system change. Consider developing a script to assess the overall success of
the replay. For example, if 10,000 orders are processed during workload capture, you
should validate that a similar number of orders are also processed during replay.
After the replay analysis is complete, you can restore the database to its original state
at the time of workload capture and repeat workload replay to test other changes to
the system.
See Also:
■
Chapter 12, "Analyzing Replayed Workload" for information
about how to analyze data and performance divergence using
Database Replay reports
8-4 Oracle Database Real Application Testing User's Guide
9
9
Capturing a Database Workload
This chapter describes how to capture a database workload on the production system.
The first step in using Database Replay is to capture the production workload. For
more information about how capturing a database workload fits within the Database
Replay architecture, see "Workload Capture" on page 8-2.
This chapter contains the following sections:
■
Prerequisites for Capturing a Database Workload
■
Workload Capture Options
■
Workload Capture Restrictions
■
Enabling and Disabling the Workload Capture Feature
■
Capturing a Database Workload Using Enterprise Manager
■
Monitoring Workload Capture Using Enterprise Manager
■
Capturing a Database Workload Using APIs
■
Monitoring Workload Capture Using Views
Prerequisites for Capturing a Database Workload
Before starting a workload capture, you should have a strategy in place to restore the
database on the test system. Before a workload can be replayed, the logical state of the
application data on the replay system should be similar to that of the capture system
when replay begins. To accomplish this, consider using one of the following methods:
■
Recovery Manager (RMAN) DUPLICATE command
■
Snapshot standby
■
Data Pump Import and Export
This will allow you to restore the database on the replay system to the application
state as of the workload capture start time.
See Also:
■
■
■
Oracle Database Backup and Recovery User's Guide for information
about duplicating a database using RMAN
Oracle Data Guard Concepts and Administration for information
about managing snapshot standby databases
Oracle Database Utilities for information about using Data Pump
Capturing a Database Workload
9-1
Workload Capture Options
Workload Capture Options
Proper planning before workload capture is required to ensure that the capture will be
accurate and useful when replayed in another environment.
Before capturing a database workload, carefully consider the following options:
■
Restarting the Database
■
Using Filters with Workload Capture
■
Setting Up the Capture Directory
Restarting the Database
While this step is not required, Oracle recommends that the database be restarted
before capturing the workload to ensure that ongoing and dependent transactions are
allowed to be completed or rolled back before the capture begins. If the database is not
restarted before the capture begins, transactions that are in progress or have yet to be
committed will not be fully captured in the workload. Ongoing transactions will thus
not be replayed properly, because only the part of the transaction whose calls were
captured will be replayed. This may result in undesired replay divergence when the
workload is replayed. Any subsequent transactions with dependencies on the
incomplete transactions may also generate errors during replay. On a busy system, it
is normal to see some replay divergence, but the replay can still be used to perform
meaningful analysis of a system change if the diverged calls do not make up a
significant portion of the replay in terms of DB time and other such key attributes.
Before restarting the database, determine an appropriate time to shut down the
production database before the workload capture when it is the least disruptive. For
example, you may want to capture a workload that begins at 8:00 a.m. However, to
avoid service interruption during normal business hours, you may not want to restart
the database during this time. In this case, you should consider starting the workload
capture at an earlier time, so that the database can be restarted at a time that is less
disruptive.
Once the database is restarted, it is important to start the workload capture before any
user sessions reconnect and start issuing any workload. Otherwise, transactions
performed by these user sessions will not be replayed properly in subsequent database
replays, because only the part of the transaction whose calls were executed after the
workload capture is started will be replayed. To avoid this problem, consider
restarting the database in RESTRICTED mode using STARTUP RESTRICT, which will
only allow the SYS user to login and start the workload capture. By default, once the
workload capture begins, any database instance that are in RESTRICTED mode will
automatically switch to UNRESTRICTED mode, and normal operations can continue
while the workload is being captured.
Only one workload capture can be performed at any given time. If you have a Oracle
Real Application Clusters (Oracle RAC) configuration, workload capture is performed
for the entire database. To enable a clean state before starting to capture the workload,
all the instances need to be restarted.
To restart all instances in a Oracle RAC configuration before workload capture:
Shut down all the instances.
1.
2.
Restart one of the instances.
3.
Start workload capture.
4.
Restart the rest of the instances.
9-2 Oracle Database Real Application Testing User's Guide
Workload Capture Restrictions
See Also:
■
Oracle Database Administrator's Guide for information about
restricting access to an instance at startup
Using Filters with Workload Capture
By default, all user sessions are recorded during workload capture. You can use
workload filters to specify which user sessions to include in or exclude from the
workload during workload capture. There are two types of workload filters: inclusion
filters and exclusion filters. You can use either inclusion filters or exclusion filters in a
workload capture, but not both.
Inclusion filters enable you to specify user sessions that will be captured in the
workload. This is useful if you want to capture only a subset of the database workload.
Exclusion filters enable you to specify user sessions that will not be captured in the
workload. This is useful if you want to filter out session types that do not need to
captured in the workload, such as those that monitor the infrastructure—like Oracle
Enterprise Manager (EM) or Statspack—or other such processes that are already
running on the test system. For example, if the system where the workload will be
replayed is running EM, replaying captured EM sessions on the system will result in
duplication of workload. In this case, you may want to use exclusion filters to filter out
EM sessions.
Setting Up the Capture Directory
Determine the location and set up a directory where the captured workload will be
stored. Before starting the workload capture, ensure that the directory is empty and
has ample disk space to store the workload. If the directory runs out of disk space
during a workload capture, the capture will stop. To estimate the amount of disk space
that is required, you can run a test capture on your workload for a short duration
(such as a few minutes) to extrapolate how much space you will need for a full
capture. To avoid potential performance issues, you should also ensure that the target
replay directory is mounted on a separate file system.
For Oracle RAC, consider using a shared file system. Alternatively, you can set up one
capture directory path that resolve to separate physical directories on each instance,
but you will need to collect the capture files created in each of these directories into a
single directory before preprocessing the workload capture.
Workload Capture Restrictions
The following types of client requests are not captured in a workload:
■
Direct path load of data from external files using utilities such as SQL*Loader
■
Non-PL/SQL based Advanced Queuing (AQ)
■
Flashback queries
■
Oracle Call Interface (OCI) based object navigations
■
Non SQL-based object access
■
Distributed transactions (any distributed transactions that are captured will be
replayed as local transactions)
Capturing a Database Workload
9-3
Enabling and Disabling the Workload Capture Feature
Enabling and Disabling the Workload Capture Feature
Oracle Database 10g Release 2 supports using Database Replay to capture a database
workload that can be used to test database upgrades to Oracle Database 11g and
subsequent releases. To use this feature, it must be enabled on the capture system
running Oracle Database 10g Release 2 before a workload can be captured. By default,
the workload capture feature is not enabled in Oracle Database 10g Release 2 (10.2).
You can enable or disable this feature by specifying the PRE_11G_ENABLE_CAPTURE
initialization parameter.
It is only necessary to enable the workload capture feature if
you are capturing a database workload on a system running Oracle
Database 10g Release 2.
Note:
If you are capturing a database workload on a system running Oracle
Database 11g Release 1 or a later release, it is not necessary to enable
the workload capture feature because it is enabled by default.
Furthermore, the PRE_11G_ENABLE_CAPTURE initialization
parameter is only valid with Oracle Database 10g Release 2 (10.2) and
cannot be used with subsequent releases.
To enable the workload capture feature on a system running Oracle Database 10g
Release 2, run the wrrenbl.sql script at the SQL prompt:
@$ORACLE_HOME/rdbms/admin/wrrenbl.sql
The wrrenbl.sql script calls the ALTER SYSTEM SQL statement to set the PRE_
11G_ENABLE_CAPTURE initialization parameter to TRUE. If a server parameter file
(spfile) is being used, the PRE_11G_ENABLE_CAPTURE initialization parameter will be
modified for the currently running instance and recorded in the spfile, so that the new
setting will persist when the database is restarted. If a spfile is not being used, the
PRE_11G_ENABLE_CAPTURE initialization parameter will only be modified for the
currently running instance, and the new setting will not persist when the database is
restarted. To make the setting persistent without using a spfile, you will need to
manually specify the parameter in the initialization parameter file (init.ora).
To disable workload capture, run the wrrdsbl.sql script at the SQL prompt:
@$ORACLE_HOME/rdbms/admin/wrrdsbl.sql
The wrrdsbl.sql script calls the ALTER SYSTEM SQL statement to set the PRE_
11G_ENABLE_CAPTURE initialization parameter to FALSE. If a server parameter file
(spfile) is being used, the PRE_11G_ENABLE_CAPTURE initialization parameter will be
modified for the currently running instance and also recorded in the spfile, so that the
new setting will persist when the database is restarted. If a spfile is not being used, the
PRE_11G_ENABLE_CAPTURE initialization parameter will only be modified for the
currently running instance, and the new setting will not persist when the database is
restarted. To make the setting persistent without using a spfile, you will need to
manually specify the parameter in the initialization parameter file (init.ora).
9-4 Oracle Database Real Application Testing User's Guide
Capturing a Database Workload Using Enterprise Manager
Note: The PRE_11G_ENABLE_CAPTURE initialization parameter can
only be used with Oracle Database 10g Release 2 (10.2). This
parameter is not valid in subsequent releases. After upgrading the
database, you will need to remove the parameter from the server
parameter file (spfile) or the initialization parameter file (init.ora);
otherwise, the database will fail to start up.
See Also:
■
Oracle Database Reference for more information about the PRE_
11G_ENABLE_CAPTURE initialization parameter
Capturing a Database Workload Using Enterprise Manager
This section describes how to capture a database workload using Enterprise Manager.
The primary tool for capturing database workloads is Oracle Enterprise Manager.
If for some reason Oracle Enterprise Manager is unavailable, you can capture database
workloads using APIs, as described in "Capturing a Database Workload Using APIs"
on page 9-13.
To capture a database workload using Enterprise Manager:
1. On the Software and Support page, under Real Application Testing, click
Database Replay.
The Database Replay page appears.
Capturing a Database Workload
9-5
Capturing a Database Workload Using Enterprise Manager
2.
In the Go to Task column, click the icon that corresponds to the Capture Workload
task.
The Capture Workload: Plan Environment page appears.
3.
Verify that all prerequisites are met before proceeding.
For information about the prerequisites, see "Prerequisites for Capturing a
Database Workload" on page 9-1.
For each verified prerequisite, check the box in the Acknowledge column. Once all
prerequisites are verified, click Next.
The Capture Workload: Options page appears.
4.
Select the workload capture options:
■
Under Database Restart Options, select whether the database will be restarted
before workload capture.
It is recommended that the database be restarted before capturing a workload
to enable a clean state for workload capture. Otherwise, potential problems
may arise when replaying the workload. For more information, see "Restarting
the Database" on page 9-2.
■
Under SQL Performance Analyzer, select whether to capture SQL statements
into a SQL tuning set during workload capture.
While Database Replay provide analysis of how a change affects your entire
system, you can use a SQL tuning set in conjunction with SQL Performance
9-6 Oracle Database Real Application Testing User's Guide
Capturing a Database Workload Using Enterprise Manager
Analyzer to gain a more SQL-centric analysis of how the change affects SQL
statements and execution plans.
By capturing a SQL tuning set during workload capture and another SQL
tuning set during workload replay, you can use SQL Performance Analyzer to
compare these SQL tuning sets to each other, without having to re-execute the
SQL statements. This enables you to obtain a SQL Performance Analyzer
report and compare the SQL performance, before and after change, while
running Database Replay.
For information about comparing SQL tuning sets using SQL Performance
Analyzer reports, see "Generating SQL Performance Analyzer Reports Using
APIs" on page 12-8.
Capturing SQL statements into a SQL tuning set is the default
and recommended workload capture option.
Note:
■
Under Workload Filters, select whether to use exclusion filters by selecting
Exclusion in the Filter Mode list, or inclusion filters by selecting Inclusion in
the Filter Mode list.
To add filters, click Add Another Row and enter the filter name, session
attribute, and value in the corresponding fields. For more information, see
"Using Filters with Workload Capture" on page 9-3.
After selecting the desired workload capture options, click Next.
The Capture Workload: Parameters page appears.
5.
Define the parameters for the workload capture:
■
Under Workload Capture Parameters, in the Capture Name field, enter a
name for the workload capture. In the Directory Object list, select the directory
where the captured workload will be stored. You must select a directory that
does not already contain a workload capture. For more information, see
"Setting Up the Capture Directory" on page 9-3.
Capturing a Database Workload
9-7
Capturing a Database Workload Using Enterprise Manager
To create a directory object, click Create Directory Object. The Create
Directory Object page appears. In the Name field, enter a name for the
directory object. In the Path field, enter the path to the directory object. To test
if the directory exists in the file system, click Test File System. If the directory
does not exist, it will need to be created first.
■
Under Database Shutdown Parameters, select the type of database shutdown
method to perform. This option only appears if the database will be restarted
before workload capture. The types of available database shutdown methods
include:
–
Immediate
An immediate shutdown will roll back all active transactions and disconnect all connected users before shutting down the database.
–
Transactional
A transactional shutdown will first complete all active transactions and
then disconnect the connected user before shutting down the database.
–
Abort
An abort shutdown will shut down the database instantaneously by aborting all active transactions.
–
Force the database to shutdown
A force shutdown will shut down the database if any cluster-managed
database services are operational. This option only appears if you are running Oracle RAC.
■
Under Database Startup Parameters, select if the database will restart using
the current default server parameter file (spfile) or a specific parameter file
(pfile). To select a pfile, enter the fully qualified name for the pfile. This option
only appears if the database will be restarted before workload capture.
After defining the parameters for the workload capture, click Next.
The Capture Workload: Schedule page appears.
9-8 Oracle Database Real Application Testing User's Guide
Capturing a Database Workload Using Enterprise Manager
6.
Under Job Parameters, define the parameters for the job:
■
■
7.
In the Description field, enter an optional description of the job.
Under Job Schedule, specify a start time and duration for the workload capture:
■
■
8.
In the Job Name field, enter a name for the job name or accept the system
generated name.
Under Start, select whether the job will run immediately by selecting
Immediately, or at a later time by selecting Later and specifying the desired
time using the Date and Time fields.
Under Capture Duration, specify how long the job will run by selecting
Duration and specifying the desired duration using the Hours and Minutes
fields. To not specify a capture duration, select Not Specified. If a capture
duration is unspecified, the job must be stopped manually.
Under Job Credentials, enter the host and database login credentials:
■
■
Under Host Credentials, enter the username and password for the host
system.
Under Database Credentials, enter the username and password for the
database that will used for the workload capture. The user needs the DBA
privilege in order to restart the database. This section only appears if the
database will be restarted before workload capture.
Click Next.
The Capture Workload: Review page appears.
9.
Review the job settings for the workload capture that have been defined.
To run the job, click Submit. To make changes, click Back. To cancel the workload
capture without saving changes, click Cancel.
10. Depending on the job settings that have been defined:
■
If the job is scheduled to start immediately and the database will be restarted,
the Confirmation: Restart Database page appears.
To restart the database, click Yes.
The Information: Restart Database page appears while the database is being
restarted. Once the database is restarted, the workload capture begins
automatically. Click Refresh.
Capturing a Database Workload
9-9
Monitoring Workload Capture Using Enterprise Manager
The View Workload Capture page appears.
■
■
If the job is scheduled to start immediately but the database will not be
restarted, the workload capture begins automatically and the View Workload
Capture page appears.
If the job is scheduled to start at a later time, the Database Replay page
appears with a confirmation that the job has been successfully created.
Once workload capture begins, you can monitor the capture process using the
View Workload Capture page, as described in "Monitoring Workload Capture
Using Enterprise Manager" on page 9-10.
Tip: After capturing a workload on the production system, you need
to preprocess the captured workload, as described in Chapter 10,
"Preprocessing a Database Workload".
Monitoring Workload Capture Using Enterprise Manager
This section describes how to monitor workload capture using Enterprise Manager.
The primary tool for monitoring workload capture is Oracle Enterprise Manager.
Using Enterprise Manager, you can:
■
Monitor or stop an active workload capture
■
View or delete a completed workload capture
If for some reason Oracle Enterprise Manager is unavailable, you can monitor
workload capture using views, as described in "Monitoring Workload Capture Using
Views" on page 9-16.
This section contains the following topics:
■
Monitoring an Active Workload Capture
■
Stopping an Active Workload Capture
■
Managing a Completed Workload Capture
Monitoring an Active Workload Capture
This section describes how to monitor an active workload capture using Enterprise
Manager.
To monitor an active workload capture:
1. On the Software and Support page, under Real Application Testing, click
Database Replay.
The Database Replay page appears.
2.
Under Active Capture and Replay, select the workload capture you want to
monitor and click View.
The View Workload Capture page appears.
9-10 Oracle Database Real Application Testing User's Guide
Monitoring Workload Capture Using Enterprise Manager
3.
Under Summary, information about the workload capture is displayed.
4.
To view the workload profile, click the Workload Profile tab.
Under Average Active Sessions, the Active Sessions chart provides a graphic
display of the captured session activity compared to the uncaptured session
activity (such as background activities or filtered sessions).
Under Comparison, various statistics for the workload capture are displayed,
including database time, average active sessions, user calls, transactions, session
logins, and application errors. The statistics for the total session activity are
displayed in the Total column, and the statistics for the captured session activity
are displayed in the Capture column. The Percentage of Total column displays the
percentage of total session activity that are being captured in the workload.
To view the workload capture report, click View Workload Capture Report.
5.
To view workload filters used by the workload capture, click the Workload Filters
tab.
Details about the workload filters used by the workload capture are displayed,
including the workload filter name, type, session attribute, and value.
6.
To return to the Database Replay page, click OK.
Stopping an Active Workload Capture
This section describes how to stop an active workload capture using Enterprise
Manager.
Capturing a Database Workload
9-11
Monitoring Workload Capture Using Enterprise Manager
To stop an active workload capture:
1. On the Software and Support page, under Real Application Testing, click
Database Replay.
The Database Replay page appears.
2.
Under Active Capture and Replay, select the workload capture you want to stop
and click Stop.
The Confirmation page appears.
3.
To confirm that you want to stop the workload capture, click Yes.
Once the workload capture is stopped, the Export AWR Data page appears.
4.
To export the Automatic Workload Repository (AWR) data, click Yes.
The Export AWR Data page appears; click Yes.
Exporting AWR data enables detailed analysis of the workload. This data is also
required if you plan to run the Replay Compare Period report or the AWR
Compare Period report on a pair of workload captures or replays.
If you choose not to export AWR data, click No. You can still export AWR data
from a completed workload capture at a later time from the View Workload
Capture History page.
The View Workload Capture page appears.
See Also:
■
Oracle Database Performance Tuning Guide for information about the
AWR
Managing a Completed Workload Capture
This section describes how to manage a completed workload capture using Enterprise
Manager.
To manage a completed workload capture:
1. On the Software and Support page, under Real Application Testing, click
Database Replay.
The Database Replay page appears.
2.
Click View Workload Capture History.
The View Workload Capture History page appears.
3.
To delete a workload capture, select the workload capture and click Delete.
This will not remove the capture files from the capture directory.
4.
To export AWR data for a workload capture, select the workload capture and click
Export AWR Data.
The Export AWR Data page appears; click Yes.
9-12 Oracle Database Real Application Testing User's Guide
Capturing a Database Workload Using APIs
Exporting AWR data enables detailed analysis of the workload. This data is also
required if you plan to run the Replay Compare Period report or the AWR
Compare Period report on a pair of workload captures or replays.
5.
To view details about a workload capture, select the workload capture and click
View.
The View Workload Capture page appears.
6.
Under Summary, information about the workload capture is displayed.
7.
To view the workload profile, click the Workload Profile tab.
Under Average Active Sessions, the Active Sessions chart provides a graphic
display of the captured session activity compared to the uncaptured session
activity (such as background activities or filtered sessions). This chart will be
shown only when there is Active Session History (ASH) data available for the
capture period.
Under Comparison, various statistics for the workload capture are displayed,
including database time, average active sessions, user calls, transactions, connects,
and application errors. The statistics for the total session activity are displayed in
the Total column, and the statistics for the captured session activity are displayed
in the Capture column. The Percentage of Total column displays the percentage of
total session activity that are being captured in the workload.
To view the workload capture report, click View Workload Capture Report.
8.
To view workload filters used by the workload capture, click the Workload Filters
tab.
Details about the workload filters used by the workload capture are displayed,
including the workload filter name, type, session attribute, and value.
9.
To return to the Database Replay page, click OK.
See Also:
■
Oracle Database Performance Tuning Guide for information about
ASH
Capturing a Database Workload Using APIs
This section describes how to capture a database workload using APIs. You can also
use Oracle Enterprise Manager to capture database workloads, as described in
"Capturing a Database Workload Using Enterprise Manager" on page 9-5.
Capturing a database workload using the DBMS_WORKLOAD_CAPTURE package
involves:
■
Defining Workload Capture Filters
■
Starting a Workload Capture
■
Stopping a Workload Capture
■
Exporting AWR Data for Workload Capture
See Also:
■
Oracle Database PL/SQL Packages and Types Reference for
information about the DBMS_WORKLOAD_CAPTURE package
Capturing a Database Workload
9-13
Capturing a Database Workload Using APIs
Defining Workload Capture Filters
This section describes how to add and remove workload capture filters. For
information about using workload filters with workload capture, see "Using Filters
with Workload Capture" on page 9-3.
To add filters to a workload capture, use the ADD_FILTER procedure:
BEGIN
DBMS_WORKLOAD_CAPTURE.ADD_FILTER (
fname => ’user_ichan’,
fattribute => ’USER’,
fvalue => ’ICHAN’);
END;
/
In this example, the ADD_FILTER procedure adds a filter named user_ichan, which
can be used to filter out all sessions belonging to the user name ICHAN.
The ADD_FILTER procedure in this example uses the following parameters:
■
■
■
The fname required parameter specifies the name of the filter that will be added.
The fattribute required parameter specifies the attribute on which the filter
will be applied. Valid values include PROGRAM, MODULE, ACTION, SERVICE,
INSTANCE_NUMBER, and USER.
The fvalue required parameter specifies the value for the corresponding
attribute on which the filter will be applied. It is possible to use wildcards such as
% with some of the attributes, such as modules and actions.
To remove filters from a workload capture, use the DELETE_FILTER procedure:
BEGIN
DBMS_WORKLOAD_CAPTURE.DELETE_FILTER (fname => ’user_ichan’);
END;
/
In this example, the DELETE_FILTER procedure removes the filter named user_ichan
from the workload capture.
The DELETE_FILTER procedure in this example uses the fname required parameter,
which specifies the name of the filter to be removed. The DELETE_FILTER procedure
will not remove filters that belong to completed captures; it only applies to filters of
captures that have yet to start.
Starting a Workload Capture
Before starting a workload capture, you must first complete the prerequisites for
capturing a database workload, as described in "Prerequisites for Capturing a
Database Workload" on page 9-1. You should also review the workload capture
options, as described in "Workload Capture Options" on page 9-2.
It is important to have a well-defined starting point for the workload so that the replay
system can be restored to that point before initiating a replay of the captured
workload. To have a well-defined starting point for the workload capture, it is
preferable not to have any active user sessions when starting a workload capture. If
active sessions perform ongoing transactions, those transactions will not be replayed
properly in subsequent database replays, since only that part of the transaction whose
calls were executed after the workload capture is started will be replayed. To avoid
this problem, consider restarting the database in RESTRICTED mode using STARTUP_
RESTRICTED before starting the workload capture. Once the workload capture begins,
9-14 Oracle Database Real Application Testing User's Guide
Capturing a Database Workload Using APIs
the database will automatically switch to UNRESTRICTED mode and normal
operations can continue while the workload is being captured. For more information
about restarting the database before capturing a workload, see "Restarting the
Database" on page 9-2.
To start the workload capture, use the START_CAPTURE procedure:
BEGIN
DBMS_WORKLOAD_CAPTURE.START_CAPTURE (name => ’dec10_peak’,
dir => ’dec10’,
duration => 600,
capture_sts => TRUE,
sts_cap_interval => 300);
END;
/
In this example, a workload named dec10_peak will be captured for 600 seconds and
stored in the operating system defined by the database directory object named dec10.
A SQL tuning set will also be captured in parallel with the workload capture.
The START_CAPTURE procedure in this example uses the following parameters:
■
■
■
■
The name required parameter specifies the name of the workload that will be
captured.
The dir required parameter specifies a directory object pointing to the directory
where the captured workload will be stored.
The duration parameter specifies the number of seconds before the workload
capture will end. If a value is not specified, the workload capture will continue
until the FINISH_CAPTURE procedure is called.
The capture_sts parameter specifies whether to capture a SQL tuning set in
parallel with the workload capture. If this parameter is set to TRUE, you can
capture a SQL tuning set during workload capture, then capture another SQL
tuning set during workload replay, and use SQL Performance Analyzer to
compare the SQL tuning sets without having to re-execute the SQL statements.
This enables you to obtain a SQL Performance Analyzer report and compare the
SQL performance—before and after the change—while running Database Replay.
You can also export the resulting SQL tuning set with its AWR data using the
EXPORT_AWR procedure, as described in "Exporting AWR Data for Workload
Capture" on page 9-16.
This feature is not supported for Oracle RAC. Workload capture filters that are
defined using DBMS_WORKLOAD_CAPTURE do not apply to the SQL tuning set
capture. The default value for this parameter is FALSE.
■
The sts_cap_interval parameter specifies the duration of the SQL tuning set
capture from the cursor cache in seconds. The default value is 300. Setting the
value of this parameter below the default value may cause additional overhead
with some workloads and is not recommended.
Stopping a Workload Capture
To stop the workload capture, use the FINISH_CAPTURE procedure:
BEGIN
DBMS_WORKLOAD_CAPTURE.FINISH_CAPTURE ();
END;
/
Capturing a Database Workload
9-15
Monitoring Workload Capture Using Views
In this example, the FINISH_CAPTURE procedure finalizes the workload capture and
returns the database to a normal state.
Tip: After capturing a workload on the production system, you need
to preprocess the captured workload, as described in Chapter 10,
"Preprocessing a Database Workload".
Exporting AWR Data for Workload Capture
Exporting AWR data enables detailed analysis of the workload. This data is also
required if you plan to run the Replay Compare Period report or the AWR Compare
Period report on a pair of workload captures or replays.
To export AWR data, use the EXPORT_AWR procedure:
BEGIN
DBMS_WORKLOAD_CAPTURE.EXPORT_AWR (capture_id => 2);
END;
/
In this example, the AWR snapshots that correspond to the workload capture with a
capture ID of 2 are exported, along with any SQL tuning set that may have been
captured during workload capture.
The EXPORT_AWR procedure uses the capture_id required parameter, which
specifies the ID of the capture whose AWR snapshots will be exported. This procedure
will work only if the corresponding workload capture was performed in the current
database and the AWR snapshots that correspond to the original capture time period
are still available.
Monitoring Workload Capture Using Views
This section summarizes the views that you can display to monitor workload capture.
You can also use Oracle Enterprise Manager to monitor workload capture, as
described in "Monitoring Workload Capture Using Enterprise Manager" on page 9-10.
To access these views, you need DBA privileges:
■
■
The DBA_WORKLOAD_CAPTURES view lists all the workload captures that have
been captured in the current database.
The DBA_WORKLOAD_FILTERS view lists all workload filters used for workload
captures defined in the current database.
See Also:
■
Oracle Database Reference for information about these views
9-16 Oracle Database Real Application Testing User's Guide
10
10
Preprocessing a Database Workload
After a workload is captured and setup of the test system is complete, the captured
data must be preprocessed. Preprocessing a captured workload creates all necessary
metadata for replaying the workload. This must be done once for every captured
workload before they can be replayed. After the captured workload is preprocessed, it
can be replayed repeatedly on a replay system.
To preprocess a captured workload, you will first need to move all captured data files
from the directory where they are stored on the capture system to a directory on the
instance where the preprocessing will be performed. Preprocessing is resource
intensive and should be performed on a system that is:
■
Separate from the production system
■
Running the same version of Oracle Database as the replay system
For Oracle Real Application Clusters (Oracle RAC), select one database instance of the
replay system for the preprocessing. This instance must have access to the captured
data files that require preprocessing, which can be stored on a local or shared file
system. If the capture directory path on the capture system resolves to separate
physical directories in each instance, you will need to move all the capture files created
in each of these directories into a single directory on which preprocessing will be
performed.
Typically, you will preprocess the captured workload on the replay system. If you
plan to preprocess the captured workload on a system that is separate from the replay
system, you will also need to move all preprocessed data files from the directory
where they are stored on the preprocessing system to a directory on the replay system
after preprocessing is complete.
This chapter contains the following sections:
■
Preprocessing a Database Workload Using Enterprise Manager
■
Preprocessing a Database Workload Using APIs
Tip: Before you can preprocess a captured workload, you need to
capture the workload on the production system, as described in
Chapter 9, "Capturing a Database Workload".
Preprocessing a Database Workload Using Enterprise Manager
This section describes how to preprocess a captured workload using Enterprise
Manager.
The primary tool for preprocessing workload captures is Oracle Enterprise Manager. If
for some reason Oracle Enterprise Manager is unavailable, you can preprocess
Preprocessing a Database Workload
10-1
Preprocessing a Database Workload Using Enterprise Manager
workload captures using the APIs, as described in "Preprocessing a Database
Workload Using APIs" on page 10-4.
To preprocess a captured workload using Enterprise Manager:
1. On the Software and Support page, under Real Application Testing, click
Database Replay.
The Database Replay page appears.
2.
In the Go to Task column, click the icon that corresponds to the Preprocess
Captured Workload task.
The Preprocess Captured Workload page appears.
3.
In the Directory Object list, select a directory that contains the captured workload
that you want to preprocess.
After a directory is selected, the Preprocess Captured Workload page will be
refreshed to display the Capture Summary section, which contains information
about the captured workload in the selected directory.
To view additional details about the captured workload, expand Capture Details.
The expanded Capture Details section displays the workload profile and details
for the captured workload.
4.
Click Preprocess Workload.
The Preprocess Captured Workload: Database Version page appears.
10-2 Oracle Database Real Application Testing User's Guide
Preprocessing a Database Workload Using Enterprise Manager
5.
Ensure that the current database version displayed matches the database version
on the intended replay system. Preprocessing must be performed on a system that
is running the same version of Oracle Database as the replay system.
Under Advanced, select whether to run the Workload Analyzer. Workload
Analyzer analyzes a workload capture directory and identifies parts of a captured
workload that may not replay accurately due to insufficient data, errors that
occurred during workload capture, or usage features that are not supported by
Database Replay. The results of the workload analysis are saved to an HTML
report named wcr_cap_analysis.html located in the capture directory that is
being analyzed. If an error can be prevented, the workload analysis report
displays available preventive actions that can be implemented before replay. If an
error cannot be corrected, the workload analysis report provides a description of
the error so it can be accounted for during replay. This option is enabled by
default if the Workload Analyzer has not been run previously. It is strongly
recommended that you run Workload Analyzer as part of the workload
preprocessing.
Click Next.
The Preprocess Captured Workload: Schedule page appears.
6.
Define the parameters for the preprocessing job.
Preprocessing a Database Workload
10-3
Preprocessing a Database Workload Using APIs
■
■
■
Under Job Parameters, enter a name and a description for the job.
Under Start, select whether the job will run immediately by selecting
Immediately, or at a later time by selecting Later and specifying the desired
time using the Date and Time fields.
Under Host Credentials, enter the user name and password information for
the database host that will used for the preprocessing.
After defining the job parameters, click Next.
The Preprocess Captured Workload: Review page appears.
7.
Review the selected options for the preprocessing job.
To preprocess the captured workload, click Submit. To make changes, click Back.
To cancel preprocessing without saving changes, click Cancel.
Tip: After preprocessing a captured workload, you can replay it on
the test system, as described in Chapter 11, "Replaying a Database
Workload".
Preprocessing a Database Workload Using APIs
This section describes how to preprocess a captured workload using the DBMS_
WORKLOAD_REPLAY package. You can also use Oracle Enterprise Manager to
preprocess a captured workload, as described in "Preprocessing a Database Workload
Using Enterprise Manager" on page 10-1.
To preprocess a captured workload, use the PROCESS_CAPTURE procedure:
BEGIN
DBMS_WORKLOAD_REPLAY.PROCESS_CAPTURE (capture_dir => ’dec06’);
END;
/
In this example, the captured workload stored in the dec06 directory will be
preprocessed.
The PROCESS_CAPTURE procedure in this example uses the capture_dir required
parameter, which specifies the directory that contains the captured workload to be
preprocessed.
Tip: After preprocessing a captured workload, you can replay it on
the test system, as described in Chapter 11, "Replaying a Database
Workload".
10-4 Oracle Database Real Application Testing User's Guide
Preprocessing a Database Workload Using APIs
See Also:
■
Oracle Database PL/SQL Packages and Types Reference for
information about the DBMS_WORKLOAD_REPLAY package
Running the Workload Analyzer Command-Line Interface
The Workload Analyzer is a Java program that analyzes a workload capture directory
and identifies parts of a captured workload that may not replay accurately due to
insufficient data, errors that occurred during workload capture, or usage features that
are not supported by Database Replay. The results of the workload analysis are saved
to an HTML report named wcr_cap_analysis.html located in the capture
directory that is being analyzed. If an error can be prevented, the workload analysis
report displays available preventive actions that can be implemented before replay. If
an error cannot be corrected, the workload analysis report provides a description of
the error so it can be accounted for during replay. Running Workload Analyzer is the
default option and is strongly recommended.
If you are preprocessing a workload capture using Oracle
Enterprise Manager, then you do not need to run Workload Analyzer
in the command-line interface. Oracle Enterprise Manager enables you
to run Workload Analyzer as part of the workload preprocessing.
Note:
Workload Analyzer is composed of two JAR files, dbranalyzer.jar and
dbrparser.jar, located in the $ORACLE_HOME/rdbms/jlib/ directory of a system
running Oracle Database Enterprise Edition Release 11.2.0.2 or higher. Workload
Analyzer requires Java 1.5 or higher and the ojdbc5.jar file located in the
$ORACLE_HOME/jdbc/lib/ directory. To run Workload Analyzer in the
command-line interface, run the following java command on a single line:
java -classpath
$ORACLE_HOME/jdbc/lib/ojdbc5.jar:$ORACLE_HOME/rdbms/jlib/dbrparser.jar:
$ORACLE_HOME/rdbms/jlib/dbranalyzer.jar:
oracle.dbreplay.workload.checker.CaptureChecker
<capture_directory> <connection_string>
For the capture_directory parameter, input the operating system path of the
capture directory. This directory should also contain the exported AWR data for the
workload capture. For the connection_string parameter, input the connection
string of an Oracle database that is release 11.1 or higher.
The Workload Analyzer program will then prompt you to input the username and
password of a database user with EXECUTE privileges for the DBMS_WORKLOAD_
CAPTURE package and the SELECT_CATALOG role on the target database.
An example of this command may be:
java -classpath
$ORACLE_HOME/jdbc/lib/ojdbc5.jar:$ORACLE_HOME/rdbms/jlib/dbrparser.jar:
$ORACLE_HOME/rdbms/jlib/dbranalyzer.jar:
oracle.dbreplay.workload.checker.CaptureChecker /scratch/capture
jdbc:oracle:thin:@myhost.mycompany.com:1521:orcl
Preprocessing a Database Workload
10-5
Preprocessing a Database Workload Using APIs
10-6 Oracle Database Real Application Testing User's Guide
11
11
Replaying a Database Workload
After a captured workload is preprocessed, it can be replayed repeatedly on a replay
system that is running the same version of Oracle Database.
This chapter describes how to replay a database workload on the test system and
contains the following sections:
■
Setting Up the Test System
■
Steps for Replaying a Database Workload
■
Replaying a Database Workload Using Enterprise Manager
■
Monitoring Workload Replay Using Enterprise Manager
■
Replaying a Database Workload Using APIs
■
Monitoring Workload Replay Using APIs
Tip:
■
■
Before you can replay a database workload, you must first:
Capture the workload on the production system, as described in
Chapter 9, "Capturing a Database Workload"
Preprocess the captured workload, as described in Chapter 10,
"Preprocessing a Database Workload"
Setting Up the Test System
Typically, the replay system where the preprocessed workload will be replayed
should be a test system that is separate from the production system. Before a test
system can be used for replay, it must be prepared properly, as described in the
following sections:
■
Restoring the Database
■
Resetting the System Time
Restoring the Database
Before a workload can be replayed, the application data state should be logically
equivalent to that of the capture system at the start time of workload capture. This
minimizes replay divergence during replay. The method for restoring the database
depends on the backup method that was used before capturing the workload. For
example, if RMAN was used to back up the capture system, you can use RMAN
DUPLICATE capabilities to create the test database. For more information, see
"Prerequisites for Capturing a Database Workload" on page 9-1.
Replaying a Database Workload
11-1
Steps for Replaying a Database Workload
After the database is created with the appropriate application data on the test system,
perform the system change you want to test, such as a database or operating system
upgrade. The primary purpose of Database Replay is to test the effect of system
changes on a captured workload. Therefore, the system changes you make should
define the test you are conducting with the captured workload.
Resetting the System Time
It is recommended that the system time on the replay system host be changed to a
value that approximately matches the capture start time just before replay is started.
Otherwise, an invalid data set may result when replaying time-sensitive workloads.
For example, a captured workload that contains SQL statements using the SYSDATE
and SYSTIMESTAMP functions may cause replay divergence when replayed on a
system that has a different system time. Resetting the system time will also minimize
job scheduling inconsistencies between capture and replay.
When resetting the system time, ensure that future Automatic
Workload Repository (AWR) snapshots can still be created
automatically as expected after the system time is reset.
Note:
Steps for Replaying a Database Workload
Proper planning of the workload replay ensures that the replay will be accurate.
Replaying a database workload requires the following steps:
■
Setting Up the Replay Directory
■
Resolving References to External Systems
■
Remapping Connections
■
Specifying Replay Options
■
Using Filters with Workload Replay
■
Setting Up Replay Clients
Setting Up the Replay Directory
The captured workload must have been preprocessed and copied to the replay system.
A directory object for the directory to which the preprocessed workload is copied
must exist in the replay system.
Resolving References to External Systems
A captured workload may contain references to external systems, such as database
links or external tables. Typically, you should reconfigure these external interactions to
avoid impacting other production systems during replay. External references that
need to be resolved before replaying a workload include:
■
Database links
It is typically not desirable for the replay system to interact with other databases.
Therefore, you should reconfigure all database links to point to an appropriate
database that contains the data needed for replay.
■
External tables
11-2 Oracle Database Real Application Testing User's Guide
Steps for Replaying a Database Workload
All external files specified using directory objects referenced by external tables
need to be available to the database during replay. The content of these files
should be the same as during capture, and the filenames and directory objects
used to define the external tables should also be valid.
■
Directory objects
You should reconfigure any references to directories on the production system by
appropriately redefining the directory objects present in the replay system after
restoring the database.
■
URLs
URLs/URIs that are stored in the database need to be configured so that Web
services accessed during the workload capture will point to the proper URLs
during replay. If the workload refers to URLs that are stored in the production
system, you should isolate the test system network during replay.
■
E-mails
To avoid resending E-mail notifications during replay, any E-mail server
accessible to the replay system should be configured to ignore requests for
outgoing E-mails.
Tip: To avoid impacting other production systems during replay,
Oracle strongly recommends running the replay within an isolated
private network that does not have access to the production
environment hosts.
Remapping Connections
During workload capture, connection strings used to connect to the production system
are captured. In order for the replay to succeed, you need to remap these connection
strings to the replay system. The replay clients can then connect to the replay system
using the remapped connections.
For Oracle Real Application Clusters (Oracle RAC) databases, you can map all
connection strings to a load balancing connection string. This is especially useful if the
number of nodes on the replay system is different from the capture system.
Alternatively, if you want to direct workload to specific instances, you can use services
or explicitly specify the instance identifier in the remapped connection strings.
Specifying Replay Options
After the database is restored and connections are remapped, you can set the
following replay options as appropriate:
■
Preserving COMMIT Order
■
Controlling Session Connection Rate
■
Controlling Request Rate Within a Session
Preserving COMMIT Order
The synchronization parameter controls whether the COMMIT order in the
captured workload will be preserved during replay.
If this parameter is set to SCN, the COMMIT order in the captured workload will be
preserved during replay and all replay actions will be executed only after all
dependent COMMIT actions have completed.
Replaying a Database Workload
11-3
Steps for Replaying a Database Workload
If this parameter is set to OBJECT_ID, all replay actions will be executed only after all
relevant COMMIT actions have completed. Relevant COMMIT actions must meet the
following criteria:
■
■
Issued before the given action in the workload capture
Modified at least one of the database objects for which the given action is
referencing, either implicitly or explicitly
Setting this parameter to OBJECT_ID allows for more concurrency during workload
replays for COMMIT actions that do not reference the same database objects during
workload capture.
You can disable this option by setting the parameter to OFF, but the replay will likely
yield significant replay divergence. However, this may be desirable if the workload
consists primarily of independent transactions, and divergence during
unsynchronized replay is acceptable.
Controlling Session Connection Rate
The connect_time_scale parameter enables you to scale the elapsed time between
the time when the workload capture began and each session connects. You can use
this option to manipulate the session connect time during replay with a given
percentage value. The default value is 100, which will attempt to connect all sessions
as captured. Setting this parameter to 0 will attempt to connect all sessions
immediately.
Controlling Request Rate Within a Session
User think time is the elapsed time while the replayed user waits between issuing calls
within a single session. To control replay speed, use the think_time_scale
parameter to scale user think time during replay.
If user calls are being executed slower during replay than during capture, you can
make the database replay attempt to catch up by setting the think_time_auto_
correct parameter to TRUE. This will make the replay client shorten the think time
between calls, so that the overall elapsed time of the replay will more closely match
the captured elapsed time.
If user calls are being executed faster during replay than during capture, setting the
think_time_auto_correct parameter to TRUE will not change the think time. The
replay client will not increase the think time between calls to match the captured
elapsed time.
Using Filters with Workload Replay
By default, all captured database calls are replayed during workload replay. You can
use workload filters to specify which database calls to include in or exclude from the
workload during workload replay.
Workload replay filters are first defined and then added to a replay filter set so they
can be used in a workload replay. There are two types of workload filters: inclusion
filters and exclusion filters. Inclusion filters enable you to specify database calls that
will be replayed. Exclusion filters enable you to specify database calls that will not be
replayed. You can use either inclusion filters or exclusion filters in a workload replay,
but not both. The workload filter is determined as an inclusion or exclusion filter when
the replay filter set is created.
11-4 Oracle Database Real Application Testing User's Guide
Steps for Replaying a Database Workload
Setting Up Replay Clients
The replay client is a multithreaded program (an executable named wrc located in the
$ORACLE_HOME/bin directory) where each thread submits a workload from a
captured session. Before replay begins, the database will wait for replay clients to
connect. At this point, you need to set up and start the replay clients, which will
connect to the replay system and send requests based on what has been captured in
the workload.
Before starting replay clients, ensure that the:
■
Replay client software is installed on the hosts where it will run
■
Replay clients have access to the replay directory
■
Replay directory contains the preprocessed workload capture
■
■
■
Replay user has the correct user ID, password, and privileges (the replay user
needs the DBA role and cannot be the SYS user)
Replay clients are not started on a system that is running the database
Replay clients read the capture directory on a file system that is different from the
one on which the database files reside
To do this, copy the capture directory to the system where the replay client will
run. After the replay is completed, you can delete the capture directory.
After these prerequisites are met, you can proceed to set up and start the replay clients
using the wrc executable. The wrc executable uses the following syntax:
wrc [user/password[@server]] MODE=[value] [keyword=[value]]
The parameters user, password and server specify the username, password and
connection string used to connect to the replay database. The parameter mode specifies
the mode in which to run the wrc executable. Possible values include replay (the
default), calibrate, and list_hosts. The parameter keyword specifies the
options to use for the execution and is dependent on the mode selected. To display the
possible keywords and their corresponding values, run the wrc executable without
any arguments.
The following sections describe the modes that you can select when running the wrc
executable:
■
Calibrating Replay Clients
■
Starting Replay Clients
■
Displaying Host Information
Calibrating Replay Clients
Since one replay client can initiate multiple sessions with the database, it is not
necessary to start a replay client for each session that was captured. The number of
replay clients that need to be started depends on the number of workload streams, the
number of hosts, and the number of replay clients for each host.
To estimate the number of replay clients and hosts that are required to replay a
particular workload, run the wrc executable in calibrate mode.
In calibrate mode, the wrc executable accepts the following keywords:
■
replaydir specifies the directory that contains the preprocessed workload
capture you want to replay. If unspecified, it defaults to the current directory.
Replaying a Database Workload
11-5
Steps for Replaying a Database Workload
■
■
process_per_cpu specifies the maximum number of client processes that can
run per CPU. The default value is 4.
threads_per_process specifies the maximum number of threads that can run
within a client process. The default value is 50.
The following example shows how to run the wrc executable in calibrate mode:
%> wrc mode=calibrate replaydir=./replay
In this example, the wrc executable is executed to estimate the number of replay
clients and hosts that are required to replay the workload capture stored in a
subdirectory named replay under the current directory. In the following sample
output, the recommendation is to use at least 21 replay clients divided among 6 CPUs:
Workload Replay Client: Release 11.2.0.0.2 - Production on Fri May 1
13:06:33 2009
Copyright (c) 1982, 2009, Oracle.
All rights reserved.
Report for Workload in: /oracle/replay/
----------------------Recommendation:
Consider using at least 21 clients divided among 6 CPU(s).
Workload Characteristics:
- max concurrency: 1004 sessions
- total number of sessions: 1013
Assumptions:
- 1 client process per 50 concurrent sessions
- 4 client process per CPU
- think time scale = 100
- connect time scale = 100
- synchronization = TRUE
Starting Replay Clients
After determining the number of replay clients that are needed to replay the workload,
you need to start the replay clients by running the wrc executable in replay mode on
the hosts where they are installed. Once started, each replay client will initiate one or
more sessions with the database to drive the workload replay.
In replay mode, the wrc executable accepts the following keywords:
■
■
■
■
■
userid and password specify the user ID and password of a replay user for the
replay client. If unspecified, these values default to the system user.
server specifies the connection string that is used to connect to the replay
system. If unspecified, the value defaults to an empty string.
replaydir specifies the directory that contains the preprocessed workload
capture you want to replay. If unspecified, it defaults to the current directory.
workdir specifies the directory where the client logs will be written. This
parameter is only used with the debug parameter for debugging purposes.
debug specifies whether debug data will be created. Possible values include:
–
on
Debug data will be written to files in the working directory
11-6 Oracle Database Real Application Testing User's Guide
Steps for Replaying a Database Workload
–
off
No debug data will be written (the default value)
Note: Before running the wrc executable in debug mode, contact
Oracle Support for more information.
■
connection_override specifies whether to override the connection mappings
stored in the DBA_WORKLOAD_CONNECTION_MAP view. If set to TRUE, connection
remappings stored in the DBA_WORKLOAD_CONNECTION_MAP view will be
ignored and the connection string specified using the server parameter will be
used. If set to FALSE, all replay threads will connect using the connection
remappings stored in the DBA_WORKLOAD_CONNECTION_MAP view. This is the
default setting.
The following example shows how to run the wrc executable in replay mode:
%> wrc system/password@test mode=replay replaydir=./replay
In this example, the wrc executable starts the replay client to replay the workload
capture stored in a subdirectory named replay under the current directory.
After all replay clients have connected, the database will automatically distribute
workload capture streams among all available replay clients and workload replay can
begin. You can monitor the status of the replay clients using the V$WORKLOAD_
REPLAY_THREAD view. After the replay finishes, all replay clients will disconnect
automatically.
Displaying Host Information
You can display the hosts that participated in a workload capture and workload
replay by running the wrc executable in list_hosts mode.
In list_hosts mode, the wrc executable accepts the keyword replaydir, which
specifies the directory that contains the preprocessed workload capture you want to
replay. If unspecified, it defaults to the current directory.
The following example shows how to run the wrc executable in list_hosts mode:
%> wrc mode=list_hosts replaydir=./replay
In this example, the wrc executable is executed to list all hosts that participated in
capturing or replaying the workload capture stored in a subdirectory named replay
under the current directory. In the following sample output, the hosts that participated
in the workload capture and three subsequent replays are shown:
Workload Replay Client: Release 11.2.0.0.2 - Production on Fri May 1 13:44:48 2009
Copyright (c) 1982, 2009, Oracle.
All rights reserved.
Hosts found:
Capture:
prod1
prod2
Replay 1:
test1
Replay 2:
test1
test2
Replay 3:
Replaying a Database Workload
11-7
Replaying a Database Workload Using Enterprise Manager
testwin
Replaying a Database Workload Using Enterprise Manager
This section describes how to replay a database workload using Enterprise Manager.
The primary tool for replaying database workloads is Oracle Enterprise Manager. If
for some reason Oracle Enterprise Manager is unavailable, you can also replay
database workloads using APIs, as described in "Replaying a Database Workload
Using APIs" on page 11-18.
To replay a database workload using Enterprise Manager:
1. On the Software and Support page, under Real Application Testing, click
Database Replay.
The Database Replay page appears.
2.
In the Go to Task column, click the icon that corresponds to the Replay Workload
task.
The Replay Workload page appears.
3.
In the Directory Object list, select a directory that contains the preprocessed
workload that you want to replay.
After a directory is selected, the Replay Workload page will be refreshed to
display the Capture Summary and the Replay History sections. For more
information, see "Setting Up the Replay Directory" on page 11-2.
11-8 Oracle Database Real Application Testing User's Guide
Replaying a Database Workload Using Enterprise Manager
The Capture Summary section displays information about the preprocessed
workload capture in the selected directory.
4.
To view additional details about the workload capture, expand Capture Details.
The Capture Details section displays the workload profile and workload filters
used during the workload capture.
If a Workload Analyzer report was created for the workload, click View
Workload Analyzer Report to view it.
5.
Click Set Up Replay.
The Replay Workload: Prerequisites page appears.
6.
Verify that all prerequisites are met before proceeding.
For more information about the prerequisites, see "Steps for Replaying a Database
Workload" on page 11-2. If you are replaying the workload on a test system,
ensure that the test system is properly prepared for replay. For more information,
see "Setting Up the Test System" on page 11-1.
Once all prerequisites are completed, click Continue.
The Replay Workload: References to External Systems page appears.
7.
Verify potential references to all external systems and modify any invalid
references.
Use the links available on the Replay Workload: References to External Systems
page to verify the database links, directory objects, and Oracle Streams that may
be referenced during the workload capture process. There may be other references
to external systems that are not included in these categories. For more information,
see "Resolving References to External Systems" on page 11-2.
Once all references to external systems have been verified and modified as
necessary, click Continue.
The Replay Workload: Choose Initial Options page appears.
8.
In the Replay Name field, you may enter a name for the replay, or simply use the
name generated by the system.
9.
Under SQL Performance Analyzer, select whether to capture SQL statements into
a SQL tuning set during workload replay.
Replaying a Database Workload
11-9
Replaying a Database Workload Using Enterprise Manager
While Database Replay provide analysis of how a change affects your entire
system, you can use a SQL tuning set in conjunction with SQL Performance
Analyzer to gain a more SQL-centric analysis of how the change affects SQL
statements and execution plans.
By capturing a SQL tuning set during workload replay, you can use SQL
Performance Analyzer to compare this SQL tuning set to another SQL tuning set
captured during workload capture, without having to re-execute the SQL
statements. This enables you to obtain a SQL Performance Analyzer report and
compare the SQL performance, before and after change, while running Database
Replay.
Capturing SQL statements into a SQL tuning set is the default
and recommended workload replay option.
Note:
10. Under Identify Source, select whether to use default replay options or replay
options from a previous replay (if one is available). If multiple replays exist, select
the replay you want to use from the Replay Name list.
Click Next.
The Replay Workload: Customize Options page appears.
11. Remap captured connection strings to connection strings that point to the replay
system.
Click the Connection Mappings tab. There are several methods you can use to
remap captured connection strings. You can choose to:
■
Use a single connect descriptor for all client connections by selecting this
option and entering the connect descriptor you want to use. The connect
descriptor should point to the replay system.
To test the connection, click Test Connection. If the connect descriptor is
valid, an Information message is displayed to inform you that the connection
was successful.
11-10 Oracle Database Real Application Testing User's Guide
Replaying a Database Workload Using Enterprise Manager
■
■
Use a single TNS net service name for all client connections by selecting this
option and entering the net service name you want to use. All replay clients
must be able to resolve the net service name, which can be done using a local
tnsnames.ora file.
Use a separate connect descriptor or net service name for each client connect
descriptor captured in the workload by selecting this option and, for each
capture system value, entering a corresponding replay system value that will
be used by the replay client.
For more information, see "Remapping Connections" on page 11-3.
12. Specify the replay options using the replay parameters.
To modify the replay behavior, click the Replay Parameters tab and enter the
desired values for each replay parameter. Using the default values is
recommended. For information about setting the replay parameters, see
"Specifying Replay Options" on page 11-3.
After setting the replay parameters, click Next.
The Replay Workload: Prepare Replay Clients page appears.
13. Ensure that replay clients are prepared for replay.
Before proceeding, the replay clients need to be prepared. For more information,
see "Setting Up Replay Clients" on page 11-5.
After all replay clients are ready to start, click Next.
The Replay Workload: Wait for Client Connections page appears.
Replaying a Database Workload 11-11
Replaying a Database Workload Using Enterprise Manager
14. Start the replay clients.
For information about starting replay clients, see "Setting Up Replay Clients" on
page 11-5.
As replay clients are started, the replay client connections will be displayed under
Client Connections. When all replay clients have connected, click Next.
The Replay Workload: Review page appears.
15. Review the options and parameters that have been defined for the workload
replay.
Before starting replay, reset the system clock to a value that is as close to the
capture start time as possible. This minimizes any replay divergence that may
result from replaying a time-sensitive workload. For more information, see
"Resetting the System Time" on page 11-2.
To begin replay, click Submit. If no replay clients are connected, this button will
be disabled. To make changes, click Back. To cancel replay without saving
changes, click Cancel.
Once the replay is started, the View Workload Replay page appears. For
information about monitoring an active workload replay, see "Monitoring an
Active Workload Replay" on page 11-13.
11-12 Oracle Database Real Application Testing User's Guide
Monitoring Workload Replay Using Enterprise Manager
Monitoring Workload Replay Using Enterprise Manager
This section describes how to monitor workload replay using Enterprise Manager. The
primary tool for monitoring workload replay is Oracle Enterprise Manager. Using
Enterprise Manager, you can:
■
Monitor or stop an active workload replay
■
View a completed workload replay
If for some reason Oracle Enterprise Manager is unavailable, you can monitor
workload replay using APIs and views, as described in "Monitoring Workload Replay
Using APIs" on page 11-26.
This section contains the following topics:
■
Monitoring an Active Workload Replay
■
Viewing a Completed Workload Replay
Monitoring an Active Workload Replay
This section describes how to monitor an active workload replay using Enterprise
Manager.
To monitor an active workload replay:
1. On the Software and Support page, under Real Application Testing, click
Database Replay.
The Database Replay page appears.
2.
Under Active Capture and Replay, select the workload replay you want to
monitor and click View.
The View Workload Replay page appears.
Replaying a Database Workload 11-13
Monitoring Workload Replay Using Enterprise Manager
3.
Once the workload replay is completed, you can assess various types of
information about the replay using this page, as described in "Viewing a
Completed Workload Replay" on page 11-14.
To stop the workload replay manually, click Stop Replay. To return to the
Database Replay page, click OK.
Viewing a Completed Workload Replay
This section describes how to view a completed workload replay using Enterprise
Manager.
To view a completed workload replay:
1. On the Software and Support page, under Real Application Testing, click
Database Replay.
The Database Replay page appears.
2.
In the Go to Task column, click the icon that corresponds to the Replay Workload
task.
The Replay Workload page appears.
3.
In the Directory Object list, select the directory that contains the replayed
workload that you want to view.
After the directory is selected, the Replay Workload page will be refreshed to
display the Capture Summary and the Replay History sections.
11-14 Oracle Database Real Application Testing User's Guide
Monitoring Workload Replay Using Enterprise Manager
4.
The Replay History section displays previous replays of the workload capture. To
view details about a replay, select the replay and click View.
The View Workload Replay page appears.
5.
Under Summary, information about the workload replay is displayed.
6.
To view the workload profile, click the Workload Profile tab.
There are two types of charts that are available under the Workload Profile tab:
■
Elapsed Time Comparison
To view this chart, in the Chart Type field, select Elapsed Time Comparison.
The Elapsed Time Comparison chart shows how much time it has taken to
replay the same workload compared to the elapsed time during the workload
capture. If the Replay bar is shorter than the Capture bar, the replay system is
processing the workload faster than the capture system.
■
User Call Progress
To view this chart, in the Chart Type field, select User Call Progress.
The User Call Progress chart shows how much time it has taken to replay the
same workload compared to the elapsed time during the workload capture in
terms of user calls. If the Replay line is above or to the left of the Capture line,
the replay system is processing the workload faster than the capture system.
If the workload capture was performed on an older version of Oracle
Database, then the Capture line may not appear in the User Call Progress
chart because the user call data may be unavailable. In this case, import the
user call data by clicking the Import User Call Data button, which will appear
next to the Chart Type list.
Under Divergence, any error and data discrepancies between the replay system
and the capture system are displayed as diverged database calls during replay.
The percentage of total calls that diverged can be used as a measure of the replay
quality. To view details about the diverged calls, click the link that corresponds to
the type of diverged call in the Number of Calls column to bring up the Diverged
Replaying a Database Workload 11-15
Monitoring Workload Replay Using Enterprise Manager
Calls During Replay page. The Diverged Calls During Replay page shows the
most relevant set of replayed calls that diverged from the workload captured by
grouping them based on common attribute values and specified filter conditions.
To view details about a particular diverged call—such as the call attributes, SQL
text, and bind variables—click the corresponding link in the SQL ID column to
bring up the Replay Diverged Statement page.
To view a detailed comparison of the workload during capture and replay, expand
Detailed Comparison.
The Detailed Comparison section displays the following information:
■
Duration
The duration that was captured in a workload is compared to the amount of
time it took to replay the workload. In the Capture column, the duration of the
time period that was captured is shown. In the Replay column, the amount of
time it took to replay the workload is shown. The Percentage of Capture
column shows the percentage of the captured duration that it took to replay
the workload. If the value is under 100 percent, the replay system processed
the workload faster than the capture system. If the value is over 100 percent,
the replay system processed the workload slower than the capture system.
■
Database time
The database time that is consumed in the time period that was captured is
compared to the amount of database time that is consumed when replaying
the workload.
■
Average active sessions
The number of average active sessions captured in the workload is compared
to the number of average active session that are replayed.
■
User calls
The number of user calls captured in the workload is compared to the number
of user calls that are replayed.
To view the workload replay report, click View Workload Replay Report. For
information about using the Workload Replay report, see "Reviewing Workload
Replay Reports" on page 12-5.
7.
To view the connection strings used in the capture and the replay systems, click
the Connection Mappings tab.
8.
To view replay parameters used by the workload replay, click the Replay
Parameters tab.
9.
To run a report, click the Report tab.
11-16 Oracle Database Real Application Testing User's Guide
Monitoring Workload Replay Using Enterprise Manager
There are several types of reports you can run for a completed workload replay:
■
Workload Replay
The Workload Replay report contains information that can be used to measure
data and performance divergence between the capture system and the replay
system. To run this report, under Workload Replay Report, click Run Report.
For information about using the Workload Replay report, see "Reviewing
Workload Replay Reports" on page 12-5.
■
Replay Compare Period
The Replay Compare Period report can be used to compare one workload
replay to its capture or to another replay of the same capture. Before running
this report, AWR data for the captured or replayed workload must have been
previously exported. To run this report, under Compare Period Report, select
the first and second workload captures or replays you want to compare and
click Run Replay Compare Period Report. For information about using the
Replay Compare Period report, see "Reviewing Replay Compare Period
Reports" on page 12-9.
■
AWR Compare Period
The AWR Compare Period report can be used to compare the AWR data in
one workload capture or replay with another. Before running this report,
AWR data for the captured or replayed workload must have been previously
exported. To run this report, under Compare Period Report, select the first
and second workload captures or replays you want to compare and click Run
AWR Compare Period Report. If AWR data is not previously exported from
the captured or replayed workload, you will be prompted to import the AWR
data before continuing. For more information about the AWR Compare Period
report, see Oracle Database 2 Day + Performance Tuning Guide.
■
SQL Performance Analyzer Report
Replaying a Database Workload 11-17
Replaying a Database Workload Using APIs
The SQL Performance Analyzer report can be used to compare the SQL tuning
sets in one workload capture or replay with another. To run this report, under
Compare Period Report, select the first and second workload captures or
replays containing the SQL tuning sets you want to compare and click Run
SQL Performance Analyzer Report. For more information about the SQL
Performance Analyzer report, see "Reviewing the SQL Performance Analyzer
Report Using Oracle Enterprise Manager" on page 6-3.
■
AWR
The AWR report shows the AWR data contained in a workload that was
captured or replayed. Before running this report, AWR data must have been
previously exported from the captured or replayed workload. To run this
report, under AWR Report, select the workload capture or replay for which
you want to generate an AWR report and click Run Report. If AWR data is
not previously exported from the captured or replayed workload, you will be
prompted to import the AWR data before continuing. For more information
about the AWR report, see Oracle Database Performance Tuning Guide.
■
ASH
The ASH report contains active session history (ASH) information for a
specified duration of a workload that was captured or replayed. Before
running this report, AWR data must have been previously exported from the
captured or replayed workload. To run this report, under ASH Report, select
the workload capture or replay for which you want to generate an ASH
report. Specify the duration using the Start Date, Start Time, End Date, and
End Time fields. You can also apply filters using the Filter field. Once the
duration and filters are specified, click Run Report. If AWR data is not
previously exported from the captured or replayed workload, you will be
prompted to import the AWR data before continuing. For more information
about the ASH report, see Oracle Database 2 Day + Performance Tuning Guide.
The Report window opens while the report is being generated. Once the report is
generated, you can save the report by clicking Save to File.
10. To return to the Database Replay page, click OK.
Replaying a Database Workload Using APIs
This section describes how to replay a database workload using the DBMS_
WORKLOAD_REPLAY package. You can also use Oracle Enterprise Manager to replay a
database workload, as described in "Replaying a Database Workload Using Enterprise
Manager" on page 11-8.
Replaying a database workload using the DBMS_WORKLOAD_REPLAY package is a
multi-step process that involves:
■
Initializing Replay Data
■
Connection Remapping
■
Setting Workload Replay Options
■
Defining Workload Replay Filters and Replay Filter Sets
■
Setting the Replay Timeout Action
■
Starting a Workload Replay
■
Pausing a Workload Replay
11-18 Oracle Database Real Application Testing User's Guide
Replaying a Database Workload Using APIs
■
Resuming a Workload Replay
■
Cancelling a Workload Replay
■
Exporting AWR Data for Workload Replay
See Also:
■
Oracle Database PL/SQL Packages and Types Reference for
information about the DBMS_WORKLOAD_REPLAY package
Initializing Replay Data
After the workload capture is preprocessed and the test system is properly prepared,
the replay data can be initialized. Initializing replay data loads the necessary metadata
into tables required by workload replay. For example, captured connection strings are
loaded into a table where they can be remapped for replay.
To initialize replay data, use the INITIALIZE_REPLAY procedure:
BEGIN
DBMS_WORKLOAD_REPLAY.INITIALIZE_REPLAY (replay_name => ’dec06_102’,
replay_dir => ’dec06’);
END;
/
In this example, the INITIALIZE_REPLAY procedure loads preprocessed workload
data from the dec06 directory into the database.
The INITIALIZE_REPLAY procedure in this example uses the following parameters:
■
■
The replay_name required parameter specifies a replay name that can be used
with other APIs to retrieve settings and filters of previous replays.
The replay_dir required parameter specifies the directory that contains the
workload capture that will be replayed.
See Also:
■
■
"Preprocessing a Database Workload Using APIs" on page 10-4 for
information about preprocessing a workload capture
"Setting Up the Test System" on page 11-1 for information
preparing the test system
Connection Remapping
After the replay data is initialized, connection strings used in the workload capture
need to be remapped so that user sessions can connect to the appropriate databases
and perform external interactions as captured during replay. To view connection
mappings, use the DBA_WORKLOAD_CONNECTION_MAP view. For information about
connection remapping, see "Remapping Connections" on page 11-3.
To remap connections, use the REMAP_CONNECTION procedure:
BEGIN
DBMS_WORKLOAD_REPLAY.REMAP_CONNECTION (connection_id => 101,
replay_connection => ’dlsun244:3434/bjava21’);
END;
/
In this example, the connection that corresponds to the connection ID 101 will use the
new connection string defined by the replay_connection parameter.
Replaying a Database Workload 11-19
Replaying a Database Workload Using APIs
The REMAP_CONNECTION procedure in this example uses the following parameters:
■
■
The connection_id required parameter is generated when initializing replay
data and corresponds to a connection from the workload capture.
The replay_connection optional parameter specifies the new connection string
that will be used during workload replay.
Setting Workload Replay Options
After the replay data is initialized and the connections are appropriately remapped,
you need to prepare the database for workload replay. For information about
workload replay preparation, see "Steps for Replaying a Database Workload" on
page 11-2.
To prepare workload replay on the replay system, use the PREPARE_REPLAY
procedure:
BEGIN
DBMS_WORKLOAD_REPLAY.PREPARE_REPLAY (synchronization => TRUE,
capture_sts => TRUE,
sts_cap_interval => 300);
END;
/
In this example, the PREPARE_REPLAY procedure prepares a replay that has been
previously initialized. The COMMIT order in the workload capture will be preserved. A
SQL tuning set will also be captured in parallel with the workload replay.
The PREPARE_REPLAY procedure uses the following parameters:
■
The synchronization required parameter determines if synchronization will be
used during workload replay.
If this parameter is set to SCN, the COMMIT order in the captured workload will be
preserved during replay and all replay actions will be executed only after all
dependent COMMIT actions have completed. The default value is SCN.
If this parameter is set to OBJECT_ID, all replay actions will be executed only after
all relevant COMMIT actions have completed. Relevant COMMIT actions must meet
the following criteria:
–
Issued before the given action in the workload capture
–
Modified at least one of the database objects for which the given action is
referencing, either implicitly or explicitly
Setting this parameter to OBJECT_ID allows for more concurrency during
workload replays for COMMIT actions that do not reference the same database
objects during workload capture.
You can disable this option by setting the parameter to OFF, but the replay will
likely yield significant replay divergence. However, this may be desirable if the
workload consists primarily of independent transactions, and divergence during
unsynchronized replay is acceptable.
■
■
The connect_time_scale parameter scales the elapsed time from when the
workload capture started to when the session connects with the specified value
and is interpreted as a % value. Use this parameter to increase or decrease the
number of concurrent users during replay. The default value is 100.
The think_time_scale parameter scales the elapsed time between two
successive user calls from the same session and is interpreted as a % value. Setting
11-20 Oracle Database Real Application Testing User's Guide
Replaying a Database Workload Using APIs
this parameter to 0 will send user calls to the database as fast as possible during
replay. The default value is 100.
■
■
■
The think_time_auto_correct parameter corrects the think time (based on
the think_time_scale parameter) between calls when user calls take longer to
complete during replay than during capture. This parameter can be set to either
TRUE or FALSE. Setting this parameter to TRUE reduces the think time if the
workload replay is taking longer than the workload capture. The default value is
TRUE.
The scale_up_multiplier parameter defines the number of times the
workload is scaled up during replay. Each captured session will be replayed
concurrently for as many times as specified by this parameter. However, only one
session in each set of identical replay sessions will execute both queries and
updates. The rest of the sessions will only execute queries.
The capture_sts parameter specifies whether to capture a SQL tuning set in
parallel with the workload replay. If this parameter is set to TRUE, you can capture
a SQL tuning set during workload replay and use SQL Performance Analyzer to
compare it to another SQL tuning set without having to re-execute the SQL
statements. This enables you to obtain a SQL Performance Analyzer report and
compare the SQL performance—before and after the change—while running
Database Replay. You can also export the resulting SQL tuning set with its AWR
data using the EXPORT_AWR procedure, as described in "Exporting AWR Data for
Workload Replay" on page 11-25.
This feature is not supported for Oracle RAC. Workload replay filters that are
defined using DBMS_WORKLOAD_REPLAY do not apply to the SQL tuning set
capture. The default value for this parameter is FALSE.
■
The sts_cap_interval parameter specifies the duration of the SQL tuning set
capture from the cursor cache in seconds. The default value is 300. Setting the
value of this parameter below the default value may cause additional overhead
with some workloads and is not recommended.
For more information about setting these parameters, see "Specifying Replay Options"
on page 11-3.
Defining Workload Replay Filters and Replay Filter Sets
This section describes how to add and remove workload replay filters, and how to
create and use replay filter sets. For information about using workload filters and
replay filter sets with workload replay, see "Using Filters with Workload Replay" on
page 11-4.
This section contains the following topics:
■
Adding Workload Replay Filters
■
Deleting Workload Replay Filters
■
Creating a Replay Filter Set
■
Using a Replay Filter Set
Adding Workload Replay Filters
To add a new filter to be used in a replay filter set, use the ADD_FILTER procedure:
BEGIN
DBMS_WORKLOAD_REPLAY.ADD_FILTER (
fname => ’user_ichan’,
Replaying a Database Workload 11-21
Replaying a Database Workload Using APIs
fattribute => ’USER’,
fvalue => ’ICHAN’);
END;
/
In this example, the ADD_FILTER procedure adds a filter named user_ichan, which
can be used to filter out all sessions belonging to the user name ICHAN.
The ADD_FILTER procedure in this example uses the following parameters:
■
■
■
The fname required parameter specifies the name of the filter that will be added.
The fattribute required parameter specifies the attribute on which the filter
will be applied. Valid values include PROGRAM, MODULE, ACTION, SERVICE,
USER, and CONNECTION_STRING. You must specify a valid captured
connection string that will be used during replay as the CONNECTION_STRING
attribute.
The fvalue required parameter specifies the value for the corresponding
attribute on which the filter will be applied. It is possible to use wildcards such as
% with some of the attributes, such as modules and actions.
Once all workload replay filters are added, you can create a replay filter set that can be
used when replaying the workload.
Deleting Workload Replay Filters
To delete workload replay filters, use the DELETE_FILTER procedure:
BEGIN
DBMS_WORKLOAD_REPLAY.DELETE_FILTER (fname => ’user_ichan’);
END;
/
In this example, the DELETE_FILTER procedure removes the filter named user_ichan.
The DELETE_FILTER procedure in this example uses the fname required parameter,
which specifies the name of the filter to be removed.
Creating a Replay Filter Set
After the workload replay filters are added, you can create a set of replay filters to use
with workload replay. When creating a replay filter set, all workload replay filters that
were added since the previous replay filter set was created will be used.
To create a replay filter set, use the CREATE_FILTER_SET procedure:
BEGIN
DBMS_WORKLOAD_REPLAY.CREATE_FILTER_SET (
replay_dir => ’apr09’,
filter_set => ’replayfilters’,
default_action => ’INCLUDE’);
END;
/
In this example, the CREATE_FILTER_SET procedure creates a replay filter set named
replayfilters, which will replay all captured calls for the replay stored in the apr09
directory, except for the part of the workload defined by the replay filters.
The CREATE_FILTER_SET procedure in this example uses the following parameters:
■
The replay_dir parameter specifies the directory where the replay to be filtered
is stored
11-22 Oracle Database Real Application Testing User's Guide
Replaying a Database Workload Using APIs
■
■
The filter_set parameter specifies the name of the filter set to create
The default_action parameter determines if every captured database call
should be replayed and whether the workload replay filters should be considered
as inclusion or exclusion filters.
If this parameter is set to INCLUDE, all captured database calls will be replayed,
except for the part of the workload defined by the replay filters. In this case, all
replay filters will be treated as exclusion filters, since they will define the part of
the workload that will not be replayed. This is the default behavior.
If this parameter is set to EXCLUDE, none of the captured database calls will be
replayed, except for the part of the workload defined by the replay filters. In this
case, all replay filters will be treated as inclusion filters, since they will define the
part of the workload that will be replayed.
Using a Replay Filter Set
Once the replay filter set is created and the replay is initialized, you can use the replay
filter set to filter the replay in the replay_dir directory.
To use a replay filter set, use the USE_FILTER_SET procedure:
BEGIN
DBMS_WORKLOAD_REPLAY.USE_FILTER_SET (filter_set => ’replayfilters’);
END;
/
In this example, the USE_FILTER_SET procedure uses the filter set named
replayfilters.
The USE_FILTER_SET procedure in this example uses the filter_set required
parameter, which specifies the name of the filter set to be used in the replay.
Setting the Replay Timeout Action
This section describes how to set a timeout action for the workload replay. You can set
a replay timeout action to abort user calls that are significantly slower during replay or
cause a replay to hang. For example, you may want to set a replay timeout action to
abort runaway queries caused by sub-optimal execution plans following a database
upgrade.
When a replay timeout action is enabled, a user call will exit with an ORA-15569 error
if it is delayed beyond the conditions specified by the replay timeout action. The
aborted call and its error are reported as error divergence.
To set a replay timeout, use the SET_REPLAY_TIMEOUT procedure:
BEGIN
DBMS_WORKLOAD_REPLAY.SET_REPLAY_TIMEOUT (
enabled => TRUE,
min_delay => 20,
max_delay => 60,
delay_factor => 10);
END;
/
In this example, the SET_REPLAY_TIMEOUT procedure defines a replay timeout
action that will abort a user call if the delay during replay is more than 60 minutes, or
if the delay during replay is over 20 minutes and the elapsed time is 10 times greater
than the capture elapsed time.
Replaying a Database Workload 11-23
Replaying a Database Workload Using APIs
The SET_REPLAY_TIMEOUT procedure in this example uses the following parameters:
■
■
■
■
The enabled parameter specifies if the replay timeout action is enabled or
disabled. The default value is TRUE.
The min_delay parameter defines the lower bound value of call delay in
minutes. The replay timeout action is only activated when the delay is over this
value. The default value is 10.
The max_delay parameter defines the upper bound value of call delay in
minutes. The replay timeout action is activated and issues an error when the delay
is over this value. The default value is 120.
The delay_factor parameter defines a factor for the call delays that are between
the values of min_delay and max_delay. The replay timeout action issues an
error when the current replay elapsed time is higher than the multiplication of the
capture elapsed time and this value. The default value is 8.
To retrieve the replay timeout action setting, use the GET_REPLAY_TIMEOUT
procedure:
DECLARE
enabled
BOOLEAN;
min_delay
NUMBER;
max_delay
NUMBER;
delay_factor
NUMBER;
BEGIN
DBMS_WORKLOAD_REPLAY.GET_REPLAY_TIMEOUT(enabled, min_delay, max_delay,
delay_factor);
END;
/
The GET_REPLAY_TIMEOUT procedure in this example returns the following
parameters:
■
■
■
■
The enabled parameter returns whether the replay timeout action is enabled or
disabled.
The min_delay parameter returns the lower bound value of call delay in
minutes.
The max_delay parameter returns the upper bound value of call delay in
minutes.
The delay_factor parameter returns the delay factor.
Starting a Workload Replay
Before starting a workload replay, you must first:
■
■
■
■
Preprocess the captured workload, as described in "Preprocessing a Database
Workload Using APIs" on page 10-4
Initialize the replay data, as described in "Initializing Replay Data" on page 11-19
Specify the replay options, as described in "Setting Workload Replay Options" on
page 11-20
Start the replay clients, as described in "Starting Replay Clients" on page 11-6
11-24 Oracle Database Real Application Testing User's Guide
Replaying a Database Workload Using APIs
Note: Once a workload replay is started, new replay clients will not
be able to connect to the database. Only replay clients that were
started before the START_REPLAY procedure is executed will be used
to replay the captured workload.
To start a workload replay, use the START_REPLAY procedure:
BEGIN
DBMS_WORKLOAD_REPLAY.START_REPLAY ();
END;
/
Pausing a Workload Replay
To pause a workload replay that is in progress, use the PAUSE_REPLAY procedure:
BEGIN
DBMS_WORKLOAD_REPLAY.PAUSE_REPLAY ();
END;
/
Pausing a workload replay will halt all subsequent user calls issued by the replay
clients until the workload replay is either resumed or cancelled. User calls that are
already in progress will be allowed to complete. This option enables you to
temporarily stop the replay to perform a change and observe its impact for the
remainder of the replay.
Resuming a Workload Replay
To resume a workload replay that is paused, use the RESUME_REPLAY procedure:
BEGIN
DBMS_WORKLOAD_REPLAY.RESUME_REPLAY ();
END;
/
Cancelling a Workload Replay
To cancel a workload replay, use the CANCEL_REPLAY procedure:
BEGIN
DBMS_WORKLOAD_REPLAY.CANCEL_REPLAY ();
END;
/
Exporting AWR Data for Workload Replay
Exporting AWR data enables detailed analysis of the workload. This data is also
required if you plan to run the AWR Compare Period report on a pair of workload
captures or replays.
To export AWR data, use the EXPORT_AWR procedure:
BEGIN
DBMS_WORKLOAD_REPLAY.EXPORT_AWR (replay_id => 1);
END;
Replaying a Database Workload 11-25
Monitoring Workload Replay Using APIs
/
In this example, the AWR snapshots that correspond to the workload replay with a
replay ID of 1 are exported, along with any SQL tuning set that may have been
captured during workload replay. The EXPORT_AWR procedure uses the replay_id
required parameter, which specifies the ID of the replay whose AWR snapshots will be
exported. This procedure will work only if the corresponding workload replay was
performed in the current database and the AWR snapshots that correspond to the
original replay time period are still available.
Monitoring Workload Replay Using APIs
This section describes how to monitor workload replay using APIs and views. You can
also use Oracle Enterprise Manager to monitor workload replay, as described in
"Monitoring Workload Replay Using Enterprise Manager" on page 11-13.
This section contains the following topics:
■
Retrieving Information About Diverged Calls
■
Monitoring Workload Replay Using Views
Retrieving Information About Diverged Calls
During replay, any error and data discrepancies between the replay system and the
capture system are recorded as diverged calls.
To retrieve information about a diverged call—including its SQL identifier, SQL text,
and bind values—call the GET_DIVERGING_STATEMENT function using the following
parameters:
■
Set the replay_id parameter to the ID of the replay in which the call diverged
■
Set the stream_id parameter to the stream ID of the diverged call
■
Set the call_counter parameter to the call counter of the diverged call
To view these information about a diverged call, use the DBA_WORKLOAD_REPLAY_
DIVERGENCE view. The following example illustrates a function call:
EXEC DBMS_WORKLOAD_REPLAY.GET_DIVERGENT_STATEMENT(replay_id => 1, stream_id => 3, call_counter => 5);
See Also:
■
Oracle Database PL/SQL Packages and Types Reference for
information about the DBMS_WORKLOAD_REPLAY package
Monitoring Workload Replay Using Views
This section summarizes the views that you can display to monitor workload replay.
You need DBA privileges to access these views.
■
■
The DBA_WORKLOAD_CAPTURES view lists all the workload captures that have
been captured in the current database.
The DBA_WORKLOAD_FILTERS view lists all workload filters for workload
captures defined in the current database.
11-26 Oracle Database Real Application Testing User's Guide
Monitoring Workload Replay Using APIs
■
■
■
■
■
The DBA_WORKLOAD_REPLAYS view lists all the workload replays that have been
replayed in the current database.
The DBA_WORKLOAD_REPLAY_DIVERGENCE view enables you to view
information about diverged calls, such as the replay identifier, stream identifier,
and call counter.
The DBA_WORKLOAD_REPLAY_FILTER_SET view lists all workload filters for
workload replays defined in the current database.
The DBA_WORKLOAD_CONNECTION_MAP view lists the connection mapping
information for workload replay.
The V$WORKLOAD_REPLAY_THREAD view lists information about all sessions
from the replay clients.
See Also:
■
Oracle Database Reference for information about these views
Replaying a Database Workload 11-27
Monitoring Workload Replay Using APIs
11-28 Oracle Database Real Application Testing User's Guide
12
12
Analyzing Replayed Workload
There are three types of reports for Database Replay: workload capture, workload
replay, and compare period.
This chapter describes how to generate and analyze these reports and contains the
following sections:
■
Using Workload Capture Reports
■
Using Workload Replay Reports
■
Using Compare Period Reports
After the replay analysis is complete, you can restore the
database to its original state at the time of workload capture and
repeat workload replay to test other changes to the system once the
workload directory object is backed up to another physical location.
Note:
Using Workload Capture Reports
Workload capture reports contain captured workload statistics, information about the
top session activities that were captured, and any workload filters used during the
capture process.
The following sections describe how to generate and utilize workload capture reports:
■
Generating Workload Capture Reports Using Enterprise Manager
■
Generating Workload Capture Reports Using APIs
■
Reviewing Workload Capture Reports
Generating Workload Capture Reports Using Enterprise Manager
This section describes how to generate a workload capture report using Oracle
Enterprise Manager.
The primary tool for generating workload capture reports is Oracle Enterprise
Manager. If for some reason Oracle Enterprise Manager is unavailable, you can
generate workload capture reports using APIs, as described in "Generating Workload
Capture Reports Using APIs" on page 12-2.
To generate a workload capture report using Enterprise Manager:
1. On the Software and Support page, under Real Application Testing, click
Database Replay.
Analyzing Replayed Workload 12-1
Using Workload Capture Reports
The Database Replay page appears.
2.
Click View Workload Capture History.
The View Workload Capture History page appears.
3.
Select the workload capture for which you want to run a workload capture report
and click View.
The View Workload Capture page appears.
4.
To view the workload capture report, click View Workload Capture Report.
The Report window opens while the report is being generated.
5.
Once the report is generated, you can save the report by clicking Save to File.
For information about how to interpret the workload capture report, see
"Reviewing Workload Capture Reports" on page 12-3.
Generating Workload Capture Reports Using APIs
This section describes how to generate a workload capture report using the DBMS_
WORKLOAD_CAPTURE package. You can also use Oracle Enterprise Manager to
generate a workload capture report, as described in "Generating Workload Capture
Reports Using Enterprise Manager" on page 12-1.
To generate a report on the latest workload capture, use the DBMS_WORKLOAD_
CAPTURE.GET_CAPTURE_INFO procedure and the DBMS_WORKLOAD_
CAPTURE.REPORT function:
DECLARE
cap_id
NUMBER;
cap_rpt
CLOB;
BEGIN
cap_id := DBMS_WORKLOAD_CAPTURE.GET_CAPTURE_INFO(dir => 'dec06');
cap_rpt := DBMS_WORKLOAD_CAPTURE.REPORT(capture_id => cap_id,
format => DBMS_WORKLOAD_CAPTURE.TYPE_TEXT);
END;
/
In this example, the GET_CAPTURE_INFO procedure retrieves all information
regarding the workload capture in the dec06 directory and returns the appropriate
cap_id for the workload capture. The REPORT function generates a text report using
the cap_id that was returned by the GET_CAPTURE_INFO procedure.
The GET_CAPTURE_INFO procedure uses the dir required parameter, which specifies
the name of the workload capture directory object.
The REPORT function uses the following parameters:
■
■
The capture_id required parameter relates to the directory that contains the
workload capture for which the report will be generated. The directory should be
a valid directory in the host system containing the workload capture. The value of
this parameter should match the cap_id returned by the GET_CAPTURE_INFO
procedure.
The format parameter required parameter specifies the report format. Valid
values include DBMS_WORKLOAD_CAPTURE.TYPE_TEXT and DBMS_
WORKLOAD_REPLAY.TYPE_HTML.
For information about how to interpret the workload capture report, see "Reviewing
Workload Capture Reports" on page 12-3.
12-2 Oracle Database Real Application Testing User's Guide
Using Workload Replay Reports
See Also:
■
Oracle Database PL/SQL Packages and Types Reference for
information about the DBMS_WORKLOAD_CAPTURE package
Reviewing Workload Capture Reports
The workload capture report contains various types of information that can be used to
assess the validity of the workload capture. Using the information provided in this
report, you can determine if the captured workload:
■
Represents the actual workload you want to replay
■
Does not contain any workload you want to exclude
■
Can be replayed
The information contained in the workload capture report are divided into the
following categories:
■
■
Details about the workload capture (such as the name of the workload capture,
defined filters, date, time, and SCN of capture)
Overall statistics about the workload capture (such as the total DB time captured,
and the number of logins and transactions captured) and the corresponding
percentages with respect to total system activity
■
Profile of the captured workload
■
Profile of the workload that was not captured due to version limitations
■
Profile of the uncaptured workload that were excluded using defined filters
■
Profile of the uncaptured workload that consists of background process or
scheduled jobs
Using Workload Replay Reports
Workload replay reports contain information that can be used to measure performance
differences between the capture system and the replay system.
The following sections describe how to generate and review workload replay reports:
■
Generating Workload Replay Reports Using Enterprise Manager
■
Generating Workload Replay Reports Using APIs
■
Reviewing Workload Replay Reports
Generating Workload Replay Reports Using Enterprise Manager
This section describes how to generate a workload replay report using Oracle
Enterprise Manager.
The primary tool for generating workload replay reports is Oracle Enterprise
Manager. If for some reason Oracle Enterprise Manager is unavailable, you can
generate workload replay reports using APIs, as described in "Generating Workload
Replay Reports Using APIs" on page 12-4
To generate a workload replay report using Enterprise Manager:
On the Software and Support page, under Real Application Testing, click
Database Replay.
1.
Analyzing Replayed Workload 12-3
Using Workload Replay Reports
The Database Replay page appears.
2.
In the Go to Task column, click the icon that corresponds to the Replay Workload
task.
The Replay Workload page appears.
3.
In the Directory Object list, select a directory that contains the preprocessed
workload that was used for the replay for which you want to generate a workload
replay report.
After a directory is selected, the Replay Workload page will be refreshed to
display the Capture Summary and the Replay History sections.
4.
Under Replay History, select the replay for which you want to generate a
workload replay report and click View.
The View Workload Replay page appears.
5.
Click View Workload Replay Report.
For information about how to interpret the workload replay report, see
"Reviewing Workload Replay Reports" on page 12-5.
Generating Workload Replay Reports Using APIs
This section describes how to generate a workload replay report using the DBMS_
WORKLOAD_REPLAY package. You can also use Oracle Enterprise Manager to generate
a workload replay report, as described in "Generating Workload Replay Reports Using
Enterprise Manager" on page 12-3.
To generate a report on the latest workload replay for a workload capture, use the
DBMS_WORKLOAD_REPLAY.GET_REPLAY_INFO procedure and the DBMS_WORKLOAD_
REPLAY.REPORT function:
DECLARE
cap_id
NUMBER;
rep_id
NUMBER;
rep_rpt
CLOB;
BEGIN
cap_id := DBMS_WORKLOAD_REPLAY.GET_REPLAY_INFO(dir => 'dec06');
/* Get the latest replay for that capture */
SELECT max(id)
INTO
rep_id
FROM
dba_workload_replays
WHERE capture_id = cap_id;
rep_rpt := DBMS_WORKLOAD_REPLAY.REPORT(replay_id => rep_id,
format => DBMS_WORKLOAD_REPLAY.TYPE_TEXT);
END;
/
In this example, the GET_REPLAY_INFO procedure retrieves all information regarding
the workload capture in the dec06 directory and the history of all the workload
12-4 Oracle Database Real Application Testing User's Guide
Using Workload Replay Reports
replay attempts from this directory. The procedure first imports a row into DBA_
WORKLOAD_CAPTURES, which contains information about the workload capture. It
then imports a row for every replay attempt retrieved from the replay directory into
the DBA_WORKLOAD_REPLAYS view. The SELECT statement returns the appropriate
rep_id for the latest replay of the workload. The REPORT function generates a text
report using the rep_id that was returned by the SELECT statement.
The GET_CAPTURE_INFO procedure uses the dir required parameter, which specifies
the name of the workload replay directory object.
The REPORT function uses the following parameters:
■
■
The replay_id required parameter relates to the directory that contains the
workload replay for which the report will be generated. The directory should be a
valid directory in the host system containing the workload replay. The value of
this parameter should match the rep_id returned by the GET_CAPTURE_INFO
procedure.
The format parameter required parameter specifies the report format. Valid
values include DBMS_WORKLOAD_REPLAY.TYPE_TEXT, DBMS_
WORKLOAD_REPLAY.TYPE_HTML, and DBMS_WORKLOAD_REPLAY.TYPE_
XML.
For information about how to interpret the workload replay report, see "Reviewing
Workload Replay Reports" on page 12-5.
See Also:
■
Oracle Database PL/SQL Packages and Types Reference for
information about the DBMS_WORKLOAD_REPLAY package
Reviewing Workload Replay Reports
After the workload is replayed on a test system, there may be some divergence in
what is replayed compared to what was captured. There are numerous factors that can
cause replay divergence, which can be analyzed using the workload replay report. The
information contained in the workload replay report consists of performance and
replay divergence.
Performance divergence may result when new algorithms are introduced in the replay
system that affect the overall performance of the database. For example, if the
workload is replayed on a newer version of Oracle Database, a new algorithm may
cause specific requests to run faster, and the divergence will appear as a faster
execution. In this case, this is a desirable divergence.
Data divergence occurs when the results of DML or SQL queries do not match results
that were originally captured in the workload. For example, a SQL statement may
return fewer rows during replay than those returned during capture.
Error divergence occurs when a replayed database call:
■
Encounters a new error that was not captured
■
Does not encounter an error that was captured
■
Encounters a different error from what was captured
The information contained in the workload replay report are divided into the
following categories:
■
Details about the workload replay and the workload capture, such as job name,
status, database information, duration and time of each process, and the directory
object and path
Analyzing Replayed Workload 12-5
Using Compare Period Reports
■
■
Replay options selected for the workload replay and the number of replay clients
that were started
Overall statistics about the workload replay and the workload capture (such as the
total DB time captured and replayed, and the number of logins and transactions
captured and replay) and the corresponding percentages with respect to total
system activity
■
Profile of the replayed workload
■
Replay divergence
■
Error divergence
■
DML and SQL query data divergence
Using Compare Period Reports
Compare period reports enable you to compare one workload replay to its capture or
to another replay of the same capture.
The following sections describe how to generate and review the various types of
compare period reports:
■
Generating Compare Period Reports Using Enterprise Manager
■
Generating Compare Period Reports Using APIs
■
Reviewing Replay Compare Period Reports
Generating Compare Period Reports Using Enterprise Manager
This section describes how to generate compare period reports using Oracle Enterprise
Manager.
The primary tool for generating compare period reports is Oracle Enterprise Manager.
If for some reason Oracle Enterprise Manager is unavailable, you can generate
compare period reports using APIs, as described in "Generating Compare Period
Reports Using APIs" on page 12-7.
To generate compare period reports using Enterprise Manager:
1. On the Software and Support page, under Real Application Testing, click
Database Replay.
The Database Replay page appears.
2.
In the Go to Task column, click the icon that corresponds to the Replay Workload
task.
The Replay Workload page appears.
3.
In the Directory Object list, select the directory that contains the replayed
workload for which you want to generate a compare period report.
After the directory is selected, the Replay Workload page will be refreshed to
display the Capture Summary and the Replay History sections.
4.
The Replay History section displays previous replays of the workload capture.
Select the replay for which you want to generate a compare period report and click
View.
The View Workload Replay page appears.
5.
Click the Report tab.
12-6 Oracle Database Real Application Testing User's Guide
Using Compare Period Reports
6.
Under Compare Period Report, select the first and second workload captures or
replays you want to compare.
7.
To generate a:
■
Replay Compare Period report, click Run Replay Compare Period Report.
Use the replay compare period report to perform a high-level comparison of
one workload replay to its capture or to another replay of the same capture.
Only workload replays that contain at least 5 minutes of database time can be
compared using this report.
For information about how to interpret the replay compare period report, see
"Reviewing Replay Compare Period Reports" on page 12-9.
■
AWR Compare Period report, click Run AWR Compare Period Report.
Use the AWR compare period report to compare the AWR data from one
workload replay to its capture or to another replay of the same capture.
For information about how to interpret AWR compare period reports, see
Oracle Database 2 Day + Performance Tuning Guide.
■
SQL Performance Analyzer report, click Run SQL Performance Analyzer
Report.
If this is the first time you are generating a SQL Performance Analyzer report
for the selected workload capture and workload replay, then click Yes to
submit a new scheduler job.
The SQL Performance Analyzer report can be used to compare a SQL tuning
set from a workload capture to another SQL tuning set from a workload
replay, or two SQL tuning sets from two workload replays. Comparing SQL
tuning sets with Database Replay provides more information than SQL
Performance Analyzer test-execute because it considers and shows all
execution plans for each SQL statement, while SQL Performance Analyzer
test-execute generates only one execution plan per SQL statement for each
SQL trial.
For information about how to interpret the SQL Performance Analyzer report,
see "Reviewing the SQL Performance Analyzer Report Using Oracle
Enterprise Manager" on page 6-3.
The Report window opens while the report is being generated. Once the report is
generated, you can save the report by clicking Save to File.
Generating Compare Period Reports Using APIs
This section describes how to generate compare period reports using the DBMS_
WORKLOAD_REPLAY package. You can also use Oracle Enterprise Manager to generate
compare period reports, as described in "Generating Compare Period Reports Using
Enterprise Manager" on page 12-6.
This section contains the following topics:
■
Generating Replay Compare Period Reports Using APIs
Analyzing Replayed Workload 12-7
Using Compare Period Reports
■
Generating SQL Performance Analyzer Reports Using APIs
Generating Replay Compare Period Reports Using APIs
This section describes how to generate a replay compare period report using the
DBMS_WORKLOAD_REPLAY package.
Use the replay compare period report to perform a high-level comparison of one
workload replay to its capture or to another replay of the same capture. Only
workload replays that contain at least 5 minutes of database time can be compared
using this report.
To generate a replay compare period report, use the DBMS_WORKLOAD_
REPLAY.COMPARE_PERIOD_REPORT procedure:
BEGIN
DBMS_WORKLOAD_REPLAY.COMPARE_PERIOD_REPORT (
replay_id1 => 12,
replay_id2 => 17,
format => ’DBMS_WORKLOAD_CAPTURE.TYPE_HTML’,
result => :report_bind);
END;
/
In this example, the COMPARE_PERIOD_REPORT procedure generates a replay
compare period report in HTML format that compares a workload replay with a
replay ID of 12 with another replay with an ID of 17.
The COMPARE_PERIOD_REPORT procedure in this example uses the following
parameters:
■
■
■
■
The replay_id1 parameter specifies the numerical identifier of the workload
replay after change for which the reported will be generated. This parameter is
required.
The replay_id2 parameter specifies the numerical identifier of the workload
replay before change for which the reported will be generated. If unspecified, the
comparison will be performed with the workload capture.
The format parameter specifies the report format. Valid values include DBMS_
WORKLOAD_CAPTURE.TYPE_HTML for HTML and DBMS_WORKLOAD_
CAPTURE.TYPE_XML for XML. This parameter is required.
The result parameter specifies the output of the report.
For information about how to interpret the replay compare period report, see
"Reviewing Replay Compare Period Reports" on page 12-9.
See Also:
■
Oracle Database PL/SQL Packages and Types Reference for
information about the DBMS_WORKLOAD_REPLAY package
Generating SQL Performance Analyzer Reports Using APIs
This section describes how to generate a SQL Performance Analyzer report using the
DBMS_WORKLOAD_REPLAY package.
The SQL Performance Analyzer report can be used to compare a SQL tuning set from
a workload capture to another SQL tuning set from a workload replay, or two SQL
tuning sets from two workload replays. Comparing SQL tuning sets with Database
Replay provides more information than SQL Performance Analyzer test-execute
because it considers and shows all execution plans for each SQL statement, while SQL
12-8 Oracle Database Real Application Testing User's Guide
Using Compare Period Reports
Performance Analyzer test-execute generates only one execution plan per SQL
statement for each SQL trial.
To generate a replay compare period report, use the DBMS_WORKLOAD_
REPLAY.COMPARE_SQLSET_REPORT procedure:
BEGIN
DBMS_WORKLOAD_REPLAY.COMPARE_SQLSET_REPORT (
replay_id1 => 12,
format => ’DBMS_WORKLOAD_CAPTURE.TYPE_HTML’,
result => :report_bind);
END;
/
In this example, the COMPARE_SQLSET_REPORT procedure generates a SQL
Performance Analyzer report in HTML format that compares a SQL tuning set
captured during the workload replay with a replay ID of 12 to a SQL tuning set
captured during workload capture.
The COMPARE_SQLSET_REPORT procedure in this example uses the following
parameters:
■
■
■
■
The replay_id1 parameter specifies the numerical identifier of the workload
replay after change for which the reported will be generated. This parameter is
required.
The replay_id2 parameter specifies the numerical identifier of the workload
replay after change for which the reported will be generated. If unspecified, the
comparison will be performed with the workload capture.
The format parameter specifies the report format. Valid values include DBMS_
WORKLOAD_CAPTURE.TYPE_HTML for HTML, DBMS_WORKLOAD_CAPTURE.TYPE_
XML for XML, and DBMS_WORKLOAD_CAPTURE.TYPE_TEXT for text. This
parameter is required.
The result parameter specifies the output of the report.
For information about how to interpret the SQL Performance Analyzer report, see
"Reviewing the SQL Performance Analyzer Report Using APIs" on page 6-12.
See Also:
■
Oracle Database PL/SQL Packages and Types Reference for
information about the DBMS_WORKLOAD_REPLAY package
Reviewing Replay Compare Period Reports
You can use replay compare period reports to perform a high-level comparison of one
workload replay to its capture or to another replay of the same capture. The replay
compare period report contains a summary of the most important changes between
the two runs. By reviewing this report, you can determine if any replay divergence
occurred and whether there were any significant performance changes. You can then
use this information to determine the appropriate action to take, such as reviewing
Automatic Database Diagnostic Monitor (ADDM) reports to diagnose a new
concurrency issue, or running SQL Tuning Advisor to fix a new SQL performance
problem.
The replay compare period report uses the following structure:
■
General Information
Analyzing Replayed Workload 12-9
Using Compare Period Reports
This section contains metadata about the two runs being compared in the report.
Any init.ora parameter changes between the two runs are also shown here.
■
Replay Divergence
This section contains the divergence analysis of the second run relative to the first.
■
Main Performance Statistics
This section contains a high-level performance statistic comparison across the two
runs (such as change in database time).
■
Top SQL by Change in DB Time
This section compares the performance change of top SQL statements (ordered by
total changed in database time) from one run to the next.
■
Hardware Usage Comparison
This section compares the hardware resource usage across the two runs.
■
ADDM Comparison
This section contains an ADDM report comparison across the two runs.
12-10 Oracle Database Real Application Testing User's Guide
Index
D
Database Replay
about, 1-2
methodology, 8-1
replay clients
about, 8-3, 11-5
calibrating, 11-5
starting, 11-5, 11-6
replay filter set
about, 11-4
reporting, 8-3, 12-1
compare period reports, 12-6, 12-7
usage, 1-2, 8-1
workflow, 8-1
workload capture
about, 9-1
capture directory, 9-3
capture files, 8-2
capturing, 8-2, 9-5, 9-13, 9-14
exporting data, 9-16
managing, 9-12
monitoring, 9-10, 9-16
options, 9-2
prerequisites, 9-1
reporting, 12-1
restarting the database, 9-2
restrictions, 9-3
stopping, 9-11, 9-15
workload filters
about, 9-3, 11-4
defining, 9-14
exclusion filters, 9-3, 11-4
inclusion filters, 9-3, 11-4
workload preprocessing
about, 8-3, 10-1
preprocessing, 10-1, 10-4
workload replay
about, 8-3, 11-1
cancelling, 11-25
exporting data, 11-25
filters, 11-21
monitoring, 11-13, 11-26
options, 11-3, 11-20
pausing, 11-25
replaying, 11-8, 11-18
reporting, 12-3
resuming, 11-25
starting, 11-24
steps, 11-2
database upgrades
testing, 7-1
database version
production system, 7-2, 7-10
system running SQL Performance Analyzer, 7-2,
7-10
test system, 7-2, 7-10
DBMS_SPM package
LOAD_PLANS_FROM_SQLSET function, 6-26
DBMS_SQLPA package
CREATE_ANALYSIS_TASK function, 3-13
EXECUTE_ANALYSIS_TASK procedure, 4-4,
5-3, 6-10, 7-9, 7-14
REPORT_ANALYSIS_TASK function, 6-11
SET_ANALYSIS_TASK_PARAMETER
procedure, 3-14
DBMS_SQLTUNE package
CREATE_TUNING_TASK function, 6-23
SELECT_SQL_TRACE function, 7-5
DBMS_WORKLOAD_CAPTURE package
ADD_FILTER procedure, 9-14
DELETE_FILTER procedure, 9-14
EXPORT_AWR procedure, 9-16
FINISH_CAPTURE procedure, 9-15
GET_CAPTURE_INFO procedure, 12-2
REPORT function, 12-2
START_CAPTURE procedure, 9-15
DBMS_WORKLOAD_REPLAY package
ADD_FILTER procedure, 11-21
CANCEL_REPLAY procedure, 11-25
COMPARE_PERIOD_REPORT procedure, 12-8
COMPARE_SQLSET_REPORT procedure, 12-9
CREATE_FILTER_SET procedure, 11-22
DELETE_FILTER procedure, 11-22
EXPORT_AWR procedure, 11-25
GET_DIVERGING_STATEMENT function, 11-26
GET_REPLAY_INFO procedure, 12-4
INITIALIZE_REPLAY procedure, 11-19
PAUSE_REPLAY procedure, 11-25
PREPARE_REPLAY procedure, 11-20
PROCESS_CAPTURE procedure, 10-4
REMAP_CONNECTION procedure, 11-19
Index-1
REPORT function, 12-4
RESUME_REPLAY procedure, 11-25
SET_REPLAY_TIMEOUT procedure, 11-23
START_REPLAY procedure, 11-25
USE_FILTER_SET procedure, 11-23
M
mapping table
about, 7-4
creating, 7-3, 7-4
moving, 7-3, 7-4
R
Real Application Testing
about, 1-1
components, 1-1
S
SQL Performance Analyzer
about, 1-1
comparing performance, 6-10, 7-3, 7-11
creating a task, 3-1, 3-13
executing the SQL workload, 4-2, 4-4
executing the SQL workload after a change, 5-2,
5-3
initial environment
establishing, 4-1
input source, 7-1
making a change, 5-1
methodology, 2-1
monitoring, 6-26
performance data
collecting post-change version, 5-1
collecting pre-change version, 4-1
comparing, 6-1
remote test execution, 7-6, 7-11
reporting, 2-7
setting up the test system, 2-4
SQL Performance Analyzer report
active reports, 6-7
general information, 6-5, 6-12
global statistics, 6-5
global statistics details, 6-7
result details, 6-15
result summary, 6-13
reviewing, 6-3, 6-12
SQL tuning set
selecting, 2-5, 3-1
SQL workload
capturing, 2-3
executing, 2-5, 2-7
transporting, 2-4
system change
making, 5-1
task
creating, 7-3, 7-10
usage, 1-1
using, 2-1
Index-2
workflow, 2-1
Exadata simulation, 3-9
guided, 3-12
optimizer statistics, 3-6
parameter change, 3-3
SQL plan baselines
creating, 6-26
SQL statements
regressed, 1-1, 2-8, 6-8, 6-22, 6-24, 7-3, 7-11, 7-15
SQL Trace
about, 7-3
enabling, 7-2, 7-3
trace level, 7-4
SQL trace files
about, 7-3
moving, 7-3, 7-4
SQL trials
about, 2-5, 2-6
building
post-upgrade version, 7-3, 7-6, 7-11
pre-upgrade version, 7-3, 7-9, 7-11, 7-14
comparing, 6-2
SQL tuning set
about, 2-3
building, 7-4
comparing, 6-17
constructing, 7-3
converting, 7-3, 7-9
U
upgrade environment, 7-2, 7-10
W
Workload Analyzer
about, 10-5
running, 10-5