1
ACRES 3 User Guide
Konstantinos Kovas
Department of Computer Engineering and Informatics
University of Patras
{[email protected]}
Version 3.0.2
03/3/2013
ACRES (Automatic Creator of Expert Systems) is a tool initially developed as way to test and
compare different methods of combining Certainty Factors in expert systems. In its second version, we
extended the architecture to apply for the problem of multiclass classification, but the overall
architecture remained simple, focusing on the goal of comparing certainty factor combination methods.
The third version is our attempt towards a more generalized tool for generating expert systems.
More specifically an extension of the system made it possible to generate classification rules for
additional variables (apart from the output variable), for which the final user of the expert system
cannot provide values. This gives the ability to design more complex rule hierarchies, which are
represented in an easy-to-interpret tree structure. Feature ranking and subset selection techniques help
achieve the generation task in a more automatic and efficient way. Other enhancements include the
ability to produce expert systems that dynamically update the certainty factors in their rules, the
generation of rules and functions for interaction with the end-user and a graphical interface for the
produced expert system.
1
1.
a.
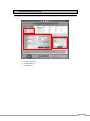
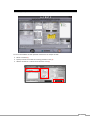
CREATE EXPERT SYSTEM
Dataset & Variables Settings
1
3
2
Dataset Import (1)
Dataset Edit (2)
Variables (3)
2
Dataset Import
Dataset Name: Specify a name for the expert system that will be created.
Variables File: A file containing a name for each variable in the dataset.
1_class
2_age
3_menopause
4_tumor-size
5_inv-nodes
6_node-caps
7_deg-malig
8_breast
9_breast-quad
10_irradiat
example variables file
Dataset File: The dataset file containing known instances about a problem [comma delimited
format].
no-recurrence-events,50-59,ge40,15-19,0-2,yes,2,left,central,yes
no-recurrence-events,50-59,premeno,25-29,0-2,no,1,left,left_low,no
no-recurrence-events,60-69,ge40,25-29,0-2,no,3,right,left_low,no
recurrence-events,50-59,premeno,15-19,0-2,no,2,left,left_low,no
recurrence-events,40-49,premeno,40-44,0-2,no,1,left,left_low,no
recurrence-events,50-59,ge40,35-39,0-2,no,2,left,left_low,no
recurrence-events,50-59,premeno,25-29,0-2,no,2,left,right_up,no
recurrence-events,30-39,premeno,0-4,0-2,no,2,right,central,no
recurrence-events,50-59,premeno,25-29,0-2,no,2,left,right_up,no
…
example dataset file
3
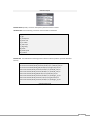
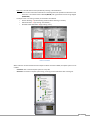
Dataset Edit (Optional)
After importing the variables and dataset files the dataset is imported as a grid. The user can manually
edit the values in the grid.
Εικόνα 1: Dataset as a grid
Additionally the user can perform the following operations:
Delete Variable: Specify a variable and the corresponding column will be deleted.
Merge Variables: Specify two variables. The corresponding cells will be merged. The values will
be separated with '_'
Merge Classes: Specify a variable and two of its classes. Then press 'Merge' to merge these
classes as a new one with the name specified.
Descretize Variable: Choose a variable with real values. Specify the number of classes and a
discretization method.
The Reset button will undo all changes made and reload the dataset you initially imported.
The Save Changes button will save all modifications as a new dataset file. You must manually edit the
variables file if necessary. Then import both files again to continue with the expert system creation.
4
Variables
The user must specify an output/prediction variable. This is the variable for which the expert system
will provide predictions.
Optional: You can also specify one or more Intermediate Variables: Values for these variables will not
be given directly by the end user. Rules will be created for predicting them.
The Continue button loads the Expert System Creation frame.
5
b.
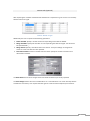
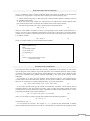
Expert System Creation
For each intermediate variable specified and then for the output variable:
Select a variable (1).
Specify a subset of variables for creating prediction rules (2)
Add the variable as a node to the architecture Tree (3)
1
2
3
Εικόνα 2: Main Loop
6
-
-
Optional: A second subset can be specified by checking “Two Predictions”
o There are two alternative methods for combining these two predictions about the same
conclusion: The method used in MYCIN (MYCIN) and a generalized version using weights
(WEIGHTED).
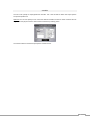
To help the user in choosing a subset, three facilities are offered:
o Feature Ranking -5 (Automatically produced when selecting a variable)
o Subset Selection -4 (by clicking “Find Subset”)
o Selected Subset Evaluation -6 (by clicking “Test”)
4
6
5
Εικόνα 3: Facilities
When nodes for all intermediate and the output variables have been added, the expert system can be
created.
“Create ES” will create the expert system as a clips file
“Evaluate” will create an expert system using a training set and evaluate it with a testing set.
7
Rule Generation and CF estimation
Given a variable for which we want predictions made and a subset of variables to be used for the
prediction, we can generate a set of rules from a training set with the following steps:
1. Cluster instances in groups, so that each group contains instances that have identical values in
the variables of the subset
2. From each such group produce one rule that has as conditions the common attribute-value
pairs of the instances and as conclusion the possible classes of the output variable
3. Associate each possible class i with a certainty factor using the formula:
CFi = ni / N
(1)
Where ni is the number of instances of class i in the group and N the number of all instances in it.
That is, a CF for a class is defined as the frequency of the class in the group. It is obvious that the
certainty factor would be a value between 0 and 1. We can easily convert this value in the interval [1,1] with the formula:
CF = 2*CF - 1
(2)
We give a simple example of a rule created with this method:
(defrule group_1_class_16
(declare (salience 70))
(data
(3_menopause ge40)
(5_inv-nodes 3-5)
(7_deg-malig 3)
)
=>
(assert (1_class (no-recurrence -0.64)
(recurrence 0.64)))
)
A simple example of a generated rule
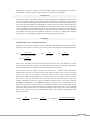
Certainty Factor Combination
If we repeat the above procedure more than one time, for different set of variables, we can create a
rule set that given a new instance can provide more than one conclusions about the output variable.
According to the model of certainty factors used in MYCIN, two certainty factors about the same
fact can be combined using suitable formulas depending on the signs of the certainty factors
combined.
For example, if we have two rules with the same conclusion and CF1, CF2 respectively the
certainty factors associated with them, and they are both positive numbers, the combined certainty
factor CF for conclusion, according to MYCIN theory, is given by the formula:
CF = CF1 + CF2 (1-CF1) = CF1 + CF2 – CF1 * CF2
(3)
In the expert system PASS [4], the remark was made that in formula 3 both certainty factors
contribute equally to the final result. In practice, rules are often not equally reliable since their
certainty factors are either bound to an expert’s judgment or based on data containing noise, so they
proposed a generalized version of the formula (1):
CF = w1 * CF1 + w2 * CF2 + w * CF1 CF2
(4)
where w1, w2 and w are numeric weights that should satisfy the following equation:
w1 + w2 + w = 1
(5)
to assure that 0 ≤ CF ≤ 1.
To use formula (2) however, the weights w1, w2, w should be first determined. In PASS,
statistical data about the problem were used, as a training data set to determine the weights by hand.
8
In ACRES we offer both combination methods when multiple rule sets are specified for the
output variable. The system produces the necessary weights for the generalized formula
automatically, utilizing a genetic algorithm to search the space of possible weight combinations for
an optimum one.
CF Models
The system offers two alternative methods for estimating Certainty Factors. Consider an output
variable C associated with n possible classes Ci..n and a dataset N containing |N| instances.
Evidence E is a certain pattern of values for a set of variables of the dataset and D is the set of
instances in the dataset that this pattern occurs. We represent the absolute frequency of class Ci in
D as f(Ci,D) and the absolute frequency of class Ci in N as f(Ci,N).
P(H|E):
Our initial approach used in previous versions relied solely on the probability found from the
frequency of a class in D. For a class Ci the certainty factor is estimated using the conditional
probability that an instance is classified in class Ci , given that evidence E is true.
Obviously the above value would be between 0 and 1, so we use the following formula to
produce a value in the interval [-1 , 1].
MYCIN CFs:
An alternative method added in the new version combines the above probability with the a priori
probability found from the general frequency of class Ci in the entire dataset. This probability can
be easily computed following the formula:
Using the definition of certainty factors in the expert system MYCIN we can combine these two
probabilities to produce the measures of Belief MB (Ci, E) and Disbelief MD (Ci, E).
otherwise
otherwise
Finally we can estimate the Certainty Factor using these measures of Belief and Disbelief:
It is important to point out the underlying characteristic of this method which is that the certainty
factor produced is not a measure of our confidence in Ci, but rather a measure of the change of our
9
confidence in Ci, given the evidence E. This means that a positive value represents an increase of
our confidence, whereas a negative value represents a decrease of our confidence.
Dynamic CFs
Another new feature is the ability to generate expert systems that can update the Certainty Facts of
their rules when new instances of the problem become available. To accomplish this, the certainty
factors are not hard coded inside the generated rules, but are instead dynamically computed at run
time. The required frequencies for computing the certainty factor are saved in a separate file in the
form of CLIPS facts. Thus, for each prediction rule of the expert system, there is a corresponding
rule that updates the corresponding frequencies. The expert system consists of two files. The main
expert system that remains constant contains all the rules, functions and templates. The secondary
file contains facts that store the frequencies required in the rules for computing the certainty
factors which can change during runtime if the end user provides new instances.
Evaluation
Evaluation Metrics for Classification Problems
Evaluation of a classification model is usually based on the following metrics: accuracy, precision,
sensitivity and specificity, which for two classes (positive and negative) are defined as follows:
TP TN
TP FP FN TN ,
TN
spec
TN FP
acc
prec
TP
TP FP ,
sen
TP
TP FN
,
where, TP is the number of cases classified correctly as positive, FP is the number of cases that
were incorrectly classified as positive, TN is the number of cases correctly classified as not positive
and FN is the number of cases that are incorrectly classified as not positive.
In case of more than two classes, one can view each class as a separate binary classification
problem where positive are the cases of that class, whereas negative are the cases of all other
classes. This way one can produce a confusion matrix for each class. Unlike the binary
classification problem, with this approach a correctly classified case as negative does not necessary
mean that the case was classified to the correct class. For this reason the value of TN is not
credible, and therefore cannot be used for estimating evaluation metrics. The metrics used are
Precision (as defined above) and Recall (corresponds to Sensitivity). For a possible class A,
Precision is the fraction of instances that were classified to class A, that actually belong to that
class, while Recall is the fraction of instances that belong to class A that were correctly classified
to that class. Since TP+FN is the sum of all cases that truly belong to the positive class, the Recall
metric is also referred to as TP rate. Another useful metric is the F-measure combining the recall
and precision values.
recall
2 precision recall
TP
TP
F _ measure
precision
precision recall
TP FP ,
TP FN ,
10
Finally the weighted average of these metrics for all classes can be calculated, taking into account
the number of occurrences of each class in the dataset.
These metrics are widely used in classification performance evaluations and corresponding tools
like the data mining tool Weka so using them allows the direct comparison with various
classification models.
Evaluation Report in ACRES
The dataset is partitioned in two sets: training
and testing set. The expert system is generated
using the training set and then it is evaluated
on the data of the testing set. The procedure is
repeated for different partitions of the dataset
(cross validation) and the average values of
the metrics are presented.
The produced expert system does not simply
classify an instance to the predicted class. It
provides an uncertainty value for each
possible class. In order to make the evaluation
of a produced expert system
easier, we consider that the
system classifies an instance
to the class for which the
uncertainty factor is the
highest.
As described above, to
evaluate an expert system for
more than two classes, we
evaluate the performance for
each class separately. For each class i, we treat the problem as binary, with the first class being i
and the second class being a class consisting of all other classes. We then form a confusion matrix
and compute the metrics for each class i.
We are mostly interested in the Sensitivity and Precision metrics. We also combine these two
metrics producing their mean proportional, SQRT(p*r) as a more general metric and the FMeasure metric that we defined previously.
For a measure of the general classifying performance of the expert system we use the Predictive
Accuracy metric which shows the percentage of instances in the testing set that were correctly
classified to the class they belong.
11
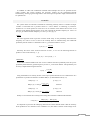
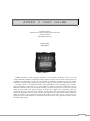
2.
EXPERT SYSTEM INTERFACE
Browse for an expert system file previously created by ACRES
Give a value for each input variable and assert the fact to get a prediction.
12