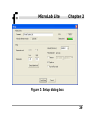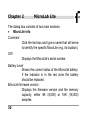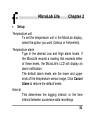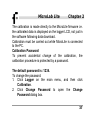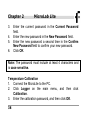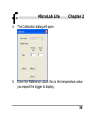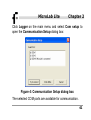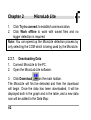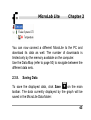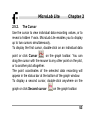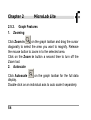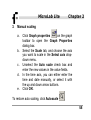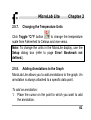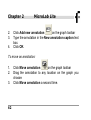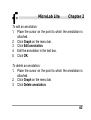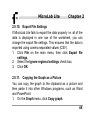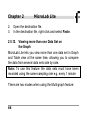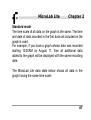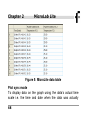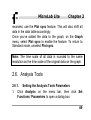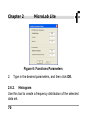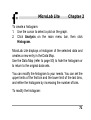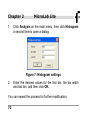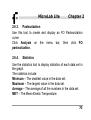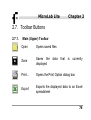
1
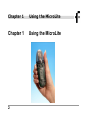
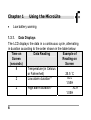
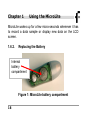
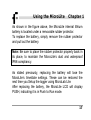
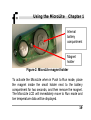
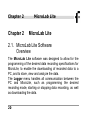
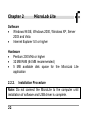
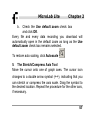
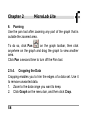
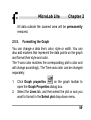
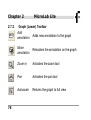
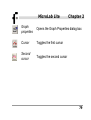
MicroLite &
MicroLab Lite User Guide
Second Edition
First Print
August 2007
© Fourier Systems Ltd.
Contents
Introduction ............................................................................. 1
Chapter 1 Using the MicroLite ................................................ 2
1.1.
Overview................................................................... 3
1.2.
Getting Started.......................................................... 4
1.3. Reading the MicroLite Display .................................. 5
1.3.1. Data Displays......................................................... 6
Current Temperature Reading ............................... 7
MicroLite Alarm ...................................................... 8
Minimum and Maximum Temperature Readings ..10
1.4.
MicroLite Working Modes ........................................10
Stop ..................................................................11
Run ..................................................................11
Cyclic Run ............................................................12
Timer Run.............................................................12
Push to Run..........................................................12
1.5.
USB Port Connection ..............................................13
MicroLite LCD Status when Connected to USB....13
1.6. The MicroLite Battery ..............................................14
1.6.1. Battery Level.........................................................15
1.6.2. Replacing the Battery ...........................................16
1.6.3. Using the MicroLite Magnet ................................. 18
Chapter 2 MicroLab Lite ....................................................... 20
2.1.
MicroLab Lite Software Overview ........................... 20
2.2. Software Installation ............................................... 21
2.2.1. System Requirements.......................................... 21
2.2.2. Installation Procedure .......................................... 22
2.3. Getting Started........................................................ 28
2.3.1. Setting up the MicroLite ....................................... 28
2.3.2. Completing the Setup .......................................... 34
2.3.3. Starting Data Recording....................................... 35
2.3.4. Stopping Data Recording..................................... 36
2.3.5. Temperature Sensor Calibration .......................... 36
2.3.6. Communication Setup ..........................................40
2.3.7. Downloading Data ................................................42
2.3.8. Saving Data ..........................................................43
2.4. MicroLab Lite Basics ...............................................45
2.4.1. Opening Files .......................................................45
2.4.2. Displaying Properties............................................46
2.4.3. Printing a Graph ...................................................47
2.4.4. Printing a Table ....................................................47
2.5. Viewing the Data .....................................................49
2.5.1. Display Options ....................................................49
Graph ..................................................................49
Table ..................................................................50
Data Map ..............................................................50
2.5.2. The Cursor ........................................................... 53
2.5.3. Graph Features.................................................... 54
2.5.4. Cropping the Data................................................ 58
2.5.5. Formatting the Graph........................................... 59
2.5.6. Displaying Alarm Levels....................................... 60
2.5.7. Changing the Temperature Units ......................... 61
2.5.8. Adding Annotations to the Graph ......................... 61
2.5.9. Exporting Data to Excel ....................................... 64
2.5.10. Export File Settings.............................................. 65
2.5.11. Copying the Graph as a Picture ........................... 65
2.5.12. Viewing more than one Data Set on the Graph ... 66
2.6. Analysis Tools......................................................... 69
2.6.1. Setting the Analysis Tools Parameters ................ 69
2.6.2. Histogram ............................................................ 70
2.6.3. Pasteurization.......................................................73
2.6.4. Statistics ...............................................................73
2.7. Toolbar Buttons .......................................................75
2.7.1. Main (Upper) Toolbar ...........................................75
2.7.2. Graph (Lower) Toolbar .........................................78
Specifications ........................................................................80
MicroLite............................................................................80
Software ............................................................................83
Appendix: Figures .................................................................86
Introduction
The MicroLite is a compact 16-bit USB data logger designed
for accurate temperature monitoring for a wide range of
applications. Due to its low cost, the MicroLite can be used
as a One Trip Logger, for monitoring temperature of
perishable goods during transportation, for example. Other
typical applications include warehousing of food, monitoring
of controlled environments i.e. in the pharmaceutical
industry, and many more.
Chapter 1 of this user guide details the operational
procedures for MicroLite as a standalone device.
Chapter 2 provides instruction on how to work with the
MicroLite software, MicroLab Lite.
Chapter 1
Using the MicroLite
Chapter 1
Using the MicroLite
2
Using the MicroLite
Chapter 1
1.1. Overview
The MicroLite can be used as a standalone device to monitor
temperature levels. The MicroLite LCD screen continuously
displays the current temperature recordings and the
maximum and minimum temperature readings. You can also
define minimum and maximum alarm levels for a specific
data logging session, and the LCD screen will also show any
alarm levels that may have been breached as well as the
duration of the alarm.
The data stored by MicroLite can be easily downloaded to
any computer for further viewing and analysis using the
MicroLab Lite software, and can also be exported to an Excel
spreadsheet.
3
Chapter 1
Using the MicroLite
1.2. Getting Started
The MicroLite data logger you have purchased is shipped in
a plastic box with a Quick Start Guide printed on the rear of
the box.
The box contains one MicroLite data logger and one small
magnet accessory (located in the placeholder on the
MicroLite packaging). Read more about the purpose of this
magnet in section 1.6.3 on page 18.
In order to save battery life, MicroLite is shipped in Stop
Mode. This means that before you can start recording, you
must first connect MicroLite to the PC and set it up with the
MicroLab Lite software (downloaded from the Fourier
Systems website – see section 2.2: Software Installation on
page 21).
4
Using the MicroLite
Chapter 1
To set up MicroLite with the MicroLab Lite software, refer to
section 2.3.1: Setting up the MicroLite on page 28. Once
MicroLite receives the Setup command, it begins logging the
temperature data immediately or waits for a predefined time
to start logging.
1.3. Reading the MicroLite Display
The MicroLite has a 3-digit (with one decimal place) 7segment LCD screen, which is able to display the following
information:
•
The temperature reading currently recorded
•
The lowest and highest temperature recorded to that
point
•
Low and/or high alarm level breach
•
Duration of low and/or high alarm level breach
5
Chapter 1
•
Using the MicroLite
Low battery warning
1.3.1. Data Displays
The LCD displays the data in a continuous cycle, alternating
in duration according to the order shown in the table below:
Time on
Data Reading
Example of
Screen
Reading on
(seconds)
Screen
8
Temperature (in Celsius
or Fahrenheit)
25.5 ˚C
AL-L
Low alarm duration *
2
1.55H
AL-H
High alarm duration *
2
1.05H
6
Using the MicroLite
Time on
Screen
(seconds)
2
Data Reading
Chapter 1
Example of
Reading on
Screen
MIN
Minimum temperature
23.2 ˚C
reading
MAX
2
Maximum temperature
30.1 ˚C
reading
Low battery warning *
2
BATT LO
* If relevant (only displayed in event of alarm/low battery)
Current Temperature Reading
This is the last temperature reading recorded by the
MicroLite. If the sampling interval is once per second, then
the reading will be updated for each of the four seconds it
7
Chapter 1
Using the MicroLite
displayed on the LCD. Therefore you will be looking at the
actual temperature recorded at that very moment.
MicroLite Alarm
MicroLite displays an alarm notification whenever any alarm
level is exceeded.
AL-L – The temperature reading is lower than its low alarm
level (as defined in the logger Setup).
AL-H – The temperature reading is higher than its high
alarm level (as defined in the logger Setup).
The alarm notification remains until the next time you
download data to a PC.
To learn how to set alarm levels, refer to page 28.
8
Using the MicroLite
Chapter 1
The alarm duration on the logger’s LCD is calculated in
hours. For example, the shortest possible duration of 0.01
hours means the logger has been in alarm for between 0 and
36 seconds.
A duration of 1.55 hours means the logger has been in alarm
for 93 minutes.
If the MicroLite is in a Low and High alarm simultaneously,
then it will show the duration for both alarms.
Note: When the MicroLite is in Cyclic mode, the Low or High
alarm level displayed represents the lowest or highest
readings recorded since the MicroLite starting logging data,
irrelevant of how many cycles the logger has recorded.
9
Chapter 1
Using the MicroLite
Minimum and Maximum Temperature
Readings
The logger display automatically scrolls through the Min/Max
temperature readings while sampling.
These readings are simply the minimum and maximum
temperature values recorded by the MicroLite up until that
point. If your logger has breached an alarm level, look at the
MIN and MAX readings to see the extent of the low or high
alarm level breach.
These readings are constantly updated.
1.4. MicroLite Working Modes
MicroLite is always set in one of five possible modes. These
modes are all activated via the MicroLab Lite software.
10
Using the MicroLite
Chapter 1
Stop
MicroLite is idle and is not recording.
When pressing Stop in the MicroLab Lite software, the
logger LCD immediately ceases to record data, instead
displaying STOP and scrolling through the alarm durations (if
alarms were previously recorded).
Run
MicroLite is recording data. It will stop recording
automatically when its memory has reached full capacity
(8,000 or 16,000 samples depending on the model).
11
Chapter 1
Using the MicroLite
Cyclic Run
Similar to Run mode, but MicroLite will continuously sample
data, recording over old data when the memory reaches its
capacity, beginning with the earliest data recording.
Timer Run
MicroLite can be configured to start recording at a
predetermined time. When MicroLite is set for such a run, its
status is set to Timer Run. The logger LCD displays tRUN.
Push to Run
MicroLite will only begin logging data when the user operates
the logger’s reed switch with the MicroLite magnet. The
logger LCD displays PUSH. See section 1.6.3 on page 18 for
more details.
12
Using the MicroLite
Chapter 1
1.5. USB Port Connection
The MicroLite interfaces with the computer via any of its USB
Host ports. In order to be detected by the computer and by
the MicroLab Lite software, the USB driver must first be
installed. USB driver installation is part of the software
installation (see section 2.2: Software Installation on page
21).
MicroLite LCD Status when Connected to USB
The USB connection status is always displayed on the
MicroLite LCD when connected or disconnected from a USB
port.
The LCD flashes USB ON once when connected and flashes
USB OFF once when disconnected from the USB port.
13
Chapter 1
Using the MicroLite
The logger LED (located adjacent to the logger’s USB
connector) also lights up green when connected to the USB
port.
If the MicroLite is in Run mode when connected to the USB
port, the LCD will only display the current temperature
reading and will not scroll through the other readings.
If the MicroLite is in Stop mode when connected to the USB
port, the LCD will display STOP. If the logger had recorded
an alarm during the previous data logging session, then the
LCD will also scroll through the alarm durations.
1.6. The MicroLite Battery
The MicroLite runs on a standard 3V CR2032 lithium battery.
14
Using the MicroLite
Chapter 1
The battery maintains the MicroLite’s Real-Time Clock
(RTC). The logger’s time/date settings are synchronized with
the PC when you perform a Setup. Removing the battery will
return the logger’s time/date settings to the default of 01 Jan
2004.
1.6.1. Battery Level
The MicroLite battery level indication is provided in the
MicroLab Lite software’s Setup dialog (see page 28).
The MicroLite battery’s maximum lifespan is approximately
two years. This long battery life is achieved by the MicroLite
putting itself to sleep between data recordings. While in
sleep mode, the data logger consumes a minimal amount of
power.
15
Chapter 1
Using the MicroLite
MicroLite wakes up for a few micro-seconds whenever it has
to record a data sample or display new data on the LCD
screen.
1.6.2.
Replacing the Battery
Internal
battery
compartment
Figure 1: MicroLite battery compartment
16
Using the MicroLite
Chapter 1
As shown in the figure above, the MicroLite internal lithium
battery is located under a removable rubber protector.
To replace the battery, simply remove the rubber protector
and pull out the battery.
Note: Be sure to place the rubber protector properly back in
its place, to maintain the MicroLite’s dust and waterproof
IP66 compliancy.
As stated previously, replacing the battery will lose the
MicroLite’s time/date settings. These can be restored the
next time you Setup the logger using MicroLab Lite.
After replacing the battery, the MicroLite LCD will display
PUSH, indicating it is in Push to Run mode.
17
Chapter 1
Using the MicroLite
Once you connect the logger to the PC’s USB port, you will
be able to run the logger without the need for the magnet.
In addition, you will still be able to download the data
previously recorded onto the MicroLite, before you removed
the battery. This data is not lost.
1.6.3.
Using the MicroLite Magnet
The MicroLite includes the magnet accessory (stored in the
magnet placeholder in the MicroLite packaging).
This magnet is used to activate the logger when in Push to
Run mode. There is a reed relay on the MicroLite’s circuit
board which is closed using the magnet, thereby activating
the logger.
18
Using the MicroLite
Chapter 1
Internal
battery
compartment
Magnet
holder
Figure 2: MicroLite magnet holder
To activate the MicroLite when in Push to Run mode, place
the magnet inside the small holder next to the battery
compartment for two seconds, and then remove the magnet.
The MicroLite LCD will immediately move to Run mode and
live temperature data will be displayed.
19
Chapter 2
Chapter 2
MicroLab Lite
MicroLab Lite
2.1. MicroLab Lite Software
Overview
The MicroLab Lite software was designed to allow for the
programming of the desired data recording specifications for
MicroLite, to enable the downloading of recorded data to a
PC, and to store, view and analyze the data.
The Logger menu handles all communication between the
PC and MicroLite, such as programming the desired
recording mode, starting or stopping data recording, as well
as downloading the data.
20
MicroLab Lite
Chapter 2
The View menu controls the various data display options.
Data can be viewed in graph format, in table format, or in
both. The Data Map is a separate pane that displays a list of
the open data sets. It can also be used to quickly navigate
through the data sets.
The Graph menu contains all the commands needed to
format and edit the graph.
The most common tasks and commands are available as
buttons on the main toolbar and on the graph toolbar.
2.2. Software Installation
2.2.1. System Requirements
To work with MicroLab Lite your system should be
configured with the following:
21
Chapter 2
MicroLab Lite
Software
•
Windows 98 SE, Windows 2000, Windows XP, Server
2003 and Vista
•
Internet Explorer 5.0 or higher
Hardware
•
Pentium 200 MHz or higher
•
32 MB RAM (64 MB recommended)
•
5 MB available disk space for the MicroLab Lite
application
2.2.2.
Installation Procedure
Note: Do not connect the MicroLite to the computer until
installation of software and USB driver is complete.
22
MicroLab Lite
1.
Chapter 2
Browse to the Fourier Systems Download Center
(http://www.fouriersystems.com/support/download_center.php)
2.
3.
and click the MicroLab Lite download link.
You may either:
a. Click Save to save the MicroLabLite_setup.exe
file to your PC and then double click the file icon
to launch the Installation Wizard.
b. Click Run to install the software directly from the
Fourier Systems website.
The MicroLab Lite software will first be installed. Follow
the on-screen instructions to continue the installation
process.
Once the MicroLab Lite software has been installed the
Silicon Laboratories USB driver installation will begin
23
Chapter 2
MicroLab Lite
4.
automatically. The driver is required in order for the
computer to detect the MicroLite logger.
Follow the on-screen instructions to continue the
installation process. The default installation location is
C:\SiLabs.
5.
When the following dialog pops up, click Install.
24
MicroLab Lite
6.
Chapter 2
The installation of the driver could take up to one minute
or more, depending on the system.
25
Chapter 2
7.
8.
26
MicroLab Lite
Once installed, click Finish to close the USB driver
Install Wizard dialog.
The main MicroLab Lite InstallShield Wizard now
resumes.
MicroLab Lite
Chapter 2
9.
After a few more seconds, the installation process is
completed. Click Finish.
10. Connect the MicroLite to a USB port on your PC. The
PC will automatically detect the MicroLite as new
hardware. After a few seconds you will see a message
stating that the device is ready for use.
11. Double click the MicroLab Lite shortcut on your desktop
to launch the software. If the MicroLite is
connected to the PC the software will automatically
detect it.
27
Chapter 2
MicroLab Lite
2.3. Getting Started
2.3.1. Setting up the MicroLite
Use the Setup dialog box to view or change the MicroLite
settings.
1. Connect MicroLite to the PC.
2.
28
Click Setup
to open the Setup dialog box.
MicroLab Lite
Chapter 2
Figure 3: Setup dialog box
29
Chapter 2
MicroLab Lite
The dialog box consists of two main sections:
•
MicroLite info
Comment
Click the text box and type a name that will serve
to identify the specific MicroLite (e.g. its location).
S/N
Displays the MicroLite’s serial number.
Battery Level
Shows the current status of the MicroLite battery.
If the indicator is in the red zone the battery
should be replaced.
MicroLite firmware version
Displays the firmware version and the memory
capacity, either 8K (8,000) or 16K (16,000)
samples.
30
MicroLab Lite
Chapter 2
•
Setup
Temperature unit
To set the temperature unit in the MicroLite display,
select the option you want (Celsius or Fahrenheit).
Temperature alarm
Type in the desired Low and High alarm levels. If
the MicroLite records a reading that exceeds either
of these levels, the MicroLite’s LCD will display an
alarm notification.
The default alarm levels are the lower and upper
ends of the temperature sensor range. Click Cancel
Alarm to restore the default levels.
Interval
This determines the logging interval, or the time
interval between successive data recordings.
31
Chapter 2
MicroLab Lite
The time format is hh:mm:ss. Set the time setting to
select a recording time interval from 1 second to 2
hours. For example, to set a time interval of one
hour, five minutes and thirty seconds, click the hours
(hh) and type 1 or use the arrows to select 01. Click
the minutes (mm) and type 5 or use the arrows, and
finally, click the seconds (ss) and type 30 or select
30 using the arrows.
Recording Time
Displays the total recording time according to the
logging interval selected.
32
MicroLab Lite
Chapter 2
Timer run
Select the Timer run check box if you want
MicroLite to start recording at a predetermined time.
This option is convenient if you are using several
MicroLite at once and want them to all begin logging
at the same time.
Use the time and date selectors to set the start time.
Cyclic run
In Cyclic run mode, the MicroLite overwrites the old
measurements (starting with the oldest recorded
data) once the MicroLite’s memory is full. Click the
Cyclic run check box to operate in this mode.
If the check box is unselected, MicroLite will operate
in Normal run mode and will stop recording when
the memory is full.
33
Chapter 2
MicroLab Lite
Push to run
In Push to run mode, the MicroLite will only start
recording data when you use the MicroLite magnet
to close the reed relay on the MicroLite’s circuit
board, thereby causing the logger to start recording
data. This is convenient for when you wish to start
recording data soon (but not immediately) following
setup, or at an unspecified time.
2.3.2.
Completing the Setup
Click Send Setup to send the new settings to the MicroLite
and begin recording. This will complete the setup. Click
Cancel if you do not wish to change the setup at this stage.
34
MicroLab Lite
Chapter 2
Note: The Send Setup command erases all existing data in
the MicroLite.
If you select Timer run mode, MicroLite will wait in standby
mode, displaying tRUN. It will begin recording at the
specified time.
If you select Push to Run mode, MicroLite will also wait in
standby mode, displaying PUSH until the magnet is used to
start the logger.
2.3.3.
Starting Data Recording
Click Run
every time you want to start a new recording.
The Run command erases all previous data in the MicroLite
memory and begins recording.
35
Chapter 2
MicroLab Lite
Note: If you setup the MicroLite using the Setup command,
it will automatically begin recording, and you don’t have to
click Run.
2.3.4.
Stopping Data Recording
to stop recording. In Stop mode, MicroLite
Click Stop
keeps all recorded data but does not record new data. Use
this mode to save battery power.
2.3.5. Temperature Sensor Calibration
A new MicroLite comes fully calibrated. After a long period of
use however, you may want to recalibrate the Temperature
sensor.
36
MicroLab Lite
Chapter 2
The calibration is made directly to the MicroLite firmware i.e.
the calibrated data is displayed on the logger LCD, not just in
the software following data download.
Calibration must be carried out while MicroLite is connected
to the PC.
Calibration Password
To prevent accidental change of the calibration, the
calibration procedure is protected by a password.
The default password is: 1234.
To change the password:
1. Click Logger on the main menu, and then click
Calibration.
2. Click Change Password to open the Change
Password dialog box.
37
Chapter 2
3.
4.
5.
6.
MicroLab Lite
Enter the current password in the Current Password
field.
Enter the new password in the New Password field.
Enter the new password a second time in the Confirm
New Password field to confirm your new password.
Click OK.
Note: The password must include at least 4 characters and
is case sensitive.
Temperature Calibration
1. Connect the MicroLite to the PC.
2. Click Logger on the main menu, and then click
Calibration.
3. Enter the calibration password, and then click OK.
38
MicroLab Lite
Chapter 2
4.
The Calibration dialog will open.
5.
Enter the Reference value: this is the temperature value
you expect the logger to display.
39
Chapter 2
6.
7.
MicroLab Lite
Enter the MicroLite value: this is the temperature value
the logger is currently displaying, when compared with
the reference value.
Click Calibrate.
To restore default calibration, click Default. This will remove
any calibration applied to the MicroLite.
2.3.6. Communication Setup
Communication between the PC and the MicroLite unit takes
place automatically whenever you send a command to the
MicroLite. However, the Communication Setup dialog box
can be used for more advanced communication options.
40
MicroLab Lite
Chapter 2
Click Logger on the main menu and select Com setup to
open the Communication Setup dialog box:
Figure 4: Communication Setup dialog box
The selected COM ports are available for communication.
41
Chapter 2
MicroLab Lite
1.
2.
Click Try to connect to establish communication.
Click Work offline to work with saved files and no
logger detection is required.
Note: You can speed up the MicroLite detection process by
only selecting the COM which is being used by the MicroLite.
2.3.7. Downloading Data
1. Connect MicroLite to the PC.
2. Open the MicroLab Lite software.
on the main toolbar.
3. Click Download
The MicroLite will first be detected and then the download
will begin. Once the data has been downloaded, it will be
displayed both in the graph and in the table, and a new data
icon will be added to the Data Map:
42
MicroLab Lite
Chapter 2
You can now connect a different MicroLite to the PC and
download its data as well. The number of downloads is
limited only by the memory available on the computer.
Use the Data Map (refer to page 50) to navigate between the
different data sets.
2.3.8.
Saving Data
To save the displayed data, click Save
on the main
toolbar. The data currently displayed by the graph will be
saved in the MicroLite Data folder:
43
Chapter 2
MicroLab Lite
C:\Program Files\Fourier Systems\MicroLab Lite\MicroLite
Data
The data file name consists of the MicroLite name
(Comment, refer to page 30) and of the time and date at
which it was saved.
To save data in a different location or under a different name,
use the Save as… command from the File menu:
1. Select Save as… from the File menu.
2. Enter a new name in the File name box.
3. To save the data in a different folder, select a drive
and/or folder from the Save in dialog box.
4. Click Save.
If you’ve downloaded data from more than one MicroLite and
you want to save all the data sets, select Save all from the
File menu.
44
MicroLab Lite
Chapter 2
Note: If you want to remove unwanted data before saving,
apply the Crop tool (refer to page 58).
2.4. MicroLab Lite Basics
2.4.1.
1.
2.
3.
Opening Files
Click Open
on the main toolbar.
To open a file that was saved in a different folder, select
a drive and/or folder in the Look in dialog box.
Double-click the file you want to open.
45
Chapter 2
MicroLab Lite
2.4.2. Displaying Properties
You can change the way numbers and dates will be
displayed on screen.
1. Click File on the main menu, and then click Display
properties.
2. Under Decimal place settings, enter the number of
decimal places you want to display (enter a number
between 0 and 4) for each sensor.
3. Under the Date format settings, select the desired
format option.
4. Click OK.
46
MicroLab Lite
2.4.3.
1.
2.
3.
4.
Chapter 2
Printing a Graph
on the main toolbar to open the Print
Click Print
Options dialog box.
Click the Graph option.
Click Print to open the Print dialog box.
Click OK.
2.4.4. Printing a Table
The displayed data can also be printed as a table. The
printed table will include data from all MicroLite’s that are
currently represented on the graph (to learn how to add or
remove data sets from the graph, refer to page 50) as well as
the MicroLite name, serial number and the alarm level setup.
47
Chapter 2
MicroLab Lite
Data that exceeds any of the alarm levels will be highlighted
by arrows.
1.
2.
3.
4.
48
Click Print
on the main toolbar to open the Print
Options dialog box.
Click the Table option.
If you want to print only part of the data, uncheck the
check box and select the desired time and date in the
From and To boxes.
Click Print to open the Print dialog box and click OK.
MicroLab Lite
Chapter 2
2.5. Viewing the Data
2.5.1. Display Options
MicroLab Lite’s main window consists of three parts: the
graph, the table and the Data Map. You can display all
three parts simultaneously (the default view) or any
combination of them.
Graph
Click Graph
to display or remove the graph. The graph
displays the data sets plotted vs. time.
In order to keep the graph clear and simple, only two Y-axes
can be shown on the graph simultaneously. If there are three
curves in the graph, one of the Y-axes will be hidden. To
49
Chapter 2
MicroLab Lite
make this axis visible, select the corresponding plot with the
cursor (refer to page 53).
You can identify the Y-axis by its color, which matches the
plot color.
Table
Click Table
to display or remove the table.
The data in the table always matches the data that is
currently displayed on the graph.
Data Map
Click Data Map
50
to display or remove the Data Map.
MicroLab Lite
Chapter 2
The Data Map is a separate window that displays the list of
data sets that were downloaded or opened in the current
session. Use the Data Map to navigate through the available
plots and to keep track of the data that is displayed in the
graph and/or table windows.
When you double-click on a MicroLite icon in the Data
Map, MicroLab Lite jumps to the corresponding data and
displays it in the graph and table windows. It also expands
the Data Map to show the Temperature sensor data set.
indicates that the data set is currently being
A graph icon
displayed. Double-click on the icon to clear the data set from
the display.
51
Chapter 2
MicroLab Lite
An empty icon
indicates that the data set is not being
displayed. Double-click on the icon to add the data set to the
display.
To collapse the sensor list under an individual MicroLite, click
the minus sign (-) next to the MicroLite icon.
To expand the sensor list under an individual MicroLite, click
the plus sign (+) next to the MicroLite icon.
To remove an individual MicroLite from the Data Map, rightclick on its icon, then click Remove data.
To remove all data sets from the Data Map, right-click the
Data Sets icon
52
, then click Remove all data.
MicroLab Lite
Chapter 2
2.5.2. The Cursor
Use the cursor to view individual data recording values, or to
reveal a hidden Y-axis. MicroLab Lite enables you to display
up to two cursors simultaneously.
To display the first cursor, double-click on an individual data
point or click Cursor
on the graph toolbar. You can
drag the cursor with the mouse to any other point on the plot,
or to another plot altogether.
The point coordinates of the selected data recording will
appear in the status bar at the bottom of the graph window.
To display a second cursor, double-click anywhere on the
graph or click Second cursor
on the graph toolbar.
53
Chapter 2
MicroLab Lite
2.5.3. Graph Features
1. Zooming
on the graph toolbar and drag the cursor
Click Zoom in
diagonally to select the area you want to magnify. Release
the mouse button to zoom in to the selected area.
Click on the Zoom in button a second time to turn off the
Zoom tool.
2. Autoscale
Click Autoscale
on the graph toolbar for the full data
display.
Double-click on an individual axis to auto scale it separately.
54
MicroLab Lite
3.
Chapter 2
Manual scaling
a.
b.
c.
d.
e.
Click Graph properties
on the graph
toolbar to open the Graph Properties
dialog box.
Select the Scale tab, and choose the axis
you want to scale in the Select axis dropdown menu.
Unselect the Auto scale check box and
enter the new values in the value fields.
In the time axis, you can either enter the
time and date manually, or select it with
the up and down arrow buttons.
Click OK.
To restore auto scaling, click Autoscale
.
55
Chapter 2
MicroLab Lite
4. Default zooming
If you usually need to view a specific time frame (i.e.
workday hours), use the Default zooming tool. You can set
the start and end time of the time span and then use it
whenever you open a file or download data from the
MicroLite.
To set the default zoom:
a.
Click Graph Properties
on the graph
toolbar, then click Set Default Zoom.
b. Enter the start and end times, then click
Set.
To zoom to the default zoom:
a.
56
Click Graph Properties
toolbar.
on the graph
MicroLab Lite
Chapter 2
b.
Check the Use default zoom check box
and click OK.
Every file and every data recording you download will
automatically open in the default zoom as long as the Use
default zoom check box remains selected.
To restore auto scaling, click Autoscale
.
5. The Stretch/Compress Axis Tool
Move the cursor onto one of graph axes. The cursor icon
changes to a double arrow symbol (↔), indicating that you
can stretch or compress the axis scale. Drag the symbol to
the desired location. Repeat the procedure for the other axis,
if necessary.
57
Chapter 2
MicroLab Lite
6. Panning
Use the pan tool after zooming any part of the graph that is
outside the zoomed area.
on the graph toolbar, then click
To do so, click Pan
anywhere on the graph and drag the graph to view another
area.
Click Pan a second time to turn off the Pan tool.
2.5.4.
Cropping the Data
Cropping enables you to trim the edges of a data set. Use it
to remove unwanted data.
1. Zoom to the data range you want to keep.
2. Click Graph on the menu bar, and then click Crop.
58
MicroLab Lite
Chapter 2
All data outside the zoomed area will be permanently
removed.
2.5.5. Formatting the Graph
You can change a data line’s color, style or width. You can
also add markers that represent the data points on the graph
and format their style and color.
The Y-axis color matches the corresponding plot’s color and
will change accordingly. The Time axis color can be changed
separately:
1.
2.
Click Graph properties
on the graph toolbar to
open the Graph Properties dialog box.
Select the Lines tab, and then select the plot or axis you
want to format in the Select plot drop-down menu.
59
Chapter 2
3.
4.
MicroLab Lite
From here, you can format the line’s color, style and
width, as well as the markers’ color and style. To
remove the line or the marker, uncheck the
corresponding visible check box.
To restore the default formatting, click Restore default,
and click OK.
2.5.6. Displaying Alarm Levels
Click the Display Alarm Level icon on the main toolbar
to enable the Temperature
alarm levels to be displayed on the graph.
60
MicroLab Lite
2.5.7.
Chapter 2
Changing the Temperature Units
to change the temperature
Click Toggle °C/°F button
scale from Fahrenheit to Celsius and vice versa.
Note: To change the units in the MicroLite display, use the
Setup dialog box (refer to page Error! Bookmark not
defined.).
2.5.8.
Adding Annotations to the Graph
MicroLab Lite allows you to add annotations to the graph. An
annotation is always attached to a specific data point.
To add an annotation:
1. Place the cursor on the point to which you want to add
the annotation.
61
Chapter 2
2.
3.
4.
MicroLab Lite
Click Add new annotation
on the graph toolbar
Type the annotation in the New annotation caption text
box.
Click OK.
To move an annotation:
1.
2.
3.
62
on the graph toolbar
Click Move annotation
Drag the annotation to any location on the graph you
choose.
Click Move annotation a second time.
MicroLab Lite
Chapter 2
To edit an annotation:
1. Place the cursor on the point to which the annotation is
attached.
2. Click Graph on the menu bar.
3. Click Edit annotation.
4. Edit the annotation in the text box.
5. Click OK.
To delete an annotation:
1. Place the cursor on the point to which the annotation is
attached.
2. Click Graph on the menu bar.
3. Click Delete annotation.
63
Chapter 2
MicroLab Lite
To hide all annotations:
1. Click Graph on the menu bar.
2. Click Show annotations to uncheck it.
2.5.9.
Exporting Data to Excel
to export the currently displayed
Click Export to Excel
data to an Excel spreadsheet. MicroLab Lite will open a new
Excel workbook displaying the data along with the MicroLite
info, including the MicroLite name, serial number and alarm
levels setup.
If Excel is not installed on the PC then the data will be
exported to a CSV text file.
64
MicroLab Lite
Chapter 2
2.5.10. Export File Settings
If MicroLab Lite fails to export the data properly i.e. all of the
data is displayed in one row of the worksheet, you can
change the export file settings. This ensures that the data is
exported using comma separated values (CSV).
1. Click File on the main menu, then click Export file
settings,
2. Select the Ignore regional settings check box.
3. Click OK.
2.5.11. Copying the Graph as a Picture
You can copy the graph to the clipboard as a picture and
then paste it into other Windows programs, such as Word
and PowerPoint:
1. On the Graph menu, click Copy graph.
65
Chapter 2
2.
3.
MicroLab Lite
Open the destination file.
In the destination file, right-click and select Paste.
2.5.12. Viewing more than one Data Set on
the Graph
MicroLab Lite lets you view more than one data set in Graph
and Table view at the same time, allowing you to compare
the data from several data sets side by side.
Note: To use this feature the data sets must have been
recorded using the same sampling rate e.g. every 1 minute
There are two modes when using the Multi-graph feature:
66
MicroLab Lite
Chapter 2
Standard mode
The time scale of all data on the graph is the same. The time
and date of data recorded in the first data set included on the
graph is used.
For example, if you have a graph whose data was recorded
starting 10:00AM on August 11, then all additional data
added to the graph will be displayed with the same recording
date.
The MicroLab Lite data table below shows all data in the
graph having the same time scale:
67
Chapter 2
MicroLab Lite
Figure 5: MicroLite data table
Plot sync mode
To display data on the graph using the data’s actual time
scale i.e. the time and date when the data was actually
68
MicroLab Lite
Chapter 2
recorded, use the Plot sync feature. This will also shift all
data in the data table accordingly.
Once you’ve added the data to the graph, on the Graph
menu, select Plot sync to enable the feature. To return to
Standard mode, unselect Plot sync.
Note: The time scale of all data is rounded to the same
resolution as the time scale of the original data on the graph.
2.6. Analysis Tools
2.6.1.
Setting the Analysis Tools Parameters
1. Click Analysis on the menu bar, then click Set
Functions’ Parameters to open a dialog box:
69
Chapter 2
MicroLab Lite
Figure 6: Functions Parameters
2.
Type in the desired parameters, and then click OK.
2.6.2. Histogram
Use this tool to create a frequency distribution of the selected
data set.
70
MicroLab Lite
Chapter 2
To create a histogram:
1. Use the cursor to select a plot on the graph.
2. Click Analysis on the main menu bar, then click
Histogram.
MicroLab Lite displays a histogram of the selected data and
creates a new entry in the Data Map.
Use the Data Map (refer to page 50) to hide the histogram or
to return to the original data sets.
You can modify the histogram to your needs. You can set the
upper limits of the first bin and the lower limit of the last bins,
and refine the histogram by increasing the number of bins.
To modify the histogram:
71
Chapter 2
1.
MicroLab Lite
Click Analysis on the main menu, then click Histogram
a second time to open a dialog:
Figure 7: Histogram settings
2.
Enter the desired values for the first bin, the bin width
and last bin, and then click OK.
You can repeat the process for further modification.
72
MicroLab Lite
Chapter 2
2.6.3. Pasteurization
Use this tool to create and display an FO Pasteurization
curve:
Click Analysis on the menu bar, then click FO
pasteurization.
2.6.4. Statistics
Use the statistics tool to display statistics of each data set in
the graph.
The statistics include:
Minimum – The smallest value in the data set.
Maximum – The largest value in the data set.
Average – The average of all the numbers in the data set.
MKT – The Mean Kinetic Temperature.
73
Chapter 2
MicroLab Lite
To display statistics:
Click Statistics
on the main toolbar.
MicroLab Lite will display the statistics in the information bar
at the bottom of the graph window.
To hide the statistics, click Statistics
74
a second time.
MicroLab Lite
Chapter 2
2.7. Toolbar Buttons
2.7.1.
Main (Upper) Toolbar
Open
Opens saved files
Save
Saves the
displayed
Print…
Opens the Print Option dialog box
Export
Exports the displayed data to an Excel
spreadsheet
data
that
is
currently
75
Chapter 2
76
MicroLab Lite
Run
Begins recording data
Stop
Stops recording data
Setup
Opens the Setup dialog box
Download
Downloads data from the MicroLite onto
the PC
Data Map
Displays or removes the Data Map
Graph
Displays or removes the graph
MicroLab Lite
Chapter 2
Table
Displays or removes the table
Statistics
Displays or removes the data’s statistics
°C/°F
Displays the desired unit of temperature
Alarm
Displays or removes temperature alarm
levels from the graph
77
Chapter 2
2.7.2.
78
MicroLab Lite
Graph (Lower) Toolbar
Add
annotation
Adds new annotation to the graph
Move
annotation
Relocates the annotation on the graph
Zoom in
Activates the zoom tool
Pan
Activates the pan tool
Autoscale
Returns the graph to full view
MicroLab Lite
Chapter 2
Graph
properties
Opens the Graph Properties dialog box
Cursor
Toggles the first cursor
Second
cursor
Toggles the second cursor
79
Specifications
Specifications
MicroLite
Models:
LITE5008 - Temperature sensor; 8,000 sample memory
LITE5016 - Temperature sensor; 16,000 sample
memory
Internal Temperature sensor:
Range:
Resolution:
80
-40 ˚C to 80 ˚C
A/D resolution: 16-bit,
0.1°C
Specifications
Accuracy (all ranges):
0.3 ˚C
Response time:
~ 20 minutes
(Thermal conductor enabling fast response time)
Software calibration is possible
Outputs:
3-digit 7-segment LCD with decimal point
USB 2.0 interface
Memory Capacity:
8,000 samples or 16,000 samples, depending on
MicroLite model
LCD Unit Icons:
˚C, ˚F, AL-H, AL-L, MIN, MAX
81
Specifications
Power Supply:
Internal Lithium Battery: 3V, CR2032
Battery Life: Approximately two years
Sampling Rate:
User defined: From once every second to once every
two hours
Dimensions:
11 x 3.9 x 2.6 cm
Weight:
45.5 g
82
Specifications
Standards:
Water and dust proof IP66 standard compliance
CE and FCC standard compliance
Software
MicroLab Lite Software Features
Runs on Windows 98/2000/ME/XP/VISTA
Fast data download from the MicroLite
Graphic visualization of the MicroLite data
Data displayed in graphs and tables
Data export to EXCEL
Graphic analysis tools such as Markers, Zoom
83
Specifications
Setup windows, for setting the MicroLite unit name,
sampling rate and alarm level
Sampling rate: Once every second to once every
two hours
MicroLite sensor calibration
Display of MicroLite battery level
Visual alarm levels on the graph and table
MicroLab Lite System Requirements
Software
Windows 98 or later
Internet Explorer 4.0 or later
Hardware
Pentium 200 MHz or higher
32 MB RAM (64 MB recommended)
84
Specifications
5 MB available disk space for the MicroLab Lite
application
85
Figures
Appendix: Figures
Figure 1: MicroLite battery compartment ................................16
Figure 2: MicroLite magnet holder ..........................................19
Figure 3: Setup dialog box......................................................29
Figure 4: Communication Setup dialog box............................41
Figure 5: MicroLite data table .................................................68
Figure 6: Functions Parameters .............................................70
Figure 7: Histogram settings...................................................72
86
Figures
87