1
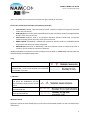
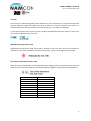
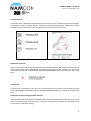
NAMCon NSWC User Guide
version 1.0 updated 29.5.2015
Nordic SWC User Guide
Introduction
Nordic Significant Weather Chart, NSWC, is a graphical aviation weather product that covers areas
from the North Sea to NW Russia in the east-west direction and from Poland up to the Arctic Ocean in
the north-south direction. The NSWC is mainly aimed for commercial and professional aviation use,
but it can be used where applicable also for general aviation purposes.
The NSWC is published either by the Meteorological Watch Office (MWO) in Stockholm (by Swedish
Meteorological and Hydrological Institute, SMHI-Stockholm) or in Helsinki (by Finnish Meteorological
Institute, FMI-Helsinki). The NSWC gives significant benefit for aviation users in the Nordic area
compared to other significant weather charts (SigWx) e.g. published by global World Area Forecast
Centers (WAFC). This is due to at least three reasons:
1. NSWC has a lead time of 4 h instead of 15-24 h which is typical for WAFC SigWx. Thus NSWC
contains information from more up-to-date sources of weather observations and numerical
models.
2. The area of interest of NSWC is a lot smaller than that of WAFC SigWx making it possible to
describe weather phenomena in greater detail.
3. NSWC is a fully monitored product thus in cases of unexpected weather phenomena the
product is amended and the most recent information can be delivered to the customer.
NSWC is a combination of low (L), medium (M) and high (H) atmosphere SigWx. The chart can be
described as a graphical representation of valid aviation weather messages (SIGMET, GAMET, AIRMET,
TAF) and some other weather information between SFC-FL450 in chart form.
NSWC is a monitored product and if necessary an amendment chart will be published (AMD). An AMD
is published in cases of appearance of non-forecast significant weather phenomena in the domain of
the map.
The content of NSWC is compliant with requirements and recommendations of ICAO Annex 3.
1
NAMCon NSWC User Guide
version 1.0 updated 29.5.2015
Chart content
Significant weather
Widespread significant precipitation
Rain, snow, sleet
Rain shower, snow shower, sleet shower
Freezing rain, freezing drizzle
Thunderstorm, hail
Drizzle, snow grains
Demarcation of significant weather
Demarcation of significant weather:
scalloped line
Areas of widespread significant precipitation, OCNL/FRQ/EMBD/OBSC CB/TCU clouds, and moderate
or severe icing are delineated with the scalloped line.
Widespread phenomena reducing visibility
Mist, fog, freezing fog
Haze, smoke, blowing snow
Areas of widespread phenomena reducing visibility are generally delineated using the IMC line, see
below.
Low clouds and poor visibility
Widespread low cloud ceiling and/or poor visibility (IMC, Instrument Meteorological Conditions) is
delineated with a yellow dashed and toothed line, with its teeth pointing into the IMC area.
IMC is defined as
• visibility < 5000 m, and/or
• ceiling (bkn/ovc cloud base) < 1000 ft.
Delineation of widespread IMC
areas: yellow dashed and toothed
line
2
NAMCon NSWC User Guide
version 1.0 updated 29.5.2015
IMC is not detailed in mountain areas (shown with grey shading on the chart).
CB and TCU clouds (Cumulonimbus and Towering Cumulus)
•
•
•
•
•
ISOL CB/TCU (isolated, individual features which a maximum spatial coverage less than 50%
of the area concerned)
OCNL CB/TCU (occasional, well-separated features with a maximum spatial coverage between
50-75% of the area concerned)
FRQ CB/TCU (frequent, little or no separation between adjacent clouds with a maximum
spatial coverage greater than 75% of the area concerned)
EMBD CB/TCU (embedded) is additionally used when CB/TCU clouds are embedded within
cloud layers and cannot be readily recognized
OBSC CB/TCU (obscured) is additionally used when CB/TCU clouds are obscured by haze or
smoke or cannot readily be seen due to darkness
Widespread CB/TCU clouds with an areal coverage of at least OCNL, or EMBD/OBSC CB/TCU clouds are
delineated with the SIGWX scalloped line.
Icing
Moderate or severe icing with forecast base and top
Delineation
of
icing:
scalloped line, or blue short dashed line if different
from SIGWX cloud area
Turbulence
Moderate or severe turbulence, both
CAT (Clear Air Turbulence) and low
level turbulence with forecast vertical
extent
Delineation of low level turbulence:
purple dashed line
Delineation of high level turbulence
(CAT): grey dashed line
Mountain waves
Significant mountain wave (MTW) activity is forecast with the MTW symbol over the area affected (no
delineation).
3
NAMCon NSWC User Guide
version 1.0 updated 29.5.2015
Jet streams
The jet stream axis (strongest wind within the jet stream) is marked on the chart when the wind speed
is at least 80kt. The jet stream axis height is indicated in flight levels. The jet stream axis is intersected
by two slashes (//) where the wind speed changes by at least ±20kt and/or the jet stream axis height
changes by at least ±3000ft.
Fronts, troughs and squall lines
Fronts, troughs and squall lines indicate their position at the surface. The movement direction of fronts
is indicated with an arrow and their movement speed in knots (or SLW = moving slowly, STNR =
stationary).
Cold front at the surface
Warm front at the surface
Occluded front at the surface
Stationary front at the surface
Convergence / trough at the surface
Severe squall line at the surface
High and low pressures
Surface high (H) and low (L) pressure centres are marked on the chart with their forecast QNH (hPa)
pressure. Their movement is indicated in the same way as the movement of fronts.
4
NAMCon NSWC User Guide
version 1.0 updated 29.5.2015
0°C level
The 0°C level is indicated regionally and/or based on air mass temperatures. If there are multiple 0°C
levels at different heights, the highest 0°C level is shown first, and the sub-zero layer below it is
indicated separately with the lowest 0°C level as its base (e.g. 0°: FL050, <0°: 010-030).
0°: SFC means that the 0°C level is at (or only a couple of hundred feet above) the surface, or that T<0°C
in the whole troposphere (no 0°C level).
Widespread strong surface wind
Widespread strong surface wind above 30kt is marked on the chart over the area concerned (no
delineation). The value indicated is the mean wind speed, i.e. gusts can be significantly stronger.
Sea surface temperature and sea state
Mean sea surface temperature (°C) and significant wave height (index) is indicated over the main sea
areas. The sea state index values and corresponding wave heights are described in the table below.
Wave height (m)
0 – 0,1
0,2 – 0,5
0,6 – 1,2
1,3 – 2,5
2,6 – 4
4–6
6–9
9 – 14
> 14
Sea state index
0/1
2
3
4
5
6
7
8
9
5
NAMCon NSWC User Guide
version 1.0 updated 29.5.2015
Tropopause level
Tropopause level is indicated in flight levels at spot locations in four standard areas (northern Sweden
and northern Finland, southern Sweden, southern Finland and Estonia/Latvia). Additionally possible
tropopause minima and maxima are indicated, where forecasted, in the chart area.
Radioactive materials
If there’s a release of radioactive materials into the atmosphere the incident location is marked on the
chart with the RAD symbol. Additionally a text box with the RAD symbol, release time, source site
coordinates and the text “CHECK SIGMET AND NOTAM FOR RDOACT CLD” is placed on the side of the
chart.
Volcanic ash
If volcanic ash is advected into the chart area a text box with the VA symbol, eruption details and the
text “CHECK SIGMET, ADVISORIES FOR VA, ASHTAM AND NOTAM FOR VA” is placed on the side of the
chart.
Description of the prevailing weather situation
The prevailing weather situation is described in plain (English) language in the upper left corner of the
chart. It can be used e.g. to draw the user’s attention to significant phenomena or how the situation
on the chart is expected to change.
6
NAMCon NSWC User Guide
version 1.0 updated 29.5.2015
Notes
•
•
•
The various phenomena can additionally be detailed by LCA (locally), MAR (at sea), COT (at
the coast), LAN (inland), MON (above mountains), or VAL (in valleys), and in such cases the
phenomenon is not necessarily delineated with the SIGWX or IMC lines
Only TCU and CB cloud types are indicated, layered clouds are indicated with LYR
Non-significant clouds are not delineated, but they can be included as additional information
(with or without base and top information)
SWC amendment criteria
An amendment to the chart is issued (AMD added in the title of the chart) when one of the following
phenomena is observed but was not forecasted (or a previously forecast phenomenon is no longer
expected):
• SIGMET phenomena
• Widespread
o IMC, i.e. phenomena strongly reducing visibility (e.g. mist/fog, moderate drizzle or
snowfall, heavy rain, smoke, blowing snow) and/or low cloud ceiling (below 1000ft)
o Moderate icing
o Moderate turbulence
o OCNL/FRQ/EMBD/OBSC CB clouds, when no CB clouds had been forecast
In case of a technical error (e.g. typos) a correction to the chart is issued (COR added in the title of the
chart).
The chart is monitored for possible amendments from its issue time until +1.5h of its valid time (i.e.
the monitoring period is chart valid time -4h…+1,5h).
NSWC example
Two example charts of the Nordic SWC are shown on the following pages.
7
NAMCon NSWC User Guide
version 1.0 updated 29.5.2015
8
NAMCon NSWC User Guide
version 1.0 updated 29.5.2015
9