1
Health Management System
Versión 4.0
User’s
Guide
ART12375 Rev. A 12/07
Table of Contents
Contents
Preface .......................................................................................................................... v
Overview of the CoPilot Health Management System .................................................... v
Intended Use and Application ................................................................................................. v
Purpose and Scope .....................................................................................................................vi
Software Availability ..................................................................................................................vi
Computer Requirements ..........................................................................................................vi
Technical Support and Customer Care ................................................................................vi
1 Introduction ..............................................................................................................1
1.1 Modes of Operation ............................................................................................................1
1.2 Overview of Home User Activities .................................................................................1
1.3 Overview of HCP User Activities .....................................................................................2
1.4 CoPilot System Terminology ...........................................................................................2
1.5 Organization and Topics in this Guide .........................................................................3
1.6 Warning, Caution and Important Messages in this Guide...................................4
1.7 Getting Around - The CoPilot System Home Page....................................................4
1.7.1 The CoPilot System Home Page.............................................................................5
1.7.2 Menu Bar .......................................................................................................................5
1.7.3 Shortcut Keys ...............................................................................................................6
1.7.4 Select User, Select HCP, and Select Patient Lists...............................................6
1.7.5 Small Icons ....................................................................................................................7
1.7.6 Large Buttons...............................................................................................................8
1.7.7 Resource Links .............................................................................................................9
1.7.8 CoPilot System Help ..................................................................................................9
1.7.9 Pictures of the CoPilot System Screens ...............................................................9
2 CoPilot System Installation ....................................................................................10
2.1 CoPilot System Installation Overview.........................................................................10
2.2 Standard Installation Procedure ...................................................................................10
2.2.1 Install the CoPilot System ......................................................................................11
2.2.2 Select Application Mode .......................................................................................12
2.2.3 Select Unit of Measure ........................................................................................................13
3 HCP and Home User Profiles ..................................................................................15
3.1 Home User - Profile Setup ...............................................................................................15
3.1.1 What is a Home User Profile? ................................................................................15
3.1.2 Health Profile Tab ......................................................................................................18
3.1.3 Data Entry Preferences Tab....................................................................................19
3.1.4 Glucose Targets Tab .................................................................................................20
3.1.5 Options Tab.................................................................................................................23
3.2 Home User: Managing Your User Profile ....................................................................24
3.2.1 Changing or Updating Your User Profile...........................................................24
i
Table of Contents
3.2.2 Adding a User Profile ..............................................................................................24
3.2.3 Removing a User Profile .........................................................................................24
3.2.4 Adding an HCP Profile .............................................................................................26
3.2.5 Editing an HCP Profile .............................................................................................28
3.2.6 Removing an HCP Profile ......................................................................................28
3.3 HCP - Setting Up Your User Profile................................................................................29
3.3.1 What is an HCP Profile? ...........................................................................................29
3.3.2 HCP Profile Setup......................................................................................................30
3.3.3 Automatic Report Printing ....................................................................................31
3.3.4 Glucose Targets Tab .................................................................................................32
3.3.5 Options Tab.................................................................................................................35
3.4 HCP - Managing the HCP Profile ...................................................................................36
3.4.1 Changing or Adding to Your HCP Profile ..........................................................36
3.4.2 Adding a Patient Profile ..........................................................................................36
3.4.3 Editing a Patient Profile ..........................................................................................38
3.4.4 Removing a Patient Profile ...................................................................................38
3.5 Managing HCP Profiles ....................................................................................................39
3.5.1 Adding an HCP Profile .............................................................................................39
3.5.2 Assigning an HCP .....................................................................................................39
3.5.3 Editing an HCP Profile .............................................................................................40
3.5.4 Removing an HCP Profile .......................................................................................40
4 Entering Data Into the CoPilot System ..................................................................42
4.1 Uploading Data from a Device ......................................................................................42
4.1.1 Connecting a Device to Your Computer ...........................................................42
4.1.2 Uploading from a Device .......................................................................................43
4.1.3 Undoing a Device Upload......................................................................................45
4.2 Manual Data Entry .............................................................................................................46
4.2.1 Entering a Glucose Reading ..................................................................................48
4.2.2 Recording an Insulin Dose ...................................................................................49
4.2.3 Recording a Meal ......................................................................................................50
4.2.4 Recording Exercise Activity ...................................................................................52
4.2.5 Recording State of Health ......................................................................................53
4.2.6 Recording a Medication Event .............................................................................54
4.2.7 Recording a Medical Exam/Doctor Visit............................................................55
4.2.8 Recording a Lab Test Result ...................................................................................56
4.2.9 Recording a Ketone Reading ................................................................................57
4.2.10 Recording a Note (or Miscellaneous Event) ..................................................58
4.3 Customizing Data Lists ....................................................................................................59
4.3.1 Customizing Data Entry Lists ................................................................................59
4.4 Importing Data from Database Files ...........................................................................61
4.4.1 Importing a Database .............................................................................................61
4.4.2 Importing a Supported Database .......................................................................61
4.4.3 Importing Data from a File ....................................................................................62
4.5 Exporting Data....................................................................................................................64
ii
Table of Contents
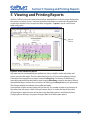
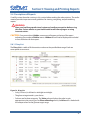
5 Viewing and Printing Reports ................................................................................66
5.1 Viewing Reports .................................................................................................................68
5.1.1 Date Range .................................................................................................................68
5.1.2 Data Symbols ............................................................................................................69
5.1.3 Target Range Colours ..............................................................................................69
5.2 Printing and Sending Reports ......................................................................................70
5.3 Personalizing Report Settings .......................................................................................71
5.3.1 Report Options (User or HCP Profile) .................................................................71
5.3.2 Data Filters ..................................................................................................................72
5.3.3 Display Features .......................................................................................................73
5.4 Glucose Target Modes ......................................................................................................75
5.5 Definition of a Day .............................................................................................................75
5.6 Descriptions of Reports ...................................................................................................76
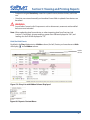
5.6.1 Diary List ......................................................................................................................76
5.6.2 Glucose Modal Day Report....................................................................................80
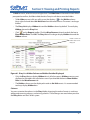
5.6.3 Glucose Line Report ................................................................................................82
5.6.4 Glucose Average Report ........................................................................................83
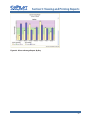
5.6.5 Glucose Histogram Report ....................................................................................85
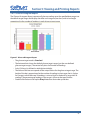
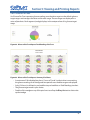
5.6.6 Glucose Pie Chart .....................................................................................................86
5.6.7 Logbook Report ........................................................................................................87
5. 6.8 Lab and Exam Record Report ..............................................................................88
5.6 .9 Statistics Report .......................................................................................................88
5.6.10 Daily Combination View Report ........................................................................96
5.6.11 Weekly Pump View Report ..................................................................................99
5.6.12 HCP Group Analysis Report ............................................................................. 101
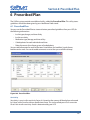
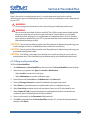
6 Prescribed Plan .....................................................................................................104
6.1 Prescribed Plan................................................................................................................ 104
6.2 Filling-in a Prescribed Plan .......................................................................................... 105
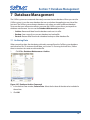
7 Database Management .......................................................................................106
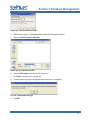
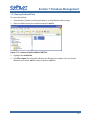
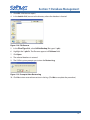
7.1 Archiving Data ................................................................................................................. 106
7.2 Viewing Archived Data ................................................................................................. 108
7.3 Restoring Archived Data .............................................................................................. 109
7.4 Backing Up the Database ............................................................................................. 110
7.4.1 Automatic Database Backup ............................................................................. 110
7.4.2 Manual Database Backup ................................................................................... 110
7.5 Restoring a Backup Database ..................................................................................... 111
7.5.1 Restoring a Database Backup File .................................................................... 111
7.5.2 Viewing the Restore Log ..................................................................................... 113
8 Security .................................................................................................................114
8.1 System Administrator Profile ...................................................................................... 114
8.2 Password Protection ...................................................................................................... 114
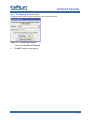
8.2.1 The Logon to System Screen ............................................................................. 115
iii
Table of Contents
8.3 Defining User Rights ...................................................................................................... 116
8.3.1 User Rights Options for HCP and Home Users ............................................. 116
8.3.2 Assigning Your Own User Rights - HCP and Home User ........................... 117
8.3.3 Home User - Assigning User Rights to Other Home Users ....................... 118
8.3.4 HCP - Assigning User Rights to Other HCPs .................................................. 119
Appendix A: Contact Customer Care .......................................................................120
Appendix B: Troubleshooting ..................................................................................121
Device Connection Problems ............................................................................................. 121
Data Import Problems ........................................................................................................... 121
Printing Problems ................................................................................................................... 122
PDF Attachments .................................................................................................................... 122
Access Violation Errors........................................................................................................... 122
Appendix C: Supported Devices And Databases ....................................................123
Appendix D: Warning, Caution and Important Messages ......................................126
WARNING Messages ............................................................................................................... 126
CAUTION Messages ................................................................................................................ 127
IMPORTANT Messages........................................................................................................... 129
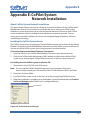
Appendix E: CoPilot System Network Installation..................................................130
About CoPilot System Network Installation................................................................... 130
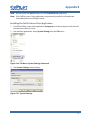
Installing the CoPilot System Server ................................................................................ 130
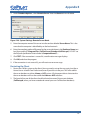
Installing the CoPilot Server Client Application............................................................ 131
Restarting the Client .............................................................................................................. 132
Index ........................................................................................................................133
iv
Preface
Preface
Overview of the CoPilot Health Management System
The CoPilot™ Health Management System is a versatile tool that allows people with diabetes,
their caregivers, and healthcare professionals to take a more informed role in managing
diabetes by acting as a data management tool. The CoPilot system tracks diabetes-related
health information, and provides graphs, charts and reports that can help both patients and
healthcare professionals evaluate needs and options for a diabetes health management
program.
The CoPilot Health Management System (“CoPilot system”) allows you to upload recorded test
results from supported Abbott Diabetes Care blood glucose monitoring systems. The CoPilot
system also allows you to record information about insulin, ketones, medications, meals,
exercise, state of health, medical exams, lab results, as well as general notes.
The CoPilot system displays trends and patterns in glucose readings, carbohydrate intake,
insulin dosage, and other diabetes-related factors.
The CoPilot system can be installed in one of two modes or, versions. The Home User version is
for people with diabetes, or their caregivers. The HCP version is for healthcare professionals
(HCPs). When you install and use the CoPilot system for the first time, you must specify which
version you use. Both versions provide the same tools to record, track, view and analyze
individualized health information. When needed, this guide provides instructions specifically
for each version and type of user.
To allow multiple home users (such as a family) and multiple HCPs (such as in a clinic) to share
the use of the CoPilot system, each user has a Profile. The information for each profile can be
made secure with a unique password.
Intended Use and Application
The CoPilot Health Management System is intended for use in home and clinical settings by
patients and healthcare professionals. It is intended to aid people with diabetes and healthcare
professionals in the review, analysis, and evaluation of information such as historical blood
glucose test results, insulin dosages, carbohydrate intake, and exercise data in support of an
effective diabetes health management program. It can be used with supported Abbott
Diabetes Care blood glucose monitoring systems (as listed in Appendix C: Supported Devices and
Databases), where data is uploaded, saved, analyzed, displayed as charts, graphs and reports,
printed, and shared.
Users should be aware that the CoPilot Health Management System is merely an information
management tool - it does not itself provide diagnostic information, nor does it give advice on
management of diabetes, and it is therefore not intended to substitute for the support of a
healthcare professional. Home users should always consult their healthcare professional if they
have any queries or concerns about their diabetes management.
v
Preface
Purpose and Scope
This User’s Guide provides computer requirements, installation steps and configuration
options. It provides instructions and procedures for setting up user profiles, for uploading,
recording and importing data, and for viewing reports. This guide also provides instruction for
managing system security and data integrity by using logon profiles and passwords, and for
managing user rights. Finally, information is provided for troubleshooting and obtaining
technical support.
Software Availability
To obtain the CoPilot system installation software, contact your local Abbott Diabetes Care
office. For a list of worldwide offices, visit www.abbottdiabetescare.com and click
Worldwide Locations. On the Worldwide Locations page, click the link for your country
or a country near you.
Computer Requirements
The following are minimum requirements for CoPilot system operation:
• Microsoft Windows 2000, Windows XP
• 400 megahertz (MHz) or higher CPU processor
• 128 megabytes free system RAM (memory)
• RS-232 Serial port, or USB port
The following components are needed or recommended for optimal use of CoPilot system
features: Internet connection, email account, 1024 x 768 resolution monitor, CD-ROM drive,
colour printer, fax software.
Technical Support and Customer Care
To obtain support, please contact the person you received the software from, or your local
Abbott Diabetes Care office. For a list of worldwide offices, visit www.abbottdiabetescare.
com and click Worldwide Locations. On the Worldwide Locations page, click the link for your
country or a country near you.
vi
Section 1: Introduction
1 Introduction
The CoPilot Health Management System (“the CoPilot system”) allows people with diabetes,
their caregivers, and healthcare professionals to take a more informed role in managing
diabetes by acting as a data management tool. The CoPilot system tracks health information
and provides graphs, charts and reports that can help people with diabetes and healthcare
professionals evaluate needs and options for a diabetes health management program.
This section introduces and explains the CoPilot system features, installation options, user roles
and activities, terminology, day-to-day procedures, and on-screen navigation for both home
users and healthcare professionals.
All users should read this section to understand key features and capabilities and different ways
that you can use the CoPilot system.
1.1 Modes of Operation
The CoPilot system can be installed in one of two modes or, versions. The Home User version is
for people with diabetes, or their caregivers. The HCP version is for healthcare professionals.
When you install and use the CoPilot system for the first time, you must specify which version
you use.
Both versions appear and operate in very similar ways. Both provide the same tools to record,
track, view and analyze individualized healthcare information. Each version displays slightly
different menus, screens and configuration options to accommodate both the home user and
HCP. This guide provides instructions as needed for each version and type of user.
1.2 Overview of Home User Activities
The CoPilot system allows you to upload, record, store, analyze and share important
information about your glucose readings, insulin, exercise, medication and other health
information.
The following is an overview of typical, routine use of the CoPilot system for home users:
• Install the CoPilot system and set up your profile using easy-to-follow forms, to specify
personal and health information, your glucose targets, and much more.
• Set up user preferences so that the system works best for you.
• Upload test results from your blood glucose meter to the CoPilot system.
• Record your carbohydrate intake, insulin, exercise, state of health, medical exams,
medications, ketones, lab results, and general notes. Keep as much or as little
information as you and your HCP find helpful.
• View and print many types of graphs, charts and reports that will help you understand
and track the progress of your diabetes health management plan.
1
Section 1: Introduction
1.3 Overview of HCP User Activities
As a healthcare professional, you can use the CoPilot system to observe trends and patterns in
your patients’ glucose readings, and to review exercise, medication and other health
information.
The following is an overview of typical, routine use of the CoPilot system for healthcare
professionals:
• Install the CoPilot system and set up your HCP profile using easy-to-follow forms.
• Set up user preferences and system options.
• Set up a patient profile for each patient with a supported device.
• View and print charts, graphs and reports.
• View a Group Analysis Report for a summary of all patient data.
• Configure multiple HCP profiles and groups of patients.
1.4 CoPilot System Terminology
The following terms are used in the CoPilot Health Management System and this User’s Guide:
Healthcare Professional - A healthcare professional (HCP) is a physician, nurse practitioner,
certified diabetes educator (CDE), or other healthcare professional authorized to provide care
to patients with diabetes; a healthcare group or entity such as a clinic; or case manager.
Home User - A home user is a person with diabetes, or their caregiver. (In the HCP version, a
home user is called a “patient.”)
Profile - Each home user and HCP creates a profile. The home user profile is a collection of
personal information, and the CoPilot system preferences, permissions and options. The HCP
profile is a collection of professional identification, health management preferences, and the
CoPilot system options.
Data - Information recorded by any supported medical device and uploaded to the CoPilot
system. See Appendix C for a list of supported devices, and the data collected and uploaded.
Health Information - Personal and medical information recorded by (or for) a patient.
Information categories include: Glucose Readings, Insulin Doses, Meals, Exercise, State of
Health, Medications, Medical Exams, Lab Results, Ketone Readings, and General Notes.
Reports - Reports are charts, graphs, and tables generated by the CoPilot system. There are at
least 11 types of reports. You can use powerful filters to select the types of data, date ranges,
etc., that you would like to view. You can also save, print, email and Fax (with installed Fax
software) any report that you generate.
Database - All the CoPilot system information is stored in a database file. Database information
can be archived, exported and imported. Database files can be backed-up, copied and stored to
ensure data integrity and safekeeping.
2
Section 1: Introduction
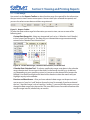
1.5 Organization and Topics in this Guide
The table below provides an overview of sections and topics.
Note: When needed, this guide provides instructions specifically for the home user or
HCP. If no specification is indicated, the instructions are the same for both.
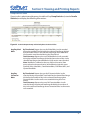
Section
Topics
Preface
CoPilot System Overview; Intended Use; Purpose and Scope; Computer
Requirements; Technical Support and Customer Care
1. Introduction
Modes of Operation; Home User Activities; HCP User Activities; CoPilot System
Terminology; Warning, Caution and Important Messages; CoPilot System Screen
Navigation; Using Help
2. CoPilot System
Installation
Installation Options; CoPilot System Installation; User Mode; Unit of Measure
3. HCP and Home
User Profiles
What is a Home User Profile?; Edit Home User Profile; Add, Delete and Edit Home
User Profiles; Add, Delete and Edit HCP List; Manage Multiple Home Profiles;
What is an HCP Profile? Edit HCP Profile; Manage HCP Profiles; Manage Patient
Profiles; Add, Delete and Edit HCP Profiles
4. Entering Data
Into the CoPilot
System
Uploading Data; Connecting a Device; Undoing a Device Upload; Manual Data
Entry -- Glucose Reading, Insulin Dose, Meal, Exercise, Health, Medication, Exam,
Lab Test, Ketone Reading, Note; Customizing Lists; Importing a Database;
Importing Data; Exporting Data
5. Viewing and
Printing Reports
Opening, Viewing a Report; Printing and Sending Reports; Personalizing
Reports; Glucose Target Modes; Definition of a Day; Descriptions of Reports;
HCP Group Analysis Report
6. Prescribed Plan
Prescribed Plan (for record-keeping only)
7. Managing
Databases
Database Management; Archive Data; View Archived Data; Restore Archived
Data; Back Up the Database; Restore a Database; Restore Log
8. Security
System Administrator Profile; Password Protection; Defining User Rights; User
Rights Options; Assigning Your Own User Rights; Home User Assigning User
Rights; HCP Assigning User Rights
3
Section 1: Introduction
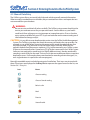
1.6 Warning, Caution and Important Messages in this Guide
Warning, Caution, and Important messages are included throughout this User’s Guide. These
messages warn you to pay careful attention to specific instructions and guidelines for using the
CoPilot system.
Before using the CoPilot system, read each message included in the CoPilot system User’s
Guide. (See Appendix D: Warning, Caution and Important Messages, for a list of all messages.)
Always seek the advice of a healthcare professional before making any change in your lifestyle
or use of medication.
Warning, Caution and Important messages have a very specific meaning. The following list
explains the meaning and purpose of each:
WARNING:
• WARNING indicates possible hazards that, if not avoided, could
result in serious injury or death.
CAUTION: CAUTION indicates possible hazards that can cause harm
to yourself, or to your patients.
IMPORTANT: IMPORTANT indicates that inconvenience to you (such as
loss of text entries or saved settings) may result if you do not follow
instructions.
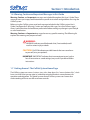
1.7 Getting Around - The CoPilot System Home Page
The CoPilot system uses menus, buttons, icons, tabs, drop-down lists, “mouse-button clicks”, check
boxes, text fields (that you can type in), and other common Windows screen elements for
operation and navigation. This guide assumes that all CoPilot system users have a clear
understanding of how to use these software controls.
4
Section 1: Introduction
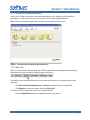
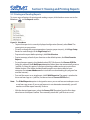
1.7.1 The CoPilot System Home Page
In this User’s Guide, certain terms are used to describe how (or, where to click) to perform
procedures -- such as icon, button, menu and user list. These are explained below.
Tip: To return to the home page from any other screen, click the “Home” icon.
Figure 1. The CoPilot System Home Page (Home User)
1.7.2 Menu Bar
The menu bar provides commands for the CoPilot system features and operations (including
the features that you can use by clicking buttons and icons.)
The following are two examples of how instructions are written for using commands on the
menu bar.
• Click File > Database Maintenance > Archive to export data to an archive file.
• Click Reports on the main menu, and select Diary List.
Also, an instruction may direct you to use an icon or button.
• Click the Read Device button to upload data from your device.
5
Section 1: Introduction
1.7.3 Shortcut Keys
Menu commands, buttons and icons often provide a keyboard shortcut.
Many menu items have shortcut keys, such as Ctrl+P to print.
Many icons have a “popup” (which appears when you hold the mouse pointer over the icon)
that indicates the shortcut key, such as Ctrl+6 to enter a medication event.
1.7.4 Select User, Select HCP, and Select Patient Lists
For Home Users
The Select User list is displayed in the home page in the home user version. The list includes the
system administrator, and at least one home user profile.
Note: If you have more than one home user profile on your system, verify that you select
the correct home user before you upload data, record health information, or change
profile settings.
6
Section 1: Introduction
For HCPs
The Select HCP and Select Patient lists are displayed on the home page in the HCP version.
Note:
Verify that you select the correct patient before you upload data, record health
information, or change profile settings.
1.7.5 Small Icons
Small icons are displayed on the home page under the menu bar. In this User’s Guide, these are
referred to as Icons. For example: Click the Home Icon to return to the home page.
In addition to icons on the home page, several other screens display icons. You can use these
icons as described in procedures.
Home User Icons
Home User Tip: Select UserProfile > User Profile > Options > Show Button Captions to see
button captions.
HCP Icons
HCP Tip: Select UserProfile > HCP Profile > Options > Show Button Captions to see button
captions.
Icons and Associated Actions
Home - Return to the CoPilot system home page.
Read Device - Upload data from a blood glucose meter or other device.
Manual Entry - Record health information events; open the Data Entry screen.
View Reports - Open the Report screen to the default report you select in Options.
User Profile/Patient Profile - Open the home user (or patient) profile to view, or to edit
information.
Help - Open this User’s Guide to the appropriate section for help.
7
Section 1: Introduction
1.7.6 Large Buttons
Large Buttons on the home page provide shortcuts to commonly used actions.
Home User Buttons
HCP Buttons
Buttons and Associated Actions
User List (Home User) - Open the User List to add, edit or delete home users.
Patient List (HCP) - Open the Patient List to add, edit or delete patients.
Read Device - Upload data from a blood glucose meter or other device.
Manual Entry - Record health information events; open the Data Entry screen.
View Report - Open the Report screen to the default report you select in Options.
User Profile (Home User) - Open the profile of the home user selected in the Select User
list to view or edit information.
Patient Profile (HCP) - Open the profile of the patient selected in the Select Patient list to
view or edit information.
8
Section 1: Introduction
1.7.7 Resource Links
If you installed extensions or plug-ins for other devices, additional options appear under
Resource Links. Refer to the documentation provided with your device for more information
about using these links.
1.7.8 CoPilot System Help
Use the help feature in the CoPilot system from virtually any screen or window. There are two
options:
• Click Help > Contents on the menu bar to open the help feature.
• The context-sensitive help option is available in many screens and dialog boxes. Click
Help or the question mark icon, to open the help feature at the appropriate section.
1.7.9 Pictures of the CoPilot System Screens
• In this guide, pictures of the CoPilot system screens may be from either the home version
or HCP version. If the information or procedure is specific to a particular version of the
CoPilot system, the image used is from the relevant version.
• The figures within this guide are intended to serve only as examples. The unit of measure
shown in the figures may therefore not match the units of measure you selected during
installation.
9
Section 2: CoPilot Installation
2 CoPilot System Installation
This section provides detailed installation instructions for the CoPilot Health Management System.
2.1 CoPilot System Installation Overview
Select an Application Mode
When you install the CoPilot system and start the application for the first time, the
CoPilot system asks you to specify if you are a home user, or healthcare professional.
When you make your selection, the CoPilot system completes the final installation step
and enables the version appropriate for you.
Both versions operate and look almost identical. Home users and HCPs use the same
features and follow many of the same procedures. However, there are differences,
and these require separate instructions in this User’s Guide. Separate instructions are
clearly identified for the home user or HCP. Where applicable, be sure to read the
correct instructions.
Note: It is very important to select the right option.
CoPilot System Network Installation
To allow multiple users to work from more than one computer, and to share one
database, you can perform the CoPilot system network installation. This is recommended
only for HCPs who work in a clinical setting with other HCPs. See Appendix E: CoPilot
System Network Installation, for more information.
2.2 Standard Installation Procedure
When you start the CoPilot system for the first time, the application asks you to specify if
you are a home user, or healthcare professional. In addition, the CoPilot system asks you
to select the type of Unit of Measure that you use with your glucose meter. These steps
are a part of the installation procedure.
Before You Install the CoPilot System
• Verify computer requirements as listed in the Preface.
• Save all information and close all running applications.
Note: Please have your glucose meter or other supported device available
during installation.
10
Section 2: CoPilot Installation
2.2.1 Install the CoPilot System
These steps correspond to the CoPilot system installer screens, which provide additional
instructions. Screen names are in Italic.
1. Download the installer file, or obtain the software on a CD-ROM from Customer Care.
2. Start the installer.
• Insert the CD-ROM into the drive. (Most computers start installation automatically.)
–OR–
• Double-click the CoPilot system installer file (CoPilot_Setup.exe).
3. Installation Language - Select the Installation Language, and click OK.
4. Welcome Page - Read the welcome page and click Next to continue or Cancel to quit.
5. License Agreement - The End User Agreement is displayed. Read it, and select I Agree and
then click Next to continue or click Cancel to stop the installation.
6. Confirmation - Click I Confirm to continue. Click I Do Not Confirm to return to the license
agreement.
7. Installation Destination - Verify the installation folder. We recommend that you keep the
preselected folder. (If required, click Browse to select another folder.) Click Next.
8. Start Installation - The installer is ready to begin. Click Next to proceed. Alternatively, click
Back to make changes in previous screens or click Cancel to stop the installation.
9. Installation Progress - A screen shows installation progress.
10. Success Message - Installation is complete. You may need to install additional software if you
use certain devices. Click Finish.
Note: If you use Windows 2000 and see a Remove Shared File message, click No.
11. The CoPilot system icon
is placed on your desktop, and in your Start Menu.
11
Section 2: CoPilot Installation
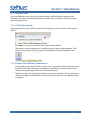
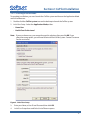
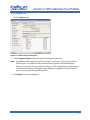
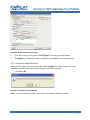
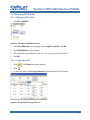
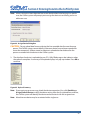
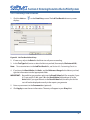
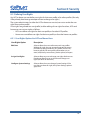
2.2.2 Select Application Mode
To complete installation, you must launch the CoPilot system and choose the Application Mode
and Unit of Measure.
1. Double-click the CoPilot system icon on the desktop to launch the CoPilot system.
2. Initial User Setup - Select the Application Mode, either:
• Home User
• Health Care Professional
Note: If you are a home user, you cannot change this selection after you click OK. If you
select the wrong option, you will need to reinstall the CoPilot system. Contact Customer
Care for assistance.
Figure 2. Initial User Setup
3.
Enter your Name, a User ID and Password then click OK.
4.
Initial User Setup closes and Select Unit of Measure opens.
12
Section 2: CoPilot Installation
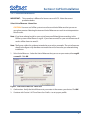
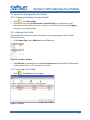
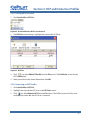
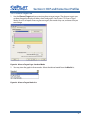
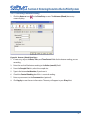
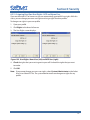
2.2.3 Select Unit of Measure
IMPORTANT: This procedure is different for home users and HCPs. Select the correct
procedure below.
Select Unit of Measure - Home User
CAUTION: You must set CoPilot system to use the same Unit of Measure that you use on
your glucose meter. Selecting the incorrect Unit of Measure can result in misinterpretation
of test results.
Note: If you have selected mg/dL as your unit of measure all blood glucose readings in the
CoPilot system will be shown as mg/dL. If you choose mmol/L as your unit of measure all
results will be shown in mmol/L.
Note: The figures within this guide are intended to serve only as examples. The unit of measure
shown in the figures may therefore not match the units of measure you selected during
installation.
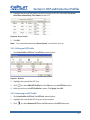
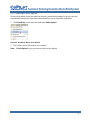
1. Select Unit of Measure - Select the Unit of Measure that you use on your meter, either mg/dL
or mmol/L. Click OK.
Figure 3. Select Unit of Measure - Home User
2. Confirmation - Verify the Unit of Measure in your meter is the same as your choice. Click OK.
3. Continue with Section 3: HCP and Home User Profiles - to set up your profile.
13
Section 2: CoPilot Installation
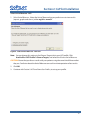
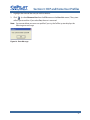
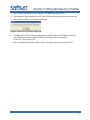
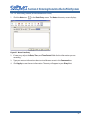
Select Unit of Measure - HCP
1. Select Unit of Measure - Select the Unit of Measure that you prefer to use to view results
(reports, graphs and charts), either mg/dL or mmol/L.
Figure 4. Select Unit of Measure - HCP User
Note: You can change this setting in the Glucose Targets tab in your HCP profile. Click
UserProfile > HCP Profile > Glucose Targets, and select the Glucose Unit of Measure.
CAUTION: Ensure that you discuss results with your patients using the same Unit of Measure that
they use. Confusion about the Unit of Measure can result in misinterpretation of test results.
2. Click OK.
3. Continue with Section 3: HCP and Home User Profiles, to set up your profile.
14
Section 3: HCP and Home User Profiles
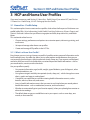
3 HCP and Home User Profiles
If you are a home user, read Section 3.1 Home User - Profile Setup. If you are an HCP, read Section
3.1 Home User - Profile Setup, 3.3 HCP: Setting up Your User Profile.
3.1 Home User - Profile Setup
This section explains how to create and use profiles. It describes the five parts of the home user
profile (called Tabs): User Information, Health Profile, Data Entry Preferences, Glucose Targets, and
Options. Each tab is a form that you fill out using open text fields, drop-down lists, and check
boxes.
This section describes how to:
• Choose settings, preferences and options to customize reports, data entry, printing, and
much more.
• Set up and manage other home user profiles.
• Create and manage HCP profiles in the HCP list.
3.1.1 What is a Home User Profile?
Every home user must set up a home user profile. A profile contains personal information and a
brief medical history. A profile also allows you to select options and preferences that you can
use to specify glucose targets, daily time periods (meals, sleep, etc.), how reports are displayed,
and items that you want to see listed when you record important health information - such as
your medications, exercise, and insulin doses.
Use your profile to specify:
• Your contact information, age, health, weight, type of diabetes, year of diagnosis, other
medical conditions, etc.
• Your glucose targets and daily time periods (meals, sleep, etc.) - which change how some
charts, graphs and reports are displayed.
• Categories you would like to use when entering health information events, such as
ketones, exercise, lab results, and exams.
• Items in health information events that you want to see listed when you record patient
health information - such as medications, exercise, and insulin doses.
• Whether to automatically print your favorite report(s) when you upload glucose meter or
other device readings.
• The default date-range you would like to see in your reports such as seven days, one
month, or three months.
15
Section 3: HCP and Home User Profiles
Note: Preferences and settings in your profile affect your use of the manual entry and reports
features in the CoPilot system. For more information that will help you complete your
profile, read Section 4: Entering Data into the Copilot System, and Section 5: Viewing and
Printing Reports
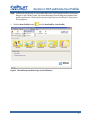
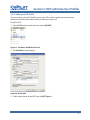
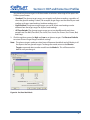
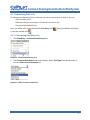
1. Click the User Profile button
(or click UserProfile > User Profile.)
Figure 5. The CoPilot System Home Page: User Profile Menu
16
Section 3: HCP and Home User Profiles
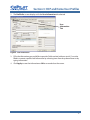
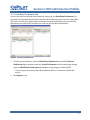
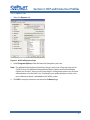
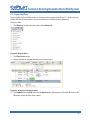
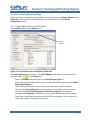
2. The Profile for: screen displays with the User Information tab selected.
User
Information
Tab
Figure 6. User Information
3. Fill in the information you would like to provide. Fields marked with an asterisk (*) must be
filled in to create a profile. Add information by selecting items from drop-down boxes or by
typing information.
4. Click Apply to save the information or OK to save and close the screen.
17
Section 3: HCP and Home User Profiles
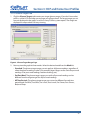
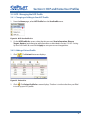
3.1.2 Health Profile Tab
1. Click the Health Profile tab and fill in the items listed under General.
Figure 7. Health Profile Information
2. Select Click here to add a new Condition, and type a condition to add to the list.
3. Click Apply to add the new condition to the list.
4. Add another condition, if needed.
5. Click Apply to save.
18
Section 3: HCP and Home User Profiles
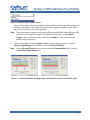
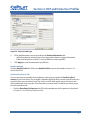
3.1.3 Data Entry Preferences Tab
You can save time in manually entering data by setting up your Data Entry Preferences. For
example, if you regularly take a certain type of insulin at a particular dose, you can enter it here.
The same is true for your regular exercise routines and other medications you may take. The
information you enter here is listed for you when you go to make manual entries.
Figure 8. Data Entry Preferences
1. To enter your preferences, select the Data Entry Preferences tab and fill in Exercise
Preferences (type, duration, intensity); Insulin Preferences (insulin name/type, dosage,
type); and Medication Preferences (medication name, dosage, number of pills).
• You can type in a new entry that will be added to the list, or select one of the listed
entries.
2. Click Apply to save.
19
Section 3: HCP and Home User Profiles
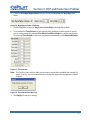
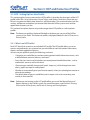
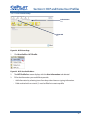
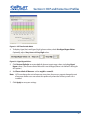
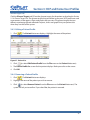
3.1.4 Glucose Targets Tab
1. Click the Glucose Targets tab to enter your target glucose ranges. If you don’t know what
to fill in, ask the HCP who helps you manage your glucose levels. The target ranges you set
here are displayed in the graph, as well as in many CoPilot system reports. The ranges are
displayed in unique colours for easy viewing.
Figure 9. Glucose Target Ranges Page
2. You may view the graph in three modes. Select the desired mode from the Mode list:
• Standard: The glucose target ranges you set apply to all glucose readings, regardless of
when the glucose reading is taken. (For example, target ranges are the same for pre-meal
readings as for post-meal readings, bedtime readings, etc.)
• Pre/Post Meal: The glucose target ranges you set for all pre-meal readings can be
different from the target ranges for all post-meal readings.
• All Time Periods: The glucose target ranges you set can be different for each time
period listed: Pre-Bkfst, Post-Bkfst, Pre-Lunch, Post-Lunch, Pre-Dinner, Post-Dinner,
Bed, and Sleep.
20
Section 3: HCP and Home User Profiles
Figure 10. Glucose Targets, Mode Selection
You should set glucose targets in all three modes to take best advantage of the reports the
CoPilot system creates. For a table of the reports that use glucose targets and the modes
they use, see Section 5.4: Glucose Target Modes.
Note: The glucose targets mode you select here will become the default and will display in all
the reports that use glucose targets. To change the mode, return to the Glucose
Targets screen and select another mode from the Mode list. This will become the
default until you change it.
3.
Click on the up/down arrows for High and Low to set your glucose targets. To restore
Glucose Target Ranges to the default ranges, click Restore Defaults.
Note: Clicking Restore Defaults also restores the mode to Standard Mode and un-checks
the Use Hypo/Hyper Values box.
Figure 11. Pre/Post Meal Mode with Hypo/Hyper Checked (left); All Time Periods Mode (right)
21
Section 3: HCP and Home User Profiles
4. Check the Use Hypo/Hyper Values box to activate the Very Low and Very High data
fields.
Figure 12. Hypo/Hyper Values Check Box
5. Click the up/down arrows for Very Low and Very High to change these values.
6. To customize the Time Periods to your normal daily schedule, click the up/down arrows
next to a time period (for example, Pre-Bkfst, Post-Bkfst, Sleep, etc.) to change the time.
To restore all Time Periods to the times shown here (the defaults), click Restore Defaults.
Figure 13. Time Periods
Note: The CoPilot system will not allow you to enter a normal daily schedule that exceeds 24
hours. If you try, you will receive an error message. Re-adjust the time periods to equal
24 hours.
Figure 14. Time Period Error Message
7. Click Apply to save your settings.
22
Section 3: HCP and Home User Profiles
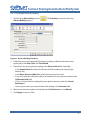
3.1.5 Options Tab
1. Click the Options tab.
Figure 15. Profile and System Options
2. Under Program Options, check the boxes for the options you want.
Note: For additional information on Data Entry Options see Section 4: Entering Data into the
CoPilot System. For additional information on Report Options and Favorite Report
Options see Section 5: Viewing and Printing Reports. After reading these sections, be sure
to select only the options that apply to your diabetes management. This will simplify
your use, entry, and viewing of data/events.
3. Click Apply to save your selections.
23
Section 3: HCP and Home User Profiles
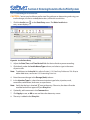
3.2 Home User: Managing Your User Profile
3.2.1 Changing or Updating Your User Profile
1. Click
on the Home Page.
2. Click the tab you want (User Information, Health Profile, etc.) and change or add
information as described in Section 3.1: Home User - Profile Setup. Be sure to click Apply to
save your new or changed data.
3.2.2 Adding a User Profile
Some households may have more than one home user managing glucose levels. To add
another home user:
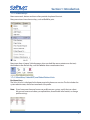
1. On the Home Page, select Add User from the File menu.
Figure 16. File Menu: Add User
2. The Profile for: screen displays with the User Information tab selected. Fill in information
as described in Section 3: HCP and Home User Profiles.
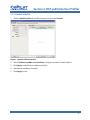
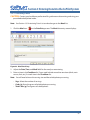
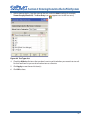
3.2.3 Removing a User Profile
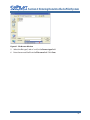
1. Click
. The User List screen displays.
Figure 17. User List
24
Section 3: HCP and Home User Profiles
2. Highlight the name of the user you wish to remove.
3. Click
(or select Remove User from the File menu on the User List screen). The system
will ask you to confirm. If you select Yes, the user is removed.
Note: You cannot delete your own user profile. If you try, the CoPilot system displays the
following error message:
Figure 18. Error Message
25
Section 3: HCP and Home User Profiles
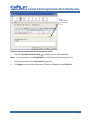
3.2.4 Adding an HCP Profile
You can create as many HCP profiles as you want. This is often a good way to store names,
addresses, and other information about your doctors, clinics, etc.
To add an HCP:
1. From the File menu on the menu bar, select Add HCP.
Figure 19. File Menu: Add HCP Command
2. The Profile for: screen displays.
Figure 20. HCP Profile
3. Select a description of the HCP from the HCP Type list.
26
Section 3: HCP and Home User Profiles
Figure 21. HCP Type List
• Select the type of HCP from the list.
• If you don’t see the one you want, type in a description
(for example, Case Manager).
4.
If you know it, fill in the rest of the information for the HCP.
5.
Click OK to save the information and exit.
27
Section 3: HCP and Home User Profiles
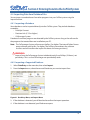
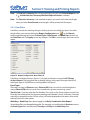
3.2.5 Editing an HCP Profile
1. Click UserProfile > HCP List.
Figure 22. UserProfile Menu: HCP List Command
2. The HCP List screen displays. Highlight the name of the HCP User.
Figure 23. HCP List
3. Click
(or select Edit HCP Profile from the File menu). The Profile for: screen for the
HCP User displays.
4. Make your edits on the screen. When done, click OK.
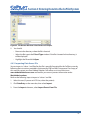
3.2.6 Removing an HCP Profile
1. Click UserProfile > HCP List.
2. Highlight the name of the HCP User on the HCP List screen.
(or select Remove HCP from the File menu). The CoPilot system will ask you to
3. Click
confirm. If you select Yes, the HCP User is removed.
28
Section 3: HCP and Home User Profiles
3.3 HCP - Setting Up Your User Profile
This section explains how to create and use HCP profiles. It describes the three parts of the HCP
profile (called Tabs): User Information, Glucose Targets, and Options. Each tab is a form that you
fill out using open text fields, drop-down lists, and check boxes. This section describes how the
settings, preferences and options you choose affect how the CoPilot system works and the
appearance of reports you use.
This section also explains how to set up and manage other HCP profiles, as well as patient
profiles.
Note: The home user profile is displayed (labeled) in the home user version of the CoPilot
system as User Profile. The home user profile is displayed (labeled) in the HCP version as
Patient Profile.
3.3.1 What is an HCP Profile?
Each HCP should set up and use an individual HCP profile. The HCP profile allows you to set
options and preferences, to customize how you would like to work with patient information,
reports, and other application features.
You can use your profile to specify the following, and more:
• Categories you would like to use when entering patient health information events, such
as blood ketones, exercise, lab tests, and exams.
• Items that you want to see listed when you record patient health information - such as
medications, exercise, and insulin doses.
• Glucose targets and daily time periods (meals, sleep, etc.), which change how some
charts, graphs and reports are displayed.
• Whether to automatically print your favorite report(s) when you upload glucose meter or
other device readings.
• The default date-range you would like to see in reports such as last seven days, one
month, or three months.
Note: Preferences and settings in the HCP profile affect your use of the Manual Entry and
Reports features in the CoPilot system. For more information, read Section 4: Entering
Data into the CoPilot System, and Section 5: Viewing and Printing Reports.
29
Section 3: HCP and Home User Profiles
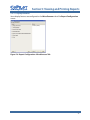
3.3.2 HCP Profile Setup
Select Patient
List
Select HCP
List
Figure 24. HCP Home Page
1.
Click UserProfile > HCP Profile.
Figure 25. HCP: UserProfile Menu
2.
The HCP Profile for: screen displays with the User Information tab selected.
3.
Fill in the information you would like to provide.
• Add information by selecting items from drop-down boxes or typing information.
• Fields marked with an asterisk (*) must be filled in to create a profile.
30
Section 3: HCP and Home User Profiles
Figure 26. HCP User Information Page
4.
If you don’t see your HCP type in the HCP Type list, you can type a description.
5.
Click Apply to save the information you filled in, or click OK to save the information.
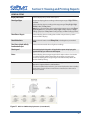
3.3.3 Automatic Report Printing
When you fill in information for a new profile and click Apply, the CoPilot system asks if you
would like to enable automatic printing of reports after device upload.
• Click Yes or No.
Figure 27. Automatic Printing Option
Note:
You can enable this option at any time, in the Options tab of your profile.
31
Section 3: HCP and Home User Profiles
3.3.4 Glucose Targets Tab
1. Use the Glucose Targets tab to customize glucose target ranges. The glucose targets you
set here change the display of tables, charts and graphs. See Section 5.4: Glucose Target
Modes, for a list of reports that use glucose targets, the modes they use, and ones that you
can change.
Figure 28. Glucose Targets Page: Standard Mode
2. You may view the graph in three modes. Select the desired mode from the Mode list.
Figure 29. Glucose Targets Mode List
32
Section 3: HCP and Home User Profiles
You should set glucose targets in all three modes to take best advantage of the reports the
CoPilot system creates.
• Standard: The glucose target ranges you set apply to all glucose readings, regardless of
when the glucose reading is taken. (For example, target ranges are the same for pre-meal
readings as for post-meal readings, bedtime readings, etc.)
• Pre/Post Meal: The glucose target ranges you set for all pre-meal readings can be
different from the target ranges for all post-meal readings.
• All Time Periods: The glucose target ranges you set can be different for each time
period listed: Pre-Bkfst, Post-Bkfst, Pre-Lunch, Post-Lunch, Pre-Dinner, Post-Dinner, Bed,
and Sleep.
3. Click the up/down arrows for High and Low to set glucose targets. Click Restore Defaults
to restore Glucose Target Ranges to default settings.
Note: The glucose targets mode you select here will become the default and will display in all
the reports that use glucose targets. To change the mode, return to the Glucose
Targets screen and select another mode from the Mode list. This will become the
default until you change it.
Figure 30. Pre/Post Meal Mode
33
Section 3: HCP and Home User Profiles
Figure 31. All Time Periods Mode
4. To display Hypo (low) and Hyper (high) glucose values, check Use Hypo/Hyper Values.
Optionally, adjust Very Low and Very High values.
Figure 32. Hypo/Hyper Values
5. Click Restore Defaults to restore default glucose target range values, including Hypo/
Hyper values. (The Glucose Unit of Measure is not changed; there is no “default” setting for
this option.)
6. Set Glucose Unit of Measure - either mg/dL or mmol/L.
Note: HCPs can change the unit of measure at any time. Home users cannot change the unit
of measure. Home users can select this option only when the CoPilot system is first
installed.
7. Click Apply to save your settings.
34
Section 3: HCP and Home User Profiles
3.3.5 Options Tab
1. Select the Options tab.
Figure 33. HCP Profile Options Page
2. Under Program Options, check the boxes for the options you want.
Note: For additional information on Data Entry Options see Section 4: Entering Data into the
CoPilot System. For additional information on Report Options and Favourite Report
Options see Section 5: Viewing and Printing Reports. Setting these options can save time
when patients arrive for clinic visits. For example, your preferred reports can be set to
print whenever a device is uploaded to the CoPilot system.
3. Click OK to save your selections and return to the Home page.
35
Section 3: HCP and Home User Profiles
3.4 HCP - Managing the HCP Profile
3.4.1 Changing or Adding to Your HCP Profile
1. From the Home page, select HCP Profile from the UserProfile menu.
Figure 34. HCP: UserProfile List
2. On the HCP Profile for: screen, select the tab you want (User Information, Glucose
Targets, Options) and change or add information as described in Section 3.3: HCP - Setting
Up Your User Profile. Be sure to click Apply to save your new or changed data.
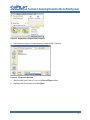
3.4.2 Adding a Patient Profile
1. Click
. The Patient List screen displays.
Figure 35. Patient List
2. Click
. The Patient Profile for: screen displays. The form is similar to the form you filled
in to set up your HCP profile.
36
Section 3: HCP and Home User Profiles
Figure 36. Patient Profile Page
3.
Fill in the information you can provide on the Patient Information tab.
• Add information by selecting items from drop-down boxes or typing information.
• Fields marked with an asterisk (*) must be filled in to create a profile.
4.
Click Apply to save the information you filled in.
Health Profile Tab
Click the Health Profile tab. Fill out the Health Profile screen as described in Section 3.1.2:
Health Profile Tab.
Data Entry Preferences Tab
You can save time in manually entering data by setting up your patient’s Data Entry Preferences (if you know them). For example, if a patient regularly takes a certain type of insulin at a
particular dose, you can enter it here. The same is true for their regular exercise routines and
other medications they may take. The information you enter here is listed for you when you go
to make manual entries.
1. Click the Data Entry Preferences tab. Fill out the preferences for the patient as described
in Section 3.1.3: Data Entry Preferences Tab.
37
Section 3: HCP and Home User Profiles
Glucose Targets Tab
Click the Glucose Targets tab. Fill out the glucose targets for the patient as described in Section
3.1.4: Glucose Targets Tab. The glucose targets that you define in your own (HCP) profile are used
as parameters in the reports, charts and graphs that you view. The glucose targets that you
define in a patient profile are reflected in reports, charts and graphs that your patient sees
when they use the CoPilot system.
3.4.3 Editing a Patient Profile
1. Click
. The Patient List screen displays. Highlight the name of the patient.
Figure 37. Patient List
2. Click
(or select Edit Patient Profile from the File menu on the Patient List screen).
3. The Patient Profile for: screen for that patient displays. Make your edits on the screen.
4. Click OK.
3.4.4 Removing a Patient Profile
1. Click
. The Patient List screen displays.
2. Highlight the name of the patient you wish to remove.
3. Click
(or select Remove Patient from the File menu on the Patient List screen). The
system will ask you to confirm. If you select Yes, the patient is removed.
38
Section 3: HCP and Home User Profiles
3.5 Managing HCP Profiles
3.5.1 Adding an HCP Profile
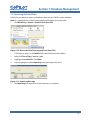
1. Click File > Add HCP.
Figure 38. File Menu, Add HCP Command
2. The Units of Measure screen displays. Select mg/dL or mmol/L. Click OK.
3. The HCP Profile for: screen displays.
4. Fill in the fields as described in Section 3.3: HCP—Setting Up Your User Profile.
5. Click OK.
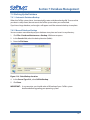
3.5.2 Assigning an HCP
1. Click
2. Click
. The Patient List screen displays.
.
3. On the next screen, click Assign Patients to: and select the HCP from the list.
Figure 39. Assign Patients Drop-down List
39
Section 3: HCP and Home User Profiles
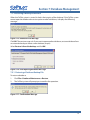
4. Highlight the name of the patient you want to assign to this HCP and select the Access
Level (None, Read Only, Full, Owner) for the HCP.
Figure 40. Access Levels
5. Click OK.
Note:
For more information about Access Levels, see Section 8: Security.
3.5.3 Editing an HCP Profile
1. Click UserProfile > HCP List. The HCP List screen displays.
Figure 41. HCP List
2. Highlight the name of the HCP User.
3. Click
(or select Edit HCP Profile from the File menu on the HCP List screen).
4. Make your edits on the HCP Profile for: screen. Click Apply, then OK.
3.5.4 Removing an HCP Profile
1. Click UserProfile > HCP List. The HCP List screen displays.
2. Highlight the name of the HCP User you wish to remove.
3. Click
(or select Remove HCP from the File menu on the HCP List screen).
40
Section 3: HCP and Home User Profiles
4. The CoPilot system will ask you to confirm. Click Yes to remove the HCP.
5. If local patients are assigned to this HCP, the CoPilot system prompts you to reassign the
patients to another HCP on the local computer:
Figure 42. Reassign Local Patients Message
6. Click OK. Select the HCP you are attempting to remove from the HCP Select List on the
Home Page and reassign the HCP’s patients to another HCP as described in
Section 3.5.2: Assigning an HCP.
7. After reassigning the patients, follow Steps 1 through 4 (above) to remove the HCP.
41
Section 4: Entering Data Into the CoPilot System
4 Entering Data Into the CoPilot System
There are three ways to enter events (data) into the CoPilot system. Each of these methods is
explained in the corresponding section, below.
• Uploading Data from a Device
• Manual Data Entry
• Importing Data from Database Files
This section also explains how to export data.
CAUTION: The CoPilot system assumes a single glucose calibration type, either
plasma or whole blood.
4.1 Uploading Data from a Device
Use the CoPilot system to upload data from all supported Abbott Diabetes Care blood glucose
monitoring systems. For a list of supported devices, see Appendix C: Supported Devices and
Databases.
Data from the Deltec Cozmo Insulin Pump and the FreeStyle Navigator System can be directly
uploaded to the CoPilot system by installing the appropriate software for these devices where
available. For more information, view the User’s Guide provided with each device.
You can also import data from CoZmanager, the software program for storing CozMore System
data where available. For more information, see Section 4.4: Importing Data from Database Files.
IMPORTANT: To avoid losing data, upload data from your device often. Most devices hold
only a limited number of historical records.
4.1.1 Connecting a Device to Your Computer
Before uploading, you must connect the device to an available COM port or USB port on your
computer using an approved data cable for that device.
• One end of the data cable attaches to the device; the other end attaches to the computer.
• The connectors on the data cable will fit only into the appropriate ports on the PC and
monitoring device.
WARNING:
• To avoid the possibility of electrical shock, never perform a blood glucose test while the
meter is connected to the computer.
42
Section 4: Entering Data Into the CoPilot System
CAUTION: Ensure that the time and date are set correctly on your personal computer and
other devices.
IMPORTANT: Always refer to the user’s guide that came with your device or pump for
complete instructions on its use.
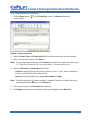
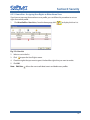
4.1.2 Uploading from a Device
IMPORTANT: Any data you previously uploaded from a device will not be overwritten when
you upload again from that same device. Only the new data will be added to your file.
Connect the device to the computer.
1. On the Home page, select the user whose data is being uploaded from the device.
2. Click DataEntry on the menu bar; and select Read Abbott BG Meter. (Or, click the Read
Device button on the home page.)
Figure 43. DataEntry Menu: Read Abbott BG Meter
CAUTION: When uploading glucose data from a device, the CoPilot system does not
differentiate between devices that are whole-blood or plasma calibrated. The CoPilot
system merely uploads the data with no calculations made. Because there are slight
differences between the two calibrations, you should not mix data from devices that use
different calibration references. It is possible to enter duplicate data entries into the CoPilot
Health Management System.
The CoPilot system does not check the accuracy of the data the user provides. For example,
a user of the Deltec Cozmo insulin pump might record the carbohydrates for a meal (for
example, 25 g) and enter it into the Deltec Cozmo software. When the user uploads the data
from the pump, a meal entry (25 g) will be created in your CoPilot system. If the user also
manually enters a meal entry (25 g) for that same meal in the CoPilot Software, two meal
entries would result (at slightly different times), thereby accidentally recording a total of
50 g for the meal. The user must take reasonable precautions to prevent duplication errors.
For example, choose one location for recording certain data types (i.e., on a single device or
in a particular software program).
43
Section 4: Entering Data Into the CoPilot System
Note: When a device has been detected but cannot be identified as belonging to a specific
user, the CoPilot system will prompt you to assign the device to an existing user or to
add a new user:
Figure 44. Assign Device Dialog Box
CAUTION: Do not upload data from any device that has recorded data for more than one
person. The CoPilot system cannot identify if data on a device has ever been recorded for
more than one person. All data stored on a device is uploaded to the database for the
person associated with the device in the CoPilot system.
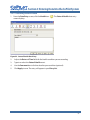
3. The data from the device is uploaded to your PC. A fully filled progress bar indicates when
the upload is complete. A summary of the upload displays in a pop-up window. Press OK to
continue.
Figure 45. Upload Summary
Note: If you receive an error message, check the device connection. Also, click DataEntry >
Assign Default Device to verify the device setting. After the first upload from a device,
the CoPilot system will identify that device and associate it with the assigned user.
Note: More than one device may be associated with a single user.
44
Section 4: Entering Data Into the CoPilot System
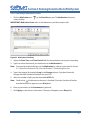
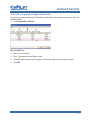
4.1.3 Undoing a Device Upload
You can easily delete (undo) the data from the most recent device upload as long as you have
not manually entered any other data, selected another user, or closed the application.
1. Click DataEntry on the menu bar; and select Undo Upload.
Figure 46. DataEntry Menu: Undo Upload
2. The CoPilot system will undo your last upload.
Note: If Undo Upload is grey, you cannot undo the last upload.
45
Section 4: Entering Data Into the CoPilot System
4.2 Manual Data Entry
The CoPilot system allows you to add, edit, hide, and unhide manually entered information.
When manually recorded events are hidden, they are omitted from views and reports but are
not removed from your database.
WARNING:
• Be sure to enter and check all values carefully. The CoPilot system cannot check that the
entries you make are correct for your personal needs. Serious effects on your health
could result from relying on or using improper or incomplete entries. Discuss the data
entry options available with your HCP so you are both clear on the amount and types of
information for therapy analysis.
CAUTION: It is possible to enter duplicate data entries into the CoPilot Health Management
System. The CoPilot system does not check the accuracy of the data the user provides. For
example, a user of the Deltec Cozmo insulin pump might record the carbohydrates for a
meal (for example, 25 g) and enter it into the Deltec Cozmo software. When the user
uploads the data from the pump, a meal entry (25 g) will be created in your CoPilot system.
If the user also manually enters a meal entry (25 g) for that same meal in the CoPilot system
Software, two meal entries would result (at slightly different times), thereby accidentally
recording a total of 50 g for the meal. The user must take reasonable precautions to prevent
duplication errors. For example, choose one location for recording certain data types (i.e.,
on a single device or in a particular software program).
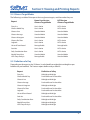
Manually recordable events include the categories listed below. Their icons are pictured with
them. These icons are displayed in the Diary List to represent the type of event on the list; see
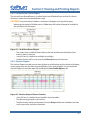
Section 5.6.1: Diary List.
Icon
Event
Glucose reading
Glucose Control reading
Bolus Insulin
Meal
Exercise
State of health
46
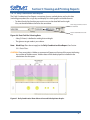
Section 4: Entering Data Into the CoPilot System
Medication
Medical exam
Lab Test Result
Ketones (blood)
Ketone Control readings
Notes (miscellaneous events, etc.)
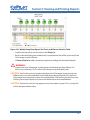
47
Section 4: Entering Data Into the CoPilot System
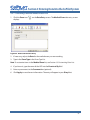
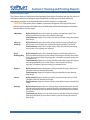
4.2.1 Entering a Glucose Reading
1. Click the large Manual Entry button
Glucose Reading displays.
. The Data Entry screen for entering a
Figure 47. Glucose Reading Data Entry
2. If the date, time, and time period of the glucose reading is different from the current
display, adjust the Date, Time, and Time Period.
3. Record the value of your glucose reading in the Glucose Value field. Optionally:
• In the Sample Site field, select the site from which the reading was taken (finger,
forearm, etc.).
• In the Hours Since Last Meal field, select the time of your last meal.
• If you wish, enter the calibration code or lot number from your glucose monitor in the
Calibration Code field.
• If this is a Control Solution reading from your glucose monitor, check the Control
Reading box.
• Enter any comments you may have about the reading in the Comment field.
4. Because you are entering data at the keyboard, the Data Source is set to Manual.
5. Click Apply to save your data.
48
Section 4: Entering Data Into the CoPilot System
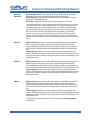
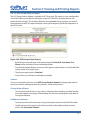
4.2.2 Recording an Insulin Dose
CAUTION: Contact your healthcare professional for guidance on determining and using your
insulin dosages, insulin-to-carbohydrate ratios, and insulin sensitivities.
1. Click the Insulin icon
entry screen displays.
on the Data Entry screen. The Bolus Insulin data
Figure 48. Insulin Data Entry
2. Adjust the Date, Time, and Time Period fields for the insulin dose you are recording.
3. Click directly under the Insulin Name/Type column, and select or type in the name
of your insulin.
Note: To add items to the Insulin list, refer to Section 3.1.3: Data Entry Preferences Tab. Also, to
add or hide items, see Section 4.3: Customizing Data Lists.
4. Enter the correct dosage in the Dosage (Units) column.
5. In the Injection Type list, select the correct injection type: bolus, injection, meal,
correction, combination, dual wave, or square wave.
Note: Verify that the box is checked
next to the entry. Otherwise, the data will not be
recorded and will not appear on your Diary List.
6. Optionally, add a comment in the Comment box.
7. Click Apply to save, or OK to save and close the data entry screen.
8. The entry is added to the Diary List.
49
Section 4: Entering Data Into the CoPilot System
4.2.3 Recording a Meal
CAUTION: Contact your healthcare professional for guidance on determining and using your
prescribed carbohydrate intake.
Note: See Section 4.3: Customizing Data Lists to make changes to the Meals list.
1. Click the Meal icon
on the Data Entry screen. The Meal data entry screen displays.
Figure 49. Meal Data Entry
2. Adjust the Date, Time, and Meal fields for the meal you are entering.
3. Enter an item in the Food Item list. If your meal includes more than one item (drink, main
course, fruit, etc.), list each item in the Food Item list.
Note: You will need to know the serving size and the carbohydrates per serving.
• Svgs: Select the number of servings.
• Carbs (g): Enter the grams of carbohydrates per serving.
• Total Carbs (g): Total grams of carbohydrates.
50
Section 4: Entering Data Into the CoPilot System
Total
Carbohydrates
for a multi-item
meal
Figure 50. Multi-Item Meal with Total Carbohydrates Shown
4.
Check the Use Only Favorite Foods
Note:
to display your list of favorite foods.
To customize items in the Food Item list, see Section 4.3: Customizing Data Lists .
5.
Enter any comments in the Comment box (optional).
6.
Click Apply to save the new information. The entry will appear in your Diary List.
51
Section 4: Entering Data Into the CoPilot System
4.2.4 Recording Exercise Activity
1. Click the Exercise icon
screen displays.
on the Data Entry screen. The Exercise data entry
Figure 51. Exercise Data Entry
2. Adjust the Date, Time, and Time Period fields for the exercise activity you are entering.
3. Enter an or select an activity in the Type list.
Note: To customize (add or hide) items in the Exercise list, refer to instructions for the Section
3.1.3: Data Entry Preferences Tab. Also, see Section 4.3: Customizing Data Lists.
4. Select the Duration, and Intensity of the activity.
• Duration: Length of activity (in minutes and hours: 0:30, 1:15, etc.). You can select from
the list or type in the duration of the activity.
• Intensity: Intensity of the activity (none, low, medium, or high).
next to the entry is checked. Otherwise, the data will not be
Note: Confirm that the box
recorded and will not appear on your Diary List.
5. Enter any comments in the Comment box (optional).
6. Click Apply to save the new information. The entry will appear in your Diary List.
52
Section 4: Entering Data Into the CoPilot System
4.2.5 Recording State of Health
1. From the Data Entry screen, click the Health icon
screen displays.
. The State of Health data entry
Figure 52. State of Health Data Entry
2.
Adjust the Date and Time fields for the health condition you are recording.
3.
Type in or select the State of Health event.
4.
Use the Comment box to further describe your condition (optional).
5.
Click Apply to save. The entry will appear in your Diary List.
53
Section 4: Entering Data Into the CoPilot System
4.2.6 Recording a Medication Event
1. Click the Medication icon
screen displays.
on the Data Entry screen. The Medication data entry
IMPORTANT: Medication Event refers to all medications you take except insulin.
Figure 53. Medication Data Entry
2. Adjust the Date, Time, and Time Period fields for the medication event you are recording.
3. Type in or select the name of your medication in the Medication list.
Note: To customize (add or hide) items in the Medication list, refer to instructions for Section
3.1.3: Data Entry Preferences Tab. Also, see Section 4.3: Customizing Data Lists .
4. Type in the dosage (for example, 2 mg) in the Dosage column. If you don’t know the
dosage, check the medication bottle or ask your HCP.
5. Select the number of pills you take from the # of Pills list.
the box next to the entry is checked. Otherwise, the data will not be
Note: Confirm that
recorded and will not appear on your Diary List.
6. Enter any comments in the Comment box (optional).
7. Click Apply to save the new information. The entry will appear in your Diary List.
54
Section 4: Entering Data Into the CoPilot System
4.2.7 Recording a Medical Exam/Doctor Visit
1. Click the Exam icon
displays.
on the Data Entry screen. The Medical Exam data entry screen
Figure 54. Medical Exam Data Entry
2. If necessary, adjust the Date for the medical exam you are recording.
3. Type in the Exam Type in the Exam Type list.
Note: To customize items in the Medical Exam list, see Section 4.3: Customizing Data Lists .
4. If you know it, type the name of the HCP into the Examined By field.
5. Enter any comments in the Comment box (optional).
6. Click Apply to save the new information. The entry will appear in your Diary List.
55
Section 4: Entering Data Into the CoPilot System
4.2.8 Recording a Lab Test Result
1. Click the Lab icon
displays.
on the Data Entry screen. The Lab Test Result data entry screen
Figure 55. Lab Test Result Data Entry
2. If necessary, adjust the Date for the lab test result you are recording.
3. In the Test Type field, enter or select the lab test you had (for example, Cholesterol LDL).
Note:
To customize items in the Lab Test Result list, see Section 4.3: Customizing Data Lists.
4. If you know the Result Value, the Units, and the Reference Range for the lab test you had,
type the information into the appropriate fields.
IMPORTANT: Be careful to type numbers only into the Result Value field. For example, if your
A1C test result is 7.6%, type 7.6 in the Result Value field and type % in the
Units field. If you type the units in the Result Value field, the entry for this lab
test will not be displayed correctly in the reports you generate.
5. Enter any comments in the Comment box (optional).
6. Click Apply to save the new information. The entry will appear in your Diary List.
56
Section 4: Entering Data Into the CoPilot System
4.2.9 Recording a Ketone Reading
1. Click the Ketones icon
screen displays.
in the Data Entry screen. The Ketones (Blood) data entry
Figure 56. Ketones (Blood) Data Entry
2. If necessary, adjust the Date, Time, and Time Period fields for the ketone reading you are
recording.
3. Enter the result of the ketone reading in the Value (mmol/L) field.
4. From the Sample Site list, select the sample site.
5. Type in the ketone Lot Number, if you know it.
6. Check the Control Reading box if this is a control reading.
7. Enter any comments in the Comment box (optional).
8. Click Apply to save the new information. The entry will appear in your Diary List.
57
Section 4: Entering Data Into the CoPilot System
4.2.10 Recording a Note (or Miscellaneous Event)
1. Click the Note icon
in the Data Entry screen. The Notes data entry screen displays.
Figure 57. Notes Data Entry
2. If necessary, adjust the Date, Time, and Time Period fields for the information you are
recording.
3. Type your note or information about a miscellaneous event in the Comment box.
4. Click Apply to save the new information. The entry will appear in your Diary List.
58
Section 4: Entering Data Into the CoPilot System
4.3 Customizing Data Lists
To make manual data entry faster and easier, you can customize items in the lists. You can:
• Add new items to lists
• Hide items that you want keep in a list but do not want to see
• Designate favorite food items
Items you add to a list are marked with the User Entry icon
.
system are marked with
. Items provided by the CoPilot
4.3.1 Customizing Data Entry Lists
1. Click DataEntry > Customize Data Entry Lists.
Figure 58. Customize Data Entry Lists
2. The Customize Data Entry Lists screen displays. Select Test Types (or other desired list)
from the Select List to Customize list.
Figure 59. Select List to Customize List
59
Section 4: Entering Data Into the CoPilot System
3. Add an item to the list. Type the name of the test under the Item heading (for example,
appears next to the new entry.
Serum theophylline level). The User Entry icon
Figure 60. Test Types List
4. Check the Hide box for items that you don’t want to see listed when you record a test result.
For the Food Item list you can also mark an item as a favorite.
5. Click Apply to save the new list item(s).
6. Click OK to close.
60
Section 4: Entering Data Into the CoPilot System
4.4 Importing Data from Database Files
You can import some databases from other programs into your CoPilot system using the
Import function.
4.4.1 Importing a Database
Some databases can be imported directly into the CoPilot system. They include databases
created by:
• FreeStyle Connect
• Precision Link (V. 2.5 or higher)
• CoZmanager System
Databases from these programs are detected by the CoPilot system as long as the software for
the programs that created them are installed on your PC.
Note: The CoZmanager System software must be Rev. D or higher. The internal Deltec Cozmo
pump software must be Rev. F or higher. The CoPilot system detects the software
revisions and will not allow the import if it detects the wrong revision(s).
WARNING:
• Imports from the CoZmanager System include data only from full days (24 hours), not
partial days. This is so that CoZmanager can provide daily totals.
4.4.2 Importing a Supported Database
1. Select DataEntry on the menu bar; then select Import.
2. From the Import menu, select the name of the device you want to import from.
Figure 61. DataEntry Menu; and Import Menu
3. If the database is detected, you will be asked to confirm the import operation.
4. If the database is not detected, your file browser opens.
61
Section 4: Entering Data Into the CoPilot System
Figure 62. File Browser Window: Select Database to Import
5.
You should:
• Browse to the directory where the file is located.
• Select the file type in the Files of Type window. If the file is located in that directory, it
will be displayed.
• Highlight the file and click Open.
4.4.3 Importing Data from a File
You can import a *.tab or *.xml file after the file is specially formatted for the CoPilot system by
following the instructions provided in the Importing TAB and XML Data manual. For a copy of
this manual, contact your local Abbott Diabetes Care office, or visit our Web site at
www.abbottdiabetescare.com and look for your country contact information under
Worldwide Locations.
Perform the following steps to import a *.tab or *.xml file:
1. Select the user (if you are an HCP User, select the patient).
2. Click DataEntry on the menu bar; then select Import.
3. From the Import submenu, select Import Events From File.
62
Section 4: Entering Data Into the CoPilot System
Figure 63. Import Menu: Import Events From File
4. The file browser opens. Find the directory where the file is located.
Figure 64. File Browser Window
5. Select the file type (*.tab or *.xml) in the Files of Type window.
6. Highlight the file of interest and click Open.
63
Section 4: Entering Data Into the CoPilot System
4.5 Exporting Data
Exporting data in the CoPilot system is similar to archiving data (see Section 7.1: Archiving Data)
except that the exported data is not removed from the CoPilot system’s database.
To export data:
1. Click Reports on the menu bar; then select Diary List.
Figure 65. Reports Menu
2. The Diary List displays.
3. Adjust the date to include the data you want to export.
Figure 66. Diary List: Date Adjustment
4. Click Export from the File menu on the Home page. A file browser will open. Browse to the
directory where the file is to be saved.
64
Section 4: Entering Data Into the CoPilot System
Figure 67. File Browser Window
5. Select the file type (*.tab or *.xml) in the Save as type field.
6. Enter the name of the file in the File name field. Click Save.
65
Section 5: Viewing and Printing Reports
5 Viewing and Printing Reports
With the CoPilot system, data entered manually or uploaded from a device can be displayed on
the screen in a variety of ways. Statistical and other calculations are automatically performed
on the data, and the results are put into tables and graphs. A report is one or a set of these
tables and graphs.
Reports
Toolbar
Figure 68. Glucose Modal Day Report
Any report can be customized to your preferences. Many variables can be adjusted in real
time as you view the report. These are described in Section 5.3: Personalizing Report Settings.
Data cannot be changed in any reports except the Diary List. Corrections or additions to
manually entered data can be made by accessing the Data Entry screen for the event. Refer to
the individual report sections for instructions on calling up the Diary List entry for past events.
The changes display immediately on any affected report.
Once opened, a report remains open until you close it. Any number of reports can be open at
the same time; only one is visible. Each open report shows as a tab at the top of the screen.
All open reports apply the same active date range, data filter options, and display features.
Changing these settings in any report changes them for all other open reports.
66
Section 5: Viewing and Printing Reports
CAUTION: For glucose and insulin entries, if the Time Period is changed manually, all
reports will still be displayed as defined by the Time Period setting in the User
Profile.
Note: Any decimal calculations that are 0.4 or less are rounded to 0. Any decimal calculations
that are 0.5 or greater are rounded to 1.
5.1 Viewing Reports
See Section 5.3.1: Report Options (User or HCP Profile) for instructions to select your default report
and date range interval.
1. To open your default report, click
the View Report button on the home page.
2. To open another report, click any report listed in the Reports menu. The first report remains
open but hidden, except for its tab. The new report displays with the same date range,
active data filters, and display features.
Figure 69. Reports Menu
3. To display a report, click the desired tab on the reports tab bar.
Figure 70. Reports Tab Bar
4. To close the active report, click the Close Report icon
on the reports tab bar.
When you view reports, you can select the date or Date Range for information to view, and you
can use interactive Data Symbols to see more detailed information.
67
Section 5: Viewing and Printing Reports
5.1.1 Date Range
Use controls on the Reports Toolbar to select the date range (time period) for the information
that you want to view in one or more reports. You can select a pre-selected time period, and
you can also select custom dates and date-range intervals.
Figure 71. Reports Toolbar
To select the date or date range for information you want to view, use one or more of the
following tools:
Custom Date Range List - Select any time period (such as Last 1 Month or Last 3 Months)
in the Custom Date Range List. The dates for your selected date range are automatically
entered in the Calendar Date Selection Tool.
Figure 72. Custom Date Range, Calendar Date Selection, and Arrow Tools
Calendar Date Selection Tool - To select a specific date range, enter dates in the calendar
range selection tool. You can type in the date(s) in the format: mm/dd/yyyy (or dd/mm/
yyyy depending on your operating system), or you can use the down arrows to open the
calendar. Use the left and right arrows above the calendar to select the month and year.
Highlight any day in the calendar.
Previous and Next Arrows - After you have selected a date range, use the previous and
next arrows to “jump” or “scroll” back or forward in time. For example, if you have selected
the Last 7 days date range (such as from May 1 to May 7), you can click the previous arrow to
change the date range seven days earlier. The same effect occurs forward and backward for
any date range interval, whether days or months.
68
Section 5: Viewing and Printing Reports
5.1.2 Data Symbols
You can use the symbols used in reports to link to related or more complete information.
Interactive data symbols include data points on a graph, regions on a chart, and cells in a table.
Your pointer becomes the hand icon when it is hovering over an interactive data symbol. For
example, by hovering the pointer over a triangle (meter blood glucose reading data symbol),
you can display the value, date, and time of the reading in a pop-up field. To go to the Glucose
Reading event in the Diary List, double-click the triangle.
On the Daily Combination and Weekly Pump reports:
• Carbohydrate events are represented by dark yellow circles; the size of each circle is
proportional to the carbohydrate value.
• Insulin data is represented by light green, dark green, and dark red bars.
On all reports (except for the Diary List):
• Glucose readings are represented by squares (manual entries), triangles (meter
blood glucose readings), and circles (continuous glucose readings) which can be
linked by a line.
5.1.3 Target Range Colours
Glucose readings are separated into target ranges, which are represented on graphs and tables
either in distinctive colours or in distinctive patterns for black-and-white printing.
You can display the data in three ranges (High, Within, and Low) or five ranges (Very High, High,
Within, Low, and Very Low). These choices can be changed at any time on the Miscellaneous tab
of the Report Configuration form by checking or un-checking the Show Hypo/Hyper box.
Each target range is associated with a unique colour: Very High (turquoise), High (purple),
Within (green), Low (yellow), and Very Low (red).
69
Section 5: Viewing and Printing Reports
5.2 Printing and Sending Reports
To view a menu of options for printing and sending a report, click the down arrow next to the
on the Reports toolbar.
Print icon
Figure 73. Print Menu
• To print the report in its currently displayed configuration (format), select Print. The
report prints on your printer.
• To verify or change the page setup options (margins, paper size, etc.), click Page Setup.
Review or make changes to the Page Setup form.
• To preview the report before printing it, click Print Preview.
• To print one copy of each of your favorites on the default printer, click Print Favorite
Reports.
• To save the open report in the Adobe Acrobat (PDF) file format, click Save as PDF file.
Select this option if the E-Mail Report to option (below) does not automatically create a
*.pdf file. Or select this option if you have a printing problem and want to print from
Adobe Acrobat. (The Adobe Acrobat Reader program must be installed on your
computer. Go to www.Adobe.com for instructions on downloading this program free
over the Internet.)
• To e-mail the report as an attachment, click E-Mail Report to. The report is attached to
the e-mail message as a *.pdf file. (You do not have to Save as PDF file first.)
Note: The E-Mail Report to option is designed to access your e-mail account and open a new
e-mail message screen. If your e-mail account is not detected automatically, you will
need to e-mail the report manually. To do so:
• With the desired report open, select the Save as PDF file option from the Print dropdown box on the Reports toolbar. Then manually attach the *.pdf file to an e-mail.
70
Section 5: Viewing and Printing Reports
5.3 Personalizing Report Settings
Reports can be personalized to your preferences by making choices for Report Options on the
Profile for: screen and by activating data filters and display features on the Report
Configuration screen.
5.3.1 Report Options (User or HCP Profile)
On the Profile page, click the Options tab.
Report
Options
Figure 74. User Profile Screen with Options Tab Active
The Report Options are on the right. The Default Report is the report you want to display
when you select
on the Home page.
• Select your preferred default report in the Default Report Type list.
• Select your preferred default date range interval for the default report from the Default
Report Date Range list.
• Select whether to attach a Statistics Summary list whenever a report is printed.
• To select your Favorite Reports, check any report or set of reports you want to print
when you select Print Favorite Reports After Device Upload. For each report,
complete the Date Range. Selected date ranges may be different for different reports.
• Select Print Using Adobe Acrobat to enable the PDF printer option. Use this option if a
report does not print correctly on your printer.
71
Section 5: Viewing and Printing Reports
Note: The Statistics Summary does not automatically print with your Favorite Reports even
Include Statistics Summary With Each Report Printout is selected.
if
Note: The Statistics Summary is not attached to reports you email. And it does not display
when you select Print Preview even though it will be printed with the report.
5.3.2 Data Filters
Data filters are tools for selecting the types of data you want to include in a report. You select
on the Reports
the data filters you want by clicking the Report Configuration icon
toolbar and choosing items from the Event Types, Time Periods, and Week Days sections on
the Data Filter tab. Click Apply to save any changes. Click OK to save changes and return to the
report.
Figure 75. Report Configuration: Data Filter Tab
Data filters and display features (Section 5.3.3) apply to all reports except the HCP Group
Analysis Report. Changing data filter or display settings in any report changes them for all
other open reports. Not all filters are configurable in all reports.
Event Types
There are two types of Glucose events: Glucose (BG) refers to results from a blood glucose
meter. Glucose (CM) refers to results from a continuous glucose monitoring system.
Time Periods - If you de-select the Pre-Breakfast, Pre-Lunch, or Pre-Dinner options on the Data
Filter tab, the carbohydrates for the corresponding meal (breakfast, lunch, or dinner), if entered
manually or uploaded into the CoPilot system, will not be displayed on the reports that would
ordinarily show this information.
Week Days - Week Days filters do not apply to the Daily Combination View Report.
Several data filters can be applied together. For example, you could uncheck Exercise events in
the Event Types filter and check only Tuesday and Friday in the Week Days filter.
72
Section 5: Viewing and Printing Reports
5.3.3 Display Features
Some display features are configured on the Miscellaneous tab of the Report Configuration
screen.
Figure 76. Report Configuration: Miscellaneous Tab
73
Section 5: Viewing and Printing Reports
GENERAL ITEMS
Display Time Periods
Select to display time periods on the report.
Show Hypo/Hyper
Deselect to display glucose readings in three target ranges: High, Within,
and Low.
Select to display glucose readings in five target ranges: Very High, High,
Within, Low, and Very Low.
Note: If you select to display glucose data in three target ranges (the Show
Hypo/Hyper box is not checked), Very High readings display as High
readings (purple) and Very Low readings display as Low readings (yellow).
Show Glucose Targets
Select to display glucose readings data in their unique colour or pattern
(black and white display).
Show Hidden Data
Select to view all entries in the Diary List, including those you marked
Hide.
Show Text on Graphs in Daily
Combination Report
Select to view numerical values of glucose readings.
Show Legend
Select to display the legend in all applicable reports. Displaying the
legend will help you understand the report.
Colour
Select to display glucose target ranges in their unique colours. See Section
3.1.4: Glucose Targets Tab for information about glucose target ranges.
Deselect to display glucose target ranges in their distinctive patterns for
black-and-white printing.
Devices
This list includes all installed meters and other supported devices. See
Appendix C: Supported Devices and Databases.
If you have installed only one device, you cannot deselect the device (to filter
out the data). If you have two or more devices installed, one device must
always be selected.
Figure 77. Black-and-White Display Patterns (Screen Detail)
74
Section 5: Viewing and Printing Reports
5.4 Glucose Target Modes
The following is a table of the reports that use glucose targets, and the modes they use:
Report
Home User Version
Glucose Target Mode
HCP Version
Glucose Target Mode
Diary List
User’s choice
HCP’s choice
Glucose Modal Day
User’s choice
HCP’s choice
Glucose Line
Standard Mode
Standard Mode
Glucose Average
Standard Mode
Standard Mode
Glucose Histogram
Standard Mode
Standard Mode
Glucose Pie Chart
User’s choice
HCP’s choice
Logbook
User’s choice
HCP’s choice
Lab and Exam Record
Not applicable
Not applicable
Statistics
User’s choice
HCP’s choice
Daily Combination View
User’s choice
HCP’s choice
Weekly Pump View
Standard Mode
Standard Mode
HCP Group Analysis
Not applicable
Standard Mode
5.5 Definition of a Day
Depending on the report, a day (24 hours) is calculated from midnight to midnight or prebreakfast to pre-breakfast. The various reports define a day as follows:
Report
Definition of a Day
Diary List
Midnight to Midnight
Glucose Modal Day
Pre-breakfast to Pre-breakfast
Glucose Line
Midnight to Midnight
Glucose Average
Pre-breakfast to Pre-breakfast
Glucose Histogram
Midnight to Midnight
Glucose Pie Chart
Pre-breakfast to Pre-breakfast
Logbook
Pre-breakfast to Pre-breakfast
Lab and Exam Record
Midnight to Midnight
Statistics
Pre-breakfast to Pre-breakfast
Daily Combination View
Midnight to Midnight
Weekly Pump View
Midnight to Midnight
HCP Group Analysis
Midnight to Midnight
75
Section 5: Viewing and Printing Reports
5.6 Descriptions of Reports
Carefully review the earlier sections in this section before reading these descriptions. The earlier
material provides important overall guidelines for viewing, navigating, and personalizing
reports.
WARNING:
• Have your healthcare professional review and confirm your entries before using
this data. Serious effects on your health could result from relying on or using
incorrect entries.
CAUTION: If any event data is Hidden, a comment will appear at the top of the report
indicating the number of Hidden events. Hidden data will not be displayed or included
in the calculations for that report.
5.6.1 Diary List
The Diary List is a table of all data entries made over the specified date range. Each row
corresponds to one event.
Figure 78. Diary List
• A day (24 hours) is defined as midnight to midnight.
• The glucose target mode is your choice.
• Columns are for data categories. The Value column displays the value in units
appropriate to the event type. For Glucose Reading events, the Value cell is shaded with
the unique colour for the glucose target range.
76
Section 5: Viewing and Printing Reports
• To open the original Data Entry screen for a specific event, double-click any cell in the
row.
• Data that was entered manually can be edited. Some fields in uploads from devices can
be edited.
WARNING:
• Some Deltec Cozmo Insulin Pump events such as disconnect, reconnect and cancelled
boluses are not included.
Note: When uploading data from a device, or when importing data from Precision Link
(version 2.5 or higher), glucose readings greater than 500 are displayed as “501”, and
readings less than 20 are displayed as “19”.
Hide/Un-Hide Events
By default, the Diary List contains a Hidden column (far-left). Entries you have chosen to Hide
in the Hidden column.
will display
Hidden
column
Figure 79. Diary List with Hidden Column Displayed
Figure 80. Reports: Context Menu
77
Section 5: Viewing and Printing Reports
• To Hide an event, select the row, and right-click. Click Hide Data on the context menu. When
prompted to confirm, click Yes to hide the data. Pump Insulin data cannot be hidden.
in the Hidden column.
• To Un-Hide an event, click any cell in a row that displays
Next, right-click and select Un-Hide Data from the context menu. The event is no longer
hidden.
• The Diary List displays Hidden data and the Hidden column by default. To not display
Hidden data on the Diary List:
on the Reports toolbar. Click the Miscellaneous tab and uncheck the box to
• Click
Show Hidden Data. Click OK. The Diary List will no longer display Hidden data and the
Hidden column.
Hidden column and
hidden data are not
displayed
Figure 81. Diary List: Hidden Column and Hidden Data Not Displayed
• Only the Diary List can display Hidden data. In all other reports, Hidden events are not
displayed or included in the calculations even if you checked the box to Show Hidden
Data on the Miscellaneous tab.
• The Hidden column must be displayed in order to Un-Hide events. It is recommended
to always display Hidden data.
Columns
You can customize the columns in the Diary List by changing the order of events in a column,
adding and removing columns, and resizing columns. These changes are saved when you close
the Diary List or exit the CoPilot system.
78
Section 5: Viewing and Printing Reports
Change Order of Events
To change the order of the events in the Diary List, click any of the following column heads:
Hidden
Type
Date
Time
Time Period
Value
Description
Other Info
Comment
Hidden entries display in descending order (latest date at the top). Click
to display all hidden entries at the top. Click again to display all hidden
entries at the bottom.
Events are grouped by Event Type. Click to reverse the order.
Events display in ascending order (earliest date at the top) or
descending order (latest date at the top). Click to reverse the order.
The events display in chronological order. Click to group entries by time
of day.
Time periods are arranged in chronological order. Click to list the time
periods in alphabetical order.
Click to display the values in alphanumeric order. Click again to reverse
the alphanumeric order.
Events are displayed in ascending alphabetical order. Click to reverse
the order.
Click to reverse the order.
Events with Comments display in ascending alphabetical order. Events
with no comments display first. Click to reverse the order.
Remove/Add Columns
• To remove a column from the report, drag-and-drop the column head cell off the table.
• To add a column to the report, right-click anywhere on the table to call up the context
menu. Select Customize Columns. The Customization list displays. From the list, select
the column head you want to add. Drag-and-drop it to the preferred position in the
column-head row. Two green arrows display to help you position the column.
Figure 82. Customization List
Move/Resize Columns
• To move columns left or right in the table, drag-and-drop the column-head cell to the
preferred position in the column head row.
• To adjust the width of any column, use the sizing tool that becomes active when you
hover your pointer over the right margin of the column-head cell.
79
Section 5: Viewing and Printing Reports
5.6.2 Glucose Modal Day Report
The Glucose Modal Day Report shows the daily pattern of glucose levels over the specified date
range. A line linking the readings for a specific date can be displayed or hidden.
List of all days
in date range
Figure 83. Glucose Modal Day Report
• The horizontal axis is a 24-hour timeline. All readings for all dates display on the same
timeline. The vertical axis plots the glucose level.
• A day (24 hours) is defined as pre-breakfast to pre-breakfast.
• The glucose target mode is your choice.
• Each data symbol represents one glucose reading. For the date, time, and value of the
reading, hover the pointer over the data symbol.
• HI/LO indicates a reading outside the working range of the meter.
• A list of all days in the date range displays to the right of the graph.
• To link all the readings for a single day with a line, click the date of interest in the list of all
days in the date range. All the data symbols for that date change colour and a line is
drawn linking them. Click any data symbol or in the line to cancel the line.
80
Section 5: Viewing and Printing Reports
• To zoom in on (magnify) an area of the graph, place the mouse in the upper left of the
graph, press and hold the left mouse button, and drag to the lower right corner of the
graph. Repeat this action to further magnify the area of interest. To return the graph to its
original state, place the mouse in the lower right of the graph, press and hold the left
mouse button, and drag to the upper left corner.
• To go to the Glucose Reading entry in the Diary List, double-click the data symbol.
CAUTION: If the user reconfigures the Glucose Modal Day report by turning Display Time
Periods OFF, the Glucose Modal Day report will go back to plotting the data point
based on the user-configured time period and remove the Time Period labels across the
top of the graph. This can result in a data point for any glucose reading, where a user
manually assigned the time period, being displayed in a different location on the
Glucose Modal Day graph. When the Display Time Periods is ON, the glucose reading
that has a manually assigned time period will be displayed on the graph in the middle of
the time period assigned.
81
Section 5: Viewing and Printing Reports
5.6.3 Glucose Line Report
The Glucose Line Report is useful for seeing trends in glucose levels. It plots each glucose
reading over the specified date range.
Figure 84. Glucose Line Report (Show Line Is Activated)
• The horizontal axis is a timeline of the entire date range. The vertical axis plots the
glucose level.
• A day (24 hours) is defined as midnight to midnight.
• The glucose target mode is Standard.
• Each data symbol represents one reading; a solid line connecting them can be displayed
or hidden. To hide the line, point to any data symbol, and right-click. Click Show/Hide
Line on the context menu.
• For the date, time, and value of the glucose reading, hover the pointer over the data
symbol.
• To zoom in on (magnify) an area of the graph, place the mouse in the upper left of the
graph, press and hold the left mouse button, and drag to the lower right corner of the
graph. Repeat this action to further magnify the area of interest. To return the graph to its
original state, place the mouse in the lower right of the graph, press and hold the left
mouse button, and drag to the upper left corner.
• To go to the event data in the Diary List, double-click the data symbol.
82
Section 5: Viewing and Printing Reports
5.6.4 Glucose Average Report
The Glucose Average Report may help identify times of the day that may need more testing or
improved control. The report separates all glucose readings over the specified date range into
pre-meal (yellow bars) and post-meal (blue bars) groupings and averages the values for each
group.
For convenience, there are two graphs. One shows pre-meal and post-meal glucose averages
over the date range by meal. The other shows overall pre-meal and post-meal averages by day
over the date range.
Figure 85. Glucose Average Report: By Meal
• The asterisk (*) next to the title indicates that the report does not include sleep or
bedtime data.
• The glucose target mode is Standard.
• The horizontal axis is a timeline showing the time periods (pre-meal and post-meal) and
the average for all meals. The vertical axis plots the glucose level.
• Each bar shows the average value of all glucose readings over the date range for the
specific time period (for example, the average value of all pre-breakfast readings).
• A day (24 hours) is defined as pre-breakfast to pre-breakfast.
• Double-click any bar to call up the Diary List entries for these events.
83
Section 5: Viewing and Printing Reports
Figure 86. Glucose Average Report: By Day
84
Section 5: Viewing and Printing Reports
5.6.5 Glucose Histogram Report
The Glucose Histogram Report separates all glucose readings over the specified date range into
the default target ranges and displays the data as a histogram (bar chart) with its bar height
proportional to the number of readings in each glucose target range.
Figure 87. Glucose Histogram Report
• The glucose target mode is Standard.
• The horizontal axis shows the default glucose target ranges (not the user-defined
glucose target ranges). The vertical axis plots the Number of Readings.
• A day (24 hours) is defined as midnight to midnight.
• The colour of the bar corresponds to the unique colour for the glucose target range. The
height of the bar is proportional to the number of readings in that range; that is, the bar
for a range in which there are 20 readings is twice as high as the bar for a range with 10
readings. The percentage of readings in the range is shown at the top of the bar.
• Double-click the bar to call up the Diary List entries that make up that bar.
85
Section 5: Viewing and Printing Reports
5.6.6 Glucose Pie Chart
The Glucose Pie Chart separates glucose readings over the date range into the default glucose
target ranges and averages the values within each range. These averages are displayed in a
series of pie charts. Each segment (wedge) displays in the unique colour of its glucose target
range.
Figure 88. Glucose Pie Chart Report: Total Readings Pie Chart
Figure 89. Glucose Pie Chart Report: Summary Pie Charts
• A maximum of 10 individual pie charts (2 rows of 5) and 1 total pie chart summarizing
the glucose readings for all configured time periods over the date range are displayed.
• A day (24 hours) is defined as pre-breakfast to pre-breakfast on Total Readings pie chart.
• The glucose target mode is your choice.
• Double-click a wedge on any of the pie charts to call up the Diary List entries that make
up that wedge.
86
Section 5: Viewing and Printing Reports
5.6.7 Logbook Report
The Logbook Report is a table of glucose, carbohydrate, and insulin values associated with each
time period over the specified date range.
WARNING:
•
Some Deltec Cozmo Insulin Pump events such as disconnect, reconnect and cancelled
boluses are not included.
CAUTION: If any event data is Hidden, a comment will appear at the top of the report
indicating the number of Hidden events. Hidden data will not be displayed or included in
the calculations for this report.
Figure 90. Logbook Report
• Insulin, carbohydrate, and pre-meal, post-meal, bedtime, and sleep glucose reading
values are displayed in columns under each time period (Breakfast, Lunch, Dinner, Bed &
Sleep) for each day over the date range.
• A day (24 hours) is defined as pre-breakfast to pre-breakfast.
• The glucose target mode is your choice.
• To call up the entry in the Diary List, double-click any cell in the row.
87
Section 5: Viewing and Printing Reports
5.6.8 Lab and Exam Record Report
The Lab and Exam Record Report is a table of data from all Medical Exam and Lab Test Result
data entry screens over the specified date range.
CAUTION: If any event data is Hidden, a comment will appear at the top of the report
indicating the number of Hidden events. Hidden data will not be displayed or included in
the calculations for this report.
Figure 91. Lab & Exam Record Report
• The screen shows a table of lab test data on the top and the exam data below. Each
event is shown in one row.
• A day (24 hours) is defined as midnight to midnight.
• Double-click any cell in a row to go to the Diary List entry for the event.
5.6.9 Statistics Report
The Statistics Report provides an overview of glucose, carbohydrate, and insulin data (including
insulin pump data) over the date range and displays it in a series of tables. You can attach the
Statistics Report to any other report by enabling from User Profile/Options tab.
Figure 92. Statistics Report: Glucose Statistics
• A day (24 hours) is defined as pre-breakfast to pre-breakfast.
• The glucose target mode is your choice.
• Double-click any cell to see the entries from the Diary List that are included in the data
set for a particular statistical calculation.
88
Section 5: Viewing and Printing Reports
Glucose Statistics Table
The Glucose Statistics Table shows data regarding the number of readings per day, the values of
the highest and lowest readings in each time period, and the results of some automatic
calculations (averages and standard deviation) within and across time periods.
CAUTION: If any event data is Hidden, a comment will appear at the top of the report
indicating the number of Hidden events. Hidden data will not be displayed or included in
the calculations for this report.
# Readings
By Time Period: Reports the number of readings recorded during the Time
Period specified for each day of the selected Date Range.
Total/Summary: Reports the number of readings recorded during the selected
Date Range.
# Days w/
Readings
By Time Period: Reports the number of days within the selected Date Range
where one or more readings are recorded during the specified Time Period.
Total/Summary: Reports the number of days within the selected Date Range
where one or more readings are recorded.
Avg #
Readings/Day
By Time Period: Reports the number of readings recorded during the Time
Period specified for each day of the selected Date Range divided by the number
of days in the selected Date Range regardless of whether a glucose reading was
recorded or not.
Total/Summary: Reports the number of readings recorded during the selected
Date Range divided by the number of days in the selected Date Range
regardless of whether a glucose reading was recorded or not.
Highest
By Time Period: Reports the highest reading recorded during the Time Period
specified within the selected Date Range.
Total/Summary: Reports the highest reading recorded during the selected
Date Range.
Lowest
By Time Period: Reports the lowest reading recorded during the Time Period
specified within the selected Date Range.
Total/Summary: Reports the lowest reading recorded during the selected Date
Range.
Average
By Time Period: Reports the sum of the readings recorded during the selected
Date Range that fall within the specified Time Period divided by the number of
readings recorded during the selected Date Range that fall within the specified
Time Period.
Total/Summary: Reports the sum of the readings recorded during the selected
Date Range divided by the number of readings recorded during the selected
Date Range.
89
Section 5: Viewing and Printing Reports
Standard
Deviation
By Time Period: Reports the standard deviation* of the readings recorded
during the Time Period specified within the selected Date Range.
Total/Summary: Reports the standard deviation* of the readings recorded
during the selected Date Range.
Note: N/A is displayed where fewer than three readings are recorded.
*Standard deviation is a statistical calculation that tells how close a set of values
is clustered around the average of those values. It is a measure of dispersal or
variation of the patient’s average glucose level. For example, a small number
(less than half the average) indicate that most of the glucose readings during
the day are close to the average value and that the patient is maintaining
glucose levels near that value. A large number (more than half the average)
indicates that many glucose levels during the day vary considerably from the
average and that the patient is not maintaining glucose levels near the average
value.
Above %
By Time Period: Reports the number of readings recorded above the patient’s
defined normal glucose limits during the Time Period specified within the
selected Date Range divided by the total number of readings recorded during
the Time Period specified within the selected Date Range** and multiplied by
100.
Total/Summary: Reports the total number of readings recorded above the
patient’s defined normal glucose limits during the selected Date Range divided
by the total number of readings recorded during the selected Date Range** and
multiplied by 100.
Within %
By Time Period: Reports the number of readings recorded within the patient’s
defined normal glucose limits during the Time Period specified within the
selected Date Range divided by the total number of readings recorded during
the Time Period specified within the selected Date Range and multiplied by 100.
Total/Summary: Reports the total number of readings recorded within the
patient’s defined normal glucose limits during the selected Date Range divided
by the total number of readings recorded during the selected Date Range and
multiplied by 100.
Below %
By Time Period: Reports the number of readings recorded below the patient’s
defined normal glucose limits during the Time Period specified within the
selected Date Range divided by the total number of readings recorded during
the Time Period specified within the selected Date Range** and multiplied by
100.
Total/Summary: Reports the total number of readings recorded below the
patient’s defined normal glucose limits during the selected Date Range divided
by the total number of readings recorded during the selected Date Range** and
multiplied by 100.
** Available when three target zones are being reported: Show Hypo/Hyper
not selected.
90
Section 5: Viewing and Printing Reports
Very High %
By Time Period: Reports the number of readings recorded as hyperglycemic
events during the Time Period specified within the selected Date Range divided
by the total number of readings recorded during the Time Period specified
within the selected Date Range*** and multiplied by 100.
Total/Summary: Reports the total number of readings recorded as
hyperglycemic events during the selected Date Range divided by the total
number of readings recorded during the selected Date Range*** and multiplied
by 100.
High %
By Time Period: Reports the number of readings recorded above the patient’s
defined normal glucose limits and below the limits of a hyperglycemic event
during the Time Period specified within the selected Date Range divided by the
total number of readings recorded during the Time Period specified within the
selected Date Range*** and multiplied by 100.
Total/Summary: Reports the total number of readings recorded above the
patient’s defined normal glucose limits and below the limits of a hyper event
during the selected Date Range divided by the total number of readings
recorded during the selected Date Range*** and multiplied by 100.
Low %
By Time Period: Reports the number of readings recorded below the patient’s
defined normal glucose limits and above the limits of a hypo event during the
Time Period specified within the selected Date Range divided by the total
number of readings recorded during the Time Period specified within the
selected Date Range*** and multiplied by 100.
Total/Summary: Reports the total number of readings recorded below the
patient’s defined normal glucose limits and above the limits of a hypo event
during the selected Date Range divided by the total number of readings
recorded during the selected Date Range*** and multiplied by 100.
Very Low %
By Time Period: Reports the number of readings recorded as hypo events
during the Time Period specified within the selected Date Range divided by the
total number of readings recorded during the Time Period specified within the
selected Date Range*** and multiplied by 100.
Total/Summary: Reports the total number of readings recorded as hypo events
during the selected Date Range divided by the total number of readings
recorded during the selected Date Range*** and multiplied by 100.
*** Available when five target zones are being reported: Show Hypo/Hyper
selected.
91
Section 5: Viewing and Printing Reports
Insulin Statistics Table
The Insulin Statistics table shows average insulin dosages over the date range (calculated from
insulin data).
Figure 93. Statistics Report: Insulin and Carbohydrates Statistics Tables
Avg/Day
(Insulin Name)
By Time Period: Reports the sum of the units of Insulin delivered
during the Time Period specified for the selected Date Range divided
by the number of days in the selected Date Range where that
particular type of Insulin was recorded during that Time Period.
Total/Summary: Reports the sum of the units of Insulin delivered
during the selected Date Range divided by the number of days in the
selected Date Range where that particular type of Insulin was
recorded.
Note: Separate entries exist for each type of Insulin recorded.
Avg/Day Total
Insulin
By Time Period: Reports the sum of the units of all Insulin delivered
during the Time Period specified for the selected Date Range divided
by the number of days in the selected Date Range where any type of
Insulin was recorded during that Time Period.
Total/Summary: Reports the sum of the units of all Insulin delivered
during the selected Date Range divided by the number of days in the
selected Date Range where any type of Insulin was recorded.
Note:
These entries are calculated using all types of insulin recorded.
92
Section 5: Viewing and Printing Reports
Pump Statistics Table
If your insulin is administered by pump, the table will say Pump Statistics (instead of Insulin
Statistics) and display the following information:
Figure 94. Statistics Report: Pump and Carbohydrates Statistics Tables
Avg/Day Meal
Bolus
By Time Period: Reports the sum of all Meal Bolus Insulin recorded
during the specified Time Period for the selected Date Range divided
by the number of days in the selected Date Range where Meal Bolus
Insulin entries were recorded during that Time Period.
Total/Summary: Reports the sum of all Meal Bolus Insulin recorded
during the selected Date Range divided by the number of days in the
selected Date Range where Meal Bolus Insulin entries were recorded.
Note: Meal Bolus is defined as the sum of all insulin entries (from
pump uploads and manual entries) of the following injection types:
Injection, Bolus, Meal Bolus, Combination Bolus, Dual Wave Bolus, and
Square Wave Bolus.
Avg/Day
Correction
Bolus
By Time Period: Reports the sum of all Correction Bolus Insulin
recorded during the specified Time Period for the selected Date Range
divided by the number of days in the selected Date Range where
Correction Bolus Insulin entries were recorded during that Time
Period.
Total/Summary: Reports the sum of all Correction Bolus Insulin
recorded during the selected Date Range divided by the number of
days in the selected Date Range where Correction Bolus Insulin entries
were recorded.
93
Section 5: Viewing and Printing Reports
Avg/Day Total
Bolus
By Time Period: Reports the sum of all Meal and Correction Bolus
Insulin entries recorded during the specified Time Period for the
selected Date Range divided by the number of days in the selected
Date Range where Meal and Correction Bolus Insulin entries were
recorded during that Time Period.
Total/Summary: Reports the sum of all Meal and Correction Bolus
Insulin entries recorded during the selected Date Range divided by the
number of days in the selected Date Range where Meal and Correction
Bolus Insulin entries were recorded.
Avg/Day Basal
By Time Period: Reports the sum of the Basal Insulin delivered during
the Time Period specified for the selected Date Range divided by the
number of days in the selected Date Range where Basal Insulin was
recorded for that Time Period.
Total/Summary: Reports the sum of the Basal Insulin delivered during
the selected Date Range divided by the number of days in the selected
Date Range where Basal Insulin was recorded.
Avg/Day Total
Insulin
By Time Period: Reports the sum of the Total Bolus and Basal Insulin
doses delivered during the Time Period specified for the selected Date
Range divided by the number of days in the selected Date Range
where Insulin entries were recorded for that Time Period.
Total/Summary: Reports the sum of the Total Bolus and Basal Insulin
doses delivered during the selected Date Range divided by the
number of days in the selected Date Range where Insulin entries were
recorded.
Note: Days where no Insulin entries were recorded during the specified Time Period
will not be included in the By Time Period calculation. Days where no Insulin
entries were recorded will not be included in the Total calculation.
WARNING:
•
Imports from the CoZmanager System (pump) include data only from full days (24 hours),
not partial days. This is so that CoZmanager can provide daily totals.
WARNING:
• Some Deltec Cozmo Insulin Pump events such as disconnect, reconnect and cancelled
boluses are not included.
CAUTION: Total Insulin statistics based on data from the CoZmanager System (pump) may
differ from the sum of the individual insulin fields that make up the total. This is because
CoZmanager may record the amount of a cancelled bolus. The Total Insulin statistic on any
CoPilot system report displays only the insulin delivered, not the cancelled bolus.
CAUTION: Total Insulin statistics may appear to vary from report to report. This is usually due
to how the report defines a day.
94
Section 5: Viewing and Printing Reports
Carbohydrate Statistics Table
The Carbohydrates Statistics table shows average carbohydrates over the date range
(calculated from carbohydrates data).
Figure 95. Statistics Report-Carbohydrates Statistics Table
Avg/Day Carbs
By Time Period: Reports the sum of the meal Carbohydrate
intake for the Time Period specified during the selected Date
Range divided by the number of days within the selected Date
Range where meal Carbohydrate entries were recorded during
the Time Period specified.
Total/Summary: Reports the sum of the meal Carbohydrate
intake during the selected Date Range divided by the number of
days within the selected Date Range where meal Carbohydrate
entries were recorded.
Note: Days where no Meal entries were recorded during the specified Time Period will not be
included in the By Time Period average. Days where no Meal entries were recorded will
not be included in the Total average.
95
Section 5: Viewing and Printing Reports
5.6.10 Daily Combination View Report
The Daily Combination View Report summarizes glucose, carbohydrate, and insulin data
(including pump data) for a single day and displays it in both graphic and table formats.
• To select the day for the data you want to see, use the date field on the right.
Also, set the date field on the left to the same date.
Select day you want to view in
this date field.
Figure 96. Date Field for Selecting Date
Set this date field to the same
date.
• A day (24 hours) is defined as midnight to midnight.
• The glucose target mode is your choice.
Note: Week Days filters do not apply to the Daily Combination View Report. See Section
5.3.2: Data Filters.
CAUTION: If any event data is Hidden, a comment will appear at the top of the report indicating
the number of Hidden events. Hidden data will not be displayed or included in the
calculations for this report.
Figure 97. Daily Combination View: Glucose Line and Carbohydrates Graphs
96
Section 5: Viewing and Printing Reports
Glucose Line Graph
The Glucose Line graph plots glucose readings by hour of day.
• The horizontal axis is a 24-hour timeline. The vertical axis plots the glucose level.
• Each data symbol represents one reading. Hover the cursor over the data symbol to see
the glucose value, date, and time of that reading.
• Double-click a data symbol to view this entry in the Diary List.
• To display or hide the solid line connecting the data symbols, right-click a data symbol,
and select Toggle Glucose Line from the context menu.
Carbohydrates Graph
The Carbohydrates Graph plots carbohydrate events by hour of day.
represents one carbohydrate event. The size of the
• The carbohydrate data symbol
circle is proportional to the carbohydrate value. Its position along the horizontal axis
corresponds to the time (hour) of the meal.
to view this entry in the Diary List.
• Double-Click
Figure 98. Daily Combination View Report: Insulin Summary and Data Table
97
Section 5: Viewing and Printing Reports
Insulin Summary
The Insulin Summary graph plots insulin events by hour of day.
• The horizontal axis is a 24-hour timeline. The vertical axis is units of insulin.
• Basal insulin data (light green shaded area) can be imported into the CoPilot system only
from CoZmanager software.
• Each dark green bar represents one meal bolus insulin event. Its position along the
horizontal axis corresponds to the time (hour) of the insulin event. Its height correlates
with dosage. Double-click to view this entry in the Diary List.
• Each red bar represents one correction bolus insulin event. Its position along the
horizontal axis corresponds to the time (hour) of the insulin event. Its height correlates
with dosage. Double-click to view this entry in the Diary List.
• If pump data has not been imported into the CoPilot system from CoZmanager software,
manually entered meal bolus and correction bolus will not appear separately. Instead, a
green bar will indicate all manually entered bolus events. Its position along the
horizontal axis corresponds to the time (hour) of the insulin event. Its height correlates
with dosage. Double-click to view this entry in the Diary List.
• The scale is indicated on the left.
Data Table
The Data Table tracks glucose, carbohydrates, and insulin values hourly.
• Each column represents 1 hour.
• Each event type is one row.
• Each event is one cell. The value associated with the event displays in the cell. Doubleclick the cell to view this event in the Diary List.
Note: The symbol “...” indicates that the full value does not fit in the space provided. To call up
the full entry in the Diary List, double-click “...”.
WARNING:
• Imports from the CoZmanager System (pump) include data only from full days (24 hours),
not partial days. This is so that CoZmanager can provide daily totals.
WARNING:
• Some Deltec Cozmo Insulin Pump events such as disconnect, reconnect and cancelled
boluses are not included.
CAUTION: Total Insulin statistics based on data from the CoZmanager System (pump) may
differ from the sum of the individual insulin fields that make up the total. This is because
CoZmanager may record the amount of a cancelled bolus. The Total Insulin statistic on any
CoPilot system report displays only the insulin delivered, not the cancelled bolus.
CAUTION: Total Insulin statistics may appear to vary from report to report. This is usually due
to how the report defines a day.
98
Section 5: Viewing and Printing Reports
5.6.11 Weekly Pump View Report
The Weekly Pump View Report shows the components of insulin doses for each day in a sevenday period in bar graph and pie chart formats.
CAUTION: If any event data is Hidden, a comment will appear at the top of the report
indicating the number of Hidden events. Hidden data will not be displayed or included in
the calculations for this report.
To select the week (7 days) for the data you want to view:
• Using the date field on the right, select the last date in the week you want to see
(3/17/07, for example).
• Set the date field on the left to the first day of that week (3/11/07, for example).
Set to first date in
week.
Set to last date in
week.
Figure 99. Date Field for Selecting Date
• A day (24 hours) is defined as midnight to midnight.
• The glucose target mode is Standard.
Figure 100. Weekly Pump View Report: Bar Graph
99
Section 5: Viewing and Printing Reports
Figure 101. Weekly Pump View Report: Pie Charts and Glucose Statistics Table
• Double-click any cell to view this entry in the Diary List.
• Basal insulin data (light green shaded area) is imported into the CoPilot system only from
CoZmanager System software.
• A Glucose Statistics table summarizes the glucose readings for the week displayed.
WARNING:
• Imports from the CoZmanager System (pump) include data only from full days (24
hours), not partial days. This is so that CoZmanager can provide daily totals.
CAUTION: Total Insulin statistics based on data from the CoZmanager System (pump) may
differ from the sum of the individual insulin fields that make up the total. This is because
CoZmanager may record the amount of a cancelled bolus. The Total Insulin statistic on any
CoPilot system report displays only the insulin delivered, not the cancelled bolus.
CAUTION: Total Insulin statistics may appear to vary from report to report. This is usually due
to how the report defines a day.
100
Section 5: Viewing and Printing Reports
5.6.12 HCP Group Analysis Report
The HCP Group Analysis Report is available to HCP Users only. This report is a user-configurable
view of all CoPilot system data for all patients of the HCP. The HCP can display data for any
patient he/she manages. This includes all device data uploaded during a patient visit, and all
data entered manually. This report facilitates viewing and comparing of data for all patients of
the HCP or clinic.
Figure 102. HCP Group Analysis Report
• By default, the report displays with column heads for Patient ID, Last Name, First
Name, and for a number of event-related data fields.
• Data for each patient displays in one row. Each glucose value displays in a cell shaded the
unique colour of its target range.
• The glucose target mode is Standard.
• A day (24 hours) is defined as midnight to midnight.
Columns
You can customize the columns in the HCP Group Analysis Report by changing the order of
events in a column, adding and removing columns, and resizing columns.
Change Order of Events
• To reverse the order of items in any column, click the column heading, and click the little
arrow that appears to the right of the heading. Do the same to change the order back to
its original sequence.
Add/Remove Columns
• To remove a column from the report, drag-and-drop the column head cell off the table.
• To add a column to the report, right-click anywhere on the table to call up a context
menu. Click Customize Columns.
101
Section 5: Viewing and Printing Reports
Figure 103. Context Menu
The Customization list displays. From the list, select the column head you want to add. Next,
drag-and-drop it to the preferred position in the column-head row. Two green arrows display to
help you position the column.
Figure 104. Customization List
Move/Resize Columns
• To move columns left or right in the table, drag-and-drop the column-head cell to the
preferred position in the column head row.
• To adjust the width of any column, use the sizing tool that becomes active when you
hover your pointer over the right margin of the column-head cell.
Note: The Insulin column contains the Insulin Type entered in the Prescribed Plan. The
Medication column contains the Medication Type, entered in the Prescribed Plan.
102
Section 5: Viewing and Printing Reports
Data Filter
For most column-heads in the table, you can configure a data filter using the selection list. To
display the selection list for any column, click the down-arrow on the right.
• To display data for all patients, with any or no entry in the corresponding data field, click All.
• To customize the data filter, click Customize. Complete the Filter Builder dialog box.
• To save your custom changes:
1. Click Customize (bottom right of screen). The Filter Builder screen displays.
2. Click Save As. Enter a filename. Next, click Save.
Figure 105. Filter Builder Tool
103
Section 6: Prescribed Plan
6 Prescribed Plan
The CoPilot system provides an additional utility, called the Prescribed Plan. This utility stores
guidelines which have been given by your Healthcare Professional.
6.1 Prescribed Plan
You can use the Prescribed Plan to store and review prescribed guidelines from your HCP, for
the following information:
• Insulin type, dosage, and time of day
• Insulin sensitivity
• Medication type, dosage, and time of day
• Carbohydrates for each individual meal time
• Ratio of amount of insulin per grams of carbohydrate
You can add information for each of the items listed above, for breakfast, lunch, dinner,
bedtime and a snack. You can also add comments or notes that you would like to keep.
Figure 106. Prescribed Plan
Sensitivity
Sensitivity is your insulin sensitivity factor. It is based on the amount of blood glucose lowered
by 1 (one) unit of insulin within a specific time frame. This is also called your insulin correction
factor. Your insulin sensitivity factor is determined by your HCP.
104
Section 6: Prescribed Plan
Ratio
Ratio is the insulin-to-carbohydrate ratio. It is used to determine how much insulin to
administer per grams of carbohydrates eaten. Your insulin-to-carbohydrate ratio is determined
by your HCP.
WARNING:
• Do not change your medication unless advised by your healthcare professional.
WARNING:
• Be sure to enter and check all values carefully. The CoPilot system cannot check that the
entries you make are correct for your personal needs. Serious effects on your health
could result from relying on or using improper or incomplete entries. Discuss the data
entry options available with your HCP so you are both clear on the amount and types of
information for therapy analysis.
CAUTION: Contact your healthcare professional for guidance on determining and using your
insulin dosages, insulin-to-carbohydrate ratios, and insulin sensitivities.
CAUTION: Contact your healthcare professional for guidance on determining and using your
prescribed carbohydrate intake.
CAUTION: The CoPilot system does not calculate your insulin sensitivity or your insulin-tocarbohydrate ratio. These should always be determined by your healthcare professional.
6.2 Filling-in a Prescribed Plan
To fill in a Prescribed Plan:
1. Click References > Prescribed Plan on the menu bar. The Prescribed Plan screen displays.
2. Select an entry type from the Type list: Insulin or Medication.
• Select Insulin to record an insulin type.
• Select Medication to record a medication type.
3. Enter the name of the Insulin or the Medication in the Item field.
4. Enter the Dosage Amount for each of the breakfast through snack meals.
5. Select Ratio to record the optimum meal-based insulin-to-carbohydrate ratio.
6. Select Sensitivity and enter the insulin correction factor your HCP calculated for you.
7. Select Grams of Carbs to record the optimum carbohydrate intake. Enter the desired
number of grams of carbohydrate for each meal field.
8. Enter any comments in the Comments field (optional).
9. Click OK to save and close the Prescribed Plan window. (Or, to clear all data entered into
the plan, click Reset.)
105
Section 7: Database Management
7 Database Management
The CoPilot system can create and alternately use more that one database. When you start the
CoPilot system, it uses the same database that was used when the application was closed the
last time. The CoPilot system changes databases only when you select a different database.
To ensure that your information remains accurate, the CoPilot system allows you to perform
database maintenance. You can use the Database Maintenance feature to:
• Archive: Remove old data from the database and save it in a file.
• Backup: Save a copy of your current database in a backup file.
• Restore: Restore data from the last database backup or other database file.
7.1 Archiving Data
When you archive data, the data being archived is removed from the CoPilot system database
and stored in a file. (To restore archived data, see Section 7.3: Restoring Archived Data.) Follow
these instructions to create an archive data file.
1.
Click File > Database Maintenance > Archive.
Figure 107. Database Archive Command
2. In the Archive Data window, Select a Date. Select the last date of the data to be included in
the archive.
3. Click OK.
106
Section 7: Database Management
Figure 108. Select Archive Event Date
4. A file browser opens. In the Save In field, select the file location (folder).
5. Select the Save as Type for XML file.
Figure 109. Save Archive Data File
6. Enter the File Name in the format {file name}.xml
7. Click Save. A progress bar is displayed.
8. A confirmation message is displayed when the process is complete.
Fig. 110. Confirmation Message
9. Click OK.
107
Section 7: Database Management
7.2 Viewing Archived Data
To view archived data:
1. Open Windows Explorer (not Internet Explorer) or other Windows file manager.
2. Select the folder where you saved the archived *.xml file.
Figure 111. Location of Archived Data .XML File
3. Highlight the archive file.
4. Click File > Open. The archive file will open in a Web browser window. (You must have a
Web browser or other .xml file viewer to open an .xml file.)
108
Section 7: Database Management
7.3 Restoring Archived Data
Follow this procedure to import archived data back into the CoPilot system database.
Note: It is a good idea to create a backup database file before you import data.
1. Click DataEntry > Import > Import Events from File.
Figure 112. Restore Archive Data (Import Events from File)
1.
A file browser opens. In the Look In field, select the file location (folder).
2.
Select the Files of Type (*.xml or *.tab).
3.
Highlight the archive file. Click Open.
4.
Importing begins and the Importing message displays the status.
Figure 113. Importing Message
5.
The Importing message closes when the process is complete.
109
Section 7: Database Management
7.4 Backing Up the Database
7.4.1 Automatic Database Backup
When the CoPilot system closes, it automatically creates a database backup file. To ensure that
your data is safely stored, be sure to exit the CoPilot system when you are finished.
If you have a large database, an hourglass will appear until the automatic backup is complete.
7.4.2 Manual Database Backup
You can create a manual backup of your database at any time and save it in any directory.
1. Click File > Database Maintenance > Backup. A file browser opens.
2. In the Save In field, select the backup location (folder).
3. Enter the File Name.
Figure 114. Select Backup Location
4. In the Save as Type field, select CoPilot Backup.
5. Click Save.
IMPORTANT: As a precaution, you should make a full backup of your CoPilot system
database before upgrading your operating system.
110
Section 7: Database Management
7.5 Restoring a Backup Database
When the CoPilot system is started, it checks the integrity of the database. If the CoPilot system
cannot open the database due to corruption or other conditions, it displays the following
message:
Figure 115. Database Error Message
Click OK. The next message asks if you want to open another database, restore a database from
an automatic backup or create a new database (or quit).
Select Restore it from the backup, and click OK.
Figure 116. Error Opening Database Message
7.5.1 Restoring a Database Backup File
To restore a database:
1. Click File > Database Maintenance > Restore.
2.
The CoPilot system will prompt you to confirm the operation.
Figure 117. Confirmation Message
111
Section 7: Database Management
3. Click YES. A file browser opens.
4. In the Look In field, browse to the directory where the database is located.
Figure 118. File Browser
5. In the File of Type field, select CoPilot Backup (file type is *.cpb).
6. Highlight the *.cpb file. The file name appears in File Name field.
7. Click Open.
8. The selected database is restored.
9. The CoPilot system prompts you to view the Restore Log.
Figure 119. Prompt to View Restore Log
10. Click Yes to view restored transactions in the log. (Click No to complete the procedure.)
112
Section 7: Database Management
Figure 120. Restore Log
7.5.2 Viewing the Restore Log
You can view the Restore Log at any time, as follows:
1. Close or minimize the CoPilot system.
2. Open Windows Explorer (not Internet Explorer) or other file manager.
3. Select the CoPilot Health Management System folder.
4. Highlight the file named Restore.log.
5. Click File > Open.
113
Section 8: Security
8 Security
This section explains how to set up and use User IDs and Passwords. It also explains how to set
User Rights, the feature that allows an HCP or home user to define access rights for their own
profile, and/or for other profiles (users) that share the system.
When you set user rights, you define the ability to create or edit other profiles, to define user
rights for others, and to configure the CoPilot system settings.
8.1 System Administrator Profile
In the CoPilot system, there is a built-in user profile for the CoPilot System Administrator. You
cannot use the system administrator profile to upload data or enter information. This profile is
used generally for configuring security (user rights). It cannot be deleted, and system
administrator user rights cannot be revoked. If you like, you can set or change the system
administrator’s password using the procedure below.
The default password for the system administrator is Admin. Follow procedures below to
enable password protection.
8.2 Password Protection
Each user has a user ID (the name used for the profile). Defining a user ID is a required step in
creating a profile. You can set the CoPilot system to request a user ID and password each time
the CoPilot system starts, or each time a different user is selected in the Select User list (home
user version) or Select HCP list (HCP version).
To turn on password protection:
1. Click File > System Settings.
2.
In the System Setting window, select Require User Logon.
Note: If File > System Settings is grey, you do not have the user rights to turn on password
protection. See Section 8.3: Defining User Rights.
114
Section 8: Security
8.2.1 The Logon to System Screen
To log on to the CoPilot system, enter your user ID and password.
Figure 121. System Logon Screen
1.
Type in your User ID and Password.
2.
Click OK. The home page appears.
115
Section 8: Security
8.3 Defining User Rights
Any HCP or home user can define user rights for their own profile, or for other profiles. (But only
if they already have been granted permission to change user rights.)
The system administrator (in either the HCP or home user version) can set or revoke the user
rights for any other profile.
If user rights are granted to a user (profile) to allow editing of user rights for others, HCPs and
home users can set user rights as follows:
• HCPs can define user rights for their own profile, or for other HCP profiles.
• Home users can define user rights for their own profile, or for other home user profiles.
8.3.1 User Rights Options for HCP and Home Users
User Rights Option
Description
Edit Data
Select to allow the user to edit events and user profiles.
Without this right, the user cannot change or hide events,
nor delete or change another user’s profile. The user can,
however, edit his/her own profile, add another user, or
enter (add) data by manual entry, device upload, or import.
Assign User Rights
Select to allow any user to change user rights of other users.
Deselect to allow the user to view but not change user
rights (for others or their own.)
Configure System Settings
Select to allow the user to change System Settings. If the
user does not have this right, the System Settings option is
greyed out.
116
Section 8: Security
8.3.2 Assigning Your Own User Rights - HCP and Home User
If you are the initial HCP or home user, you are automatically granted full user rights. With this
status, you can change your own user rights and assign rights for other profiles.
To change user rights in your own profile:
1. Open your profile
2. Click Rights in the lower left corner.
3. The User Rights screen displays.
Figure 122. User Rights: Home User (left) and HCP User (right)
4. Check the rights that you want to grant to yourself. Uncheck the rights that you want
to revoke.
5. Click OK.
Note: If you cannot change your own user rights, select System Administrator in the Select
User list or Select HCP list. The system administrator can change user rights for any
profile.
117
Section 8: Security
8.3.3 Home User - Assigning User Rights to Other Home Users
If you have set up more than one home user profile, you can follow this procedure to set user
rights for another profile.
1.
Click UserProfile > User List or, from the home page, click
to display the User List.
Fig. 123. User List
2. Select a user in the list.
3. Click
to open the User Rights screen.
4. Check the rights that you want to grant. Uncheck the rights that you want to revoke.
5. Click OK.
Note: Edit Data
allows the user to edit data/events and delete user profiles.
118
Section 8: Security
8.3.4 HCP - Assigning User Rights to Other HCPs
If you have set up more than one HCP profile, you can follow this procedure to set user rights for
another profile.
1. Click UserProfile > HCP List.
Fig. 124. HCP List
2. Select a user in the list.
3. Click
to open the User Rights screen.
4. Check the rights that you want to grant. Uncheck the rights that you want to revoke.
5. Click OK.
119
Appendix A
Appendix A: Contact Customer Care
If you have questions after reading this User’s Guide, or for technical assistance, please contact
Abbott Diabetes Care, Customer Care.
Please contact the person you received the software from, or your local Abbott Diabetes Care
office. For a list of worldwide offices, visit www.abbottdiabetescare.com and click Worldwide
Locations. On the Worldwide Locations page, click the link for your country or a country near
you.
120
Appendix B
Appendix B: Troubleshooting
If you continue to experience a problem after completing troubleshooting steps listed in this
section, please see Appendix A: Contact Customer Care to request further assistance.
Device Connection Problems
Devices
Troubleshooting
Abbott Diabetes Care
Blood Glucose
Monitoring Devices
•
Check your connection at the meter and the computer.
•
Reset the device by turning off and on.
•
Disconnect and reconnect the cable.
•
Check the device user instructions.
•
Other programs may be attempting to use the COM port. In this
case, close all programs but the CoPilot system and see if it corrects
the problem.
•
Review the settings on a switchbox if you are using one.
•
COM port may not have been released by another program (e.g.,
PDA programs). PDAs tend to cause problems by occupying COM
ports. Consider dedicating a COM port to your PDA and dedicating a
different COM port to data uploads from other devices.
Data Import Problems
Not all database imports will populate all the available fields in the Diary List. Appendix C:
Supported Devices and Databases lists all the events and data that the CoPilot system is able to
import from these databases. No HCP Profile information is ever imported. Importing a file
imports patient data only, one patient at a time.
Source
Troubleshooting
CoZmanager Software
•
CoZmanager software must be Rev. D or higher.
•
Cozmo pump software must be Rev. F or higher.
•
Precision Link Versions 2.4 and lower are not supported.
Precision Link
FreeStyle Connect System •
COM port may not released by another program (e.g., PDA
programs). PDAs tend to cause problems by occupying COM ports.
Consider dedicating a COM port to your PDA and dedicating a
different COM port to data uploads from other devices.
XML Files
TAB Files
Please contact the person you received the software from, or your
local Abbott Diabetes Care office. For a list of worldwide offices,
visit www.abbottdiabetescare.com and click Worldwide
Locations. On the Worldwide Locations page, click the link for your
country or a country near you.
•
121
Appendix B
Printing Problems
You should download the latest printer driver from the manufacturer of your printer. If you
change the orientation of the page (portrait, landscape) or change page size, view the page
using Print Preview before printing to check formatting.
Problem
Troubleshooting
Unclear Printing
(Greyscale)
•
Blacked out Regions in the •
Printout
Blank Regions in the
Printout
Information is Missing on
the Printout
Extraneous Lines in the
Printout
Reports are clearest when printed on a colour printer. For greyscale
or black-and-white printing, display the report with distinctive
patterns in black and white rather than colour. See Section 5.3.3:
Display Features.
Certain combinations of operating systems, printers, and printer
drivers may result in printouts that contain blank regions, black
regions, or missing information. An alternate printing method has
been provided in the program: You can save any report as a .pdf
file and open the file in Adobe Acrobat and print it from that
application. You can download Adobe® Acrobat® for free from their
website: www.adobe.com
PDF Attachments
Problem
Troubleshooting
E-Mail Report to: PDF File
Not Attached
•
The E-Mail Report to option is designed to access your e-mail
account and open a new e-mail message screen. The report is
attached to the message as a *.pdf file. If your e-mail account is
not detected automatically, you will need to e-mail the report
manually. To do so: With the desired report open, select the Save
as PDF file option from the File menu. Attach the *.pdf file to an
e-mail manually.
Access Violation Errors
If you receive an access violation error message, you should close the program and reopen it,
even if the program allows you to continue. If you do not close and reopen the program, you
may get further access violation error messages.
122
Appendix C
Appendix C: Supported Devices
And Databases
The CoPilot Health Management System supports many types of blood glucose monitoring
devices and databases.
This appendix provides a list of supported devices and databases along with the types of data
and information that can be uploaded to the CoPilot system.
In addition, different devices may require different steps to upload data:
• Some devices upload all collected data to the CoPilot system, using the
DataEntry > Read Abbott BG Meter command.
If your device is not listed below, please contact Abbott Diabetes Care, Customer Care to
determine if your device is supported.
Supported Devices and Databases
Precision Xtra, Optium, Precision Easy, Optium Easy, EasySense, TrueSense, Precision
Xceed, Optium Xceed Meter Interface
Glucose Event Data
• Date/time of event
• Data source (to distinguish manual or device)
• Glucose value
• Device ID (serial number)
Ketone Event Data
• Date/time of event
• Data source (to distinguish manual or device)
• Ketone value
• Device ID (serial number)
Precision Link v2.5 and Higher Interface
Glucose Event Data
• Date/time of event
• Data source (to distinguish manual or device)
• Glucose value
Ketone Event Data
• Date/time of event
• Data source (to distinguish manual or device)
• Ketone value
123
Appendix C
User Contact Information
• First name
• Last name
Glucose Targets
• High value
• Low value
Time Periods
• Time periods
CoZmanager Interface
User Contact Information
• First name
• Last name
Glucose Event Data
• Date/time of event
• Data source (to distinguish manual or device)
• Glucose value
• Device ID (serial number)
Correction Bolus Event Data
• Date/time of event
• Dosage
• Administration type (correction, meal, general)
Meal Bolus Event Data
• Date/time of event
• Dosage
• Administration type (meal, general)
Basal Rate Event Data
• Date/time of event
• Rate
• Administration type (programmed, temporary)
Temp Basal Rate Event Data
• Date/time of event
• Rate
• Administration type (programmed, temporary)
Carbohydrate Event Data
• Date/time of event
• Carbohydrates
Daily Basal Insulin Sum Data
• Date
• Basal insulin daily total
124
Appendix C
Daily Meal Bolus Sum Data
• Date
• Meal bolus insulin daily total
Daily Correction Bolus Sum Data
• Date
• Correction bolus insulin daily total
FreeStyle Connect Interface
User Contact Info
• Patient last name
• Patient first name
Glucose Targets
• High value
• Low value
Time Periods
• Time Periods
Glucose Event Data
• Date/time of event
• Data source (to distinguish manual or device)
• Glucose value
• Device ID (serial number)
• Status flag
• Cal code
FreeStyle family of meters and Optium Mini Meter Interface
Glucose Event Data
• Date/time of event
• Data source (to distinguish manual or device)
• Glucose value
• Device ID (serial number)
• Status flag
• Cal code
125
Appendix D
Appendix D: Warning, Caution and
Important Messages
For reference, Warning, Caution and Important messages included in this guide
are listed below.
WARNING Messages
The following WARNING messages are included in this User’s Guide.
Section 4
• To avoid the possibility of electrical shock, never perform a blood glucose test while the
meter is connected to the computer.
• Be sure to enter and check all values carefully. The CoPilot system cannot check that the
entries you make are correct for your personal needs. Serious effects on your health
could result from relying on or using improper or incomplete entries. Discuss the data
entry options available with your HCP so you are both clear on the amount and types of
information for therapy analysis.
• Imports from the CoZmanager System include data only from full days (24 hours), not
partial days. This is so that CoZmanager can provide daily totals.
Section 5
• Have your healthcare professional review and confirm your entries before using this
data. Serious effects on your health could result from relying on or using incorrect
entries.
• Imports from the CoZmanager System (pump) include data only from full days (24
hours), not partial days. This is so that CoZmanager can provide daily totals.
• Some Deltec Cozmo Insulin Pump events such as disconnect, reconnect and cancelled
boluses are not included.
Section 6
• Do not change your medication unless advised by your healthcare professional.
• Be sure to enter and check all values carefully. The CoPilot system cannot check that the
entries you make are correct for your personal needs. Serious effects on your health
could result from relying on or using improper or incomplete entries. Discuss the data
entry options available with your HCP so you are both clear on the amount and types of
information for therapy analysis.
126
Appendix D
CAUTION Messages
The following CAUTION messages are included in this User’s Guide.
Section 2
• You must set the CoPilot system to use the same Unit of Measure that you use on your
glucose meter. Selecting the incorrect Unit of Measure can result in misinterpretation of
test results.
• Ensure that you discuss results with your patients using the same Unit of Measure that
they use. Confusion about the Unit of Measure can result in misinterpretation of test
results.
Section 4
• The CoPilot system assumes a single glucose calibration type, either plasma or whole
blood.
• Ensure that the time and date are set correctly on your personal computer and other
devices.
• When uploading glucose data from a device, the CoPilot system does not differentiate
between devices that are whole-blood or plasma calibrated. The CoPilot system merely
uploads the data with no calculations made. Because there are slight differences
between the two calibrations, you should not mix data from devices that use different
calibration references. It is possible to enter duplicate data entries into the CoPilot Health
Management System.
The CoPilot system does not check the accuracy of the data the user provides. For
example, a user of the Deltec Cozmo insulin pump might record the carbohydrates for a
meal (for example, 25 g) and enter it into the Deltec Cozmo software. When the user
uploads the data from the pump, a meal entry (25 g) will be created in your CoPilot
system. If the user also manually enters a meal entry (25 g) for that same meal in the
CoPilot Software, two meal entries would result (at slightly different times), thereby
accidentally recording a total of 50 g for the meal. The user must take reasonable
precautions to prevent duplication errors. For example, choose one location for
recording certain data types (i.e., on a single device or in a particular software program).
• Do not upload data from any device that has recorded data for more than one person.
The CoPilot system cannot identify if data on a device has ever been recorded for more
than one person. All data stored on a device is uploaded to the database for the person
associated with the device in the CoPilot system.
• It is possible to enter duplicate data entries into the CoPilot Health Management System.
The CoPilot system does not check the accuracy of the data the user provides. For
example, a user of the Deltec Cozmo insulin pump might record the carbohydrates for a
meal (for example, 25 g) and enter it into the Deltec Cozmo software. When the user
uploads the data from the pump, a meal entry (25 g) will be created in your CoPilot
system. If the user also manually enters a meal entry (25 g) for that same meal in the
CoPilot system Software, two meal entries would result (at slightly different times),
thereby accidentally recording a total of 50 g for the meal. The user must take reasonable
precautions to prevent duplication errors. For example, choose one location for
recording certain data types (i.e., on a single device or in a particular software program).
127
Appendix D
• Contact your healthcare professional for guidance on determining and using your insulin
dosages, insulin-to-carbohydrate ratios, and insulin sensitivities.
• Contact your healthcare professional for guidance on determining and using your
prescribed carbohydrate intake.
Section 5
• For glucose and insulin entries, if the Time Period is changed manually, all reports will
still be displayed as defined by the Time Period setting in the User Profile.
• If any event data is Hidden, a comment will appear at the top of the report indicating the
number of Hidden events. Hidden data will not be displayed or included in the
calculations for this report.
• If the user reconfigures the Glucose Modal Day report by turning Display Time Periods
OFF, the Glucose Modal Day report will go back to plotting the data point based on the
user-configured time period and remove the Time Period labels across the top of the
graph. This can result in a data point for any glucose reading, where a user manually
assigned the time period, being displayed in a different location on the Glucose Modal
Day graph. When the Display Time Periods is ON, the glucose reading that has a manually
assigned time period will be displayed on the graph in the middle of the time period
assigned.
• Total Insulin statistics based on data from the CoZmanager System (pump) may differ
from the sum of the individual insulin fields that make up the total. This is because
CoZmanager may record the amount of a cancelled bolus. The Total Insulin statistic on
any the CoPilot system report displays only the insulin delivered, not the cancelled bolus.
• Total Insulin statistics may appear to vary from report to report. This is usually due to
how the report defines a day.
Section 6
• Contact your healthcare professional for guidance on determining and using your insulin
dosages, insulin-to-carbohydrate ratios, and insulin sensitivities.
• Contact your healthcare professional for guidance on determining and using your
prescribed carbohydrate intake.
• The CoPilot system does not calculate your insulin sensitivity or your insulin-to
carbohydrate ratio. These should always be determined by your healthcare professional.
128
Appendix D
IMPORTANT Messages
Section 2
• This procedure is different for home users and HCPs. Select the correct
procedure below.
Section 4
• To avoid losing data, upload data from your device often. Most devices hold only a limited
number of historical records.
• Always refer to the user’s guide that came with your device or pump for complete
instructions on its use.
• Any data you previously uploaded from a device will not be overwritten when you
upload again from that same device. Only the new data will be added to your file.
• Medication Event refers to all medications you take except insulin.
• Be careful to type numbers only into the Result Value field. For example, if your A1C test
result is 7.6%, type 7.6 in the Result Value field and type % in the Units field. If you type
the units in the Result Value field, the entry for this lab test will not be displayed correctly
in the reports you generate.
Section 7
• As a precaution, you should make a full backup of your CoPilot system database before
upgrading your operating system.
129
Appendix E
Appendix E: CoPilot System
Network Installation
About CoPilot System Network Installation
This appendix provides instructions for setting up a network installation for the CoPilot Health
Management System. The instructions assume that the user is setting up a CoPilot system
database on a central computer (server) that will provide data access for one or more CoPilot
system installations (clients) residing on other machines in a common network. The user
setting up the network installation must have a working knowledge of Windows and basic
networking terminology.
Installing the CoPilot System Server
The CoPilot system server setup program (SetupCoPilotServer.exe) can be found on the Abbott
Diabetes Care website (www.abbottdiabetescare.com) or on the CoPilot system installation CD.
You may install the CoPilot system server setup program from either location.
A. Downloading from the Abbott Diabetes Care website:
1. Open the website www.CoPilot.AbbottDiabetesCare.com in your internet browser.
2. Click on the CoPilot Health Management LAN Database Installer and install the CoPilot
system server setup program (SetupCoPilotServer.exe) on the host server to be used.
B. Installing from the CoPilot system installation CD:
1. Place the disc in the CD/DVD drive of the server.
Note: Do not install the CoPilot Health Management System program, which starts
automatically. Instead, open the contents of the CD and locate the LAN Server folder
2. Open the LAN Server folder
3. Install the CoPilot system server on the host server by running SetupCoPilotServer.exe
4. When the installation is complete, go to the Windows Control Panel and open the Firebird
2.0 Server Manager applet. Make sure it is configured like this:
Start button
Figure 125. Firebird 2.0 Server Manager
130
Appendix E
Note: Be sure to click the Start button to run the Firebird Server application.
Note: If the CoPilot system Client application was previously installed, it will need to be
uninstalled prior to installing the server.
Installing the CoPilot Server Client Application
1. Install the CoPilot system client application (Setup.exe) on a client computer with network
connectivity to the host server.
2. Run the client application. Select System Settings from the File menu.
Figure 126. File Menu, System Settings Command
3. The System Settings screen displays.
Figure 127. System Settings
131
Appendix E
4. Under Database Options, select Remote Server. Note that Browse is now disabled.
Figure 128. System Settings: Remote Server Mode
5. Enter the computer name of the server into the text box labeled Server Name. This is the
name that the computer is identified by on the local network.
6. Enter the complete path and file name for the server database in the Database Name text
box (for example, C:\Program Files\CoPilot Server\Database\CoPilot.cpd). DO NOT use
the full path specification that includes \ComputerName\C\...
7. Click TEST. If the connection is successful, a confirmation message displays.
8. Click OK, and close the program.
9. If the connection is not successful, you will receive an error message.
Restarting the Client
1. Restart the CoPilot system on the client. You may need to set up the user again (as either a
Home User or a Health Care Professional) even if you did so in the past. This will establish
the server database as either a Home or HCP system. All subsequent clients that attach to
the server database will use the established Home or HCP selection.
2. The lower left corner of the client should indicate the name of the current database
(CoPilot.cpd, unless you have created and named your own CoPilot client database).
132
Index
Index
A
ADC customer care vi, 120
archiving data 106
restoring archived data 109
viewing archived data 108
C
caution 127
defined 4
computer requirements vi
CoPilot Health Management System
about v, 1
intended use v
customer care
contacting 120
D
daily combination view report 96
carbohydrates graph 97
data table 98
glucose line graph 97
insulin summary 98
database management 106
archiving data 106
backing up a database 110
automatic backup 110
manual backup 110
restoring archived data 109
restoring backed-up database 111
viewing archived data 108
viewing restore log 113
data entry
manual 46
exercise activity 52
glucose reading 48
insulin dose 49
ketone reading 57
lab test result 56
meal entry 50
medical/doctor exam 55
medication entry 54
note 58
state of health 53
data filters 72
data symbols 69
day, definition of 75
device
connect to your computer 42, 43
undoing last upload 45
uploading data 42, 43
diary list 76
customize columns 78
hide/unhide events 77
E
e-mailing reports 70
exporting data 64
G
glucose average report 83
glucose events
glucose (BG) 72
glucose (CM) 72
glucose histogram report 85
glucose line report 82
show/hide line 82
glucose modal day report 80
glucose pie chart report 86
glucose target modes 75
glucose target range
colours 69
H
HCP group analysis report 101
customize columns 101
HCP version
about v, 1, 2, 12, 29
profile 29
adding HCP profile 39
adding patient profile 36
assigning an HCP 39
changing/adding profile 36
deleting an HCP profile 40
editing HCP profile 40
editing patient profile 38
glucose targets tab 32
options tab 35
removing patient profile 38
133
Index
help
using 9
home page
about 5
Home User version
about v, 1, 12
profile 15
adding HCP profile 26
adding user profile 24
changing/updating 24
data entry preferences 19
deleting HCP profile 28
editing HCP profile 28
glucose targets tab 20
health profile tab 18
options tab 23
removing user profile 24
I
important note 129
defined 4
importing data 61
from a file 62
supported database 61
installation 10
network 10, 130
insulin-to-carbohydrate ratio 105
insulin sensitivity factor 104
L
lab and exam record report 88
lists 59
customizing 59
logbook report 87
logon 115
M
manual data entry 46
P
password protection 114
prescribed plan 104
filling in 105
insulin-to-carbohydrate ratio 105
insulin sensitivity 104
printing 70
automatic report 31
R
data symbols 69
date range 68
definition of a day 75
display features 73
e-mailing 70
glucose target modes 75
opening 67
personalizing settings 71
printing 70
reports toolbar 68
target range colours 69
viewing 68
restore log
viewing 113
S
security 114
statistics report 88
carbohydrates statistics 95
glucose statistics 89
insulin statistics 92
pump statistics 93
supported devices/databases 123
system administrator profile 114
T
technical support vi
terminology 2
troubleshooting 121
access violation errors 122
data import 121
device connection 121
pdf attachments 122
printing 122
U
undoing device upload 45
unit of measure
select 13
uploading data from device 43
user rights 116
assigning 117
W
warning 126
defined 4
weekly pump view report 99
select week 99
reports 66
data filters 72
134
CoPilot System User’s Guide
© 2007 Abbott. All rights reserved.
Abbott Diabetes Care Inc.
Alameda, CA 94502
www.AbbottDiabetesCare.com
Published in USA
Copyright and Trademarks
This document is the property of the Abbott Group of Companies and shall not be reproduced, distributed, disclosed, or used
for manufacture or sale of Systems without the express written consent of the Abbott Group of Companies.
Permission is granted to print copies of this document for use solely by the CoPilot system user.
FreeStyle, FreeStyle Connect, FreeStyle Flash, FreeStyle Freedom, FreeStyle Navigator, CoPilot, Precision Xtra, and
Precision Link are trademarks of the Abbott Group of Companies.
CozMore, Deltec CoZmo, CoZmanager, and CoZmonitor are registered trademarks of Smiths Medical MD, Inc.
Adobe, Acrobat, and Reader are registered trademarks of Adobe Systems Incorporated.
Microsoft, Windows, and Internet Explorer are registered trademarks of Microsoft Corp.
Other trademarks are the property of their respective owners and are hereby acknowledged.
Disclaimers and Limitations of Liability
The information contained in this Guide, including but not limited to any product specifications, is subject to change without
notice.
Abbott Diabetes Care makes no representations or warranties of any kind concerning the contents of this Guide. Under no
circumstances will Abbott Diabetes Care be held liable for any loss or other damages pertaining to the use of this Guide.
135