1
KaryoStudio v1.2
User Guide
Software for Cytogenetics
Data Analysis and Reporting
FOR RESEARCH USE ONLY
ILLUMINA PROPRIETARY
Part # 11328837, Rev. B
KaryoStudio v1.2
User Guide
Software for Cytogenetics
Data Analysis and Reporting
FOR RESEARCH USE ONLY
ILLUMINA PROPRIETARY
Part # 11328837, Rev. B
Notice
This document and its contents are proprietary to Illumina, Inc. and its
affiliates ("Illumina"), and are intended solely for the contractual use of its
customer in connection with the use of the product(s) described herein and
for no other purpose. This document and its contents shall not be used or
distributed for any other purpose and/or otherwise communicated,
disclosed, or reproduced in any way whatsoever without the prior written
consent of Illumina. Illumina does not convey any license under its patent,
trademark, copyright, or common-law rights nor similar rights of any third
parties by this document.
The instructions in this document must be strictly and explicitly followed by
qualified and properly trained personnel in order to ensure the proper and
safe use of the product(s) described herein. All of the contents of this
document must be fully read and understood prior to using such product(s).
FAILURE TO COMPLETELY READ AND EXPLICITLY FOLLOW ALL OF THE
INSTRUCTIONS CONTAINED HEREIN MAY RESULT IN DAMAGE TO THE
PRODUCT(S), INJURY TO PERSONS, INCLUDING TO USERS OR OTHERS,
AND DAMAGE TO OTHER PROPERTY.
ILLUMINA DOES NOT ASSUME ANY LIABILITY ARISING OUT OF THE
IMPROPER USE OF THE PRODUCT(S) DESCRIBED HEREIN (INCLUDING
PARTS THEREOF OR SOFTWARE) OR ANY USE OF SUCH PRODUCT(S)
OUTSIDE THE SCOPE OF THE EXPRESS WRITTEN LICENSES OR
PERMISSIONS GRANTED BY ILLUMINA IN CONNECTION WITH
CUSTOMER'S ACQUISITION OF SUCH PRODUCT(S).
FOR RESEARCH USE ONLY
© 2010 Illumina, Inc. All rights reserved.
Illumina, illuminaDx, Solexa, Making Sense Out of Life, Oligator, Sentrix,
GoldenGate, GoldenGate Indexing, DASL, BeadArray, Array of Arrays,
Infinium, BeadXpress, VeraCode, IntelliHyb, iSelect, CSPro,
GenomeStudio, Genetic Energy, and HiSeq are registered trademarks or
trademarks of Illumina, Inc. All other brands and names contained herein are
the property of their respective owners.
Oligonucleotide capture sequences © 2003 Illumina, Inc. All rights reserved.
KaryoStudio v1.2 User Guide
KaryoStudio v1.2
User Guide
Software for Cytogenetics
Data Analysis and Reporting
FOR RESEARCH USE ONLY
ILLUMINA PROPRIETARY
Part # 11328837, Rev. B
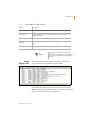
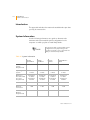
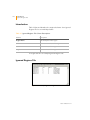
Revision History
Title
Part Number
Revision
Date
KaryoStudio v1.0
User Guide
Part # 11328837
Rev. A
November 2008
KaryoStudio v1.2
User Guide
Part # 11328837
Rev. B
February 2010
KaryoStudio v1.2 User Guide
KaryoStudio v1.2
User Guide
Software for Cytogenetics
Data Analysis and Reporting
FOR RESEARCH USE ONLY
ILLUMINA PROPRIETARY
Part # 11328837, Rev. B
Table of Contents
Notice . . . . . . . . . . . . . . . . . . . . . . . . . . . . . . . . . . . . . . . . . . . . .iii
Revision History. . . . . . . . . . . . . . . . . . . . . . . . . . . . . . . . . . . . . . v
Table of Contents . . . . . . . . . . . . . . . . . . . . . . . . . . . . . . . . . . . vii
List of Figures . . . . . . . . . . . . . . . . . . . . . . . . . . . . . . . . . . . . . . . xi
List of Tables . . . . . . . . . . . . . . . . . . . . . . . . . . . . . . . . . . . . . . . xv
Chapter 1
Overview . . . . . . . . . . . . . . . . . . . . . . . . . . . . . . . . . . . 1
Introduction. . . . . . . . . . . . . . . . . . . . . . . . . . . . . . . . . . . . . . . . . 2
Audience and Purpose . . . . . . . . . . . . . . . . . . . . . . . . . . . . . . . . 2
Installing KaryoStudio . . . . . . . . . . . . . . . . . . . . . . . . . . . . . . . . . 3
KaryoStudio Workflow . . . . . . . . . . . . . . . . . . . . . . . . . . . . . . . . 6
Chapter 2
Loading Your Data . . . . . . . . . . . . . . . . . . . . . . . . . . . . 7
Introduction. . . . . . . . . . . . . . . . . . . . . . . . . . . . . . . . . . . . . . . . . 8
Creating a New Project . . . . . . . . . . . . . . . . . . . . . . . . . . . . . . . . 8
Loading Sample Intensity Data Using a Sample Sheet . . . 14
Loading Sample Intensity Data by Selecting Directories . . 21
Opening an Existing Project . . . . . . . . . . . . . . . . . . . . . . . . . . . 30
Assessing the Quality of Your Data. . . . . . . . . . . . . . . . . . . . . . 30
Chapter 3
User Interface . . . . . . . . . . . . . . . . . . . . . . . . . . . . . . 33
Introduction. . . . . . . . . . . . . . . . . . . . . . . . . . . . . . . . . . . . . . . . 34
Main Window Menus . . . . . . . . . . . . . . . . . . . . . . . . . . . . . . . . 35
Table Window . . . . . . . . . . . . . . . . . . . . . . . . . . . . . . . . . . . . . . 37
Found Regions Table . . . . . . . . . . . . . . . . . . . . . . . . . . . . . 37
Known Regions Table . . . . . . . . . . . . . . . . . . . . . . . . . . . . . 39
KaryoStudio v1.2 User Guide
viii
1
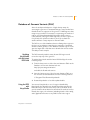
Database of Genomic Variants . . . . . . . . . . . . . . . . . . . . . . 42
Samples Table. . . . . . . . . . . . . . . . . . . . . . . . . . . . . . . . . . . 44
Chromosome Browser . . . . . . . . . . . . . . . . . . . . . . . . . . . . . . . . 45
Search Function . . . . . . . . . . . . . . . . . . . . . . . . . . . . . . . . . 46
Navigating the Chromosome Browser . . . . . . . . . . . . . . . . 47
Karyotype View . . . . . . . . . . . . . . . . . . . . . . . . . . . . . . . . . . . . . 52
Duo and Trio View . . . . . . . . . . . . . . . . . . . . . . . . . . . . . . . . . . . 56
Log Window . . . . . . . . . . . . . . . . . . . . . . . . . . . . . . . . . . . . . . . 59
Chapter 4
Analyzing Found Regions . . . . . . . . . . . . . . . . . . . . . 61
Introduction . . . . . . . . . . . . . . . . . . . . . . . . . . . . . . . . . . . . . . . . 62
Filtering Found Regions . . . . . . . . . . . . . . . . . . . . . . . . . . . . . . 63
Displaying Found Regions. . . . . . . . . . . . . . . . . . . . . . . . . . . . . 65
Scrolling Through Found Regions . . . . . . . . . . . . . . . . . . . . . . . 67
Sorting Found Regions . . . . . . . . . . . . . . . . . . . . . . . . . . . . . . . 68
Adding or Editing Comments . . . . . . . . . . . . . . . . . . . . . . . . . . 70
Adjusting Found Region Parameters. . . . . . . . . . . . . . . . . . . . . 70
Editing Confidence Score or Estimated Copy Number . . . 70
Editing Start and Stop Positions . . . . . . . . . . . . . . . . . . . . . 73
Exporting Found Regions . . . . . . . . . . . . . . . . . . . . . . . . . . . . . 82
Chapter 5
Cross-Matching to Known Variants . . . . . . . . . . . . . . 85
Introduction . . . . . . . . . . . . . . . . . . . . . . . . . . . . . . . . . . . . . . . . 86
Database of Genomic Variants (DGV) . . . . . . . . . . . . . . . . . . . . 87
Updating KaryoStudio with the Latest DGV Build . . . . . . . 87
Using the DGV with KaryoStudio . . . . . . . . . . . . . . . . . . . . 87
DGV Data . . . . . . . . . . . . . . . . . . . . . . . . . . . . . . . . . . . . . . 94
Updating the DGV Table and Track . . . . . . . . . . . . . . . . . . 96
OMIM (Online Mendelian Inheritance of Man) . . . . . . . . . . . . . 96
Using OMIM with KaryoStudio . . . . . . . . . . . . . . . . . . . . . . 96
UCSC Genome Browser . . . . . . . . . . . . . . . . . . . . . . . . . . . . . 102
Using the UCSC Genome Browser with KaryoStudio . . . . 103
PubMed . . . . . . . . . . . . . . . . . . . . . . . . . . . . . . . . . . . . . . . . . . 104
Using PubMed with KaryoStudio . . . . . . . . . . . . . . . . . . . 104
DECIPHER . . . . . . . . . . . . . . . . . . . . . . . . . . . . . . . . . . . . . . . . 104
Using DECIPHER with KaryoStudio. . . . . . . . . . . . . . . . . . 105
Ensembl . . . . . . . . . . . . . . . . . . . . . . . . . . . . . . . . . . . . . . . . . . 106
Using Ensembl with KaryoStudio . . . . . . . . . . . . . . . . . . . 107
CHOP Database . . . . . . . . . . . . . . . . . . . . . . . . . . . . . . . . . . . 108
Using the CHOP CNV Database with KaryoStudio. . . . . . 109
Part # 11328837 Rev. B
Table of Contents
Chapter 6
Generating a Cytogenetics Report . . . . . . . . . . . . . 111
Introduction. . . . . . . . . . . . . . . . . . . . . . . . . . . . . . . . . . . . . . . 112
What's in a Cytogenetics Report? . . . . . . . . . . . . . . . . . . . . . . 112
Adjusting the Information in a Cytogenetics Report. . . . . . . . 116
Generating a New Cytogenetics Report . . . . . . . . . . . . . . . . . 116
Appendix A
Additional Information . . . . . . . . . . . . . . . . . . . . . . 117
Introduction. . . . . . . . . . . . . . . . . . . . . . . . . . . . . . . . . . . . . . . 118
System Information . . . . . . . . . . . . . . . . . . . . . . . . . . . . . . . . . 118
cnvPartition Algorithm . . . . . . . . . . . . . . . . . . . . . . . . . . . . . . 119
Confidence Score . . . . . . . . . . . . . . . . . . . . . . . . . . . . . . . 119
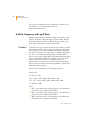
B Allele Frequency and Log R Ratio . . . . . . . . . . . . . . . . . . . . 120
Calculation . . . . . . . . . . . . . . . . . . . . . . . . . . . . . . . . . . . . 120
Interpretation . . . . . . . . . . . . . . . . . . . . . . . . . . . . . . . . . . 121
Appendix B
Sample Sheet . . . . . . . . . . . . . . . . . . . . . . . . . . . . . 123
Introduction. . . . . . . . . . . . . . . . . . . . . . . . . . . . . . . . . . . . . . . 124
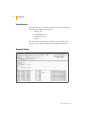
Sample Sheet . . . . . . . . . . . . . . . . . . . . . . . . . . . . . . . . . . . . . 124
Appendix C
Known Regions File . . . . . . . . . . . . . . . . . . . . . . . . . 125
Introduction. . . . . . . . . . . . . . . . . . . . . . . . . . . . . . . . . . . . . . . 126
Known Regions File. . . . . . . . . . . . . . . . . . . . . . . . . . . . . . . . . 126
Appendix D
Ignored Regions File . . . . . . . . . . . . . . . . . . . . . . . . 127
Introduction. . . . . . . . . . . . . . . . . . . . . . . . . . . . . . . . . . . . . . . 128
Ignored Regions File . . . . . . . . . . . . . . . . . . . . . . . . . . . . . . . . 128
KaryoStudio v1.2 User Guide
ix
List of Figures
Figure 1
Figure 2
Figure 3
Figure 4
Figure 5
Figure 6
Figure 7
Figure 8
Figure 9
Figure 10
Figure 11
Figure 12
Figure 13
Figure 14
Figure 15
Figure 16
Figure 17
Figure 18
Figure 19
Figure 20
Figure 21
Figure 22
Figure 23
Figure 24
Figure 25
Figure 26
Figure 27
Figure 28
Figure 29
Figure 30
Figure 31
Figure 32
Registration Screen . . . . . . . . . . . . . . . . . . . . . . . . . . . . . . . . . . . 4
Registration Complete . . . . . . . . . . . . . . . . . . . . . . . . . . . . . . . . 5
Main Window . . . . . . . . . . . . . . . . . . . . . . . . . . . . . . . . . . . . . . . 6
Wizard - Welcome Screen. . . . . . . . . . . . . . . . . . . . . . . . . . . . . . 9
Wizard - Project Location Screen . . . . . . . . . . . . . . . . . . . . . . . 10
Wizard - Project Repository Location . . . . . . . . . . . . . . . . . . . . 11
Wizard - Project Name . . . . . . . . . . . . . . . . . . . . . . . . . . . . . . . 12
Wizard - Loading Sample Intensities Screen. . . . . . . . . . . . . . . 13
Wizard - Loading Sample Intensities Screen (Sample Sheet) . . 14
Wizard - Sample Sheet . . . . . . . . . . . . . . . . . . . . . . . . . . . . . . . 15
Wizard - Data Repository . . . . . . . . . . . . . . . . . . . . . . . . . . . . . 16
Wizard - Manifest Repository . . . . . . . . . . . . . . . . . . . . . . . . . . 17
Wizard - Cluster Positions . . . . . . . . . . . . . . . . . . . . . . . . . . . . . 18
Wizard - Select Cluster Positions File . . . . . . . . . . . . . . . . . . . . 19
KaryoStudio Status Bar . . . . . . . . . . . . . . . . . . . . . . . . . . . . . . . 20
Project Created Using a Sample Sheet . . . . . . . . . . . . . . . . . . . 21
Wizard - Loading Sample Intensities Screen (Directories). . . . . 22
Wizard - SNP Manifest . . . . . . . . . . . . . . . . . . . . . . . . . . . . . . . 23
Wizard - Data Repository . . . . . . . . . . . . . . . . . . . . . . . . . . . . . 24
Wizard - Selected Data . . . . . . . . . . . . . . . . . . . . . . . . . . . . . . . 25
Wizard - Cluster Positions Screen . . . . . . . . . . . . . . . . . . . . . . . 26
Wizard - Cluster Positions . . . . . . . . . . . . . . . . . . . . . . . . . . . . . 27
KaryoStudio Status Bar . . . . . . . . . . . . . . . . . . . . . . . . . . . . . . . 28
KaryoStudio Project . . . . . . . . . . . . . . . . . . . . . . . . . . . . . . . . . 29
KaryoStudio Screen Configuration . . . . . . . . . . . . . . . . . . . . . . 34
Found Regions Table . . . . . . . . . . . . . . . . . . . . . . . . . . . . . . . . 37
Known Regions Table . . . . . . . . . . . . . . . . . . . . . . . . . . . . . . . . 39
Database of Genomic Variants . . . . . . . . . . . . . . . . . . . . . . . . . 42
Samples Table. . . . . . . . . . . . . . . . . . . . . . . . . . . . . . . . . . . . . . 44
Chromosome Browser . . . . . . . . . . . . . . . . . . . . . . . . . . . . . . . 46
SNP Name Tooltip . . . . . . . . . . . . . . . . . . . . . . . . . . . . . . . . . . 48
Cytoband Tooltip . . . . . . . . . . . . . . . . . . . . . . . . . . . . . . . . . . . 48
KaryoStudio v1.2 User Guide
xii
List of Figures
Figure 33
Figure 34
Figure 35
Figure 36
Figure 37
Figure 38
Figure 39
Figure 40
Figure 41
Figure 42
Figure 43
Figure 44
Figure 45
Figure 46
Figure 47
Figure 48
Figure 49
Figure 50
Figure 51
Figure 52
Figure 53
Figure 54
Figure 55
Figure 56
Figure 57
Figure 58
Figure 59
Figure 60
Figure 61
Figure 62
Figure 63
Figure 64
Figure 65
Figure 66
Figure 67
Figure 68
Figure 69
Figure 70
Figure 71
Figure 72
Figure 73
Figure 74
DGV Tooltip. . . . . . . . . . . . . . . . . . . . . . . . . . . . . . . . . . . . . . . . 49
Chromosome Browser Alignment Cursor . . . . . . . . . . . . . . . . . 50
Karyotype View Window, One Sample Selected. . . . . . . . . . . . 53
Karyotype View Window, Three Samples Selected. . . . . . . . . . 54
Karyotype View, Found Region Information . . . . . . . . . . . . . . . 55
Found Region in Karyotype View Window . . . . . . . . . . . . . . . . 55
Found Region in Chromosome Browser . . . . . . . . . . . . . . . . . . 56
Selecting Additional Data Plot to Display . . . . . . . . . . . . . . . . . 57
Chromosome Browser, Duo View . . . . . . . . . . . . . . . . . . . . . . . 57
Chromosome Browser, Trio View . . . . . . . . . . . . . . . . . . . . . . . 58
Trio View, Additional Plot Settings Selected . . . . . . . . . . . . . . . 58
Single Sample View with Gene Display . . . . . . . . . . . . . . . . . . . 59
Log Window . . . . . . . . . . . . . . . . . . . . . . . . . . . . . . . . . . . . . . . 59
Found Regions Table . . . . . . . . . . . . . . . . . . . . . . . . . . . . . . . . 62
FoundRegionsFilterForm . . . . . . . . . . . . . . . . . . . . . . . . . . . . . . 64
Found Region Displayed in Chromosome Browser. . . . . . . . . . 66
Found Region Displayed in Context of Whole Chromosome . . 67
Aberration Length Sorted Short to Long. . . . . . . . . . . . . . . . . . 68
Aberration Length Sorted Long to Short. . . . . . . . . . . . . . . . . . 69
Aberrations Sorted by Chromosome. . . . . . . . . . . . . . . . . . . . . 69
Editing a Found Region. . . . . . . . . . . . . . . . . . . . . . . . . . . . . . . 71
Form Settings Dialog Box . . . . . . . . . . . . . . . . . . . . . . . . . . . . . 72
Selecting a Found Region of Interest . . . . . . . . . . . . . . . . . . . . 74
Panning Up to Examine the Boundaries of a Found Region . . . 75
Panning Down to Examine the Boundaries of a Found Region 76
Centering a Found Region . . . . . . . . . . . . . . . . . . . . . . . . . . . . 77
Using the Horizontal Ruler . . . . . . . . . . . . . . . . . . . . . . . . . . . . . 78
Ruler with Coordinates Tooltip . . . . . . . . . . . . . . . . . . . . . . . . . 78
Editing a Found Region. . . . . . . . . . . . . . . . . . . . . . . . . . . . . . . 79
Editing the Parameters of a Found Region . . . . . . . . . . . . . . . . 80
Form Settings Screen . . . . . . . . . . . . . . . . . . . . . . . . . . . . . . . . 81
Viewing the New Found Region Positions . . . . . . . . . . . . . . . . 82
Copying Found Regions to the Clipboard . . . . . . . . . . . . . . . . 83
Selecting a Found Region . . . . . . . . . . . . . . . . . . . . . . . . . . . . . 88
Selecting the DGV . . . . . . . . . . . . . . . . . . . . . . . . . . . . . . . . . . . 89
DGV Genome Browser View . . . . . . . . . . . . . . . . . . . . . . . . . . . 89
All CNVs . . . . . . . . . . . . . . . . . . . . . . . . . . . . . . . . . . . . . . . . . . 90
Inspecting a Variation . . . . . . . . . . . . . . . . . . . . . . . . . . . . . . . . 91
DGV, Variation Number. . . . . . . . . . . . . . . . . . . . . . . . . . . . . . . 91
DGV, Cytogenetic Band . . . . . . . . . . . . . . . . . . . . . . . . . . . . . . 92
DGV, All CNVs. . . . . . . . . . . . . . . . . . . . . . . . . . . . . . . . . . . . . . 92
DGV, Indels . . . . . . . . . . . . . . . . . . . . . . . . . . . . . . . . . . . . . . . . 93
Part # 11328837 Rev. B
List of Figures
Figure 75
Figure 76
Figure 77
Figure 78
Figure 79
Figure 80
Figure 81
Figure 82
Figure 83
Figure 84
Figure 85
Figure 86
Figure 87
Figure 88
Figure 89
Figure 90
Figure 91
Figure 92
Figure 93
Figure 94
DGV, Additional Information . . . . . . . . . . . . . . . . . . . . . . . . . . 93
DGV, PubMed Reference . . . . . . . . . . . . . . . . . . . . . . . . . . . . . 94
KaryoStudio DGV Table . . . . . . . . . . . . . . . . . . . . . . . . . . . . . . 95
Selecting a Known Region in the DGV Table . . . . . . . . . . . . . . 95
Selecting OMM . . . . . . . . . . . . . . . . . . . . . . . . . . . . . . . . . . . . . 97
OMIM, Home Page . . . . . . . . . . . . . . . . . . . . . . . . . . . . . . . . . . 98
OMIM, MYC Gene . . . . . . . . . . . . . . . . . . . . . . . . . . . . . . . . . . 99
OMIM, Additional Information . . . . . . . . . . . . . . . . . . . . . . . . 100
OMIM, Gene Function . . . . . . . . . . . . . . . . . . . . . . . . . . . . . . 101
OMIM, Down System Information Page . . . . . . . . . . . . . . . . . 102
Selecting DECIPHER . . . . . . . . . . . . . . . . . . . . . . . . . . . . . . . . 105
DECIPHER . . . . . . . . . . . . . . . . . . . . . . . . . . . . . . . . . . . . . . . . 106
Selecting Ensembl. . . . . . . . . . . . . . . . . . . . . . . . . . . . . . . . . . 107
Ensembl . . . . . . . . . . . . . . . . . . . . . . . . . . . . . . . . . . . . . . . . . 108
Selecting the CHOP CNV Database . . . . . . . . . . . . . . . . . . . . 109
CHOP CNV Database CNVs . . . . . . . . . . . . . . . . . . . . . . . . . . 110
Cytogenetics Report . . . . . . . . . . . . . . . . . . . . . . . . . . . . . . . . 113
Example Sample Sheet . . . . . . . . . . . . . . . . . . . . . . . . . . . . . . 124
Example Known Regions File . . . . . . . . . . . . . . . . . . . . . . . . . 126
Example Ignored Regions File . . . . . . . . . . . . . . . . . . . . . . . . 128
KaryoStudio v1.2 User Guide
xiii
xiv
List of Figures
Part # 11328837 Rev. B
List of Tables
Table 1
Table 2
Table 3
Table 4
Table 5
Table 6
Table 7
Table 8
Table 9
Table 10
Table 11
Table 12
Table 13
Table 14
KaryoStudio Toolbar Button Options . . . . . . . . . . . . . . . . . . . . 35
Found Regions Table Columns . . . . . . . . . . . . . . . . . . . . . . . . . 38
Known Regions Table Columns . . . . . . . . . . . . . . . . . . . . . . . . 40
Database of Genomic Variants Columns . . . . . . . . . . . . . . . . . 43
Samples Table Columns . . . . . . . . . . . . . . . . . . . . . . . . . . . . . . 44
DGV Track Colors . . . . . . . . . . . . . . . . . . . . . . . . . . . . . . . . . . . 49
Chromosome Browser Elements. . . . . . . . . . . . . . . . . . . . . . . . 51
Log Window Elements . . . . . . . . . . . . . . . . . . . . . . . . . . . . . . . 60
Cytogenetics Report - Header . . . . . . . . . . . . . . . . . . . . . . . . 114
Cytogenetics Report - Detected Region Information . . . . . . . 114
Cytogenetics Report - Footer . . . . . . . . . . . . . . . . . . . . . . . . . 115
System Information . . . . . . . . . . . . . . . . . . . . . . . . . . . . . . . . . 118
Known Regions File Column Descriptions . . . . . . . . . . . . . . . 126
Ignored Regions File Column Descriptions . . . . . . . . . . . . . . 128
KaryoStudio v1.2 User Guide
Chapter 1
Overview
Topics
2
Introduction
2
Audience and Purpose
3
Installing KaryoStudio
6
KaryoStudio Workflow
KaryoStudio v1.2 User Guide
2
CHAPTER 1
Overview
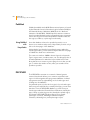
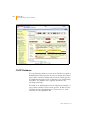
Introduction
Cytogenetics is an area of genetics that focuses on chromosomal
aberrations resulting in various conditions and phenotypes. It
includes the routine analysis of G-banded chromosomes
(karyotyping), as well as molecular cytogenetics such as
fluorescent in situ hybridization (FISH) and comparative genomic
hybridization (CGH).
In recent years, many forms of cytogenetics have moved to
array-based technologies. Because of the added benefit that
SNP information can provide, the field has begun to incorporate
such information into their research.
This user guide describes Illumina's KaryoStudio cytogenetics
software. KaryoStudio allows researchers to analyze data
generated from Illumina's Infinium® DNA Analysis BeadChips
and generate *.pdf reports from this data.
NOTE
KaryoStudio software is for research
use only.
Audience and Purpose
This guide is written for researchers who want to use Illumina's
KaryoStudio software to analyze data generated from Illumina's
Infinium assays, to identify cytogenetic or structural aberrations,
and to generate *.pdf reports from this data.
KaryoStudio has been designed specifically for cytogeneticists
who are using Illumina’s Infinium products to detect aberrations
in the genome. KaryoStudio accepts Infinium data, automatically
performs normalization, scans data for aberrations, displays the
analyzed data allowing interpretation by the use, and generates
reports useful for interpreting results. The software is geared
towards finding aberrations that are 75kb and larger, and crossmatching those aberrations with information from public
databases.
Part # 11328837 Rev. B
Installing KaryoStudio
KaryoStudio is standalone software application, separate from
Illumina’s GenomeStudio® software suite. If you would like to
obtain comprehensive genotyping information from data
generated using Infinium products, or perform a more
customized data analysis, you may want to use the
GenomeStudio Genotyping Module. For more information
about this and other Illumina software products, contact your
local account manager or visit www.illumina.com.
Installing KaryoStudio
If you do not have KaryoStudio v1.0 installed on your computer,
you can immediately install KaryoStudio v1.2 from the CD.
If you are a KaryoStudio v1.0 user, you must uninstall this version
from your computer before you can install KaryoStudio v1.2. If
you do not uninstall KaryoStudio v1.0 before attempting to
uninstall KaryoStudio v1.2, you will be prompted to do so.
You may also need to uninstall the cnvPartition algorithm you are
currently using. cnvPartition v2.4.4 will be installed automatically
with KaryoStudio v1.2.
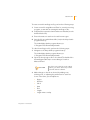
To install KaryoStudio, perform the following steps:
1. Put the KaryoStudio CD into your CD drive.
If the Illumina KaryoStudio Installation screen appears,
continue to Step 2.
If the CD does not load automatically, double-click the
KaryoStudio<version>.exe icon in the KaryoStudio folder on
the CD.
NOTE
KaryoStudio v1.2 User Guide
The CD includes two versions of
KaryoStudio.
If you are installing KaryoStudio on a 32-bit
computer, click KaryoStudio.exe.
If you are installing KaryoStudio on a 64-bit
computer, click KaryoStudio64.exe.
3
4
CHAPTER 1
Overview
The KaryoStudio application unzips and the KaryoStudio
application icon
appears on your desktop.
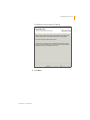
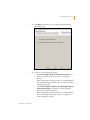
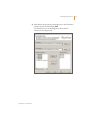
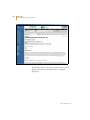
2. Double-click the KaryoStudio icon on your desktop. If this is
a new installation, the Registration screen appears (Figure 1).
Figure 1
Registration Screen
If you have previously installed and registered another
version of KaryoStudio, the registration screen does not
appear.
NOTE
The Registration Screen has a
GenomeStudio (GS) icon and refers to
Illumina’s GenomeStudio software suite.
This is because KaryoStudio, while
separate from GenomeStudio, uses the
same registration database.
3. Complete the following information:
•
User Name--Enter the user name you use to sign into
your computer
Part # 11328837 Rev. B
Installing KaryoStudio
•
Domain--KaryoStudio recognizes your network domain
and populates this field automatically.
•
Full Name--Enter your full name.
•
Email--Enter your email address.
•
Company Name--Enter the name of your organization
(company, institute, university, etc.).
•
Phone Number--Enter your phone number.
NOTE
Illumina uses this information for Technical
Support purposes.
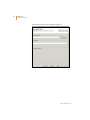
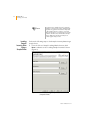
4. Click OK.
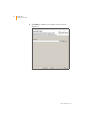
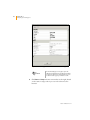
KaryoStudio is registered (Figure 2), and you can continue
the installation process.
Figure 2
Registration Complete
5. Click OK.
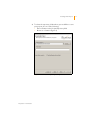
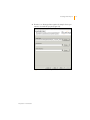
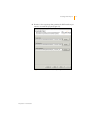
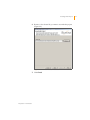
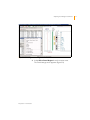
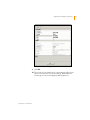
6. KaryoStudio is installed on your computer and opens to the
main window (Figure 3).
KaryoStudio v1.2 User Guide
5
6
CHAPTER 1
Overview
Figure 3
Main Window
From this screen, you can create a new KaryoStudio project,
open an existing project, view your data, generate reports, and
more. Continue to Chapter 2 for information about how to create
a KaryoStudio project.
KaryoStudio Workflow
A typical data visualization and analysis workflow using
KaryoStudio includes the following steps:
1. Use the project wizard to load data into KaryoStudio.
2. Scan the data for aberrations using KaryoStudio.
3. Adjust the filter settings to display found regions of interest.
4. Display found regions of interest in the chromosome browser
and Found Regions table.
5. Cross-match found regions to areas of the genome known to
be associated with various conditions or phenotypes.
6. Select report settings.
7. Generate a KaryoStudio Report.
Part # 11328837 Rev. B
Chapter 2
Loading Your Data
Topics
8
Introduction
8
Creating a New Project
14 Loading Sample Intensity Data Using a Sample Sheet
21 Loading Sample Intensity Data by Selecting Directories
30
Opening an Existing Project
30
Assessing the Quality of Your Data
KaryoStudio v1.2 User Guide
8
CHAPTER 2
Loading Your Data
Introduction
Using the Project Wizard is an easy way to begin a new
KaryoStudio project.
Before you create a project, make sure that you have the
following files easily accessible in a known location on your
computer:
` Intensity data files (*.idat files) from a BeadChip (or
BeadChips) of interest
` A product manifest (*.bpm file) specific to the BeadChip
product used
` A product cluster file (*.egt file) specific to the BeadChip
product used
Creating a New Project
To create a new KaryoStudio project, perform the following
steps:
1. On the KaryoStudio main screen, click
open the Project Wizard.
New Project to
Part # 11328837 Rev. B
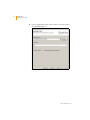
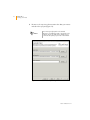
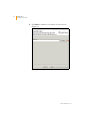
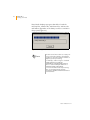
Creating a New Project
The Welcome screen appears (Figure 4).
Figure 4
2. Click Next.
KaryoStudio v1.2 User Guide
Wizard - Welcome Screen
9
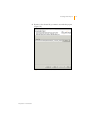
10
CHAPTER 2
Loading Your Data
The Project Location screen appears (Figure 5).
Figure 5
Wizard - Project Location Screen
Part # 11328837 Rev. B
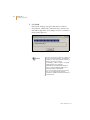
Creating a New Project
3. To select the repository folder where you would like to store
your project, do one of the following:
•
Enter a location in the Project Repository field
•
Browse to a location (Figure 6).
Figure 6
KaryoStudio v1.2 User Guide
Wizard - Project Repository Location
11
12
CHAPTER 2
Loading Your Data
4. In the Project Name area, enter a name for your project in
the text field (Figure 7).
Figure 7
Wizard - Project Name
Part # 11328837 Rev. B
Creating a New Project
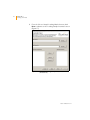
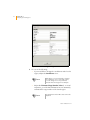
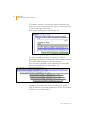
5. Click Next to advance to the Loading Sample Intensities
screen (Figure 8).
Figure 8
Wizard - Loading Sample Intensities Screen
6. Select one of the following options:
•
Select Use sample sheet to load intensity data if you
have a sample sheet that you want to use with this
project.
After selecting this method, continue to Loading Sample
Intensity Data Using a Sample Sheet on page 14 to finish
creating the project.
•
Select Load sample intensities by selecting directories
with intensity data if you want to load project data
directly from intensity data files.
After selecting this method, continue to Loading Sample
Intensity Data by Selecting Directories on page 21 to
finish creating the project.
KaryoStudio v1.2 User Guide
13
14
CHAPTER 2
Loading Your Data
NOTE
Loading
Sample
Intensity Data
Using a
Sample Sheet
You must use a sample sheet for optimal
analysis of sex chromosomes. KaryoStudio
requires the gender information imported
in the sample sheet in order to correctly
call found regions or normal regions on the
X and Y chromosomes. Without a sample
sheet, data plots will be accurate, but
found regions may not be.
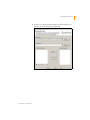
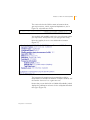
Perform the following steps to load sample intensity data using a
sample sheet.
1. From the Choose Sample Loading Method screen, click
Next to advance to the Loading Sample Intensities Screen
(Figure 9).
Figure 9
Wizard - Loading Sample Intensities Screen
(Sample Sheet)
Part # 11328837 Rev. B
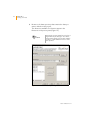
Creating a New Project
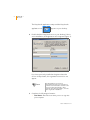
2. Browse to a directory that contains the sample sheet you
want to use with this project (Figure 18).
Figure 10
KaryoStudio v1.2 User Guide
Wizard - Sample Sheet
15
16
CHAPTER 2
Loading Your Data
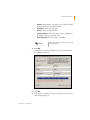
3. Browse to the repository that contains the data you want to
include in this project (Figure 19).
NOTE
Figure 11
You must specify a path in the wizard.
However, if a different path is specified in the
sample sheet, the path in the sample sheet
overrides the path you provide in the wizard.
Wizard - Data Repository
Part # 11328837 Rev. B
Creating a New Project
4. Browse to the repository that contains the SNP manifest you
want to use with this project (Figure 12).
Figure 12
KaryoStudio v1.2 User Guide
Wizard - Manifest Repository
17
18
CHAPTER 2
Loading Your Data
5. Click Next to advance to the Cluster Positions screen
(Figure 13).
Figure 13
Wizard - Cluster Positions
Part # 11328837 Rev. B
Creating a New Project
6. Browse to the cluster file you want to use with this project
(Figure 14).
Figure 14
KaryoStudio v1.2 User Guide
Wizard - Select Cluster Positions File
19
20
CHAPTER 2
Loading Your Data
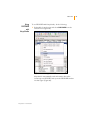
7. Click Finish.
KaryoStudio displays a progress bar while it loads the
intensity files, manifest file, and cluster files, and runs the
cnvPartition algorithm on the data you chose to include in
this project (Figure 23).
Figure 15
KaryoStudio Status Bar
NOTE
The amount of time it takes to create your
project is directly related to the Infinium
product you are using and the number of
samples you are processing.
For example, it takes longer to load and
analyze data from an Infinium
HumanOmni1-Quad BeadChip than it
does to load and analyze data from a
HumanCytoSNP-12 BeadChip.
For more information about processing
time, see the KaryoStudio System
Information and Benchmark Performance
Technical Note.
Part # 11328837 Rev. B
Creating a New Project
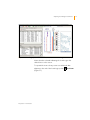
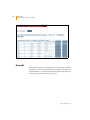
Once the data are finished processing and loading,
KaryoStudio displays the new project (Figure 24).
Figure 16
Project Created Using a Sample Sheet
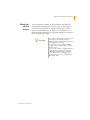
Continue to Assessing the Quality of Your Data on page 30 for
additional information.
Loading
Sample
Intensity Data
by Selecting
Directories
Perform the following steps if, instead of using a sample sheet,
you prefer to load sample intensity data by selecting the
directories that contain the data.
NOTE
KaryoStudio v1.2 User Guide
If you want to include gender data for the
samples in a KaryoStudio project, you must
create the project using a sample sheet
that includes gender data for the samples.
21
22
CHAPTER 2
Loading Your Data
1. From the Choose Sample Loading Method screen, click
Next to advance to the Loading Sample Intensities screen
(Figure 17).
Figure 17
Wizard - Loading Sample Intensities Screen
(Directories)
Part # 11328837 Rev. B
Creating a New Project
2. Browse to a directory that contains the SNP manifest you
want to use with this project (Figure 18).
Figure 18
KaryoStudio v1.2 User Guide
Wizard - SNP Manifest
23
24
CHAPTER 2
Loading Your Data
3. Browse to the data repository that contains the data you
want to include in this project.
The directories available for selection appear in the
Directories in Repository area (Figure 19).
NOTE
Figure 19
KaryoStudio accepts manifests only from a
single Infinium product type. You cannot
create a KaryoStudio project with multiple
products, or with different versions of the
same product.
Wizard - Data Repository
Part # 11328837 Rev. B
Creating a New Project
4. Add data to this project by selecting items in the Directories
in Repository area and clicking Add.
The directories you selected appear in the Selected
Directories area (Figure 20).
Figure 20
KaryoStudio v1.2 User Guide
Wizard - Selected Data
25
26
CHAPTER 2
Loading Your Data
5. Click Next to advance to the Cluster Positions screen
(Figure 21).
Figure 21
Wizard - Cluster Positions Screen
Part # 11328837 Rev. B
Creating a New Project
6. Browse to the cluster file you want to use with this project
(Figure 22).
Figure 22
7. Click Finish.
KaryoStudio v1.2 User Guide
Wizard - Cluster Positions
27
28
CHAPTER 2
Loading Your Data
KaryoStudio displays a progress bar while it loads the
intensity files, manifest file, and cluster files, and runs the
cnvPartition algorithm on the data you chose to include in
this project (Figure 23).
Figure 23
KaryoStudio Status Bar
NOTE
The amount of time it takes to create your
project is directly related to the Infinium
product you are using and the number of
samples you are processing.
For example, it takes longer to load and
analyze data from an Infinium
HumanOmni1-Quad BeadChip than it
does to load and analyze data from a
HumanCytoSNP-12 BeadChip.
For more information about processing
time, see the KaryoStudio System
Information and Benchmark Performance
Technical Note.
Part # 11328837 Rev. B
Creating a New Project
Once the data are finished processing and loading,
KaryoStudio displays the new project (Figure 24).
Figure 24
KaryoStudio Project
KaryoStudio v1.2 User Guide
29
30
CHAPTER 2
Loading Your Data
Opening an Existing Project
To open a project that was previously created and saved,
perform the following steps:
1. From the KaryoStudio main window, click
Existing Project.
Open an
2. Browse to the location of the project you want to open and
select Open.
Your project is loaded into KaryoStudio, and the project data
displays in the tables and chromosome browser.
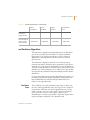
Assessing the Quality of Your Data
After your samples are loaded and analyzed in KaryoStudio, the
software automatically calculates a percent defects score and a
LogRDev for each sample. These metrics are useful when
determining whether there are any issues with a specific sample.
The percent defect score and LogRDev are displayed in the
lower left in the Samples Table.
The percent defects score is calculated by summing the length of
all of the found regions within a particular sample of interest and
dividing it by the length of the genome.
In control samples, such as non-constitutional samples, a percent
defect score of less than 1% is expected. In most cases, the value
is likely to be less than 0.5%. In samples that contain many
aberrations, such as tumor samples, the percent defect score is
expected to be much higher (in the 60-70% range). In addition, if
there were any issues during the processing of your Infinium
products, such as a misregistration or sample processing error,
this score is expected to be abnormally high.
Part # 11328837 Rev. B
Assessing the Quality of Your Data
The LogRDev metric is a measure of the noise in the data,
calculated as the standard deviation of the log R ratios for the
SNPs on the autosomes. This metric is a simple indicator of the
variation in the intensities measured for all markers from a
particular sample. When analyzing relatively normal samples and
following standard Illumina protocols for Infinium HD products,
LogRDev is expected to be less than 0.3. For more information
about interpreting LogRDev, see the Technical Note, Evaluating
Infinium Array Data for Copy Number Analysis.
NOTE
Illumina recommends analyzing control
samples along with your experimental
samples to ensure that there are minimal
processing issues. This provides a good
point of reference in the event that any
issues do arise.
For additional information about how to
QC your data, please refer to the
KaryoStudio FAQs on the web, or contact
Illumina Technical Support.
KaryoStudio v1.2 User Guide
31
32
CHAPTER 2
Loading Your Data
Part # 11328837 Rev. B
Chapter 3
User Interface
Topics
34
Introduction
35
Main Window Menus
37
Table Window
37 Found Regions Table
39 Known Regions Table
42 Database of Genomic Variants
44 Samples Table
45
Chromosome Browser
52
Karyotype View
56
Duo and Trio View
59
Log Window
KaryoStudio v1.2 User Guide
34
CHAPTER 3
User Interface
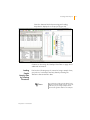
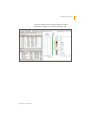
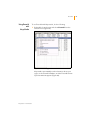
Introduction
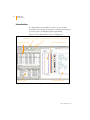
The KaryoStudio user interface provides tools for loading
intensity files, browsing found regions, comparing found regions
to known regions, and displaying them graphically.
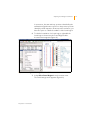
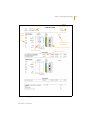
Figure 25 shows KaryoStudio’s screen configuration.
Current Genome Build
Current Version of cnvPartition Algorithm
Found Regions Table
Samples Table
Figure 25
Chromosome Browser
Gene Information
KaryoStudio Screen Configuration
Part # 11328837 Rev. B
Main Window Menus
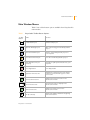
Main Window Menus
Table 1 lists toolbar button options available from KaryoStudio’s
main window.
Table 1
KaryoStudio Toolbar Button Options
Toolbar
Button
Name
Function
Create New Project
Create a new project
Open an Existing Project
Open a previously generated KaryoStudio
project
Save the Current Project
Save the current KaryoStudio project to
your computer
Close the Current Project
Close the current KaryoStudio project
Write Reports to Project
Directory
Generate a *.pdf report and save it to your
computer
Close Application
Close KaryoStudio
Expand to Chromosome
Expands the current Chromosome Viewer
view from selected found region to entire
chromosome
Previous Chromosome
Display previous chromosome in the
Chromosome Viewer
Select Chromosome
Select chromosome to display in the
Chromosome Viewer
Next Chromosome
Display next chromosome in the
Chromosome Viewer
Pan Up 1/4 Step
Adjust view slightly towards the beginning
of the chromosome
KaryoStudio v1.2 User Guide
35
36
CHAPTER 3
User Interface
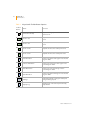
Table 1
KaryoStudio Toolbar Button Options
Toolbar
Button
Name
Function
Pan Down 1/4 Step
Adjust view slightly towards the end of the
chromosome
Zoom in 5X
Adjust chromosome view to five times
closer
Zoom in 2X
Adjust chromosome view to two times
closer
Zoom out 2X
Expand chromosome view by two times
Zoom out 5X
Expand chromosome view by five times
First Aberration
Jump to the first found region in the Found
Regions Table.
Previous Aberration
Jump to the previous found region in the
Found Regions Table.
Next Aberration
Jump to the next found region in the
Found Regions Table.
Last Aberration
Jump to the last found region in the Found
Regions Table.
Settings
Adjust KaryoStudio settings for data plots
and generating reports.
Display Log
Display a log of all actions performed by
KaryoStudio.
Part # 11328837 Rev. B
Table Window
Table Window
The table window includes three tables:
` Found Regions Table
` Known Regions Table
` Database of Genomic Variants
These tables are described in the following sections.
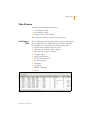
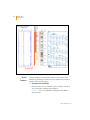
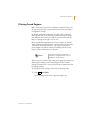
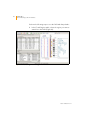
Found Regions
Table
The Found Regions table (Figure 26) lists the regions passing the
filter settings that were identified by the cnvParition algorithm
(“found regions”), and provides the following information:
`
`
`
`
`
`
`
`
`
`
`
Figure 26
Sample name in which a region is found
Chromosome on which a region appears
Start and stop positions of region
Length of region
Value (Copy Number)
Conf (Confidence Score)
Comment (if any)
CNV Index
Cytobands
Number of Markers
Genes
Found Regions Table
KaryoStudio v1.2 User Guide
37
38
CHAPTER 3
User Interface
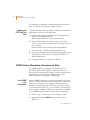
The
Filter Table and
Clear Filter buttons allow you to
filter the found regions that appear in the Found Regions table
and track. For more information, see Filtering Found Regions on
page 63.
The Check All/Uncheck All buttons allow you to include or
exclude all displayed found regions from cytogenetics reports.
The columns in the Found Regions Table are listed and
described in Table 2.
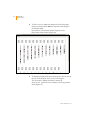
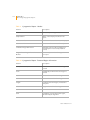
Table 2
Found Regions Table Columns
Column
Description
Index
Identifier given to each region identified by the cnvPartition
algorithm across the entire KaryoStudio project (all samples)
Sample ID
Sample name
• If you use a sample sheet to load your data, sample names
are the names assigned to each sample in the sample sheet.
• If you load your data without a sample sheet, sample names
are barcodes.
Chr
Chromosome number of the found region
Start
Position of the first base of a found region
Stop
Position of the last base of a found region
Length
Length (in base pairs) of a found region
Value
Estimate of the physical copy number of a found region:
• 0 indicates a homozygous deletion (loss of both copies)
• 1 indicates a hemizygous deletion (loss of one copy)
• 2 indicates a copy-neutral loss of heterozygosity
(e.g., UPD or autozygosity)
• 3 indicates a duplication (gain of one copy)
• 4 indicates a copy number of 4 or above
Conf
Confidence score calculated for each found region by the
cnvPartition algorithm. The confidence score is relative within a
specific sample. A higher score represents higher confidence.
Values of ~50 or higher tend to reflect regions with high
confidence. Larger regions tend to have higher confidence scores.
Part # 11328837 Rev. B
Table Window
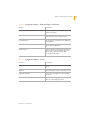
Table 2
Found Regions Table Columns
Column
Description
Comment
User-entered comment
CNV Index
Number assigned to a found region within a specific sample. The
range begins at 0.
Cytobands
List of cytobands in the found region
#Markers
Number of markers (SNPs or intensity-only probes) in a found
region
Genes
RefSeq genes present within the found region
NOTE
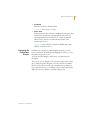
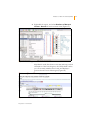
Known
Regions Table
Figure 27
Changing your selection in the Found
Regions table changes what is displayed in
the Chromosome Browser to the right of
the table.
The Known Regions table (Figure 27) lists all of the known
regions that have been loaded into KaryoStudio.
Known Regions Table
In this table, Illumina provides information about commonly
affected regions by default. However, you can also edit this table
based on the requirements of your project.
KaryoStudio v1.2 User Guide
39
40
CHAPTER 3
User Interface
The columns in the Known Regions Table are listed and
described in Table 3.
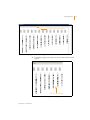
Table 3
Known Regions Table Columns
Column
Description
Index
Numeric identifier assigned to known regions
Region
Specific name assigned to a known region
Chr
Chromosome on which the known region appears
Start
Position of the first base pair of the known region
End
Position of the last base pair of the known region
Length
Length of the known region
Disorder/Region
Name of the region, or the syndrome associated with
chromosomal aberrations in this region
NOTE
The default known regions file included
with KaryoStudio is based mainly on
affected chromosomal bands, so the base
pair start and stop positions may be
approximate.
Editing the Known Regions Table
Illumina has prepopulated the Known Regions table with a
default list of regions of the genome that are of interest to
cytogeneticists.
You can edit or add additional known regions files in order to
better represent the regions of interest to your cytogenetics lab.
You can also have multiple known regions files for different
analysis workflows, or for use with different sample types.
Part # 11328837 Rev. B
Table Window
To create a new Known Regions file, perform the following steps:
1. Create a new file using Microsoft Excel or a word processing
program, or start with an existing Known Regions file.
2. Verify that the required column headers are included (see the
bulleted list below).
3. Enter information in each row for each known region.
4. Save the file as a tab-delimited file (*.txt) in the KaryoStudio
program directory.
The default KaryoStudio program directory is:
C:\Program Files\Illumina\KaryoStudio.
To edit a Known Regions file, perform the following steps:
1. Navigate to the KaryoStudio program directory.
The default KaryoStudio program directory is:
C:\Program Files\Illumina\KaryoStudio.
2. Open the known regions file to be edited (The default file is
KnownRegionsTable.txt) in a text editing tool such as
Microsoft Excel.
CAUTION
Any of the rows in this file can be edited;
however, you cannot delete any columns
as this will crash the software.
3. Make changes to the file as desired, by adding rows,
deleting rows, or adjusting the parameters for each row.
Some of the items you can adjust are:
KaryoStudio v1.2 User Guide
•
Region
•
Disorder
•
Chr #
•
Start
•
End
•
Length
•
Length minus overlap
41
42
CHAPTER 3
User Interface
For example, if you would like to more precisely identify the start
and stop positions for a particular region, you can adjust them in
this file. You can also add new rows to this file. This may be useful
if you would like to cross-match regions in future samples to
regions your lab has tracked in the past.
4. After you edit the file, you must save your changes as a
*.txt file.
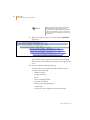
NOTE
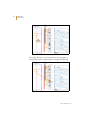
Database of
Genomic
Variants
Figure 28
Illumina recommends saving a copy of the
original known regions table in the event
that you would like to revert back to the
default file that is originally provided with
the software.
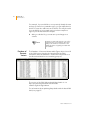
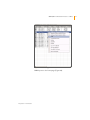
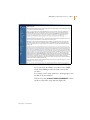
The Database of Genomic Variants table (Figure 28) is a list of all
of the CNV regions found in the latest build of the DGV.
Information from this database is loaded into KaryoStudio as a
text file and included for cross-matching purposes.
Database of Genomic Variants
The version of the DGV delivered with KaryoStudio v1.2 is
http://projects.tcag.ca/variation/downloads/
variation.hg18.v8.aug.2009.txt.
For information about updating KaryoStudio with the latest DGV
build, see page 87.
Part # 11328837 Rev. B
Table Window
The columns in the Database of Genomic Variants are listed and
described in Table 4.
Table 4
Database of Genomic Variants Columns
Column
Description
Index
Number used as a simple identifier for regions
ID
Identifier assigned to a region by the Database of Genomic
Variants; stays consistent over time
Landmark
BAC clone identifier for a specific region
Chr
Chromosome of a region
Start
Start position of a region
End
End position of a region
Length
Size of a region
Variation Type
Type of CNV
Locus Chr
General identifier that may contain multiple variation IDs
Locus Start
Start position of a locus region
Locus End
End position of a locus region
Reference
Publication reference showing where this region has been
published
PubMed ID
Entrez PubMed ID of a publication linked to a specific region
Reference
Author of the study
Gain
Total number of patients in which a gain was seen
Loss
Total number of patients in which a loss was seen
Total Gain Loss
Total number of patients in which a gain or loss was seen
Sample Size
Total number of patients in the study
KaryoStudio v1.2 User Guide
43
44
CHAPTER 3
User Interface
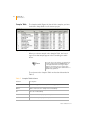
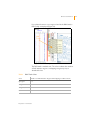
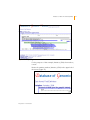
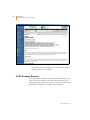
Samples Table
Figure 29
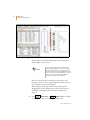
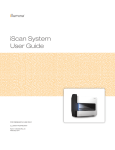
The Samples table (Figure 29) lists all of the samples you have
loaded into KaryoStudio for the current project.
Samples Table
When you select a sample in the Samples Table, the found
regions for that sample appear in the Found Regions table
above.
NOTE
You can choose more than one sample by
pressing and holding the Ctrl button on
your keyboard while selecting multiple
samples of interest. As you select each
sample, the Found Regions table above is
dynamically updated.
The columns in the Samples Table are listed and described in
Table 5.
Table 5
Samples Table Columns
Column
Description
Index
Number assigned to the sample for sorting purposes
Name
Name or barcode of a sample from a BeadChip
ID
Barcode of a BeadChip
Plate
Location on the sample preparation plate
Well
Well on the sample preparation plate
Part # 11328837 Rev. B
Chromosome Browser
Table 5
Samples Table Columns
Column
Description
% Defect
Score given to each sample based on the number of found
regions. This value is the sum of the length of all found regions
per sample divided by the length of the genome.
Gender
Gender of the sample, as provided in the sample sheet.
KaryoStudio uses the gender information to correctly interpret
found regions on the sex chromosomes.
LogRDev
Standard deviation of the log R ratios of the sample
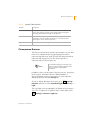
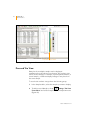
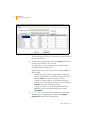
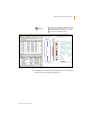
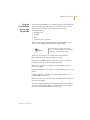
Chromosome Browser
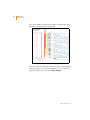
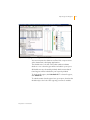
The Chromosome Browser includes representations of your data
in the form of B allele frequency (genotyping information)
represented by blue dots, and log R ratio (intensity information)
represented by a grey line. The smoothed log R ratio is
represented by a red line (Figure 30).
NOTE
The B allele frequency for intensity-only
probes is represented by light blue dots
and is not used in copy number
calculations.
In addition, there is an ideogram of the chromosome, found and
known regions, information from the DGV (Database of
Genomic) Variants, and gene information. You can adjust the
display parameters from the Settings tab.
To hide or display data types in the plot, go to
Settings |
Data Plot and clear or select Smoothed LogR, B Allele Freq, or
LogR.
The Log R Ratio axes are adjustable. By default, the axis range is
-2.0 to 2.0. To adjust the Log R Ratio axis to fit the data, select
Settings | AutoScale | LogR Axis.
KaryoStudio v1.2 User Guide
45
46
CHAPTER 3
User Interface
Figure 30
Chromosome Browser
Search
Function
You can navigate to a particular location in the chromosome
browser by entering a search term in the search field. Searches
may be of the following types:
` Chromosomal coordinate
Enter the chromosome number, a colon, and the start and
stop coordinates separated by a hyphen.
EXAMPLE: enter 1:1-2000000 to display the first 2Mb of
chromosome 1.
Part # 11328837 Rev. B
Chromosome Browser
` Cytoband
Enter the location in ISCN notation.
EXAMPLE: enter 1p22.1 or 1p22
` Gene name
Entering text into the search box displays the first gene that
matches the search term, starting with the chromosome
currently displayed in the browser. To search a particular
chromosome, start your search with the chromosome
number and a colon.
EXAMPLE: enter 6:VEGF to search for VEGFA rather than
VEGFC on chromosome 4.
Navigating the
Chromosome
Browser
In addition to using the toolbar navigation buttons, you can
zoom in and scroll by clicking and dragging the red box on the
ideogram using your mouse.
To scroll, click and drag the red box up or down along the
ideogram.
To zoom in our out, drag the top or bottom edge of the square
up or down along the ideogram. The size of the box indicates
the size of the chromosomal region displayed in the data plot.
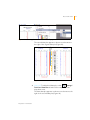
If you place the cursor over a data point, a tooltip featuring the
SNP name and coordinates is displayed (Figure 31).
KaryoStudio v1.2 User Guide
47
48
CHAPTER 3
User Interface
SNP Name
Tooltip
Figure 31
SNP Name Tooltip
If you place the cursor over a cytoband on the ideogram, a
tooltip featuring the cytoband name is displayed (Figure 32).
Cytoband
Tooltip
Figure 32
Cytoband Tooltip
Part # 11328837 Rev. B
Chromosome Browser
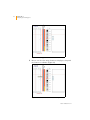
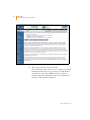
If you place the cursor over a region found in the DGV track, a
DGV tooltip is displayed (Figure 33).
DGV
Tooltip
Figure 33
DGV Tooltip
The DGV track is multicolored. The colors indicate the numbers
of DGV variation regions overlapping at a given point, as
described below:
Table 6
DGV Track Colors
Color
Number of DGV Variation Regions Overlapping at a Given Point
light gold
1-2
orange
3-10
orange-red
11-20
red
>20
KaryoStudio v1.2 User Guide
49
50
CHAPTER 3
User Interface
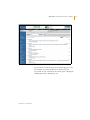
If you click anywhere along the ideogram, an alignment cursor
displays as a dashed red line (Figure 34).
Figure 34
Chromosome Browser Alignment Cursor
In the gene display area to the right, gene names and transcript
locations appear, as in the RefSeq database. To open RefSeq,
right-click a gene name and select Open RefSeq.
Part # 11328837 Rev. B
Chromosome Browser
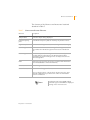
The elements of the Chromosome Browser are listed and
described in Table 7.
Table 7
Chromosome Browser Elements
Element
Description
Sample Name
Shows the sample being displayed
B allele frequency
plots
Shows B allele frequency data for intensity-only markers in blue
Log R ratio plot
Shows smoothed log R ratio data in red or log R ratio data in grey
Found Regions
Track next to the chromosome showing a found region. Gains in
copy number are indicated in green and losses are indicated in
red.
Known Regions
Blue boxes represent known regions in this area. Directly
correlates with the information in the Known Regions Table,
populated from the Known Regions file currently selected in the
Filter Settings table.
DGV
Track next to the chromosome shows correlation with information
in the DGV (Database of Genomic Variants)
Chromosome
Vertical ideogram of the chromosome
Gene information
All available RefSeq gene information
Note: For larger regions, such as whole chromosomes, the gene
information appears very condensed. To refine the information
use the zoom buttons.
NOTE
KaryoStudio v1.2 User Guide
Pseudoautosomal region (PAR) markers
and found regions in the PAR are displayed
as being on the X chromosome.
51
52
CHAPTER 3
User Interface
Karyotype View
The Karyotype View window displays a whole-genome view of
the found regions for one or more samples. This view can be
used to gain an initial appreciation for the variation found in a
sample, or as a clickable visual table of contents for the found
regions in a sample.
To use the karyotype view, perform the following steps:
1. In the Samples table, right-click a sample and select Show
Karyotype. The Karyotype View window appears (Figure 35).
All found regions are displayed in a track for each sample
selected. Regions are color coded:
•
green = gain
•
red = loss
•
purple = copy-neutral event
Part # 11328837 Rev. B
Karyotype View
Figure 35
Karyotype View Window, One Sample Selected
KaryoStudio v1.2 User Guide
53
54
CHAPTER 3
User Interface
2. To add or remove additional samples from the Karyotype
View, press and hold the Ctrl key and click each sample in
the Samples table.
Information for all selected samples appears in the
KaryoStudio View window (Figure 36).
Figure 36
Karyotype View Window, Three Samples Selected
3. To display information about a found region in the info bar at
the top of the window, hover over a found region.
The information displayed includes: sample ID,
chromosome, start and end coordinates, and copy number
value (Figure 37).
Part # 11328837 Rev. B
Karyotype View
Found Region Information
Figure 37
Karyotype View, Found Region Information
4. To display a region in the chromosome browser, click a found
region.
Click a Found Region
Figure 38
KaryoStudio v1.2 User Guide
Found Region in Karyotype View Window
55
56
CHAPTER 3
User Interface
Found Region Track
Figure 39
Found Region in Chromosome Browser
Duo and Trio View
Data plots from multiple samples can be displayed
simultaneously in the chromosome browser. Duo and trio view
can be used to analyze, for example, a parent-parent-child trio, a
control sample, or different display settings for two plots from
the same sample.
To use the duo and trio view, perform the following steps:
1. In the Samples table, select the samples you want to display.
2. To add a second data plot, select
Settings | Trio View
| Data Plot 2 | and select a sample from the dropdown menu
(Figure 40).
Part # 11328837 Rev. B
Duo and Trio View
Figure 40
Selecting Additional Data Plot to Display
The second data plot appears in chromosome browser to
the right of the original data plot (Figure 41).
Figure 41
Chromosome Browser, Duo View
3. [Optional] To add a third data plot, select
Settings |
Trio View | Data Plot 3 | and select a sample from the
dropdown menu.
The third data plot appears in chromosome browser to the
right of the second data plot (Figure 42).
KaryoStudio v1.2 User Guide
57
58
CHAPTER 3
User Interface
Figure 42
Chromosome Browser, Trio View
To select additional settings for each data plot, go to
Settings | Trio view | Data Plot, and select or clear
the Log R, B Allele Freq, and/or Smoothed Log R
checkboxes (Figure 43).
Figure 43
Trio View, Additional Plot Settings Selected
Part # 11328837 Rev. B
Log Window
4. To return to the a single-plot view with the genes display
visible, select
Figure 44
Settings | Genes Display (Figure 44).
Single Sample View with Gene Display
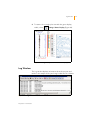
Log Window
The Log window displays information about the projects and
tracks for this analysis as they are being loaded into the software.
Figure 45
Log Window
KaryoStudio v1.2 User Guide
59
60
CHAPTER 3
User Interface
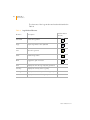
The elements of the Log window are listed and described in
Table 8.
Table 8
Log Window Elements
Element
Description
Select All
Selects all log entries
Copy
Copies log entries to the clipboard
Save
Saves all log entries
Clear
Clears all log entries
Grid
Toggles the grid on and off
Time
Displays the time the log entry was generated
Severity
Displays the severity of the log entry
Message
Displays the text description of the log entry
Source
Displays the source of the log entry
Toolbar Button
(if used)
Part # 11328837 Rev. B
Chapter 4
Analyzing Found Regions
Topics
62
Introduction
63
Filtering Found Regions
65
Displaying Found Regions
67
Scrolling Through Found Regions
68
Sorting Found Regions
70
Adding or Editing Comments
70
Adjusting Found Region Parameters
82
Exporting Found Regions
KaryoStudio v1.2 User Guide
62
CHAPTER 4
Analyzing Found Regions
Introduction
KaryoStudio includes Illumina’s cnvPartition algorithm, which is
designed to scan whole-genome Infinium data for intensity
changes resulting from changes in copy number. Once you have
completed entering information into the Project Wizard, your
project data is automatically scanned using the cnvPartition
algorithm.
Detected aberrations are displayed in the Found Regions table.
Included in this table is information about each aberration
including:
`
`
`
`
`
`
`
`
the sample in which it was found
the chromosome start and stop position
its size (length in bases)
an estimate of the copy number (Value column)
a confidence value (relative score)
its cytobands
the number of SNPs it contains
the genes present in the found region
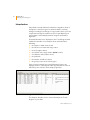
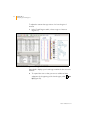
Once you have created a project, all detected regions are
displayed in the Found Regions Table and listed in the order in
which they were found in each sample (Figure 46).
Figure 46
Found Regions Table
This chapter describes how to view and analyze the Found
Regions in your data.
Part # 11328837 Rev. B
Filtering Found Regions
Filtering Found Regions
When a project is created, the cnvPartition algorithm discovers
all regions of aberrant copy number based on the cnvPartition
configuration settings.
By default, cnvPartition identifies all regions with confidence
value greater than 35 and all copy-neutral LOH regions larger
than 1Mb. However, these confidence and size thresholds are
likely not stringent enough for most uses.
More specific filtering parameters for size, number of markers,
and confidence threshold can be entered in KaryoStudio. After
entering the desired parameters, only regions of potential
interest which meet these criteria are displayed in the Found
Regions Table and chromosome browser.
NOTE
For information about adjusting the
cnvPartition configuration file, see the
cnvPartition documentation.
After a project is created, filter settings are applied to determine
which regions display in the Found Regions Table. Default
settings are applied to a new project, but these parameters can
be changed easily.
To change the filter settings, perform the following steps:
1. Click
Filter Table.
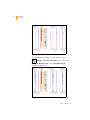
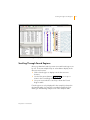
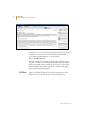
The FoundRegionsFilterForm appears (Figure 47).
KaryoStudio v1.2 User Guide
63
64
CHAPTER 4
Analyzing Found Regions
Figure 47
FoundRegionsFilterForm
The Known Regions File to be used in the project is listed in
the second text field.
2. To change the Known Regions File, click Load and browse to
the file you would like to use instead.
See Appendix C of this document for information about
formatting a Known Regions File.
Different classes of found regions can be assigned different
filter settings:
•
Settings for regions that at least partially overlap with
regions defined in the selected Known Regions File are
labeled Inside in the InKnownRegions column.
•
Settings for regions that do not overlap with regions
defined in the selected Known Regions File are labeled
Outside in the InKnownRegions column.
•
Settings for Gains, Losses, and Copy-Neutral events
(CNLOH) can be set independently in the column
TypeOfCNV.
3. [Optional] You can define found regions from which data
should never be displayed by selecting the Use Ignore
Regions File checkbox and loading a file.
Part # 11328837 Rev. B
Displaying Found Regions
In order to be ignored, a Found Region must fall completely
within an Ignored Region.
This feature has many potential uses, such as ignoring
common polymorphic CNVs or constraining analysis to a
portion of the genome. For example, you could ignore all
chromosomes except 21 to analyze only aberrations on
chromosome 21.
See Appendix D of this document for more information
about formatting an Ignored Regions File.
4. To save the settings in the FoundRegionsFilterForm, click
Save Filter Settings.
5. To load settings from a file into the FoundRegionsFilterForm,
click
Load Filter Settings and browse to the settings file
of interest.
6. Click OK to apply the new filter settings.
Displaying Found Regions
Notice that when you select a found region, the entire region
displays in the chromosome browser (Figure 48). By default,
genotyping information is displayed as B-allele frequency (blue
dots) and intensity information is displayed as smoothed log R
ratio (red line).
KaryoStudio v1.2 User Guide
65
66
CHAPTER 4
Analyzing Found Regions
Figure 48
Found Region Displayed in Chromosome Browser
If you want to view the selected aberration in relation to the
chromosome in which it appears, click
Chromosome.
Expand to
Intensity data for the whole chromosome is displayed
(Figure 49).
Part # 11328837 Rev. B
Scrolling Through Found Regions
Figure 49
Found Region Displayed in Context of Whole Chromosome
Scrolling Through Found Regions
Once your data has loaded, you can view each found region one
by one. There are multiple ways to select data to display in the
chromosome browser:
` Click a found region to display it in the chromosome
browser.
` Use the blue arrow buttons
to move up or
down in the Found Regions table.
` Use your mouse wheel to scroll up or down the Found
Regions table.
Found regions are only displayed for the sample(s) selected in
the Samples table. You can choose multiple samples by Ctrlclicking or Shift-clicking multiple rows in the Samples table.
KaryoStudio v1.2 User Guide
67
68
CHAPTER 4
Analyzing Found Regions
Sorting Found Regions
In addition to clicking and scrolling in the Found Regions table,
you can sort data based on whichever column you like. To sort
data, click a column header.
NOTE
If your found regions table contains
hundreds of aberrations, it may take some
time for KaryoStudio to sort the regions by
column header.
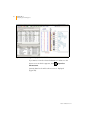
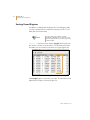
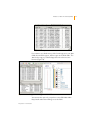
EXAMPLE 1: Click the column header Length, which represents
the number of bases of an aberration. The aberrations listed in
this table are now sorted from shortest to longest (Figure 50).
Figure 50
Aberration Length Sorted Short to Long
Click Length again to reverse the sort order. The aberrations now
display from longest to shortest (Figure 51).
Part # 11328837 Rev. B
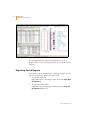
Sorting Found Regions
Figure 51
Aberration Length Sorted Long to Short
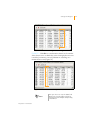
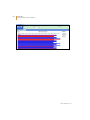
EXAMPLE 2: Click Chr to sort aberrations based on the number
of the chromosome on which they occur. Sorting by chromosome
is useful if you want to view only aberrations occurring on a
certain chromosome (Figure 52).
Figure 52
Aberrations Sorted by Chromosome
NOTE
KaryoStudio v1.2 User Guide
When you choose to sort, the data for all
samples are sorted together. Therefore,
found regions from multiple samples may
be intermixed.
69
70
CHAPTER 4
Analyzing Found Regions
Adding or Editing Comments
To add comments or edit existing comments for a found region,
enter or change a comment in the Comments field.
For example, you can type a note for a colleague suggesting that
he or she follows up on this region later. You may also want to
enter additional information obtained from your cross-matching
results. The comments you enter are included in the Comments
section of the *.pdf reports you generate.
Adjusting Found Region Parameters
Though it is not generally necessary to do so, KaryoStudio offers
the ability to edit some parameters of a found region such as
confidence score and estimated copy number value.
KaryoStudio also gives you the option to enter comments for a
found region. In addition, if necessary, you can edit the start and
stop positions of a found region.
Editing
Confidence
Score or
Estimated
Copy Number
To adjust the confidence score or estimated copy number value
of a found region, perform the following steps:
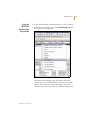
1. Right-click a region of interest in the Found Regions table.
The context menu appears (Figure 53).
Part # 11328837 Rev. B
Adjusting Found Region Parameters
Figure 53
Editing a Found Region
2. Select Edit a Found Region from the context menu.
The FormSettings screen appears (Figure 54).
KaryoStudio v1.2 User Guide
71
72
CHAPTER 4
Analyzing Found Regions
Figure 54
Form Settings Dialog Box
3. Do one of the following:
•
If you would like to change the confidence value for this
region, adjust the Confidence score.
NOTE
•
Although it is not recommend to change
the confidence score of a found region,
you can change it to 0 if you want to
exclude this found region from analysis.
Adjust the Estimated Copy Number Value if, on visual
inspection, you feel that cnvPartition has not accurately
estimated the copy number of the found region.
NOTE
The parameters in the Misc area cannot be
adjusted.
Part # 11328837 Rev. B
Adjusting Found Region Parameters
Editing Start
and Stop
Positions
You can verify the accuracy of the cnvPartition algorithm by
examining the start and stop positions of the found region. In
some cases you may want to adjust start and stop positions
based on visual inspection, though it is not common to do so.
KaryoStudio also allows you to optionally adjust the information
in the Found Regions table.
CAUTION
KaryoStudio v1.2 User Guide
If you edit the start and stop positions of a
found region, the original positions
identified by the cnvPartition algorithm are
not stored with the project.
The confidence score, number of SNPs,
and genes do not update after you have
edited a region.
If you need to retain the original start and
stop positions for any reason, copy the
Found Regions table before you load a
project and save it as a separate file, or
save the project on your computer with a
different file name.
73
74
CHAPTER 4
Analyzing Found Regions
To adjust the start and stop positions of a found region of
interest:
1. In the Found Regions table, select a region of interest
(Figure 55).
Figure 55
Selecting a Found Region of Interest
KaryoStudio displays your found region within the chromosome
browser.
2. To expand the view so that you can see additional data
adjacent to the beginning of the found region, click
Up (Figure 56).
Pan
Part # 11328837 Rev. B
Adjusting Found Region Parameters
Figure 56
Panning Up to Examine the Boundaries of a Found Region
Notice that the red track indicating the found region has
shifted lower on the screen.
To expand the view so that you can see additional data
adjacent to the end of the found region, click
(Figure 57).
KaryoStudio v1.2 User Guide
Pan Down
75
76
CHAPTER 4
Analyzing Found Regions
Figure 57
Panning Down to Examine the Boundaries of a Found Region
Notice that the red track indicating the found region has
shifted higher on the screen.
NOTE
It is best to pan up until the start of the
found region appears in the center of the
chromosome browser--or pan down until
the end of the found region appears in the
center of the chromosome browser--so that
when you zoom in further, the SNPs of
interest are visible in the window.
Once your found region is centered in the chromosome
browser, you can zoom in to get a higher-resolution view of
the boundaries of your found region.
Alternatively, you can pan and zoom by selecting and
dragging the red box which denotes the found region, as
described in Navigating the Chromosome Browser on
page 47.
3. Click
Zoom in 2x or
Zoom in 5x for a higher
resolution view of your found region (Figure 58).
Part # 11328837 Rev. B
Adjusting Found Region Parameters
NOTE
Figure 58
If you want to view the boundaries of your
found region at the SNP level, to see each
individual data point in the plot, you may
need to zoom in multiple times.
Centering a Found Region
4. To display a horizontal ruler, click anywhere on the ideogram.
The horizontal ruler appears (Figure 59).
KaryoStudio v1.2 User Guide
77
78
CHAPTER 4
Analyzing Found Regions
Figure 59
Using the Horizontal Ruler
5. Mouse over the ruler at any location to display a tooltip with
the location coordinates (Figure 60).
Figure 60
Ruler with Coordinates Tooltip
Part # 11328837 Rev. B
Adjusting Found Region Parameters
In most cases, the start and stop positions identified by the
cnvPartition algorithm are very close to the positions you can
identify by visual inspection. However, at this resolution, you
have the option to edit the boundaries of the found region.
6. To edit the boundaries of a found region, right-click the
found region of interest in the Found Regions table.
A context menu appears (Figure 61).
Figure 61
Editing a Found Region
7. Select Edit a Found Region from the context menu.
The FormSettings screen appears (Figure 62).
KaryoStudio v1.2 User Guide
79
80
CHAPTER 4
Analyzing Found Regions
Figure 62
Editing the Parameters of a Found Region
NOTE
The FormSettings screen gives you the
flexibility to adjust the Found Regions table
a single row at a time. Repeat this process
for each found region you want to edit.
8. Click Start or Stop and enter a new value to the right, based
on the start or stop position you see in the chromosome
browser.
Part # 11328837 Rev. B
Adjusting Found Region Parameters
Figure 63
Form Settings Screen
9. Click OK.
10. The results of your change are not immediately visible in the
chromosome browser. To see the change, click a different
found region in the Found Regions table (Figure 63).
KaryoStudio v1.2 User Guide
81
82
CHAPTER 4
Analyzing Found Regions
Figure 64
Viewing the New Found Region Positions
The new start and stop regions are included in the Found
Regions table, in the Found Regions track, and in all subsequent
analyses.
Exporting Found Regions
If you want to export data from the Found Regions table, you can
export a single row of data, or the entire table.
` To export a single row:
Right click in the Found Regions table and select Copy Row
to Clipboard.
` To export the whole table:
Right-click in the Found Regions table and select Copy All
to Clipboard (Figure 65).
Part # 11328837 Rev. B
Exporting Found Regions
Figure 65
Copying Found Regions to the Clipboard
You can now paste this data into an Excel file or import it into
other downstream, third-party applications.
The checkboxes to the left of the Index numbers indicate
whether or not a found region will be included in your report.
All checkboxes are selected by default, which means that all
found regions will be included in your report by default.
To deselect all regions, click Uncheck All. To select all regions,
click Check All.
To exclude certain found regions from your report, deselect the
checkbox(es) to the left of the region(s) you want to exclude.
KaryoStudio v1.2 User Guide
83
84
CHAPTER 4
Analyzing Found Regions
Part # 11328837 Rev. B
Chapter 5
Cross-Matching to
Known Variants
Topics
86
Introduction
87
Database of Genomic Variants (DGV)
96
OMIM (Online Mendelian Inheritance of Man)
102
UCSC Genome Browser
104
PubMed
104
DECIPHER
106
Ensembl
108
CHOP Database
KaryoStudio v1.2 User Guide
86
CHAPTER 5
Cross-Matching to Known Variants
Introduction
Because a sample may potentially contain many aberrations, it is
especially important to know what has already been identified as
a normal variation or a region associated with a condition. For
this reason, KaryoStudio allows you to check a found region
against a list of known regions as well as several different
external sources. This function allows you to determine which
regions found in your samples may be the most relevant.
This chapter describes how to link to these external information
sources from within KaryoStudio, and how to use this additional
information in your study.
KaryoStudio allows you to link to several databases, including:
` DGV (Database of Genomic Variants)—to determine
whether your region has been identified as a copy number
variant in normal, healthy individuals
` OMIM (On-line Mendelian Inheritance of Man)—to allow
further mining of a particular phenotype, region, or gene of
interest
` UCSC Genome Browser—to view genes or numerous other
information tracks for a particular region in this popular
public genome browser
` PubMed—to research publications relevant to a particular
phenotype/gene of interest
` DECIPHER—to compare found regions to the DECIPHER
database of submicroscopic chromosomal imbalances
` Ensembl—to view a found region in the graphical Ensembl
genome viewer
` CHOP Database—to determine whether a found region
overlaps with copy number variations described in this
database of samples from healthy individuals
Part # 11328837 Rev. B
Database of Genomic Variants (DGV)
Database of Genomic Variants (DGV)
Since the widespread adoption of high-density arrays for
screening the genome for structural changes, many studies have
identified various segments of the genome of differing sizes that
range in copy number. From arrays to sequencing, the number of
regions is growing dramatically and includes both common
(>5%) and rare (1%) regions. Although many of these regions are
not yet linked to specific conditions, the hope is that these
studies will have a major impact on human health.
The DGV is one of the databases that is collating these regions in
the hope of providing a comprehensive summary of structural
variation human genomes. This database includes regions of the
genome larger than >1kb that were identified in various studies
of healthy control samples.
Updating
KaryoStudio
with the Latest
DGV Build
The DGV currently includes many known CNV regions and
covers the majority of the genome.
To update KaryoStudio with the latest DGV build, perform the
following steps:
1. Find the latest version of the Genomic Variation Table at the
Database of Genomic Variants web site:
http://projects.tcag.ca/variation/
and click the Downloads section.
2. Save the latest version of the Genomic Variation Table as a
file of name GenomicVariation.txt in the following location:
C:\Program Files\Illumina KaryoStudio
3. Restart KaryoStudio to load the updated table.
Using the DGV
with
KaryoStudio
You can use KaryoStudio to see if a region identified by
KaryoStudio has already been identified and deposited in the
DGV. Based upon chromosome and position, the DGV shows
you information about what is known about the method used to
identify the region, the reference (including details of the study),
and a graphical reference to any CNVs found in the region.
KaryoStudio v1.2 User Guide
87
88
CHAPTER 5
Cross-Matching to Known Variants
Perform the following steps to use the DGV with KaryoStudio:
1. In the Found Regions table, select the region you want to
search for in the DGV (Figure 66).
Figure 66
Selecting a Found Region
Part # 11328837 Rev. B
Database of Genomic Variants (DGV)
2. Right-click the region, and select Database of Genomic
Variants - Browser from the context menu (Figure 67).
Figure 67
Selecting the DGV
KaryoStudio sends the chromosome start and stop position
information of the found region to the DGV, which notifies
you of how many matches were found, and displays a
genome browser view of that region (Figure 68).
Figure 68
DGV Genome Browser View
KaryoStudio v1.2 User Guide
89
90
CHAPTER 5
Cross-Matching to Known Variants
NOTE
Many optional tracks can be displayed in
the DGV browser view. Refer to the
documentation supplied with the Database
of Genomic Variants for more information
about using and interpreting information in
the browser.
3. Scroll down until you get to the section labeled All CNVs
(Figure 69).
Figure 69
All CNVs
The All CNVs section shows colored bars representing all
CNVs present in the database for the genomic region in the
view.
4. Inspect a variation entry by clicking it.
A new window opens (Figure 70) with details about the
selected entry, including:
•
variation number
•
cytogenetic band
•
genes
•
other overlapping CNVs
•
genomic coordinates
•
nearby segmental duplications
•
study details
•
references to the study that reported the variant
Part # 11328837 Rev. B
Database of Genomic Variants (DGV)
Figure 70
Inspecting a Variation
For the purposes of this example, Variation_3544, shown above,
is used.
Notice the variation number, Variation_3544, in the upper-left of
the screen (Figure 71).
Figure 71
KaryoStudio v1.2 User Guide
DGV, Variation Number
91
92
CHAPTER 5
Cross-Matching to Known Variants
This variation number is a permanent number assigned to the
region. If your lab is interested in this region, you can use this ID
to refer to this region in the DGV.
Next, notice the cytogenetic band (Figure 72).
Figure 72
DGV, Cytogenetic Band
This tells you which cytoband your region sits in. This is
particularly important if you already know that a certain condition
is associated with a change in a specific cytoband.
The next section, All CNVs, tells you whether any other CNVs
have been identified in this region (Figure 73).
Figure 73
DGV, All CNVs
In addition, start and stop positions of each region, and the
study in which the region was identified are shown. You can click
a variation for more information.
Part # 11328837 Rev. B
Database of Genomic Variants (DGV)
The sections below the CNVs contain information about
genomic inversions, indels, segmental duplications, etc. In
Figure 74, only indels are shown.
Figure 74
DGV, Indels
You can click each available section for more information that
you may want to incorporate into your cytogenetics study.
Below the graphic, there is some additional information
(Figure 75).
Figure 75
DGV, Additional Information
The frequency information may be particularly useful for
interpretation. It includes the number of samples studied, and
the number of times a loss or gain was seen.
Notice that you can click a link to PubMed (if available), which
displays the publication reference for the study that identified
this region (Figure 76).
KaryoStudio v1.2 User Guide
93
94
CHAPTER 5
Cross-Matching to Known Variants
Figure 76
DGV, PubMed Reference
The DGV is a resource provided by SickKids Hospital in Toronto,
Canada. If you need more information about this database,
go to http://projects/tcag.ca/, or send email to
[email protected].
All of the CNVs in the DGV were identified in healthy control
samples. The DGV is constantly being updated as new studies
deposit information and as technology evolves. For the latest
build, and latest information, please see the DGV web page:
http://projects.tcag.ca/variation/.
DGV Data
When you click the DGV tab, it may take a moment to load.
When it does, scroll to the bottom of the list (Figure 77).
Part # 11328837 Rev. B
Database of Genomic Variants (DGV)
Figure 77
KaryoStudio DGV Table
If you want to see whether any of the found regions in your data
match known DGV regions, click a region in the DGV table. The
data for the region you clicked appears in the chromosome
browser (Figure 78).
Figure 78
Selecting a Known Region in the DGV Table
You can use this option if you prefer to view CNV data within
KaryoStudio rather than linking out to the DGV.
KaryoStudio v1.2 User Guide
95
96
CHAPTER 5
Cross-Matching to Known Variants
The advantage of viewing your data in KaryoStudio is that you
can look at a CNV region across multiple samples.
Updating the
DGV Table and
Track
To update the data used to populate the DGV table and track in
KaryoStudio, perform the following steps:
1. Download the database build from the following location:
http://projects/tcag.ca/variation/
tableview.asp?table=DGV_Content_Summary.txt.
2. Download the variation file (*.txt format) in the Current
Version section, based on Build 36 (hg 18) of the genome, to
your computer.
Example variation file: variation.hg18.v8.aug.2009.txt
3. Rename this file “DatabaseOfGenomicVariation.txt”.
4. Copy the file DatabaseOfGenomicVariation.txt (replacing the
existing file) to the directory C:\Program Files\Illumina\
Illumina KaryoStudio.
5. Restart KaryoStudio to load the new data file.
OMIM (Online Mendelian Inheritance of Man)
The OMIM database, hosted by the National Center for
Biotechnology Information (NCBI), contains information on
human genes and genetic phenotypes on all known Mendelian
disorders and over 12,000 genes. OMIM focuses on the
relationship between phenotype and genotype.
Using OMIM
with
KaryoStudio
Because OMIM is based upon specific keywords and not basic
chromosome start and stop positions, KaryoStudio only provides
a link to the homepage of this database. If KaryoStudio has
identified a specific phenotype within the found regions table,
you can enter a key word (e.g., gene, cytoband, or phenotype) in
the homepage of OMIM to obtain more information if available.
To use OMIM with KaryoStudio, perform the following steps:
1. Select a region of interest in the Found Regions table.
2. Right-click and select OMIM from the context menu
(Figure 79).
Part # 11328837 Rev. B
OMIM (Online Mendelian Inheritance of Man)
Figure 79
Selecting OMM
OMIM opens to the homepage (Figure 80).
KaryoStudio v1.2 User Guide
97
98
CHAPTER 5
Cross-Matching to Known Variants
Figure 80
OMIM, Home Page
3. Type a key word in the search text field.
Key words can be gene names, etc. For example, if you had
identified the MYC gene in your search, you might want to
enter MYC as a key word. OMIM identifies your gene in
multiple organisms and displays a list of the occurrences of
this gene in all organisms (Figure 81).
Part # 11328837 Rev. B
OMIM (Online Mendelian Inheritance of Man)
Figure 81
OMIM, MYC Gene
If you want to look at this gene in the human genome only,
for example, you must scroll down to find it in the list.
If you click on a hit, information about this gene is displayed,
including the name, description, etc.
KaryoStudio v1.2 User Guide
99
100
CHAPTER 5
Cross-Matching to Known Variants
Figure 82
OMIM, Additional Information
Of particular interest is the Gene Function section, which
describes any known molecular function of this gene
(Figure 83).
Part # 11328837 Rev. B
OMIM (Online Mendelian Inheritance of Man)
Figure 83
OMIM, Gene Function
If you enter a key word that is a condition in the OMIM
search field, OMIM provides information about that
condition.
For example, enter “down syndrome.” A listing page comes
up with the closest matches.
Click the first entry, #190685 DOWN SYNDROME. A down
syndrome information page appears (Figure 84).
KaryoStudio v1.2 User Guide
101
102
CHAPTER 5
Cross-Matching to Known Variants
Figure 84
OMIM, Down System Information Page
Information such as a description of the condition, clinical
features, and more is provided.
UCSC Genome Browser
The UCSC Genome Browser is a popular tool that allows you to
examine gene information, expression data, and many other
parameters within your found region. Yo can also upload custom
data tracks to display in the UCSC Genome Browser.
Part # 11328837 Rev. B
UCSC Genome Browser
Using the
UCSC Genome
Browser with
KaryoStudio
You can use KaryoStudio to see what other genomic features sit
within a found region. All analyses are based on chromosome
and position. The UCSC Genome Browser shows you
information about:
`
`
`
`
RefSeq genes
mRNAs
ESTs
genes in other organisms
There are also other options within the page that allow you to
add or remove additional data tracks of information.
NOTE
The UCSC Genome Browser may take
awhile to load. Be patient while your data
is loading; it will eventually display.
At the top, the chromosome and position are identified.
Next, information about RefSeq genes is listed.
Next, there is mRNA and EST information, which is useful for
looking at locations of specific gene transcripts.
Next, the conservation of this gene in mammalian species is
shown on a graph.
Next, the conservation of this gene in other species is shown on
tracks.
Finally, the location of SNPs in humans, and the location of
repeated DNA sequences.
Below all of this, you can select various additional information to
include in this graph.
The Phenotype and Disease Association Studies track might be
of interest. Select these tracks to see if any known phenotypes
have been associated with this specific region.
KaryoStudio v1.2 User Guide
103
104
CHAPTER 5
Cross-Matching to Known Variants
PubMed
PubMed, available via the NCBI Entrez retrieval system, is hosted
by the National Center for Biotechnology Information (NCBI) at
the National Library of Medicine (NLM) at the U.S. National
Institutes of Health (NIH). PubMed provides access to citations
from biomedical literature and is a streamlined way to determine
if there are any peer-reviewed and published studies related to
the region, condition, or phenotype under study.
Using PubMed
with
KaryoStudio
Since this database is based on specific key words, not on
chromosome number and position, KaryoStudio provides only a
link to the homepage of this database.
If KaryoStudio has identified a specific phenotype within the
found regions table, you can enter the keyword in the homepage
of PubMed to obtain more information.
This section is similar to OMIM in that it is based on keywords.
Type in a gene name, condition name, etc. This brings up a list of
scientific publications in which the key word has been found.
Note that the more common your inquiry, the more hits you will
get. To reduce the number of hits, make your search term as
specific as possible.
DECIPHER
The DECIPHER consortium is a network of clinical genetic
centers. KaryoStudio allows you to examine a specific found
region of interest against this cytogenetics database of clinical
cytogenetics cases by right-clicking on the found region and
sending it to the database.
If a particular portion (or the whole region) of your found region
has been previously linked to a certain phenotype, you can view
that here. From the DECIPHER database, you can view your
found region within the Ensembl Genome Browser, identify the
type of array or technology used to identify the specific region,
and obtain a DECIPHER Syndrome Report for a specific
phenotype of interest, including a clinical description,
references, affected genes, and a phenotype report.
Part # 11328837 Rev. B
DECIPHER
Using
DECIPHER
with
KaryoStudio
To use DECIPHER with KaryoStudio, do the following:
` Right-click a found region and select DECIPHER from the
context menu (Figure 85).
Figure 85
Selecting DECIPHER
KaryoStudio automatically sends information about the
found region to DECIPER, and opens the DECIPHER window
for that region (Figure 86).
KaryoStudio v1.2 User Guide
105
106
CHAPTER 5
Cross-Matching to Known Variants
Figure 86
DECIPHER
Ensembl
KaryoStudio allows you to examine your found region within the
cytogenetics view of the Ensembl Genome Browser. Ensembl is a
useful database for examining characterized disorders that may
have been previously linked to your region.
Part # 11328837 Rev. B
Ensembl
Using Ensembl
with
KaryoStudio
To use Ensembl with Karyostudio, do the following:
` Right-click a found region and select Ensembl from the
context menu (Figure 87).
Figure 87
Selecting Ensembl
Karyostudio automatically sends information about your
region to the Ensembl database, and the Ensembl Human
CytoView window appears (Figure 88).
KaryoStudio v1.2 User Guide
107
108
CHAPTER 5
Cross-Matching to Known Variants
Figure 88
Ensembl
CHOP Database
The Copy Number Variation project at the Children’s Hospital of
Philadelphia (CHOP) represents an effort to identify all frequent
copy number variations (CNVs) that exist in the human genome.
The database currently consists of data from over 2,000 healthy
individuals. This database was originally described in the
following manuscript:
TH Shaikh et al. (2009) High-resolution mapping and analysis of
copy number variations in the human genome: A data resource
for clinical and research applications. Genome Res 19: 16821690; doi:10.1101/gr.083501.108
Part # 11328837 Rev. B
CHOP Database
Using the
CHOP CNV
Database with
KaryoStudio
To use the CHOP Database with KaryoStudio, do the following:
` Right-click a found region and select CHOP Database from
the context menu (Figure 89).
\
Figure 89
Selecting the CHOP CNV Database
KaryoStudio automatically sends information about the
found region to the CHOP Database and opens the CHOP
CNV browser window to display any CNVs in the CHOP
Database that map to the region you submitted (Figure 90).
KaryoStudio v1.2 User Guide
109
110
CHAPTER 5
Cross-Matching to Known Variants
Figure 90
CHOP CNV Database CNVs
Part # 11328837 Rev. B
Chapter 6
Generating a
Cytogenetics Report
Topics
112
Introduction
112
What's in a Cytogenetics Report?
116
Adjusting the Information in a Cytogenetics Report
116
Generating a New Cytogenetics Report
KaryoStudio v1.2 User Guide
112
CHAPTER 6
Generating a Cytogenetics Report
Introduction
KaryoStudio allows you to create a *.pdf Cytogenetics Report for
each sample, summarizing the aberrations found in that sample
and showing whether they cross-match with any known regions
in the genome. Depending upon how many aberrations are
found for a sample, and how many you choose to include in the
report, it can be from one page to many pages long.
NOTE
You need a recent version of Adobe
Reader to view *.pdf reports. Adobe
Reader is available free from
get.adobe.com/reader/.
What's in a Cytogenetics Report?
A Cytogenetics Report contains all of the essential information
required to quickly summarize aberrations found within a specific
sample. Within each report is an entry for each found region,
including an image of the aberration, its size, an estimate of the
copy number, the confidence value (relative score), and a list of
the disorders that have already been associated with that specific
region.
Figure 91 shows an example Cytogenetics Report. Table 9 lists
the elements of a report and identifies the elements that are
adjustable.
Part # 11328837 Rev. B
What's in a Cytogenetics Report?
Sample & Product
Algorithm Version
Found
Region
Info
User-Entered
Comment
Chromosome View
Found Region
Figure 91
Cytogenetics Report
KaryoStudio v1.2 User Guide
Known Regions
113
114
CHAPTER 6
Generating a Cytogenetics Report
Table 9
Cytogenetics Report - Header
Column
Description
Date
Date the report was generated
Sample Name
Name of the sample presented in the
report
Product Manifest
Product manifest used to create the project
Genome Build
Genome Build version used for analysis
cnvPartition Algorithm Version
Algorithm version used for analysis (not
necessarily the most recently installed
version)
Image of Found Region from Chromosome Yes. Can adjust number of images shown
Browser
per report.
Table 10 Cytogenetics Report - Detected Region Information
Column
Description
CHR (Chromosome)
Chromosome on which the found region is
located
Locus
Cytoband(s) on which the found region is
located
Start
Start coordinate of the found region
End
End coordinate of the found region
Length
Length of the found region, measured in
base pairs
Value
Copy number of the found region
G/L
Gain or loss
Conf
Confidence score for the found region,
calculated by the algorithm
Part # 11328837 Rev. B
What's in a Cytogenetics Report?
Table 10 Cytogenetics Report - Detected Region Information
Column
Description
Data plot
Plot of B Allele Freq and Log R of markers
in the found region
Regions tracks
Found Region, Known Region, and DGV
tracks from the chromosome browser
Coordinate ruler
Chromosomal coordinates of the data plot
in megabases
Comment
User-defined comments for the found
region. Can be left blank.
Known regions
Regions known to overlap with the found
region. Includes Region Name, Region ID,
Chromosome, Start coordinate, End
coordinate, and Length.
Table 11 Cytogenetics Report - Footer
Column
Description
Sample Name
Name of the sample presented in the
report
Manifest
Product manifest used to create the project
Signature and date
Area for the investigator to sign and date
the report
Username
Name of the user logged into the system
when the report was generated
KaryoStudio v1.2 User Guide
115
116
CHAPTER 6
Generating a Cytogenetics Report
Adjusting the Information in a Cytogenetics Report
You can adjust the information included in a Cytogenetics Report
by using the KaryoStudio Settings tab.
You can adjust the number of aberrations included in a
Cytogenetics Report by entering a value for
MaxReportedDefects. On average, KaryoStudio includes roughly
two aberrations per page, so a report with ten aberrations would
be approximately five pages long.
You can limit the number of known regions to display for each
found region by entering a value for
MaximumNumberOfKnownDefects. If you do not want to crossmatch to any known regions, set
MaximumNumberOfKnownDefects to 0.
Additionally, you can select which found regions to include in a
Cytogenetics Report by selecting the checkbox to the left of
each found region in the Found Regions table. Clear the
checkbox to the left of a found region to exclude it from a report.
Generating a New Cytogenetics Report
After you choose the parameters for the aberration filter and
number of aberrations for each report, click Write Reports to
Directory. A dialog box opens, allowing you to browse to and
select a directory where you want the reports to be saved.
KaryoStudio generates the reports in the location you selected.
This takes roughly 30 seconds to one minute per sample.
Part # 11328837 Rev. B
Appendix A
Additional Information
Topics
118
Introduction
118
System Information
119
cnvPartition Algorithm
120
B Allele Frequency and Log R Ratio
KaryoStudio v1.2 User Guide
118
APPENDIX A
Additional Information
Introduction
This appendix includes information about additional topics that
you may be interested in.
System Information
Use the following information as a guide to determine the
minimum and recommended system configuration for the
computer on which you plan to install KaryoStudio.
The minimum and recommended system
configurations vary depending on the
products you plan to use to generate the
data you load into KaryoStudio.
NOTE
Table 12 System Information
Human
CytoSNP-12
Minimum
System
Requirements
Human
610-Quad
Human
1M-Duo
HumanOmni1Quad
32-bit
32-bit
64-bit
64-bit
Operating
System
WinXP SP2
or Vista
WinXP SP2
or Vista
WinXP SP2
or Vista
WinXP SP2
or Vista
Minimum /
Recommended
Processor
Requirements
Pentium IV
1.5 GhZ /
Pentium IV
2.0 GhZ
Pentium IV
1.5 GhZ /
Pentium IV
2.0 GhZ
Pentium IV
1.5 GhZ /
Pentium IV
2.0 GhZ
Pentium IV
1.5 GhZ /
Pentium IV
2.0 GhZ
.NET Version
.NET 3.5
.NET 3.5
.NET 3.5
.NET 3.5
Network
Connection
1 GB
1 GB
1 GB
1 GB
Minimum
Memory
Requirements
4GB
4GB
8GB
8GB
Part # 11328837 Rev. B
cnvPartition Algorithm
Table 12 System Information (continued)
Human
CytoSNP-12
Minimum
Hard Drive
Requirements
Minimum /
Recommended
Video Display
Requirements
Human
610-Quad
Human
1M-Duo
HumanOmni1Quad
100GB
100GB
100GB
100GB
1024x768 /
1024x768 /
1024x768 /
1024x768 /
1280x1024
1280x1024
1280x1024
1280x1024
cnvPartition Algorithm
The cnvPartition algorithm automatically scans your data when
you create a new project. cnvPartition v2.4.4, provided with
KaryoStudio v1.2, has been designed to scan for deletions,
duplications, and amplifications on the autosomes and sex
chromosomes.
The cnvPartition algorithm is based on a recursive partition
method. cnvPartition, which has been optimized for speed and
accuracy, uses log R intensity and B Allele Freq for identification
of chromosomal aberrations, estimates copy number values, and
calculates per locus confidence scores. After you load your data
into KaryoStudio, cnvPartition will automatically scan the data for
aberrations.
For more information about how this algorithm works, please see
the DNA Copy Number Analysis Algorithms Technical Note at
http://www.illumina.com/Documents/products/technotes/
technote_cnv_algorithms.pdf.
Confidence
Score
The confidence score that cnvPartition generates is defined as
the sum of all logged likelihoods in the region for the assigned
copy number minus the sum of all logged likelihoods of copy
number equal to 2 for loci in the region. Thus the confidence
scores provide a means to rank regions relative to their
(dis)similarity to normal, copy number 2 segments. Higher values
represent higher confidence in the aberration call.
KaryoStudio v1.2 User Guide
119
120
APPENDIX A
Additional Information
For more information about recommended confidence score
cutoff values, see the KaryoStudio FAQs on
http://www.illumina.com.
B Allele Frequency and Log R Ratio
B Allele Frequency and Log R Ratio data form the basis of the
analysis of all copy number changes in Infinium data. B Allele
Frequency data is derived from SNP genotypes, while Log R
Ratio data is derived from intensity information.
Calculation
The B Allele Freq for a sample shows the theta value for a SNP,
corrected for cluster position. Cluster positions are generated
from a large set of normal individuals. The B Allele Frequency
can also be referred to as “copy angle” or “allelic composition.”
It is easier to visualize genotyping data for all SNPs within a
chromosomal region using B Allele Freq rather than theta values.
This is true because B Allele Freq exhibits less locus-to-locus
variation than the theta values for a given sample. The
transformation of theta values to allele frequencies allows for
improved measurements and better visualization of both LOH
and copy number changes.
B allele freq is described by the following equations.
B allele freq
= 0 if theta < tAA
= 0.5 * (theta - tAA) / (tAB - tAA) if theta < tAB
= 0.5 + 0.5 * (theta - tAB) / (tBB - tAB) if theta < tBB
= 1 if theta >= tBB
where:
` tAA = mean theta value of all genotypes in the AA cluster
plotted in polar normalized coordinates
` tAB = mean theta value of all genotypes in the AB cluster
plotted in polar normalized coordinates
` tBB = mean theta value of all genotypes in the BB cluster
plotted in polar normalized coordinates
Part # 11328837 Rev. B
B Allele Frequency and Log R Ratio
The Log R Ratio is based on normalized intensity data and for a
sample is the log (base 2) ratio of the normalized R value for the
marker divided by the expected normalized R value. For loci
included in GenomeStudio statistics such as Call Rate, the
expected R value is computed by linear interpolation of the R
value at the SNP's theta value for a sample, relative to the R
values of the surrounding clusters. Because no clusters are
generated for loci in the “Intensity Only” category, the Log R
Ratio for these loci is adjusted so that the expected R value is
based on the weighted mean of the cluster itself. Log R Ratio is
displayed the same way for these loci as it is for loci included in
GenomeStudio statistics in tools such as the IGV. Both SNPs and
intensity-only loci such as nonpolymorphic probes (which usually
have the identifier “cnv” in their names) are displayed in the log
R ratio plots in KaryoStudio.
For example, if for a given sample and SNP with:
` A theta value of 0.2
` an AA cluster at theta = 0.1, R = 1.5
` an AB cluster at theta = 0.4, R = 2.5
The estimated R at theta for the sample is: 0.2 is 1.5 + (0.2-0.1) *
(2.5-1.5) / (0.4-0.1) = 1.83. If the R value for the SNP is 1.6, the
Log R Ratio is: log2 (1.6/1.83) = -0.196
Interpretation
cnvPartition automatically scans both the B allele frequency and
log R ratio data for the presence of aberrations. In regions of the
genome with two copies, the B allele frequency sits at 0, 0.5, and
1 representing the AA, AB, and BB genotype clusters. In regions
of the genome that do not have two copies, various patterns
may be seen. You must take into account the direction in which
the log R ratio is deflected to determine if a gain or loss of DNA
is present. Increases in the log R ratio indicate duplications (or
amplifications) and decreases indicate deletions.
For more information about interpreting this data, see the
following Technical Note: Interpreting Infinium Assay Data for
Whole-Genome Structural Variation.
KaryoStudio v1.2 User Guide
121
122
APPENDIX A
Additional Information
Part # 11328837 Rev. B
Appendix B
Sample Sheet
Topics
124
Introduction
124
Sample Sheet
KaryoStudio v1.2 User Guide
124
APPENDIX B
Sample Sheet
Introduction
The figure below is an example Sample Sheet for KaryoStudio.
The following columns are required:
•
Sample_ID
•
SentrixBarcode_A
•
SentrixPosition_A
•
gender
All other columns are optional. If path is not provided in the
sample sheet, it will be required in the new project wizard.
Sample Sheet
Figure 92
Example Sample Sheet
Part # 11328837 Rev. B
Appendix C
Known Regions File
Topics
126
Introduction
126
Known Regions File
KaryoStudio v1.2 User Guide
126
APPENDIX C
Known Regions File
Introduction
Table 13 lists and describes the required columns of a Known
Regions File for use with KaryoStudio.
Table 13 Known Regions File Column Descriptions
Column
Description
Region#
ID code for the region
Disorder
Text description of the significance of the region
Chr
Chromosome number of the region
Start
Start coordinate of the region
End
End coordinate of the region
Length
Length of the region in base pairs
Length minus overlap
Harper to provide info
The figure below is an example Known Regions File.
Known Regions File
Figure 93
Example Known Regions File
Part # 11328837 Rev. B
Appendix D
Ignored Regions File
Topics
128
Introduction
128
Ignored Regions File
KaryoStudio v1.2 User Guide
128
APPENDIX D
Ignored Regions File
Introduction
Table 14 lists and describes the required columns of an Ignored
Regions File for use with KaryoStudio.
Table 14 Ignored Regions File Column Descriptions
Column
Description
Region Name
Text description of the region
Chr
Chromosome number of the region
Start
Start coordinate of the region
Stop
Start coordinate of the region
The figure below is an example Ignored Regions File.
Ignored Regions File
Figure 94
Example Ignored Regions File
Part # 11328837 Rev. B