1
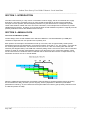
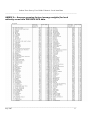
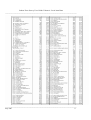
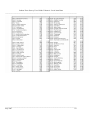
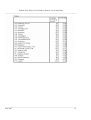
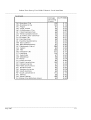
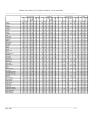
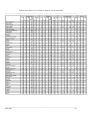
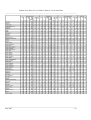
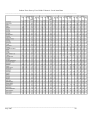
UK Data Archive Study Group Numbers 33315 and 33316 - LFS Two-Quarter and Five-Quarter Longitudinal Datasets
Labour Force Survey User Guide – Volume 6: Local Area Data
LOCAL AREA DATA
2007
CONTENTS
Page
SECTION 1 – INTRODUCTION .......................................................................................................1
SECTION 2 – ANNUAL DATA ........................................................................................................1
The Local Area database (LADB)...............................................................................................1
Annual Local Area LFS (ALALFS)..............................................................................................2
The Annual Population Survey (APS) ........................................................................................2
Weighting the Annual Datasets ..................................................................................................3
Sampling variability of the Annual datasets................................................................................3
Standard error estimates for levels.............................................................................................3
Standard error estimates for rates..............................................................................................4
Thresholds ..................................................................................................................................4
Thresholds for data on ethnicity .................................................................................................4
SECTION 3 – ACCESSING LOCAL AREA DATA ........................................................................6
ANNEX A – Average grossing factors (average weights) for local authority areas from
2005/2006 APS data ........................................................................................................................8
ANNEX B – Sampling variability for economic activity statuses for local authority areas (from
2003/04 annual LFS data) .............................................................................................................13
ANNEX C – Calculating thresholds for England, Wales & Scotland..............................................22
Labour Force Survey User Guide-Volume 6: Local Area Data
_________________________________________________________________________________
SECTION 1: INTRODUCTION
The Labour Force Survey is a key source of information of labour supply, that is on individuals who supply
their labour. The LFS is a quarterly survey of some 53,000 households per quarter. Each household is
surveyed over five quarters, with the final (fifth) interview one year after the first. It is designed to provide
robust national labour market and macro economic information, but its sample size is insufficient to provide
reliable data at local level. Therefore, for local area analysis annual datasets are produced, originally from the
quarterly datasets and then with additional boost surveys.
SECTION 2: ANNUAL DATA
The Local Area Database (LADB)
The first design of the annual database from 1996 was called the Local Area Database (or LADB) and
consisted of responses from four quarters of the quarterly LFS.
Each quarter's LFS sample of households is made up of 5 waves, each of approximately 12,000 private
households. Each wave is interviewed in 5 successive quarters, such that in any one quarter, one wave will
be receiving their first interview, one wave their second, and so on, with one receiving their fifth and last
interview (see diagram below). The LADB was created by taking waves 1 and 5 from each of four consecutive
quarters to obtain an annually representative sample. Over the period of four consecutive quarters, waves
one and five will never contain the same households and so this avoids the inclusion of responses from any
household more than once in an annual dataset.
When the LADB was first introduced, the quarterly LFS was based on seasonal quarters: Spring (including
the months March to May), Summer (June to August), Autumn (September to November) and Winter
(December to February). So, the LADB covered the period March to February (the quarterly LFS was moved
to Calendar quarters in 2006).
_________________________________________________________________________________
July 2007
1
Labour Force Survey User Guide-Volume 6: Local Area Data
_________________________________________________________________________________
Annual Local Area LFS (ALALFS)
For the period from March 2000 to February 2001, extra respondents were included in the annual data (but
not in the quarterly LFS data). This first sample boost covered only respondents in England, and was called
the English Local LFS (ELLFS) boost. In March 2002 a similar boost was introduced in Wales (the WLFS
boost), and in 2003/04 the SLFS boost was introduced in Scotland. The combined surveys were called the
Annual Local Area LFS (ALALFS).
The ELLFS is designed in such a way to give an expected minimum sample size of 875 economically active
adults in each LEA (450 in London Boroughs and 300 in Rutland). The WLFS is designed to have an
expected minimum sample size of 875 economically active adults in each unitary authority (700 for Anglesey
and Ceredigion, 575 for Blaenau Gwent and 500 in Merthyr Tydfil). The sample size in each UA in Scotland
is boosted to produce an expected minimum of 875 economically active adults. However to avoid saturation
sampling, this figure is reduced to 300 in Clackmannanshire, 600 in Stirling, 700 in Inverclyde and Midlothian
and 800 in East Lothian and East Renfrewshire.
Each household in the boost samples is interviewed annually for four years. To build up the sample, in
2000/01 for England (and 2001/02 for Wales and 2003/4 in Scotland), the sample was divided into four
groups or waves. Over the following three years they dropped out one by one, so that only one of the original
four waves was actually in the survey for all four years. A new wave is then sampled every year.
More information on the methodology behind the ELLFS only is available in articles on the National Statistics
Website and in the May 2000 issue of Labour Market Trends, pp195-199 and the January 2002 issue of
Labour Market Trends, pp33-41.
The Annual Population Survey (APS)
Because of a European Regulation, in 2006, the quarterly LFS changed from being based on seasonal
quarters to being based on calendar quarters (quarter 1: January to March; quarter 2: April to June; quarter 3:
July to September; and quarter 4: October to December). However, the annual databases moved to a
calendar quarter basis in 2004. From January 2004, a new sample boost was introduced in England only. The
aim of the new boost was to provide an expected minimum sample size of 875 economically active adults in
each UALAD in England instead of in each LEA. This allowed more accurate precision for the newly
launched ONS Neighbourhood statistics.
The new boost was called the Annual Population Survey boost, and this new boost combined with the Annual
Local Area LFS (which included the ELLFS, WLFS and SLFS) was called the Annual Population Survey. To
avoid confusion between the whole dataset and the new boost, the whole dataset is called the Annual
Population Survey (APS), and the new boost is called the APS(B).
The respondents included in the APS(B) boost did not answer all the questions included in the main LFS and
other sample boosts (ELLFS, WLFS and SLFS). Some estimates from the APS, therefore, for example those
relating to qualifications, are based on a subset of the database (that is, excluding the APS(B) cases).
With the introduction of the APS, it was decided that the annual data should be published four times a year
rather than just once, as had been the case with the ALALFS. Data are now published quarterly for
overlapping annual periods (January to December; April to March; July to June; and October to September).
In 2006 funding for the APS(B) was withdrawn, and so the structure of the Annual Population Survey reverted
to the same as the ALALFS (that is waves 1 and 5 of the quarterly LFS plus the ELLFS, the WLFS and the
SLFS). However, the name ‘Annual Population Survey’ has been retained and the data continue to be
published four times a year (and all questions are now based on the complete database).
_________________________________________________________________________________
July 2007
2
Labour Force Survey User Guide-Volume 6: Local Area Data
_________________________________________________________________________________
Weighting the Annual Datasets
Weighting of the data is done in order to allow the sample to provide estimates relating to the total population
and to minimise non-response bias. Each record’s weight is the number of people in the population
represented by that one sample member. The weights are based on the age and sex structures of the sample
and of the population. More information on the weighting procedure can be found in Volume 1 of the User
Guide.
For the local area (annual) databases it is desirable to improve the 'weighted totals' at the local area level.
This is done by using mid-year population estimates for local authorities and taking account of local authority
populations as well as the age and sex structures of the sample and population.
The basic methodology of raking which is used for weighting the LADB and ALALFS datasets is the same as
the method used for the quarterly LFS datasets. However, the APS datasets are weighted using a superior
generalised regression method.
Sampling variability of the Annual Datasets
As the LFS is a sample survey, all estimates from it are subject to sampling variability. Sampling variability is
dependent on several factors, including the size of the sample, the size of the estimate as a proportion of the
population, and the effect of the design of the sample on the variable of interest. Standard errors calculated
from simple random samples will, typically, differ from those calculated from more complicated sample
designs, such as clustered or stratified samples. In the case of the LFS sample design, there is a clustering
effect. This reflects the fact that addresses are sampled, but results are estimated for individuals. For
example, ethnicity is particularly clustered, since it is likely that all members of a household living at a
particular address will share the same ethnicity.
The sampling fraction is also important in determining sampling variability. A sampling fraction is the
proportion of households in an area that are interviewed. For example, if there are 10,000 households and 50
of these are interviewed, then the sampling fraction would be 50/10,000 or 1/200. The greater the sampling
fraction, the larger the sample size and hence the more reliable are the estimates.
The sampling fraction of the main LFS is consistent across Great Britain. However, the design of the annual
samples means that from 2000/01 sampling fractions may vary between Local Education Authorities in
England, from 2001/02, between UAs in Wales, and from 2003/04, between Scottish UAs database. English
LEAs and Scottish and Welsh UAs receiving a larger boost will have a higher sampling fraction. Northern
Ireland will see no change. The sampling fraction varies so that the 875 target of economically active adults
is achieved across LEAs and UALADs.
Where the sampling fraction is consistent over all areas, the standard error of an estimate of a level is
proportional to the size of the estimate. For the later, boosted, annual LFS datasets, because of the different
sampling fractions in different areas it is not possible to provide a table of size of estimate against standard
error. However, there is a simple conservative formula that can be used to derive the standard errors of
estimates of levels.
SE estimates for levels
An approximation to the standard error for an estimate of M thousand (MT) from the annual data can be given
by:
√(MT * Gi/1000) (1)
Where Gi is the average grossing factor (or the average of the weights for all the records) for area i.
_________________________________________________________________________________
July 2007
3
Labour Force Survey User Guide-Volume 6: Local Area Data
_________________________________________________________________________________
Average grossing factors for UA/LADs, from the 2005/06 APS, are given in Annex A. If the area of interest
spans several UA/LADs then the average grossing factor for several areas G can be given by:
∑w s
W =
∑s
i i
i
i
i
Where gi is the average grossing factor for area i and si is the 16+ sample size in area i.
The 95 per cent confidence interval for an estimate of M thousand (MT) is given by:
MT ± 1.96 * s.e.
SE estimates for rates
A simple formula for producing standard errors for proportions (assuming a simple weighted random sample)
is:
Square root(p(1 - p)/n)
For instance, in the January to December 2006 APS dataset, the estimate of the total number of people aged
16 and over who are economically active is 28,182,564. This is 59.4% of all people in the UK who are aged
16 and over. The number of people aged 16 and over in the UK sample is 283,358. The standard error,
0.09% is calculated as:
Square root((0.59 * 0.41)/283,358)
ONS methodologists have produced more precise standard errors allowing for the design of the LFS including
the different sampling fractions. However, this involves much more complex calculations than those described
here for the approximate standard errors. Annex B shows estimates of confidence intervals (based on the
precise standard errors) for economic activity. Because of the complexity of these calculations, these are for
the 2003/04 annual LFS data. They are not available for later data would not be significantly different.
The standard error of the level of the estimate is simply the standard error of the proportion (or rate) multiplied
by the population aged 16 and over:
0.09% * 47,452,934 = 42,707 (2)
The formulae (1) in the section above is an approximation of (2).
Thresholds
It is the nature of sampling variability that the smaller the group whose size is being estimated, or from which
an estimate is being derived, the less precise that estimate is. Put another way, the size of the standard error
increases with the level of the estimate, so that the larger the estimate the larger the standard error. But the
larger the sample estimate, the smaller will be the standard error in percentage terms (relative standard error
being the standard error as a percentage of the estimate). Thus, larger sample estimates will be relatively
more reliable than smaller estimates –an estimate of 500,000, while having a standard error of 13,800 will
have a relative standard error of 3%, compared with an estimate of 25,000 which has a standard error of
3,100 and a relative standard error of 12%.
Before 2005, publication thresholds were applied to quarterly and annual LFS estimates. That is, any estimate
which is smaller than the threshold was considered unreliable and hence not published. However, more
_________________________________________________________________________________
July 2007
4
Labour Force Survey User Guide-Volume 6: Local Area Data
_________________________________________________________________________________
recently no estimates are suppressed due to lack of statistical reliability. All estimates are published along
with 95% corresponding confidence intervals.
These thresholds are no longer applied by ONS in the dissemination of LFS and APS estimates, but this
section is retained as thresholds can be used as a simple way of identifying cells with high sampling
variability.
These thresholds were calculated to be approximately equivalent to publishing estimates which had a relative
standard error of 20% or less. The threshold for quarterly LFS estimates was 10,000, and the thresholds for
the annual LFS, before the sample boosts were introduced in 2000/01, was 6,000.
However, since 2000/01, the nature of LFS enhancement has meant that some areas have seen a very large
increase in sample size, and others very small increase or none at all. This means that a single threshold for
all areas is no longer appropriate.
For England, each area was allocated to one of three threshold bands - 2,000, 4,000 or 6,000. For Wales
from 2001/02, each UA was given its own threshold. These ranged from 1,000 to 4,000. From 2003/04, each
UA in Scotland was given its own threshold ranging from 1,000 to 5,000. Annex C shows how the thresholds
were calculated for the local authorities in each of the three countries.
These thresholds can also be applied to the APS.
Thresholds for data on ethnicity
It has long been known that the effect on the LFS of clustering within households (or ‘design effects’) for
ethnic group and for totals segregated by ethnic group can be substantial. For the annual LFS-based surveys
it is appropriate to take account of the design effects in the thresholds for estimates of variables by ethnic
groups. The local design effects may be different from the regional and national design effects because of
local variations in household size and because of variations in the proportions of households in multi-occupied
dwellings in different areas.
It is recommended for the ALALFS datasets in England that a single multiplier of 2.5 is applied to the general
thresholds for most ethnic estimates1. A separate analysis of the WLFS recommended a multiplier of 4.0 in
Cardiff and 2.5 in the rest of Wales. The SLFS uses the same multipliers of the standard thresholds as in
England. Thus a multiplier of 2.5 is applied to the existing threshold.
These thresholds can also be applied to the APS.
_________________________________________________________________________________
July 2007
5
Labour Force Survey User Guide-Volume 6: Local Area Data
_________________________________________________________________________________
SECTION 3: ACCESSING LOCAL AREA DATA
Local area LFS data are available via four routes:
(i) National Statistics website
The ‘Local labour markets: statistical indicators’ publication can be found at:
http://www.statistics.gov.uk/statbase/Product.asp?vlnk=14160
This publication gives an overview of labour markets indicators for local areas, and the APS is used for
estimates of labour supply. The publication includes some summary tables and analysis, plus downloadable
Excel spreadsheets containing data for all local authorities and parliamentary constituencies.
ONS’s on-line guide to labour market statistics http://www.statistics.gov.uk/labour_guide also contains
information on local area data, including information on the annual LFS and APS.
The Guide to Regional and Local Labour Market Statistics can be found at:
http://nswebcopy/statbase/product.asp?vlnk=4752
(ii) Nomis
Nomis contains tables of both annual LFS and APS data for a wide range of geographies. To access these
data visit www.nomisweb.co.uk. Regular users are encouraged to register and obtain a user account, but the
data can be accessed without registering. The most recent annual data on Nomis allows some additional
functionality, such as allowing user defined areas and variables. Estimates from the 2003/04 annual LFS and
all APS datasets are output along with corresponding 95% confidence intervals.
Annual LFS/APS data are available for the following geographies:
Countries
Government Office Regions
Counties
Unitary authorities
Local authority districts
Parliamentary constituencies
NUTS areas
Learning and policy geographies (eg ELWAs and local learning and skills councils)
(iii) ONS local area LFS Dataservice
The estimates from the annual LFS/APS available from the National Statistics web site and from Nomis are
pre-defined aggregates. For users who want to specify their own analyses and tabulations, ONS runs a
service to provide these. It is called the LFS Dataservice (but despite the name also provides analyses of
APS databases). There is a charge for this service. To request a table from this service or obtain more
information about the service e-mail [email protected]
(iv) Access to APS micro-data
The UK Data Archive (UKDA) in Essex are now managing a end–user and special licence procedure to allow
users access to the microdata files. As well as the end-user microdata files which only contain a limited
number of variables held at the Archive, a further data file is now available to users who obtain the special
licence enabling them access to a greater number of variables on their data files.
Obtaining the data under special licence involves two key stages.
_________________________________________________________________________________
July 2007
6
Labour Force Survey User Guide-Volume 6: Local Area Data
_________________________________________________________________________________
First, you need to get access to the UK data archive (UKDA). This is where the APS data are held and
downloaded from. To get access, you need to get an 'Athens account'. The link to the UKDA website and
instructions on how to do this are here found at the following website address: http://www.dataarchive.ac.uk/orderingData/introduction.asp.The UKDA also provide useful background about the APS and
links to more documentation here: http://www.esds.ac.uk/government/aps/ .All potential users of the data
need to be named individually on the licence and need to have individual Athens accounts. Many public
sector organisations can access the data for free but the UKDA can advise if you are in doubt.
Secondly, you have to complete a APS special licence application. This is considered by the ONS micro-data
release panel who decide whether to grant access or not. It is important that you have an active Athens
account and a project registered with the UKDA by this stage, as these details need to go on the licence
application. Applicants may asked to supplement it with more information about how we intended to use the
data at borough level. It is important to demonstrate why you need access to the APS special licence dataset
and why other data sources such as the LFS, NOMIS or the non-disclosive version of the APS dataset
(available through the UKDA), do not provide you with the detail or level of data, e.g. local authority level, that
you need. A copy of the licence the GLA submitted is attached to this email with our later amendments
included.
The UKDA advise that the best way to obtain the APS licence application form is to follow these steps
(assuming you have already obtained your Athens id and registered with the data archive): to request the
data via this page - http://www.data-archive.ac.uk/findingData/apsTitles.asp. At this stage, you will be
prompted to register a usage (research project) if you have not already done so. The data set then gets
added to a table and there are two links to click on in the 'Status' column - Request permission / Complete
Special Licence. This places a request within the ordering system and links you through to the latest version
of the APS Special Licence to complete, together with instructions as to how to return the completed
application.
Further Information
For general information about LFS local area data please telephone the Labour Market Statistics Helpline on
020 7533 6094, e-mail [email protected].
For further information about the ONS tabulation services contact [email protected] or Tel: 01633
655732.
For more information on Nomis contact [email protected] or Tel: 0191 334 2680.
_________________________________________________________________________________
July 2007
7
Labour Force Survey User Guide-Volume 6: Local Area Data
_________________________________________________________________________________
ANNEX A – Average grossing factors (average weights) for local
authority areas from 2005/2006 APS data.
_________________________________________________________________________________
July 2007
8
Labour Force Survey User Guide-Volume 6: Local Area Data
_________________________________________________________________________________
_________________________________________________________________________________
July 2007
9
Labour Force Survey User Guide-Volume 6: Local Area Data
_________________________________________________________________________________
_________________________________________________________________________________
July 2007
10
Labour Force Survey User Guide-Volume 6: Local Area Data
_________________________________________________________________________________
_________________________________________________________________________________
July 2007
11
Labour Force Survey User Guide-Volume 6: Local Area Data
_________________________________________________________________________________
_________________________________________________________________________________
July 2007
12
Labour Force Survey User Guide-Volume 6: Local Area Data
_________________________________________________________________________________
ANNEX B – Sampling Variability for economic activity statuses for local
authority areas (from 2003/04 annual LFS data)
_________________________________________________________________________________
July 2007
13
Labour Force Survey User Guide-Volume 6: Local Area Data
_________________________________________________________________________________
_________________________________________________________________________________
July 2007
14
Labour Force Survey User Guide-Volume 6: Local Area Data
_________________________________________________________________________________
_________________________________________________________________________________
July 2007
15
Labour Force Survey User Guide-Volume 6: Local Area Data
_________________________________________________________________________________
_________________________________________________________________________________
July 2007
16
Labour Force Survey User Guide-Volume 6: Local Area Data
_________________________________________________________________________________
_________________________________________________________________________________
July 2007
17
Labour Force Survey User Guide-Volume 6: Local Area Data
_________________________________________________________________________________
_________________________________________________________________________________
July 2007
18
Labour Force Survey User Guide-Volume 6: Local Area Data
_________________________________________________________________________________
_________________________________________________________________________________
July 2007
19
Labour Force Survey User Guide-Volume 6: Local Area Data
_________________________________________________________________________________
_________________________________________________________________________________
July 2007
20
Labour Force Survey User Guide-Volume 6: Local Area Data
_________________________________________________________________________________
_________________________________________________________________________________
July 2007
21
Labour Force Survey User Guide-Volume 6: Local Area Data
_________________________________________________________________________________
ANNEX C - Calculating thresholds for England, Wales & Scotland
This Annex explains how the publication thresholds were calculated for different areas for annual LFS data in
GB. ONS does not use these thresholds now, but they can still be used as a simple way of identifying cells
with high sampling variability.
It is the nature of sampling variability that the smaller the group whose size is being estimated, or from which
an estimate is being derived, the less precise that estimate is relative to its size. Put another way, the size of
the standard error increases with the level of the estimate, so that the larger the estimate the larger is the
standard error. But the larger the estimate, the smaller is the standard error in relative terms. The standard
error as a proportion of the estimate is known as the relative standard error or coefficient of variation (c.v.).
When thresholds were applied (such that estimates with a lower value than the threshold were not published),
estimates below ten thousand from the quarterly survey and below six thousand for annual data prior to
2000/1 were not published, as they were considered to be unreliable. These thresholds equate to a sample
size of about 30 and a relative standard error of about 20 per cent.
The boosted sample, which together with data from waves one and five from the main LFS, make up the
annual LFS data for England, Wales and Scotland in 2003/04, is not spread evenly across the country. This
means that for each local authority in England and for each unitary authority in Wales and Scotland, there
may be a different sampling fraction. This in turn means that the relative standard errors for the same
estimate may vary across local authorities, resulting in a requirement for individual thresholds for each area.
Approximate thresholds may be calculated for each local authority with the aim of providing a threshold value
that ensures that the relative standard error is at most 20 per cent.
For a small subgroup from a large simple random sample, the subgroup sample size, n, is approximately
distributed as a Poisson variable. For such a variable, the mean and the variance are equal and are estimated
by n.
If Gi is the average grossing factor (or average weight) for cases in subgroup i, the value of the grossed
estimate is Gi * ni.
Then ignoring the variable weights and the clustered design (approximately):
Var (Ei=Gi * ni) = Gi 2 * ni
(1)
The effect of both the grossing and the clustered design is reflected in the design effect, and this has been
calculated for the quarterly survey for a range of different estimates. These combined design effects vary
substantially for different variables - for estimates of employment and economic activity they are substantially
below one, whereas for unemployment they are greater than one.
So (1) should be modified to:
2
Var(Ei ) = Gi * ni * deffi
(2)
Thus:
Cv(Ei)=Square root (deffi/ni)
(3)
For the threshold for this variable, we must have:
cv(Ei) < 0.2
(4)
_________________________________________________________________________________
July 2007
22
Labour Force Survey User Guide-Volume 6: Local Area Data
_________________________________________________________________________________
So from (3) and (4) we obtain:
ni > 25 * deffi
Or in terms of the grossed estimate:
Ei > 25 * Gi * deffi
(5)
The values of the right hand side of (5) provide the required thresholds.
Gi for a particular local authority is the average grossing factor taken directly from the annual LFS data.
One result of including the design effect in the calculation is to lead to different thresholds for different
variables. However, variables are often used in combination - e.g. a tabulation of employment by ethnicity.
The design effect for employment is low, but the design effects for some ethnic groups are very high. This
makes it very difficult to come up with design effects for every eventuality. For the quarterly LFS a design
effect of one is assumed for all estimates except those for characteristics of minority ethnic groups, where a
design effect of 2.5 is assumed.
As noted above, this calculation leads to an individual threshold for each local authority. ONS recognises that
this would be very complex to implement and recommend the use of one of three threshold bands – six
thousand, four thousand or two thousand. The table below shows how the approximate thresholds have been
used to assign areas to these bands.
Approximate threshold
Threshold band
5000+
3000 – 4999
0 - 2999
6000
4000
2000
For Wales, the theoretical threshold for each unitary authority was not banded as above but simply rounded to
the nearest thousand. This resulted in thresholds for the 23 UAs in Wales, ranging from one thousand to four
thousand.
For the 32 Scottish UAs, the ideal thresholds were rounded for the total employed and unemployed.
Thresholds thus range from one thousand to five thousand.
_________________________________________________________________________________
July 2007
23