1
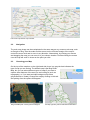
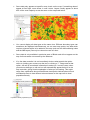
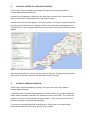
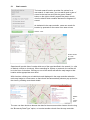
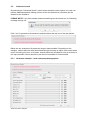
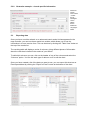
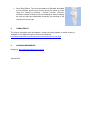
Church Webmap Advanced Version User Guide Introductory Note The Advanced Version of the Methodist Webmap shows the extent of districts, circuits and network regions and displays detailed information on churches and church activity relative to the local context. The webmap links up geographical and postcode data with the results of the annual Statistics for Mission returns round and data held by other organisations (the Office for National Statistics, the Church of England, partner charities). The information is presented in a way which aims to help users understand more about their churches, the people they serve, and the communities in which they are located. The webmap is regularly reviewed and updated. We welcome suggestions about new data that could be added or different functions that could be developed in order to enhance its effectiveness. If you have used the map before, you might want to go straight to section 6 to find out which functions and data have been recently added. For further help and guidance, please contact: Research & Statistics Team 0207 486 5502 [email protected] www.methodist.org.uk/mission/statistics-for-mission 2 BASIC FUNCTIONS The following sections show you how to use the basic functions in the webmap. Because of the scope and variety of available data, it can take some time to get used to the way it works and display the information you want to see. It is worth reading this guidance as an introduction, and exploring the map yourself to work out how you best want to use it. 2.1 Format When you go to the map web page for the first time, you will see a basic map with two parts to it. On the right is the main map image which displays what selections you have made in the map controller on the left hand side. The map controller appears as a column with text, containing a series of headings, options and boxes. By ticking, unticking or filling in the boxes you can call up or remove different types of data (e.g. churches, areas, boundaries) and so control what is displayed on the main map image. On start-up, the main map image will display a simple map covering most of Britain, marked with Methodist District boundaries. On the left you will see that the site has selected for you the Methodist Boundaries option, and within this the Methodist Districts option. No other data is shown at this stage. From here you can use the various functions on the left hand side to explore the map, or zoom and drag the map in the map box itself. 2.1.1 Transparency function At the top of the map controller you will find a moveable bar for Transparency. The value is set to 20, but the further right you move this bar (i.e. the closer to 100), the more transparent the data displayed at that time will become. This is especially useful when activating data layers such as those shown in section 3.1. 2.1.2 Full screen function & hiding the map controller Clicking on the green icon in the top right corner of the map image will expand the map. You can return to the main website by clicking the Back to main website link above the display. Depending on the device you are using, the map will either cover your whole screen or a large part of it. The map controller can be hidden by clicking the arrow sign on top of the map controller. Clicking the arrow sign again will unhide it. Full screen map without map controller 2.2 Navigation The main map image can be manipulated in the same way as any common web map, such as Google or Bing. Use the scale and the arrows on the left hand margin of the map to control the zoom level and to move in any direction. Alternatively, by clicking your mouse and dragging the map you can move it to your chosen location. Double clicking the mouse over the map will zoom in closer on the point you click. 2.3 Choosing your Map On the top of the map box on the right hand side, there is a gray tab that indicates the type of map you are seeing. The default map is the Bing Road Map, but you can select different types of maps if you want to explore other features of the area you are looking at (such as topography), or if you want a simple background (such as greyscale and no roads). Change the map by clicking on this tab and picking from the options that appear. Bing Aerial Map with Learning Network Regions Arc Map Light Grey Canvas with District Boundaries 2.4 Exploring the Map There are three main options of examining the data available on the web map. These are: ‘Browse the Map by Data Type’ ‘Districts/Circuits’ function ‘Search’ function These options are explained in turn in the subsequent sections of this guidance. Each option is selected by clicking the + sign on the corresponding grey bars across the map controller column on the left hand side of the screen. When you first load the map, the ‘Browse map by data type’ function will automatically be selected and expanded into the map controller. 3 OPTION 1: BROWSING THE MAP BY DATA TYPE This option allows you to view different data types on the webmap in any combination which is technically possible. Data selections made in the map controller will be displayed on the main map image. By clicking on the map image over any point you want to explore, you can call up the statistical data relating to that point or area. A call-up box will appear with as many tabs as there are data types selected on the left hand side. The specific data relating to each data types will shown when you click on the tab. 3.1 Data presentation Data is presented on the map using: o Geographical points (such as the location of churches) These are displayed using a number of images or shapes on a particular point in the map. o Boundary lines (such as a district or county boundary) These are displayed mainly as lines or dotted lines in different colours. o Coloured layers over the area of the map you are viewing Data relating to the population of particular areas is displayed using colour scales; different shades or colours indicate different levels of, for example, deprivation or religious affiliation. Browsing the data works in a cascade system. Some data types require you to select a general type first and then a specific data set by clicking a second button (e.g. Methodist Churches - Churches by Circuit). Depending on the data level selected, a horizontal and/or vertical scroll bar might appear. Please use these bars when the text displayed is only partly visible. Some data only appears at specific zoom levels on the map. If something doesn’t appear at first sight, zoom closer in until it does. Layers usually appear at about 40% of the zoom capacity as can be seen on the map scale below. Child Wellbeing Index zoom level You cannot display all data types at the same time. Different boundary types can sometimes be displayed simultaneously, as can most map points, but data which requires coloured layers to be added to the map (such as the child wellbeing index and the IMD layers) can only be viewed one set at a time. Some data is only available in particular parts of Britain and will not appear on the map for those areas not covered by the data sets. If on the data controller it is not immediately obvious what a particular option refers to, holding your mouse over the text, or clicking a “?” image next to that option, will call up some basic information to assist you. In some cases, when you select a data type, a call-out box will automatically appear below it on the map controller, giving a basic explanation of what you are seeing. This might range from explanation about what different sized points indicate about church membership sizes to how different coloured areas on the map refer to local population density. Population density explanatory box 3.2 Data selection The data you can add to the map is categorised into: Church Data Use this category to explore Methodist churches, schools, buildings and fellowship groups, and for accessing Church of England and Action for Children project data. National Statistics Use this category to explore neighbourhood demographics. The category is divided into measures of relative wellbeing (Deprivation Indices) and 2011 census data relating to age groups, population density, ethnicity and religion. Rural areas & Landuse classifications Use this category to explore where urban areas lie and how the country is categorised in terms of rural/urban makeup. Administrative Boundaries Use this category to add to the map a range of boundary lines relating to administrative areas, such as wards or counties. Once you have chosen the category of data you want to see, click the box next to it on the map controller. If you need to make a more specific choice, the options will drop down automatically under your selection. Click again against the data you want to see. In some cases you will need to do this twice. 3.3 Illustrative example Below is an illustrative example of how the information chosen in the map controller looks like on the map. Methodist Learning Institutions 3.4 Turning data off If you want to turn off one type of data, untick the box next to it in the map controller and it will disappear from the map image. If you want to turn off a whole category of data, you can deselect the box next to that category type rather than having to unselect every individual box. 3.5 Exploring the data about a particular point-location on the map If you would like to know more about a particular point-location on the map image, e.g. a church or a school, click on it. A call-out will appear displaying a range of factual and statistical data about the point-location you have identified. Selected point: “The Limes” Methodist Housing in the Northampton District The call-out box has additional tabs across the top relating to other data categories you have selected on the map controller (above: “The Limes” – Housing / Northampton District – Methodist Boundaries). 3.6 Exploring the data about a particular church Data relating to Methodist churches is particularly detailed. When you click on a church point on the map image some basic information about the church appears in the call-out box. Within the box is a “Further Information” link. If you click this, a panel will appear below the map image providing far more detailed information about that church. Selecting a Methodist Church Along the top of the Further Information panel are a series of tabs which open up different additional data sets about the church. These range from current and historic membership and attendance figures to detailed information on church groups and outreach projects. Unless otherwise stated, the information in this panel is the data provided by the church in the previous annual statistics returns round. The Further Information panel 3.7 Correcting errors If you notice any inaccuracies, or have any questions regarding the data on the map, please contact the Research & Statistics team. 3.7.1 Location of church buildings The location of church buildings is plotted on the web map using the postcode held for it in the Methodist Church database. Buildings are plotted at the middle point of that postcode unless we have more specific grid references for it. For this reason, they will not always be precisely in the spot of the map where the church building actually sits. In most instances the difference will be minimal, but if the difference is of a significant scale, do get in touch. Changes will be made at the earliest opportunity. 3.7.2 Churches on the map The Methodist Church in Britain defines a church by the people who gather for worship rather than the building in which they meet. For this reason, data is collected and displayed of churches defined as worshipping communities with a church council. The data for classes of a worshipping community or the worship buildings other than the main church site (including other chapels) are therefore included in the one church record. Therefore only the main church site for a worshipping community will be marked on the web map. 4 OPTION 2: DISTRICTS / CIRCUITS FUNCTION This function can be accessed by clicking on the grey bar in the map controller column labelled “Districts/Circuits”. A district can be selected by clicking on the drop down list next to the “Select District” option. Once done, the map will zoom to the chosen district. A list of the circuits will then appear in the map controller. Clicking on these will draw the boundary of the selected circuit. Multiple circuits can be selected by holding down the Control button on your keyboard and clicking on the names of all the circuits you want to display. Selection: Cornwall District and three circuit boundaries After selecting a district or circuit, the user can then open the “Browse the map by data type” option in the map controller and add further data to the map. 5 OPTION 3: SEARCH FUNCTION This function can be accessed by clicking on the grey bar in the map controller column labelled “Search”. It allows the user to locate individual districts, circuits, churches or groups of churches which match information that has been specified in the map controller. The results are called up in the form of a list inside the map controller. Click on any item in the list to take the map user to the location(s) identified. The map can cope with searches producing up to 1000 results. Any search which produces more than this will return an error on the system. 5.1 Basic search The basic search function provides five options for a user search. In each case, you can add a word or part of a word to the text box and click the green “Search” button on the right to identify a particular place, church, circuit or district which contains that word or fragment of a word. As indicated in the map controller, users can search for location by postcode or the name of an area or town. Search: “York” Search results for “York” displayed on map Searches will provide lists of results which are of the type identified in the search (i.e. a list of districts, circuits or churches). When searching for a place or postcode, the results will be in the form of churches. Clicking on one of the results will take the map image to that location at the appropriate zoom level. With churches, clicking on an individual result displayed in the map controller takes the main map image to a close zoom on that church and automatically shows a pop up box for the church, providing some basic details. Details for “Trinity York” The user can then decide to browse the data for the area around the chosen church using the “Browse by Data Type” option, or to select another church from the map controller. 5.2 Advanced search By selecting the “Advanced Search” option below the basic search options, the user can perform detailed searches relating to some of the rich data held on churches and the areas they are located in. PLEASE NOTE: If you have already entered something into the search box, the following message will pop up: Click “Yes” to proceed to the advanced search window and tick one of the two options: Below are two examples to illustrate the range of data available. Depending on the category, search data can either be entered through choosing an option from a drop-down menu or entering free text. In all cases, search results are provided as a list of churches in the map controller column where they can then be accessed for further details. 5.2.1 Illustrative example – local community demographics Advanced search: Religion 5.2.2 Illustrative example – church-specific information Advanced search: Church data – Wales Synod – Ceredigion circuit – Village Rural – Additional Languages: Welsh 5.3 Exporting data Once you have run either a basic or an advanced search and a list has appeared in the map controller, you can turn these results into a table, which allows you to see the information in a more concise form. This can be done by clicking the “Table View” button at the top of the results list. The resulting table will display a series of columns, giving different pieces of information about the churches included in the results of your search. To edit which columns you see, click on the header of one of the columns and select the “Columns” option. You can tick each type of data on or off to edit the chart. Once you have created a list of the data you want to see, you can export this chart as an Excel spreadsheet by clicking the “Export to Excel” button at the bottom of the chart. Search results for “Top” in table view 5.4 Next steps After finding the data you have been looking for, or simply browsing the webmap, you can re-navigate with the help of the four icons in the left corner of the grey bar above the map. Globe icon: Reset the map to its initial default state Eraser icon: Clear previous search selections Printer icon: Print the current image Magnifying glass icon: Go / Return to Advanced Search 6 WHAT IS NEW IN 2014? DATA UPDATES: Connexional Database (populating all Statistics for Mission data in pop-up boxes) including upgrading the mapping API Church Locations (from Connexional Database) > June 2014 update Browse Church Data > External Reference Data > Church of England Dioceses (showing West Yorkshire and the Dales) Browse Church Data > External Reference Data > Ofsted Schools list Browse Church Data > National Statistics > Demographic Data > UK Census 2011 DATA ENHANCEMENTS: Browse Church Data > Methodist Boundaries > Training Regions (boundaries and pop-up boxes) Browse Church Data > National Statistics > Demographic Data > UK Census 2011 (population age band) OTHER UPDATES: Update the Church Statistics Master table / View update with additional fields Modified map views (full screen) 7 GENERAL INFORMATION Some of the information on the map is experimental. For example, Methodist ecclesiology has traditionally regarded the Church as without boundaries. In an age where defined areas of responsibility or service can be very useful for all sorts of planning, however, we have generated district and circuit boundaries by plotting geographical middle points between all churches in different circuits and joining the dots. For this reason, these computerised-generated boundaries will deviate from more recognisable features such as rivers or county boundaries. Please get in touch if a circuit as plotted on the webmap appears significantly to misrepresent the geographical focus of mission, ministry and pastoral need. 8 South East District: The circuit boundaries of Gibraltar and Malta are not defined, and the two circuits cannot be called up when using the “Search by Districts / Circuits” function. However, churches located in these circuits are displayed when browsing the map by data type (Methodist churches) and scrolling to the relevant part of the map. COMPATIBILITY The map is compatible with all browsers / screens including tablets. A mobile version is available on the Methodist app for iPhone and Android. http://www.methodist.org.uk/news-and-events/methodist-church-app 9 ACKNOWLEDGEMENTS Design by http://www.groundwork-gis.org.uk/ August 2014