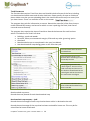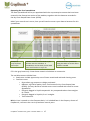
1
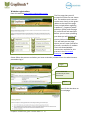
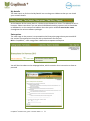
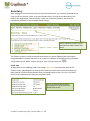
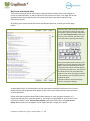
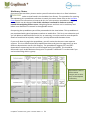
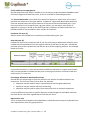
+ CropBench user guide Contents Introduction ............................................................................................................................... 3 + What is CropBench ................................................................................................................... 3 Technical requirements ......................................................................................................... 5 Website help tools ................................................................................................................. 5 Website registration .............................................................................................................. 6 Farm details............................................................................................................................ 7 My details............................................................................................................................... 8 Enterprises ............................................................................................................................. 8 Data entry ................................................................................................................................ 12 Key farm and output data .................................................................................................... 13 Variable Costs Cluster .......................................................................................................... 16 Labour Costs Cluster ............................................................................................................ 20 Full-time labour................................................................................................................ 20 Part-time labour ............................................................................................................... 20 Employed labour full-time equivalents............................................................................ 20 Family or proprietor unpaid labour ................................................................................. 20 Value for one full-time family labour unit ....................................................................... 20 Machinery Cluster ................................................................................................................ 21 Property Cluster ................................................................................................................... 25 Overheads Cluster ............................................................................................................... 28 Validation ............................................................................................................................. 29 Farmers using CropBench+ who are not part of an Arable Business Group .................... 30 Reports ..................................................................................................................................... 30 Appendix .................................................................................................................................. 33 Explanation of imputed costs .............................................................................................. 33 Default order of crops in CropBench+ . ............................................................................... 33 Items for ABGs to consider prior to submitting data .......................................................... 34 + CropBench Website user guide – October 2014 v.1.4 2 Introduction Welcome to the CropBench+ user guide. This guide has been designed for the use of Arable Farmers and HGCA staff to be able to assist users in navigating around the CropBench+ website. This guide will be updated at regular intervals and contains help in the correct procedure to upload data onto the website. It will also set out various parameters for Arable Business Groups and individuals to enable consistency for comparison of different farms and farming practices. This manual takes you through the whole process, from registering through to uploading the data and running CropBench+ reports. The manual also includes easy-to-use hyperlinks to useful information relevant to the process. What is CropBench+ HGCA launched CropBench+ in June 2014 and is based on, and supersedes, the computerbased cost management tool ‘CropBench’ launched in 2005. The new ‘plus’ version is solely web-based, with a data collection service offered to Arable Business Groups. It is an HGCA levy-funded, independent and confidential cost management tool which allows growers to make full analyses of total costs of production beyond Gross Margin level for cereal and oilseed crops. CropBench+ can be used by individual arable farmers and consultants. HGCA offers a facilitated data collection service to Arable Business Groups. The data collections are validated to ensure consistency. This provides an up-to-date analysis by harvest year, rather than by financial periods. Arable Business Groups comprise local growers, where group discussions from the results are supported by HGCA’s ongoing Business Development Program. This program centres on the HGCA Monitor farms, which are located throughout the UK. Growers and Arable Business Groups using CropBench+ can generate a variety of reports, produced in Excel or PDF formats, tailored to their own needs, for example, an Enterprise Report, which provides a breakdown of all costs incurred, as well as enterprise income. The report calculates the total costs of production as well as the margin earned after all inputs have been paid for (net margin). Farms are ranked in terms of percentages (ie in the top 33%, average or bottom 33%) based on cost of production or net margin. CropBench+ allows farmers to choose the ranking criterion. Averages are only visible where information has been entered. Therefore, the more information entered, the more comprehensive the end report. CropBench+ is an arable benchmarking system, where reports are only generated for specific enterprise types and exclude other enterprises in order to keep it as relevant as possible. Together with the reports you have asked for, you will also find a copy of ‘Your CropBench+ Reports Explained’, a quick guide to understanding the results. + CropBench Website user guide – October 2014 v.1.4 3 Why benchmark? By using benchmarking in a group situation, you can compare your business with your peers operating in similar circumstances. You can identify the business with the lowest costs and best margins and find out how they do it. Calculating costs of production and net margins can allow you to set targets and monitor your progress against these targets. Using a benchmarking tool like CropBench+, you can plan for a variety of scenarios, such as: Rotation and budgets Changing cropping mix or level of crop inputs Adding or subtracting labour/machinery/buildings/land Planning for new crop diversification rules. Arable Business Groups An Arable Business Group (ABG) is a group of growers who want to improve their business management skills, understand their costs of production, investigate pricing strategies, share information and make efficient use of industry experts. They often consist of existing agronomy or discussion groups that want to benefit from using business management tools. The HGCA-facilitated group discussions help growers work together to identify best practice and focus on issues relevant to the group. Contact HGCA to find out more about joining an ABG or click on the hyperlink: Arable Business Groups. “Using CropBench+ gives you a straightforward way to calculate costs of production for combinable crops. When used in Arable Business Groups, best practice can be identified and used as a basis to drive improvements in your own business.” Derek Carless, HGCA Lead Regional Officer + CropBench Website user guide – October 2014 v.1.4 4 Technical requirements CropBench+ is a web-based program and, as such, the data and information that is uploaded can be securely accessed on any internet linked device. It can be accessed on either a PC or Apple computer. The program requires that you have MS Excel on your device. Website help tools The website has been designed so that anyone with basic IT knowledge can upload their own data. To help with this process, we have provided various help tools to assist. Mouse helps: Throughout the website there are inbuilt help screens. This is especially useful to clarify what information needs to be entered. Simply hover your mouse pointer over certain parts of the page and a help screen may be available. The source section at the bottom of the mouse help textbox, offers suggestions as to where information being asked for can be ‘sourced’ from. Forms and examples This page is situated on the entry page of the website. Various forms can be downloaded and printed from Forms and examples. They are also included in the appendix of this manual or accessed here. They include: Data Entry Booklet (DEB): This is a document to download to enable the user to record all the information required for CropBench+ in paper form prior to upload Essential Data: This is a summary of the information required in order to complete a CropBench+ account Your Cropbench+ report explained Website Registration: Procedure instructions for farmers, consultants or students Data Authorisation Form: This form is used by HGCA staff when collecting data. + CropBench Website user guide – October 2014 v.1.4 5 Website registration Enter the website http://www.cropbenchplus.org.uk The first page that you will encounter will be the one shown left. The website main controls can be seen clearly on the green ribbon at the top of the page. These include News regarding CropBench+, frequently asked questions (FAQs) and the page for useful forms and examples. Before you can start uploading your data you will need to left mouse click on the icon. This will lead you to a page where you can input yourself as a farmer, consultant or student. There are downloadable instructions available for this process in the Forms and Examples section. Please follow the process and when you have received a password from the administrator proceed to log in. Log in Enter email and password you have been sent Sign in You will then be taken to this webpage. + CropBench Website user guide – October 2014 v.1.4 6 Farm details The website pages are controlled by the icons on the top line of this webpage. They are set out so that each section should be completed from left to right of the page, ie fill in the information in ‘Farm Details’, then proceed to complete the ‘Enterprises’ page and so on. Fill in the details using the drop-down boxes as shown here. Clicking on the arrow will reveal a drop-down box of choices. Left click mouse on the suitable option or use arrow keys on your keyboard and press enter. Financial year CropBench+ is set up to record inputs and outputs for a specific growing season, from planting to harvest. It is envisaged that farmers will record their data annually to compare years. As the majority of crops are harvested in the summer, CropBench+ is set up for a September year end. When first accessing the website, the system will assume that you will want to record data for the current harvest year. Use the drop-down arrows to move the year back or forward 12 months. Farm Name and Harvest Year being worked on as shown in top right of webpage My consultants You can elect to allow a consultant to view your information. They can be permitted and removed from accessing your data at any time by using the arrows. A consultant needs to register as a consultant onto CropBench+ and can be permitted to access any farm datasets to which permission has been granted. This can be useful for Arable Business Group data reporting. Region This is the area covered by each HGCA Regional Managers. To determine in which area your farm is located, click here HGCA Region Map Proceed through the rest of the drop-down boxes to choose County, Farm Type, etc. N.B. If you are unsure of your average rainfall please check on this link: www.metoffice.gov.uk VERY IMPORTANT Complete this section by clicking on the ‘Update Details’ in the lower right hand corner of the page. + CropBench Website user guide – October 2014 v.1.4 7 My details The next step is to click on the My Details icon on the green ribbon so that you can check your account details. At the bottom of the screen there is a choice to use hectares or acres. The default for this is hectares. Please note that if you use other AHDB benchmarking systems such as Stocktake or Milkbench+ on the same email address then the option selected must be the same throughout the various software packages. Enterprises The next stage in the process is to proceed to the Enterprises page where you can add all the various crop enterprises that you wish to benchmark for the year. N.B. In CropBench+, each crop grown is defined as a separate enterprise. Click on this icon to add an enterprise You will then be taken to the webpage below, which contains clear instruction on how to proceed + CropBench Website user guide – October 2014 v.1.4 8 Click on the icon as illustrated and you will be taken to a page where you can select a crop. Click on the arrow to reveal a drop-down box from which you can choose your crop. If you have not entered data for a crop in a previous year’s CropBench+ you will need to select the button above where you can edit the information, (If this is your first year uploading CropBench+, this option is greyed out and not accessible.) Select the crop required and give it a name that you can recognise. It is recommended the name used is consistent across groups and is easily identifiable for the farmer, Regional Officer and Regional Manager. This may mean using the season such as Spring Barley or market, for example, Vining Peas, Malting Barley or Milling Wheat. Alternatively, the name may relate to the stage in rotation such as First Wheat and Second Wheat. Then press the icon. You will then be taken to the next screen, to which you can add additional crop-specific information using the drop-down arrows. This shows the completed enterprise information selected for a Winter Feed Barley crop. Once you have selected each of the items, click on the Save icon. This will take you back to the previous screen. Once back into this screen, you can go back and edit the entry or remove it from the record, if necessary. If satisfied, you can then add additional enterprises until all of them for the season have been entered. Depending on the number of enterprises entered, the list will then look something like this. + CropBench Website user guide – October 2014 v.1.4 9 You can choose to benchmark up to 12 enterprises. By giving them specific names (eg varieties or fields), you can break them down even further but you must be sure that you will be able to identify the costs and outputs accurately. If you are benchmarking with an Arable Business Group you may decide to create specific rules as a group as to how this is to be carried out. Other crops The drop-down list of crops includes an option for ‘other crops’. This facility enables you to benchmark other arable crops not listed, by giving them specific names such as below: There is no facility to add additional information other than crop name in ‘Other Crops’. If you are looking to benchmark the ‘Other Crop’ within and Arable Business Group (ABG) it is recommended you agree which crop is Crop 1, Crop 2, etc. prior to uploading your data. Failed crop If you have a crop failure and a field is re-drilled with the same or a different crop, you can either decide to: Add a failed crop as an enterprise in ‘Other Crop’ and name it as such, eg failed W Wheat. If the field is redrilled with a subsequent crop the land area will be double counted. In that case, write a comment in the notes section to that effect. Please note, that if this method is adopted, you will need to adjust the weighting factor for the labour and machinery to account for the work done. Look in the CropBench+ Manual Appendix to find out how to do this Add a failed crop as an ‘Other Crop’ as above, but with a ZERO Ha/Ac area unless the land was subsequently left fallow. (This is to prevent the land area being counted twice). NOTE. This method would not allot fixed costs associated with the failed crop Ignore altogether. + CropBench Website user guide – October 2014 v.1.4 10 Uploading enterprises in 2nd year If you are uploading CropBench+ in a second or subsequent harvest year, the line that was previous greyed out becomes active. The drop-down buttons will contain all the ‘Names’ for the crop enterprises recorded the year before. Please make sure that you use this first option if you are benchmarking a crop this year that you also benchmarked last year. This will maintain the year-on-year comparisons. If in the subsequent year you are growing additional crops to that which were grown, use the second option. Any crops no longer grown or not being benchmarked can be ignored. IMPORTANT NOTE As you can see from the Summary of enterprise above, each enterprise can be edited and removed. Removing an enterprise once it has been set up is unfortunately not as straightforward as it appears and has implications for the calculators throughout the CropBench+ website. This option should be avoided where possible, to minimise the need to manually adjust the calculators within the site. Contract farmed land (note for HGCA Regional Officers and Managers) Arable Crops that are being benchmarked must either be: On land that is owned by the farmer On land that is rented by the farmer via an AHA or FBT. Cropping areas where there is a contract farming agreement should only be benchmarked where the landowner has agreed and signed a Data Authorisation Form. When this has been completed, the contract farmed land areas should either be: Benchmarked separately using a different registration email and password Benchmarked on the basis of the total area farmed as if it were a single unit. The HGCA Regional Manager/Officer and grower should discuss which benchmarking option is most appropriate and record the details of this in the Notes section. + CropBench Website user guide – October 2014 v.1.4 11 Data Entry After adding all the enterprises that you intend to benchmark, you can then proceed to the next part of the process, which is to start the Data Entry. Clicking on the Data Entry icon leads to the page below. The Data Entry is split into six distinct clusters, which can be individually accessed via the methods shown below. The six Data Entry Clusters can be accessed from either of these two places. The ‘Notes’ section is simply a notepad to jot down any notes regarding the information being uploaded for future reference or as a note to a validator if the data is being validated. Simply open up the ‘Notes’ section and type your comment and click . Check data As described on the webpage, there are orange Check Data links alongside each of the clusters. After uploading data in each section these are useful tools to check whether the data entered is within the parameters that you would expect to see. This is a very useful check for any obvious errors that you may have made. This is an example data check for Spring Barley in the Key Farm and Output Data section. + CropBench Website user guide – October 2014 v.1.4 12 Key farm and output data This section captures all the information required about the farm area, crop outputs in terms of yields and sales, as well as values of crop used on the farm. This page will be prepopulated with the enterprises for the harvest year that have been entered in the Enterprises section. By clicking your mouse on the Key Farm and Output Data icon, it takes you to the page below. To enter data, click the mouse onto the first in the series of boxes on the right hand side. Type the number required in the box. Do not press enter (unless you wish to print). Instead, proceed to the next data box by pressing the Tab key. Carry on with this process of entry and TAB until you have completed the page. When you have checked your entries, click the ‘Save’ button at either the top or the bottom of the form. You will then be taken back to the main Data Entry page. You can enter the page to amend at any time but you must press Save to update the data. The Cancel button will exit the page without saving the changes. As described earlier, a full description of the information required and sources for it can be obtained from the help boxes that appear as you move your mouse pointer over the name of each data field. Please note that not all the data fields will be relevant to your business; however, it is important that you fill in everything that is. If a field is not applicable to your farm or if you know that a value is zero, do not leave it blank, you must ensure that you enter a zero value. Blank values will not appear in the report and will corrupt your results. + CropBench Website user guide – October 2014 v.1.4 13 Total farm area The first data box requires Total Farm Area and should include all areas of the farm including non-benchmarked arable areas and all other land uses. Please specify all areas to 2 decimal places. Make sure that you are uploading data in the Land Preference Area (ha or acres) that you have chosen. There is a reminder of this on the screen The program then asks for information on tenure. Record the areas (ha) of the farm that are under AHA and FBT tenancy and areas for which no rent is paid (eg own land, land free of rent and contract farmed). The program then requires the input of Land Use. Record the hectares for each land use which is included in the Total Farm Area: Buildings, roads and woods Set aside, fallow, environmental margins, EFAs and any other ‘greening’ option Grassland Benchmarked crops as area planted in the year (see below) Non-benchmarked crops being grown on the farm that year. The Total Farm Area has to be recorded here The Total Farm Area is now broken down according to land ownership and use The program generates two ‘check’ figures. The sum of the land ownership and the sum of the land use should both be the same figure and be the same as the Total Farm Area figure This check box calculates the totals of the Benchmarked Crop areas recorded Benchmarked crop areas Record the areas planted for each benchmarked crop Benchmarked crops outputs – yield Record the total tonnages of each crop that has been sold or is destined to be sold. Record the total tonnage of the crop that has been retained for home use. This may be for animal feed or home saved seed. + CropBench Website user guide – October 2014 v.1.4 14 Benchmarked crops outputs – grain value Record the Net or ex-farm value of grain sold for each enterprise. If the grain has not yet been sold, then either: Enter a zero value and complete this section at a later date Enter an estimate. CropBench+ can be revisited and updated at any time when actual sales have been made. To ascertain the value of home used grain there are few options to consider. Either value at the average price that the grain was sold for over the season or the value at the opportunity cost at the time of use (ie what it could be sold for at the time that it was used on farm). Benchmarked crops outputs – other income Record any other income received relating to the crop. Possible inclusions will be items such as: Straw – either sold off farm or transferred to another farm enterprise (eg animal bedding, feed or energy use) Rape haulm Insurance pay-outs for crop failure, faulty seed, agronomist error or crop compensation received from utility companies, etc. If a ‘muck for straw’ agreement is in operation with a neighbouring farmer, then either: o Value the straw at the opportunity cost sale value and remember to include the contra cost of the FYM ‘purchased’ in the variable costs section o As the contra balances out the sale income and costs you may choose to ignore and not include at all. Note: If you are recording your data to compare alongside an Arable Business Group then discussions should be held in the group beforehand as to how these and other issues are to be handled so that the benchmark report results are consistent. When you have entered all the data (and have entered zeros where applicable), press ‘Save’. Use the Check data facility to check whether the data uploaded falls within parameters that you expect for the crop + CropBench Website user guide – October 2014 v.1.4 15 Variable Costs Cluster The next cluster involves the uploading of the variable costs attributed to each crop enterprise. Clicking onto this webpage, you will notice the inclusion of an icon which takes you to an Excel spreadsheet. As the Variable Costs Cluster webpage text states (see below), you can elect to use the Excel spreadsheet to enter the data or enter directly onto the website but not a mixture of both methods. This rule applies for all Excel spreadsheets used in CropBench+. The spreadsheet is supplied as it makes the process of uploading data clearer and easier. Note: It is advisable that all calculators are used and in doing so, all boxes on the data entry page will be completed for you, once the calculator has been uploaded. By double clicking the left mouse button the Variable Costs Calculator icon causes the popup box below to appear at the bottom of your screen. Please note: Sometimes it takes a few seconds for this box to appear on the screen. Click on the ‘Open’ button Clicking on the ‘Open’ button will open the Excel programme on your computer. N.B. There is no requirement to save the opened document onto your computer, as when the spreadsheet is completed you will be required to upload and save onto the CropBench+ system. The spreadsheet can be re-opened and edited for a harvest year at any time. Click on the ‘Enable Editing’ and ‘Enable Content’ in the yellow bars above if prompted + CropBench Website user guide – October 2014 v.1.4 16 Operating the Excel spreadsheet The Excel spreadsheet will be pre-populated with the crop enterprise names that have been entered in the Enterprises section of the website, together with the hectares recorded in the Key Farm Output Data cluster (KFOD). N.B. If your records are in acres, then you will need to convert your data to hectares for this spreadsheet. Enterprise Crop and land area ac/ha Choose to enter data as totals or per hectare into this calculator. A combination can be used, ie total seed costs with fertiliser as £ per ha Scroll across the spreadsheet using this slider to access all the columns needed Fill in the grey boxes only. Green boxes contain calculations or summaries. The variable costs are divided into: Seed costs. Include opportunity cost of home saved seed and seed cleaning costs. Fertilisers costs: o By products, eg compost or sludge purchased o Manures, eg FYM or poultry litter. As discussed in Key Farm Output Data (KFOD), you may decide to include contra costs involved with muck for straw agreements o Inorganic bagged or liquid compounds. Any compounds other than straights N, P and K o Inorganic bagged or liquid N, P or K straights o Trace elements. N.B. As Lime is spread on a less frequent basis, it is included later in the Property cluster of CropBench+, to ensure the cost is spread over several years. + CropBench Website user guide – October 2014 v.1.4 17 Spray Costs: o Molluscicides o Herbicides including desiccants o Fungicides o Insecticides o PGRs o Other. Adjuvants can be either included here or alongside the chemicals to which they are ‘assisting’. Sundry Crop Costs: o Bale twine/net o Crop cover o Soil tests. N.B. Vermin control and grain store fumigants are recorded later under the Property Cluster. Agronomy costs. Some agronomists include their fees in spray costs. Non-benchmarked crops variable costs There is a column at the end of the spreadsheet to record variable costs for nonbenchmarked crops. This may be useful if there is a need to apportion total farm variable costs from a farm accounting system. Completing the Variable Costs spreadsheet The spreadsheet totals the recorded entries into costs per crop in the columns and also records the total cost of each commodity from the spreadsheet rows for the farm. There is a summary page on the spreadsheet that can be viewed to check data that has been recorded. It can be found by clicking the ‘Summary’ tab. Occasionally, when opening the spreadsheet the summary tab sheet appears first. Simply click the ‘Variable Costs’ tab to start your recording + CropBench Website user guide – October 2014 v.1.4 18 Once the variable costs data has all been recorded onto the Excel spreadsheet, you will need to upload the spreadsheet to the Remember the mouse CropBench+ website. This is done by clicking the upload icon in the hover helps for guidance top left hand corner of the Variable Costs window of the spreadsheet. When this is done, a window appears on the screen as shown below. Your username will already be supplied but you will be required to type in your password to proceed to upload the data. Once this is done, click the ‘Upload Values’ icon. The system will take a few seconds to upload the data. When completed, another window appears. To proceed, click the OK icon. You will then be able to close the spreadsheet by clicking the red close icon in the top right corner of the sheet. The system will then take you back to the Variable Costs Cluster page. In order to complete the task you will need to click on the ‘Reload after Calculator’ button so that the data populates and updates the webpage with the data. If you are satisfied that the data is correctly uploaded, click the ‘Save’ button. + CropBench Website user guide – October 2014 v.1.4 19 Labour Costs Cluster The Labour Cost Calculator records all the labour costs attributed to the benchmarked crops and is divided between sections for full-time, part-time and family/proprietor labour. Full-time labour Record the total cost of wages and salaries for all full-time employees including pension contributions and employers PAYE and NI contributions Cost of in-kind benefits to full-time employees. Includes costs such as market rent, council tax and water. Please note, an Arable Business Group may choose not to apply opportunity costs for rental values, if this is the case, use the Notes section to confirm this The program then asks what percentage of the total full-time labour cost should be attributed to the benchmarked crops. An employee may spend 25% of their time on another enterprise on the farm such as a sheep flock, for example. A farmer will probably not have specific records of this but will have a general view regarding time allocation for various farm tasks. Part-time labour The same criterion applies for part-time labour as well and should be entered as such. Employed labour full-time equivalents This question asks you to enter the number of full-time equivalents (full-time and part-time combined) that are allocated to the benchmarked crops. For example, if there are two full-time workers that work 75% of their time on the benchmarked crops, that would be 2 x 0.75 = 1.5 FTE (Full-Time Equivalent). Then, if there was a part-time worker who effectively worked half time on the farm (O.5 FTE) but only worked 50% of that time on the benchmarked crops, that would be 0.5 x 0.5 = 0.25 FTE . Therefore, in total 1.5 + 0.25 = 1.75 FTE on benchmarked crops and recorded. Family or proprietor unpaid labour The same calculation is carried out to attain the number of Full-Time Equivalent labour units for family labour. This will have to be gleaned from the farmers’ general view of the amount of work time that is spent on each enterprise, from preparing a field to harvest and eventual sale of crop. Value for one full-time family labour unit This is a financial value a farmer would like to assign to a full-time equivalent as ‘reward for labour’. This figure will then be multiplied by the number of full-time equivalents recorded in the field above to arrive at a cost of family/proprietor labour for benchmarked crops. By entering a ZERO in this field, the program will automatically default to £30,000/year per FTE. This is only a guide. If you are part of an Arable Business Group you will need to have a discussion as to what the group considers to be a fair rate of return for work done on the Arable Enterprises. N.B. An explanation of how labour and machinery costs are apportioned across benchmarked enterprises and how this can be changed is included in the Appendix. + CropBench Website user guide – October 2014 v.1.4 20 Machinery Cluster On entering the machinery cluster section you will notice that there is an Excel calculator similar to that found in the Variable Costs Cluster. The procedure for opening and uploading this spreadsheet calculator is exactly the same. Please refer to the Variable Costs section for instructions on how to do this. As in the previous spreadsheet, only grey shaded fields can be changed. Use of this calculator is essential in order to correctly transfer the weighting factors across. Weighting factors and their use in machinery and labour cost allocations is covered in the appendix section. On opening the spreadsheet you will be presented with the view below. This spreadsheet is pre-populated with typical equipment used on an arable farm. This list is not exhaustive and you can delete or add machines to this list, as necessary. It may be useful to record specific details of machines here (make, model, etc.) to help differentiate between them. If you scroll down through the spreadsheet, you will notice that there are two separate sections. This is to differentiate self-propelled machines and gives the opportunity to set a different depreciation rate for this category. The spreadsheet suggests 15% and 18% depreciation respectively but this can be changed easily (see below). This should be discussed in your Arable Business Group prior to upload if a different % is to be used if you are benchmarking within a group. Depreciation rates for each machine category are set here. They can be adjusted if necessary + CropBench Website user guide – October 2014 v.1.4 21 Grain and harvest equipment Record equipment here which is mobile (ie can be easily transported about). Do not include fixed store augers and machinery here, as this is recorded in the buildings section. The Second-hand value is the value (£) at which the machine is worth were you to sell or purchase the machine on the open market. CropBench+ values and depreciates machinery from the second-hand value of the machine at the start of the benchmarked year. If you have more than one of a specific item, eg grain trailers, you can either value them all together as a group or decide to list them separately. However, be aware that there is a limited number of lines available in each section for machines. Purchases this year (£) Add the value of any additions to machinery purchased during the year. Sales this year (£) Include the value of any machines sold. If you are purchasing a replacement machine, then include the second-hand value of the original machine at the start of the year. Include the purchase price of the replacement and the sale price of the outgoing machine. See example below for a baler. If you sold a machine in a year and purchased a different machine to a higher specification, then you may decide to include the sale price in the original machine row and include the new machine in a new row. Percentage allocated to benchmarked crops Record here the percentage of time the machines are used for the benchmarked crop enterprises. This will vary from farm to farm, for example: Machines may be used for other crop enterprises not being benchmarked Machines may be used for off farm contracting Machines may be used for other farm enterprises such as livestock operations. It may be difficult to ascertain a specific allocation of percentages for individual machines but most farmers will have a good idea of how they are used. Depreciation rate This is recorded and changed as described above. Arable Business Groups may decide to set their depreciation rates as a group decision. + CropBench Website user guide – October 2014 v.1.4 22 When you have added all the machines owned and used for the benchmarked crops you can then upload the data back onto the CropBench+ website. N.B. An explanation of how labour and machinery costs are apportioned across benchmarked enterprises and how this can be changed is included in the Appendix. Second year uploads of machinery calculator The machinery calculator (as for all of the calculators) does not retain data for subsequent years and so will have to be completed from scratch again. However, the machinery calculator data for the previous year’s CropBench+ can be retrieved by the following method: 1. 2. 3. 4. 5. 6. 7. Save your work before proceeding with the next part. Go to the top right hand of the screen and click on the Harvest year box. Click to open the drop-down box, highlight and choose the previous. This box will pop up. Click on ‘Leave this page’ and you will now be in the previous year’s CropBench+ information. Be very careful not to change any data. Open up the calculator for that year, where you can then review, copy, manually record or print the machinery valuation. You then need to come out of the spreadsheet by either uploading it back onto the website, saving it in the usual way or, more simply, clicking the cross in the top right hand corner of the spreadsheet and clicking ‘Don’t save’ in the pop-up box. Come back out of that harvest year the same way as you entered it and go back to the year you are working on. Open the machinery calculator and type in the information from the previous year, updating as necessary. Completing the Machinery Cost cluster When you have uploaded the machinery calculator back onto the website, you will notice that the top and lower parts of the webpage have been populated with the uploaded depreciation figures. Remember the mouse hover helps for guidance + CropBench Website user guide – October 2014 v.1.4 23 Proceed to complete this Cluster with the following information: Cost of machinery equipment and spares Record the total amount spent on machinery and spares, including costs for 4x4s, etc. Then, in the next field, allocate an amount in £ which you attribute to benchmarked crops. Remember to omit costs attributed to non-benchmarked crops, other farm enterprises and domestic costs, as CropBench+ automatically calculates and shows the non-benchmarked total amount. Cost of machinery and equipment hire and leasing This is asking you to record costs of machinery hire or leasing without operators, for example, temporary hire of tractor or machine for harvest or crop establishment. Attribute £ cost to benchmarked crops as before. Any machines that are supplied with an operator should be included in the contracting cost section. Cost of crop-specific contracting This section is for recording crop-specific contracting costs. The webpage will be prepopulated with the benchmarked crops. Record any crop-specific contract costs. For example: Contract cost for rape swathing Contract baling of barley straw when all other crop straw is incorporated. Costs of general contracting Record all contracting costs, do not include specific crop contracting, mole ploughing, land drainage work or lime spreading, as these are all dealt with elsewhere. Costs of electricity Record all costs for electricity used. Attribute costs to benchmarked crops. Consider electricity use for grain conveyors, elevators, augurs, fans, workshop and office and general lighting. Costs of fuel for tractors, combines and other farm vehicles (4x4s, etc.) Record costs of derv, gas oil, petrol attributed to tractors, combines, 4x4s, quads, etc. Costs of fuel for grain dryers Record fuel cost for grain drying, LPG, kerosene, gas oil, etc. Costs of grain storage Record all costs attributed to third party grain storage, drying and cleaning here. Do not include capital costs or share purchase to a cooperative grain store, as these should be recorded in the property section. Other farm vehicle costs Record costs here such as MOT, vehicle excise duty, leasing, etc. When all of these items have been recorded, remember to + CropBench Website user guide – October 2014 v.1.4 24 your work. Property Cluster This section also has an Excel calculator. To use it, go through the same procedure and methodology as shown before in the variable costs section. When first entering the spreadsheet, you will notice a box with the harvest year recorded. Make sure the harvest year recorded concurs with the year in question, if not, change to the correct year. After checking this, look down the spread sheet and you will see that the first section requires you to enter details of the buildings and structures on your farm that are used for the benchmarked crops. This has been divided into two sections: Buildings that are 0-20 years old depreciated at 5%/year Buildings 20-40 years old depreciated at 2.5%/year. These building costs should include costs of fixed equipment inside them, such as grain storage bins, fixed augurs, conveyors and dryers, etc. List all the relevant buildings in the appropriate sections with details regarding the building construction costs and age. Note If you do not know the exact age or the original cost of construction, then you can quite effectively work the calculator backwards: Record your best estimate of the age of structure Then estimate what the costs would be to construct a similar size structure at today’s prices Enter a lower figure than your estimate into the ‘Cost at time of building’ field and take note of the subsequent result in the linked green ‘Estimated current rebuilding cost (£)’ field Adjust the figure in the ‘Cost at time of building’ box until it concurs with your present day build cost estimate. + CropBench Website user guide – October 2014 v.1.4 25 Value of works this year (£) Record any capital building works carried out in the benchmark year to this structure. This would include new extensions or refitting. Please note that repairs to buildings should not be included here. Percentage use by benchmarked crops Enter a percentage use by benchmarked crops. Lime applications As lime applications are often carried out on 3+ year application cycle, CropBench+ requires the recording of the cost of lime applications in the last 3 years. These are then depreciated at 33% a year. Please fill in the details in the appropriate boxes. See example below. Mole ploughing Similarly, record any mole ploughing operations that have been carried out by contractors in the past 7 years. These will then be deprecated by 15%/year. See example below. When you have completed the calculator spreadsheet, upload it to the website. The top section of the property cluster will then be populated with data. Then proceed to the Property Costs. Property repairs Record costs of property repairs to buildings and structures on the farm and attribute accordingly to the benchmarked crops. General farm maintenance Record costs such as hedging, ditching, hedge cutting, drainage repairs and fencing and attribute accordingly to benchmarked crops. + CropBench Website user guide – October 2014 v.1.4 26 Pest control and grain store fumigants Record all costs associated with pest control and grain store fumigants and attribute accordingly to benchmarked crops. Water costs Record all costs associated with water usage for the farm. Include water authority and/or internal drainage board fees. Also include farm borehole maintenance costs. Rent and finance costs Record all actual rent and finance charges to the farm and benchmarked crops. IMPORTANT NOTE Finance and rent costs will only be reported in an individual farm CropBench+ report. They will not be used or referred to in any group or regional reports unless specifically agreed and requested by all members of an Arable Business Group. Rent Cost Record rent costs for land under either AHA or FBT tenancy. Finance Costs If you do not wish to disclose or include finance costs in CropBench+, leave these boxes blank and imputed costs will be calculated. Overdraft: Record overdraft interest charges and apportion a part to allocate to the benchmarked crops Loan interest: Record loan interest allocated to benchmarked and to nonbenchmarked crops and other farm business enterprises HP Interest: Allocate HP interest charges to benchmarked crops and then allocate non-benchmarked crops and other farm business enterprises. For example, if the HP interest is for a tractor or other machine purchase, then refer back to the machinery calculator to ascertain the percentage usage amount attributed to the benchmarked crops Bank charges and fees: Allocate bank interest charges to benchmarked crops and then allocate non-benchmarked crops and other farm business enterprises. When all of these items have been recorded, remember to your work Remember you can use the Check data facility in each cluster to check whether the data uploaded falls within parameters that you expect for the crop. + CropBench Website user guide – October 2014 v.1.4 27 Overheads Cluster The final cluster is for recording general overheads for the business. Again, each item is divided into cost allocation for the benchmarked crops and then any non-benchmarked crops, other business enterprises or private domestic costs. Remember the mouse hover helps for guidance Telephone Record all telephone costs, including landline and broadband rental charges, landline and mobile phone charges. Remember to include the cost for any private and domestic use in the costs to other crops and enterprises section. Farm subscription costs Record all farm and membership subscription fees, for example: NFU, TFA and CLA subscriptions Farming journals Machinery rings and buying group fees Agricultural societies Research organisations GPS Subscriptions BASIS and NRoSO fees Farm Assurance fees. Business and office costs Record business and office costs, for example: Postage and stationery Staff training Waste disposal costs. Accountancy Record business costs associated with accountancy and farm consultancy (excluding agronomy costs) and secretarial support for bookkeeping. Insurance costs Record insurances costs, for example: Buildings Public liability Machinery and vehicles (exclude private motor vehicles) Crop and materials in store insurances. When all of these items have been recorded, remember to your work When you have completed all the clusters of CropBench+, it is a good idea to check over your work again but using the Check data facility. When you are satisfied with your uploaded data, you can proceed to the next stage. + CropBench Website user guide – October 2014 v.1.4 28 Validation HGCA provides assistance for uploading CropBench+ and a validation service to all HGCA levy payers who fulfil the following criteria: The farm business is involved with an HGCA linked Arable Business Group or HGCA Monitor Farm Group that has agreed to use the CropBench+ service. The validation service can be operated in one of two ways. 1. CropBench+ data is collected and uploaded by HGCA Regional Managers or one of the Regional Benchmarking Officers. They then electronically send the data off for a validation check by a trained validator. The validator checks the data to see if there are any obvious errors in the upload and checks the information provided is within normal parameters. Any queries regarding the information provided are either answered by the HGCA Regional Manager/Officer concerned. Occasionally, the Manager or Officer will refer the query back to the farm for clarification. When the account is deemed to be correct, it is approved and the farmer is informed that the data has been validated and the reports are available on the website. 2. A farmer in an Arable Business Group may decide that they would like to upload their own data onto Cropbench+. In this case, the HGCA Regional Manager will inform the Cropbench+ administrator that the farmer is part of an agreed benchmarking group. When the farmer has completed their data upload, they inform the CropBench+ administrator that it has been uploaded and is ready for validation. This is done by clicking on the button on the Data Entry page. The HGCA administrator informs a validator, who will then email any queries regarding the uploaded dataset directly to the farmer. + CropBench Website user guide – October 2014 v.1.4 29 Farmers using CropBench+ who are not part of an Arable Business Group HGCA welcomes and encourages all UK arable farmers and farm consultants to register and upload data onto CropBench+ and is pleased to offer assistance by telephone for CropBench+ usage queries. Please refer to the appendix for telephone and email contact to your Regional Manager or Regional Benchmarking Officer. Reports Once you are satisfied that your data is correct (and it has been validated, if applicable), you can then proceed to the Report section. The Report section offers the user great flexibility in the choices of information able to be accessed. It also enables the opportunity to: View the report on the screen Download and print out as a PDF-style report Download as an Excel spreadsheet for further investigation. Simple or Advanced On opening the Reports section, you will notice at the top of the screen there is an option to select Simple Criteria or Advanced Criteria. The default for the program is set at Simple Criteria and this manual will concentrate on those. The Advanced Criteria will allow you to drill further down to more specific areas of the farm enterprises. IMPORTANT NOTE CropBench+ farm data will be uploaded annually each year after harvest costs and results are known (September onwards). As the autumn and winter period, progress, greater numbers of farms will be added to the dataset. Therefore, if you require a comparison of your results with regional average, then it needs to be noted that these regional averages will vary over time as further farm datasets are added. The more datasets that are added, then the more robust a sample will be. It also needs to be noted that if you are comparing datasets on the more advanced criteria, then there will invariably be fewer datasets which will meet a more rigorous criteria. The system requires a minimum of six farms for comparative purposes. Report Options CropBench+ will report results per individual crop enterprise. Therefore, the first choice that you will have to make is the crop to report on. Use the drop-down arrows to select a crop type. The screen, if applicable, may then refresh at this stage to show the different enterprises within the crop type. Select and click on the crops that you would like to be reported. You can choose more than one to compare alongside each other. You can then select the report type, which can be either a summary or a more detailed report. + CropBench Website user guide – October 2014 v.1.4 30 Comparison You will then be able to select three more options: Benchmark No Comparison: Will be your individual farm report with no comparison. It will include your actual rent and finance information as entered in your CropBench+ upload Report to group: Will provide a comparison with your Arable Business Group. To be able to get this report you will have previously registered as being a member of an HGCA linked Arable Business Group and will have agreed confidentiality regarding the results. This report will show group averages against your results Compare to region: Will provide a comparison for your farm across the whole country (Any) or compare with a specific region of your choice. The results will include imputed figures for rent, finance and family labour, rather than using actual figures. Show values You will then need to select values: Per enterprise (as entered). This will show results for the whole enterprise as uploaded Per hectare Per tonne. Ranked by This option will give you a choice to rank the criteria either by Net Margin or Total Cost of Production when comparing with Group or regional data. The top farms are those with the best net margin or lowest cost of production but are not necessarily the best at everything as you view the report. Region You can choose to compare with all regions or select a specific region. Once you are satisfied with the selection of criteria, click on the + CropBench Website user guide – October 2014 v.1.4 31 icon. You will then be taken to the report screen. Here, you will be able to scroll down and view your report. If required, you can download a PDF or Excel copy by clicking on the appropriate place. There is also a link to ‘Your CropBench+ Reports Explained’. If you have uploaded data over previous years onto CropBench+, then the year-on-year comparison can be viewed. If you wish to select a fresh set of criteria for a different report, simply click on the ‘Report’ icon on the top green bar and select criteria as necessary. Experiment with different criteria options to achieve the reports that work best for your requirements. + CropBench Website user guide – October 2014 v.1.4 32 Appendix Explanation of imputed costs Where imputed costs are used, they are calculated like this: Imputed rent CropBench+ uses a notional rental value of £300/hectare (£121/acre). Therefore, the calculation would be: Benchmarked crop area (ha) x £300. Imputed family labour The default financial figure for a Full-Time Equivalent (FTE) family member is £30,000/year. Therefore, the calculation would be: Number of FTE family members x £30,000. Imputed finance Imputed finance is calculated at an estimate of a midway point between what an average interest rate would be for loans, bank overdraft, etc. and what could be achieved if the amount of money tied up in the business was cashed in and invested elsewhere. Currently, CropBench+ is using a imputed finance cost of 4%. In CropBench+, this is calculated by adding the following figures: Total Variable Costs + (Total Fixed Costs - Depreciation) + Machinery Valuation + Machinery net value of purchases and sales + Buildings valuation + Building improvements + Lime costs for this year + Mole plough costs for this year. The resulting figure from that calculation is then multiplied by 4% to reach an imputed farm finance cost. This figure is then divided again to show a finance cost per crop tonne or per crop hectare. PLEASE NOTE CropBench+ only includes imputed costs in the ‘Compare for Region’ reports. Default order of crops in CropBench+ The crop enterprises are always shown in a specific crop order later in the process and it is advisable to record them in the same order on the Data Entry Booklet (DEB) to avoid confusion. Whichever order they are uploaded here, the default remains the same. The order is: Winter Wheat (milling then feed), Winter Barley (malting then feed), Oats (winter then spring), OSR, Beans, Linseed, Grain maize, Other crops. + CropBench Website user guide – October 2014 v.1.4 33 Items for ABGs to consider prior to submitting data Useful information to make groups aware of at the start A – Rent and Finance Data such as actual rents paid and actual finance costs will not be used in group reports and meetings. Figures reported at these meetings will be ‘Before rent and finance’ for confidentiality reasons. Individual benchmark reports which are for each grower’s own private use can contain actual rent and finance costs and we should encourage them to submit such data unless they object to disclosing this information to us. By including these rent and finance costs, CropBench+ will report their cost of production as accurately as possible. If the grower downloads a report with regional comparisons, this will contain an imputed rent and finance figure rather than the actual costs. B – Contract Farming Note: For HGCA Regional Officers and Managers Arable Crops that are being benchmarked must either be: On land that is owned by the farmer On land that is rented by the farmer via an AHA or FBT. Cropping areas where there is a contract farming agreement should only be benchmarked where the landowner has agreed and signed a Data Authorisation Form. When this has been completed, the contract farmed land areas should either be: Benchmarked separately using a different registration email and password Benchmarked on the basis of the total area farmed, as if it were a single unit. The HGCA Regional Manager/Officer and grower should discuss which benchmarking option is most appropriate and record the details of this in the ‘Notes’ section. + CropBench Website user guide – October 2014 v.1.4 34 Data questions and options for the group 1. Failed crops If you have a crop failure and a field is re-drilled with the same or a different crop, then you can either decide to: Add a failed crop as an enterprise in ‘Other crop’ and name it as such, eg failed W Wheat. If the field is re-drilled with a subsequent crop, the land area will be double counted. In that case, write a comment in the notes section to that effect. Please note that, if this method is adopted, you will need to adjust the weighting factor for the labour and machinery to account for the work done. Look in the CropBench+ Manual Appendix to find out how to do this Add a failed crop as a Crop as an ‘other crop’ as above, but with a ZERO Ha/Ac area unless the land was subsequently left fallow. (This is to prevent the land area being counted twice.) Note: This method would not allot fixed costs associated with the failed crop Ignore altogether. 2. Entering crop values and other enterprise income Options: a. The Group needs to decide rules for muck/straw transfers between enterprises on farm. Will straw be ‘sold’ to livestock enterprises and will muck be ‘bought’ from livestock enterprises? b. Would the group like to enter grain values and crop output? If not, then do not enter values for other enterprise income such as straw either 3. Home saved seed, should a value be placed on this and entered as a seed cost, along with the cost of cleaning and dressing, as appropriate? 4. If you are looking to benchmark the ‘other crop’ within your group, it is recommended you agree which crop is Crop 1, Crop 2, etc. prior to uploading your data. 5. How should adjuvants be listed? Options: a. List the cost in ‘Other’ b. Include the cost with the principle spray that the adjuvant has been included with. 6. Value of family labour Options: a. Should it be valued at a flat rate per family member across the whole group? b. Allow each farm business to apply their own specific values to each business or family member 7. Machinery depreciation rates The group can adjust as they prefer. Default rates within the calculator are 18% for selfpropelled machinery and 15% for everything else. + CropBench Website user guide – October 2014 v.1.4 35 Weighting factor Different arable crops take varying degrees of both labour time and machinery for crop establishment, fertilising and spraying programme, as well as harvesting and drying. Therefore, attributing machinery and labour by dividing costs according to area of crop enterprise grown would not give a fair reflection of individual crop costs. Therefore, a system of weighting factors has been built into the CropBench+ program to allocate the costs more accurately. These weighting factors can be kept at the default values which have been set within the program or you can make a manual adjustment to suit your individual farm or farming year circumstances. Once you have split out the proportion of machinery and labour costs that do not apply to the benchmarked crops, the remainder can then be allocated between the benchmarked crops by using the weighting factors. The programme contains default weighting factors for each crop type but users can adjust them to suit their own particular circumstances in any one year. The weighting factors should reflect the intensity of use of labour and machinery inputs across the different crops. You need to consider the methods of crop establishment, number of passes with fertilising or spraying equipment, ease of harvesting and whether the grain needed significant cleaning, drying or handling before sale. A weighting factor of one will mean that the crop carries half the costs per hectare of a crop with a factor of two. An example: 50 acres of wheat allocated a weighting factor of 1 80 acres of oilseed rape allocated a weighting factor of 0.8 50 x 1 = 50 80 x 0.8 = 64 Total = 114 Wheat share of costs = 50/114 x 100 = 43.9% Oilseed rape share of costs = 64/114 x 100 = 56.1% Therefore, in this case, 43.9% of the labour and machinery costs (and depreciation) would be attributed to the wheat enterprise and 56.1% to the oilseed rape. + CropBench Website user guide – October 2014 v.1.4 36 Changing the weighting factor for labour and machinery The table listing the default weighting factors for the various enterprises is located in the Machinery and Power Excel spreadsheet. The default weighting factor table, together with the instructions in the grey text box below, can be found on the right hand side of the spreadsheet. 1. Machinery and labour costs are apportioned between benchmarked crops using weighting factors. Default values for each crop type can be seen in the table below 2. Users can enter their own weighting factors in the grey boxes above or leave blank for default values to be used 3. The weighting factors should take into account the intensity of labour and machinery use between crops. Consider establishment methods, number of machine passes and grain drying/cleaning/storage 4. A weighting factor of 1 will allocate twice the cost per hectare of a weighting factor of 0.5 Default Index Table Crop First Winter Feed Wheat Second Winter Feed Wheat Spring Feed Wheat Winter Milling Wheat Spring Milling Wheat Winter Feed Barley Spring Feed Barley Winter Malting Barley Spring Malting Barley Winter Oats Spring Oats Winter Oilseed Rape Spring Oilseed Rape Winter Beans Spring Beans Peas Linseed Grain Maize Other Crop This Default Index Table has been devised by the HGCA Regional Managers. There is an option which is for ‘Other Crop 1, 2,3 etc. These all have a default factor of 1 and can each be changed separately . Please note that the crop names which you will have attributed to the various ‘Other Crops’ entered in the Enterprises section will not be listed here so you will have to make a note as to which ‘Other Crop’ is being referred to. Index 1 1 0.7 1 0.7 1 0.7 1 0.7 1 0.7 0.7 0.5 0.7 0.7 0.7 0.5 1 1 Failed crops Failed crops will be listed as ‘Other Crop’. As there will be less work carried out for failed crop, a normal weighting of 1 would be too high. In this case, it may sensible to reduce the weighting factor to 0.3 or 0.4. + CropBench Website user guide – October 2014 v.1.4 37 Other useful links HGCA website Cropbench+ Data Protection Policy HGCA Region Map Data Authorisation Form Cropbench+ Data Entry Booklet The booklet is used by HGCA’s Regional Managers and Regional Benchmarking Officers to collect data on farms. It is a useful method of collating information required by CropBench+ and we recommend that farmers download and print this booklet to assist them in CropBench+. Contact Us To contact a member of the team, please use the details below. Name Title Telephone Email David Pett Interim Lead Regional Officer South 07813 454537 [email protected] Richard Meredith Regional Officer West 07717 493015 [email protected] Tina Swainston Regional Officer North 07717 496201 [email protected] Holly Howsam Regional Officer East TBC TBC Doreen Anderson Validator 07901 116454 [email protected] Debby Round Administrator 024 7647 8708 [email protected] Richard Laverick HGCA Business Development Manager 024 7647 8678 [email protected] Philip Dolbear HGCA Regional Manager – South & South West 07964 255614 [email protected] Harry Henderson HGCA Regional Manager – North 07964 974465 [email protected] Tim Isaac HGCA Regional Manager – East 07964 975078 [email protected] Gavin Dick HGCA Manager – Scotland 07972 636679 [email protected] While the Agriculture and Horticulture Development Board, operating through its HGCA division, seeks to ensure that the information contained within this document is accurate at the time of printing, no warranty is given in respect thereof and, to the maximum extent permitted by law, the Agriculture and Horticulture Development Board accepts no liability for loss, damage or injury howsoever caused (including that caused by negligence) or suffered directly or indirectly in relation to information and opinions contained in or omitted from this document. © Agriculture and Horticulture Development Board 2014. No part of this publication may be reproduced in any material form (including by photocopy or storage in any medium by electronic means) or any copy or adaptation stored, published or distributed (by physical, electronic or other means) without the prior permission in writing of the Agriculture and Horticulture Development Board, other than by reproduction in an unmodified form for the sole purpose of use as an information resource when the Agriculture and Horticulture Development Board is clearly acknowledged as the source, or in accordance with the provisions of the Copyright, Designs and Patents Act 1988. All rights reserved. + CropBench Website user guide – October 2014 v.1.4 38