1
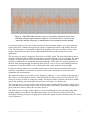
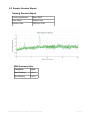
YORK BIOFEEDBACK
w w w. yo r k - b io f e e d b a c k . co . u k
© Glyn Blackett
Basic EMG (Muscle Tension)
Software Application User Guide
Table of Contents
1 Introduction.......................................................................................................2
2 Launching the Application.................................................................................3
2.1 Hardware Set-up...................................................................................3
3 About Electromyography (EMG)........................................................................4
3.1 What Is EMG?......................................................................................4
3.2 Working With EMG Biofeedback...........................................................6
3.2.1 Wrist Placement........................................................................6
3.2.2 Forehead Placement................................................................7
4 User Interface...................................................................................................8
4.1 Standard Controls (Start / Stop, etc.)....................................................8
4.2 Short Term Displays and Controls.........................................................9
4.3 Spectral Display..................................................................................10
4.4 Long Term Display and Controls.........................................................10
4.5 Threshold Display and Controls..........................................................11
4.6 Audio Feedback Controls....................................................................12
5 Session Reports..............................................................................................13
5.1 Report Options....................................................................................13
5.2 Adding Notes to a Report....................................................................13
5.3 Sample Session Report......................................................................14
6 Application Report...........................................................................................15
6.1 Report Options....................................................................................15
Basic EMG Application User Guide, copyright Glyn Blackett
page 1
1 Introduction
This guide introduces the Basic Electromyography (EMG) biofeedback application, part of York
Biofeedback's Mind-Body Training Tools suite. This set of applications is designed to develop skills
in mind-body awareness and self-regulation, particularly in a context of mindfulness and meditation
practice.
The guide has two purposes: firstly to explain what EMG actually is, and secondly to teach you how
to use the software – though it is more of a reference than a tutorial. Other training material is
available on the York Biofeedback website (address above).
EMG is an electrical correlate of muscle tension. It is easy to appreciate that the state of muscle
tension is reflective of your subjective state of mind. EMG biofeedback is a means of developing
greater sensitivity to this mind-body relationship, and of transforming your state of mind by
changing the underlying physiology.
EMG is measured using sensors in contact with the skin. By selecting the placement of the sensors
we can choose to monitor different (sets of) muscles. This guide discusses the most commonly used
placements.
In keeping with others in the suite, the Basic EMG application was designed to support your aims,
not to supplant them. Achieving low muscle tension is not necessarily the most important thing.
Biofeedback should enhance or expand your subjective awareness rather than detract from it.
Note that other applications in the suite (namely EMG & Breathing, and Capnometry with EMG)
contain much of the functionality of the Basic EMG application, and extend it by also monitoring
breathing, and by relating the EMG feedback to breathing. They are covered in a separate user
guides.
The guide assumes that you have read the Software Installation and Set-up Guide, and therefore
know how to start the application.
The application works with several devices. For an up to date list of supported hardware, please see
the York Biofeedback website.
Basic EMG Application User Guide, copyright Glyn Blackett
page 2
2 Launching the Application
Figure 1 above shows the Muscle Tension (EMG) tab of the Platform program. Press the button
labelled 1 to launch the application. Make sure you have your BioEra licence key (dongle) inserted
into a USB socket. After a few seconds a new window will appear on your screen.
2.1 Hardware Set-up
The physical aspects of hardware set-up (how to connect and use your sensors,, how to check
impedances, etc.) are dependent upon the type of amplifier you are using, and are covered in a
separate document (Hardware Set-up Guide).
Before you start the application you configure the device set-up
options, accessible by clicking a button in the Set-up tab of the
Platform. In the dialog, select the type of amplifier (biofeedback
device) you are using, in the EMG source control. Note, all the
source settings are remembered the next time you start the
Platform. See the Installation and Set-up Guide for further details
of device set-up.
Figure 2 – amplifier status
One of the device options is 'Simulator'. In simulator mode, you
can learn how to use the software without the encumbrance of
sensors, leads etc. (The application simply uses recorded data as a source.)
Once you have started the application, you should see your device selection reflected in the device
status display in the top right corner of the main window (see figure 2). The lamp (shown as a red
square in figure 2) should change to green when you press the play button. If you do not see this
happen, it means that the application has not been able to establish a connection with your device.
Check it is plugged in and that the batteries are not flat.
For some devices, you'll see a button rather than just text. Pressing this button opens up a dialog
that allows you to adjust settings related to the device, such as COM port. The specifics depend on
the device – see the Hardware Set-up Guide for more details.
Basic EMG Application User Guide, copyright Glyn Blackett
page 3
3 About Electromyography (EMG)
3.1 What Is EMG?
As I've said in the introduction, EMG is an electrical correlate of muscle tension measured from the
skin. It's quite a complex measurement in some ways. For practical purposes all you need to know
is this: you attach three sensors to the skin. Two of these are known as the active sensors. The
software comes up with a number that reflects the muscle tension between the two active sensors.
This number is changing from moment to moment – if you tighten up the number gets bigger, and if
you relax it gets smaller.
The active sensors are the white and black cables. See the Hardware Set-up Guide for more details.
The rest of this section explains how this number is derived. If you are new to the application you
can skip over it and return to it later if you feel you need a fuller understanding.
EMG is actually an oscillating voltage. A voltage is always a difference (in electric potential)
between two points. In our case the two points are the active sensors. The voltage comes not from
muscle cells themselves but from the electrical impulses travelling in the nerves that stimulate the
muscles.
The oscillations are quite fast – up to several hundred cycles per second (or Hertz). Figures 3 and 4
show what a “raw” EMG trace looks like. The amplitude of this signal (or size in the vertical
dimension) is what correlates to muscle tension.
Figure 3 – Raw EMG data. This chart show 10 seconds' worth of data. The voltage
is varying so quickly that at this scale the cycles merge into one another. The
amplitude, or height in the vertical direction, gives an indication of the muscle
tension – in this case the tension was relaxed after around 6.5 seconds.
Basic EMG Application User Guide, copyright Glyn Blackett
page 4
Figure 4 – Raw EMG data. At a time scale of 1 second the individual cycles of the
oscillating voltage begin to become apparent. If we could zoom in even more we
would see that the frequency (or wavelength) is not constant but quite variable.
For practical purposes we aren't really interested in the oscillation. Rather, we want to quantify
muscle tension as a number that gets larger when we tighten the muscles and smaller when we
relax. The following is a (somewhat technical) description of the steps needed to derive such a
number. Remember you don't need to understand the details to make practical use of the
application.
The first step is to apply a frequency filter to the raw EMG signal. The idea behind this is that a
complex oscillation such as EMG does not have a constant frequency (or wavelength). We could
say that it is made up lots of waves or different frequency. Applying a filter means that certain
frequency components are blocked from passing through, in the same way as large particles are
blocked from passing through an ordinary filter (such as a sieve). In our case both high and low
frequencies are blocked (unlike a sieve which only blocks large particles from passing).
Frequency filtering allows us to exclude certain sources of interference (artefacts) that would
otherwise contaminate our measure of muscle tension, and it also helps us to in some sense
standardise the measurement.
The application offers you a choice of two frequency windows, i.e. two settings of the frequency
filter. One is a wide frequency band (10-400 Hz) while the other is narrower (100-200 Hz). See
section 4.2 below for how to change the setting. The narrow band is generally much more usable
practically speaking, and I anticipate that most users will only ever use that one.
The next step is to rectify the signal, which means to turn a reading which oscillates either side of
zero (and thus whose average is zero) into a set of positive-only values. It amounts to flipping all
parts of the trace that are below the zero line, above it.
The final step is to average out the signal so we get something that varies smoothly rather than
jumping rapidly up and down. The application allows you to choose the time period of this
averaging. Choosing a longer averaging period makes the signal smoother, but the trade-off is that it
is less responsive.
Basic EMG Application User Guide, copyright Glyn Blackett
page 5
3.2 Working With EMG Biofeedback
This section explains how EMG biofeedback is useful, particularly within a context of
mindfulness / meditation practice. It also discusses the two most common sensor placements and
their relative merits.
In biofeedback you learn to connect the external feedback to your internal (subjective) experience –
particularly bodily experience. Muscle tension offers a very useful window on the mind-body
connection: many of our muscles are directly consciously controllable, but on the other hand they
also respond quite automatically to emotions, thoughts and memories. Broadly speaking, we tend to
tighten up in response to emotions such as anxiety and anger – even very brief and subliminal
emotions. Any sense of emotional threat tends to cause us to literally brace ourselves, as though it
were a physical threat. 'Inner resistance' is a term I use for subtle forms of this. It means not wanting
some aspect of our current experience – for example a pain – to be within our awareness. Inner
resistance manifests as tension, as though we were attempting to hold the experience at arms length.
Learning to maintain soft relaxed musculature is a powerful strategy for maintaining open, calm and
expansive states of mind.
Relaxing muscle tension is often difficult because it's not necessarily easy to be aware of tension in
the first place – and also of the effects of your attempts to relax. Awareness is a prerequisite for
conscious control. EMG biofeedback helps us develop a much more sensitive awareness of the state
of our musculature, on the basis of which we can develop greater skill in relaxing muscles.
An important aspect of mindfulness practice is to keep the mind stably focused in the present
moment. If you've had any experience with mindfulness you'll know that the mind tends to wander
off. The practice of mindfulness is to keep returning to the object of concentration. The key is to
notice when the mind has wandered off. This is not easy for most people – it is common to spend
quite a few minutes at a time in distraction.
Biofeedback can help with mindfulness practice by flagging when we have become distracted – at
least insofar as distractions are manifested as subtle changes in the body's physiological state. In
other words it functions as a distraction detector. We can characterise different forms of distraction
– one useful distinction is between low-energy, slothful and sleepy states, versus high-energy,
agitated states. The latter may be emotionally arousing distractions such as anxious worrying or
resentment, or they may be forms of sensual craving, or they may be subtle urges to activity such as
restlessness, or planning what you're going to do later on. Whatever the case, this kind of highenergy distraction tends to manifest as higher muscle tension, meaning that EMG biofeedback is
useful at flagging this kind of state. By contrast low-energy distractions such as day-dreaming or
sleepiness don't create muscle tension.
Sensor location is a key decision in EMG biofeedback. Different placements can bring out different
aspects of the mind-body relationship. The two placements I commonly use are (i) wrist placement
and (ii) forehead placement.
3.2.1
Wrist Placement
Placing one active sensor on each wrist picks up tension in the arms, hands and shoulders –
especially the latter two. Also tension in the upper chest and neck has an influence. (The third
sensor or ground can go on either wrist. See the Hardware Set-up guide for more information.)
Emotional defensiveness, inner resistance and wariness can all subtly manifest as tightness in these
areas, mostly commonly around the shoulders, but also in the hands and any of the muscles detected
with this placement.
With the wrist to wrist placement, rhythmic patterns related to the breathing typically show up. This
Basic EMG Application User Guide, copyright Glyn Blackett
page 6
is because the shoulders and upper chest are often involved with breathing. Figure 6 shows an
example. This makes the wrist placement very useful for practising mindfulness of breathing. The
more the upper chest and shoulders are involved, the more prominently the rhythm shows up in the
EMG. Conversely relaxed abdominal breathing shows as a much smaller variation. This makes
sense because movements of the diaphragm and lower intercostal muscles, which are active in
abdominal breathing, are not really picked up picked up by this placement.
The breath is subtly reflective of our mental and emotional state. Chest-based breathing is
suggestive of the kind of emotionally defensive states I've alluded to, whereas abdominal breathing
is more open and calm. For many people, chest-based breathing has become an ingrained habit, but
one which can quite easily move towards more natural abdominal breathing with mindfulness
practice.
To get a meaningful measure, the arms should be loose and by the sides with the hands probably on
the lap. Holding the arms up or clenching the hands will give much higher readings. Fully relaxing
all these muscle groups will give an EMG reading of around 1 microvolt – but not much less. A
typical everyday state might give around 3-6 microvolts. Higher readings (10-20 microvolts) are
common and may reflect stress and emotional tension. (If you're using gel-free snaps – see the
Hardware Set-up Guide for more about this – bear in mind that the readings are less accurate so
interpret the numbers more loosely.)
3.2.2
Forehead Placement
All three sensors are placed on the forehead, with the ground in the middle. This placement picks up
tension from anywhere in the head, the jaw being an especially powerful contributor. Even the
tongue can contribute. However, breathing makes no significant contribution.
With this placement the numbers are generally smaller, compared to the wrist to wrist placement.
Fully relaxing all the muscles of the head will give a reading of around 0.5 microvolts, perhaps
slightly less. Everyday states are typically around 1-2 microvolts.
Again stress and emotions are likely to be reflected in higher tension at this placement. Facial
expression is a natural part of emotion. Even fleeting and barely-noticed emotions – so-called
micro-emotions – can be detected.
The forehead placement also throws useful light on thought processes. Inner dialogue seems to
involve subliminal use of the speech muscles – those in the jaw, lips and even the tongue. Activity
in these muscles is easily registered with the forehead placement. To an extent, fully relaxed facial
musculature is incompatible with maintaining inner dialogue.
Basic EMG Application User Guide, copyright Glyn Blackett
page 7
4 User Interface
1. Standard controls
2. Short-term display and controls
5. Threshold
display
4. Long-term display
3. Spectral display
6. Audio controls
Figure 5 – User Interface
Figure 5 above shows the user interface for the EMG application.
4.1 Standard Controls (Start / Stop, etc.)
A set of buttons – Play, Stop and Pause – are the same in all the applications in the suite. They
should be self-explanatory.
The 'Epoch' control sets the time period at which data is written to the session data file. This data
file is used to generate session reports, which are described in section 6 below. For the Basic EMG
application, only EMG data is written. Choosing a lower time period generates more data. The
setting also controls the level of averaging of the recorded data. For example, if you select 2
seconds, then the application will write to the session data file once every two seconds, the average
EMG over that two second period.
The button marked with a red asterisk is a simple event marker. You can use it to mark adventitious
happenings and changes in session conditions. It is particularly useful for coaches and therapists.
Events thus marked are represented in the long term chart (see section 4.4 below) by a vertical
white line. They are also recorded in the session data file and are shown in session report charts (as
dotted vertical lines) (see section 5).
Note that pressing the escape key during a session has the same effect as pressing the red asterisk
with your mouse (i.e. it is an alternative).
Basic EMG Application User Guide, copyright Glyn Blackett
page 8
4.2 Short Term Displays and Controls
1
2
3
4
Figure 6 – Short term display and controls
This chart shows EMG as it varies over the short term. You can see that in figure 6 there is a rhythm
in the left-most part of the trace. This is related to breathing.
The yellow dotted line is the threshold level – see section 4.5 below for more about this.
The combo boxes below the chart control how the EMG signal is processed and displayed.
Filter
Controls the frequency band from which the EMG measure is derived. See section 3.1
for further information. There are two options, 100-200 Hz and 10-400 Hz. The latter
may be considered a specialist application – for the vast majority of users the former
will suffice. If you're not sure what 'frequency band' means, simply select 100-200 Hz.
Note that the filter setting applies to all displays in the user interface, with the
exception of the spectral display (see section 4.3 below).
Average
Controls the level of smoothing of the EMG signal. With a shorter average you will
see all the fine-grained changes in muscle tension. With a longer average these are
smoothed out, and the signal will be slightly slower in responding to change.
For most users a setting of 1.0 or 2.0 seconds will be suitable.
Range
Sets the upper limit of the display. (The lower limit is always zero.) Select a larger
range if the trace appears to be off the top of the chart. (If you can't see the trace it
probably is off the top.) Select a lower range as you learn to reduce tension, so that the
display offers greater sensitivity (meaning that even subtle changes in muscle tension
can be seen).
Period
This controls the length of time it takes for the trace to traverse the whole chart from
right to left – or in other words the horizontal range.
Basic EMG Application User Guide, copyright Glyn Blackett
page 9
4.3 Spectral Display
Figure 7 – Spectral display
For the majority of users, this display (shown in figure 7 above) is not really relevant or useful, but
for those interested, the following is an explanation of what it does. It can of course be skipped
over.
As discussed in section 3.1 above, EMG in its raw form is a complex oscillation. It doesn't have a
single fixed frequency, but rather is a mixture of frequencies. We can use a mathematical method
called Fourier analysis or spectral analysis to decompose the complex EMG into component
frequencies. The spectral display shows the results of this analysis. In the chart, frequency varies
along the horizontal axis represents. The height of the graph at each point represents the size of the
contribution of that frequency.
The spectral display always shows the full frequency range up to 400 Hz, regardless of the setting
of the filter control (described in section 4.2 above).
One way this chart can be useful is in recognising electrical interference. You will see a prominent
bar at the mains frequency (50 Hz in the UK), and perhaps at multiples thereof (100 Hz, 150 Hz,
etc. – these are known as harmonics.)
4.4 Long Term Display and Controls
1
2
Figure 8 – Long term display and controls
The long-term display (figure 8) shows the variation of the EMG over a longer time scale (up to 30
minutes). The two combo boxes (1 and 2 in figure 8) control the horizontal and vertical ranges.
LT Period
Controls how long it takes the trace to traverse the whole chart from right to left.
Range
Controls the upper limit of the chart in the same way as the equivalent range control
does in the short term display.
Basic EMG Application User Guide, copyright Glyn Blackett
page 10
4.5 Threshold Display and Controls
The essence of threshold-based feedback is
that a discrete feedback event is triggered
whenever muscle tension exceeds some
limit. For example the feedback event could
be the playing of a sound file.
The threshold limit is shown and controlled
by the bar, labelled (5) in figure 9. To change
this limit simply click your mouse over the
bar, and drag it to the desired location.
The range of the bar graph is controlled by
the range combo control, described in
section 4.2 above. In other words, the bar
graph and the short term display, being
adjacent to each other, will always be
matched in terms of range.
The numeric display (6) shows the current
EMG, while (4) shows the setting of the
threshold bar.
The exact behaviour of the threshold-based
feedback depends upon the settings of three
controls (combos 1, 2 and 3 in figure 9).
(5)
(6)
(4)
(1)
(2)
(3)
(7)
(8)
Figure 9 – Threshold controls
Condition (1 in figure 9.) Feedback can be triggered when the EMG signal either goes above the
threshold (in which case the feedback functions as a warning that you have drifted
away from your desired state) or drops below (in which case the feedback serves as a
reward). Select '>' for the former and '<' for the latter.
Average
The threshold control has its own level of averaging, which works in just the same
way as the average control in the short term display (section 4.2). This was done in
order to offer the greatest flexibility in usage.
Duration
This control allows you to say that feedback should be triggered only if the threshold
condition is met for a certain period of time. This is a way of in effect, filtering out
discrete events of brief duration – for example if you swallow, or briefly move your
hand. In such cases the muscle tension may rise above the threshold limit but will
drop back below again very quickly, so that the feedback is not triggered. The control
sets the length of time needed to trigger feedback.
The lamp displays (7 and 8) allow you to discriminate: lamp 7 lights up as soon as the
signal crosses the threshold, while lamp 8 will only light up if the signal exceeds the
threshold continuously for the required duration.
Basic EMG Application User Guide, copyright Glyn Blackett
page 11
4.6 Audio Feedback Controls
(1)
(4)
(2)
(5)
(3)
(6)
Figure 10 – Audio feedback controls
There are three forms of audio feedback available – tone, midi and audio file. Each has an on/off
button, appearing as green triangles (labelled 1 in figure 10) but switching to red squares when the
feedback is turned on. Each also has an independent volume control (sliders labelled 2 in figure 10)
graded on a scale of 0-100.
Tone and midi feedback use a range parameter, which defines what EMG levels correspond to the
highest and lowest pitches available. A combo control (6 in figure 10) set this range.
Audio feedback also has a separate average control, to allow the greatest flexibility. This works just
like the average control of the short term display. In my experience tone feedback needs at least a
couple of seconds' worth of averaging applied, for aesthetic reasons.
The threshold level can be applied to tone and midi feedback, meaning that they play only when the
threshold condition is met. Check the controls labelled 3 in figure 10 to apply this feature.
Tone
A tone is played whose pitch varies continuously with the EMG level.
Midi
A musical note is played at regular intervals, whose pitch varies with the EMG
level.
Threshold
The meeting of the threshold condition triggers the sound of a bell. (The
application plays an audio file, named '1.wav' and located in the folder 'media' in
the EMG file location within the BioEra installation, i.e. generally speaking
C:\Program Files\BioEraPro\design\YBF\EMG).
You can have the application play sounds of your choice by simply substituting this
file with one of your own. For example you could record a message in your own
voice. There are lots of programs that you can use to do this, including some
freeware applications. Your recording needs to be saved in WAV format.
The value of using the threshold is that the feedback is generally less intrusive,
freeing you to focus on your direct experience. The feedback only comes in when
you've drifted out of your desired psychophysiological zone.
You can set some options for midi feedback, notably the instrument (piano by default) from the
Platform (i.e. before starting the application). See the Installation and Set-up Guide for further
details.
Basic EMG Application User Guide, copyright Glyn Blackett
page 12
5 Session Reports
The application records data so that you can generate a report for your sessions. The report contains
summary data and graphs showing the progression of the feedback parameter over the whole
session.
To generate and open a session report, click the button labelled 2 in figure 1. A dialog window
opens in which you can select various options (see figure 11).
The software creates the report in html format. It will be opened using your computer's default web
browser, e.g. Internet Explorer. (Note that a live internet connection is not needed.) The html file is
saved, so you can for example email it to someone. See the Installation and Set-up Guide for details
of file storage.
5.1 Report Options
Most of the options should be self-explanatory.
If you change your mind about options on seeing your report, you can regenerate the report by
clicking the report button (2 in figure 1), then checking 'Overwrite existing report'.
Setting a maximum EMG amplitude is a basic way of excluding “artefacts”, for example if you
changed your posture during the session. Data points exceeding the maximum value are excluded.
5.2 Adding Notes to a Report
You can choose to write some notes for your session report. Checking 'Add notes to report' (top
right of the dialog) allows you to do this.
You may wish to add notes after having first seen the report. In this case, simply click the button (2
in figure 1) again, and check the Add notes option. This will regenerate the report with your added
notes.
Basic EMG Application User Guide, copyright Glyn Blackett
page 13
5.3 Sample Session Report
Training Session Report
Training Application
Basic EMG
User Name
Default User
Session Date
28/03/12 22:01
EMG Summary Data
Parameter
Value
Max Reading
3.0 uV
Min Reading
0.8 uV
Basic EMG Application User Guide, copyright Glyn Blackett
page 14
6 Application Report
An application report summarises all the sessions for the currently selected user, in charts and a
table.
To generate and open an application report, click the button labelled 3 in figure 1. A dialog window
opens in which you can select various options (see figure 12).
As with session reports, the software creates the application report in html format. It will be opened
using your computer's default web browser, e.g. Internet Explorer. (Note that a live internet
connection is not needed.) The html file is saved, so you can for example email it to someone. See
the Installation and Set-up Guide for details of file storage.
6.1 Report Options
The application report options dialog is an adapted version of the session report options dialog.
Many of the options are the same, and should be self-explanatory. See section 5.1 above.
As with all of the application reports in the suite, there is a chart for each of the main parameters
tracked in the application – in the case of the Basic EMG application that means only EMG
amplitude. For each chart you can opt for line graphs for the maximum, minimum, mean and
standard deviation. The line graphs have one point per session.
Basic EMG Application User Guide, copyright Glyn Blackett
page 15