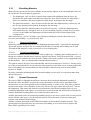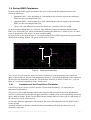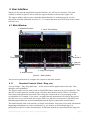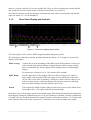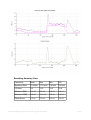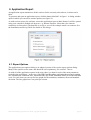
1
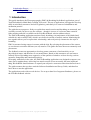
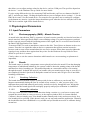
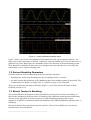
YORK BIOFEEDBACK
w w w. yo r k - b io f e e d b a c k . co . u k
© Glyn Blackett
EMG & Breathing
Software Application User Guide
Table of Contents
1 Introduction.......................................................................................................2
2 Launching the Application.................................................................................3
2.1 Hardware Set-up...................................................................................3
3 Physiological Parameters..................................................................................4
3.1 Input Parameters..................................................................................4
3.1.1 Electromyography (EMG) – Muscle Tension.............................4
3.1.2 Breath.......................................................................................4
3.1.2.1 Breathing Calibration...............................................................4
3.1.2.2 Manual Re-calibration.............................................................4
3.2 Derived Breathing Parameters..............................................................5
3.3 Muscle Tension in Breathing.................................................................5
3.3.1 Breathing Muscles....................................................................6
3.3.1.1 Abdominal Breathing...............................................................6
3.3.1.2 Chest-based Breathing...........................................................6
3.3.2 Sensor Placements...................................................................6
3.4 Derived EMG Parameters.....................................................................7
3.4.1 Limitations of the Chest Score Parameter.................................7
4 User Interface...................................................................................................8
4.1 Main Window........................................................................................8
4.1.1 Standard Controls (Start / Stop, etc.)........................................8
4.1.2 Short Term Display and Controls..............................................9
4.1.3 Numeric Displays....................................................................10
4.1.4 Long Term Displays and Controls...........................................10
4.1.5 Threshold Display and Controls..............................................11
4.1.6 Audio Feedback Controls........................................................12
4.1.6.1 Midi.......................................................................................12
4.1.6.2 Breath Tone...........................................................................13
4.1.6.3 Threshold..............................................................................13
4.2 Support Window.................................................................................15
5 Session Reports..............................................................................................16
5.1 Report Options....................................................................................16
5.2 Adding Notes to a Report....................................................................16
5.3 Sample Session Report......................................................................17
EMG with Breathing Application User Guide, copyright Glyn Blackett
page 1
6 Application Report...........................................................................................19
6.1 Report Options....................................................................................19
1 Introduction
This guide introduces the Electromyography (EMG) & Breathing biofeedback application, part of
York Biofeedback's Mind-Body Training Tools suite. This set of applications is designed to develop
skills in mind-body awareness and self-regulation, particularly in a context of mindfulness and
meditation practice.
The guide has two purposes: firstly to explain how muscle tension and breathing are measured, and
secondly to teach you how to use the software – though it is more of a reference than a tutorial.
Other training material is available on the York Biofeedback website (address above).
The EMG & Breathing application monitors firstly breathing (via temperature of the inhaled and
exhaled air) and secondly EMG, which is an electrical correlate of muscle tension. Monitoring the
two together allows you to explore their relationship, and to objectively characterise the style of
breathing.
EMG is measured using sensors in contact with the skin. By selecting the placement of the sensors
we can choose to monitor different (sets of) muscles. This guide discusses the most commonly used
placements.
The feedback creates an opportunity to develop greater awareness of and sensitivity to our
physiological states, and therefore to our mental states. Based on this awareness we can learn to
embody styles of breathing more supportive of the qualities of mind we wish to develop, such as
openness, tranquillity and emotional positivity.
In keeping with others in the suite, the EMG & Breathing application was designed to support your
aims, not to supplant them. Achieving low muscle tension is not necessarily the most important
thing. Biofeedback should enhance or expand your subjective awareness rather than detract from it.
The guide assumes that you have read the Software Installation and Set-up Guide, and therefore
know how to start the application.
The application works with several devices. For an up to date list of supported hardware, please see
the York Biofeedback website.
EMG with Breathing Application User Guide, copyright Glyn Blackett
page 2
2 Launching the Application
Figure 1 above shows the Muscle Tension (EMG) tab of the Platform application. Press the button
labelled 1 to launch the application. Make sure you have your BioEra licence key (dongle) inserted
into a USB socket. After a few seconds two new windows will appear on your screen.
2.1 Hardware Set-up
The physical aspects of hardware set-up (how to connect and use your sensors, how to test
impedances, etc.) are dependent upon the type of amplifier you are using, and are covered in a
separate document (Hardware Set-up Guide).
Before you start the application you configure the device set-up
options, accessible by clicking a button in the Set-up tab of the
Platform. In the dialog, select the type of amplifier (biofeedback
device) you are using, firstly in the EMG source control, and
secondly in the breath source control. Note, all the source
settings are remembered the next time you start the Platform. In
the same dialog you should select the frequency of your local
mains (e.g. 50Hz in the UK). See the Installation and Set-up
Guide for further details of device set-up.
Figure 2 – amplifier status
You may select 'Simulator' in each of the source controls. In simulator mode, you can learn how to
use the software without the encumbrance of actually sampling the breath. (The application simply
uses recorded data as a source.)
Once you have started the application, you should see your device selection reflected in the device
status display in the top right corner of the main window (see figure 2). The lamp (shown as a red
square in figure 2) should change to green when you press the play button. If you don't see this
happen, it means that the application has not been able to establish a connection with your device.
Check it is plugged in and that the batteries are not flat.
For some devices, you'll see a button rather than just text. Pressing this button opens up a dialog
EMG with Breathing Application User Guide, copyright Glyn Blackett
page 3
that allows you to adjust settings related to the device, such as COM port. The specifics depend on
the device – see the Hardware Set-up Guide for more details.
If you're using different devices for measuring EMG and breath, you'll see two buttons (labelled '1'
and '2', and also two lamps. Clicking the buttons allows you to configure device settings – '1' for the
EMG device and '2' for the breath device. For some device types there are no settings to configure
so the buttons are inactive. Again the lamps should turn green when the devices start (the left for the
EMG device and the right for the breath device).
3 Physiological Parameters
3.1 Input Parameters
3.1.1
Electromyography (EMG) – Muscle Tension
As noted in the introduction, EMG is a measure of muscle tension (actually an electrical correlate of
muscle tension). More specifically EMG is an oscillating voltage. For practical purposes you don't
need to concern yourself with the oscillating nature of the signal, but it is covered in more detail in
the Basic EMG Application User Guide.
To measure EMG, we need to attach three sensors to the skin. Two of these are known as the active
sensors. From the raw signal the software derives a parameter that reflects tension in muscles
between (and to some extent around about) the two active sensors. When these muscles tighten the
signal goes up, and then down again when they relax. See the Hardware Set-up Guide for more
details on your device's sensors.
Clearly, where we site the sensors determines which muscles we are measuring (so placement is
important).
3.1.2
Breath
The breath sensor is actually a temperature sensor placed just below the nostril. From the changing
temperature of inhaled and exhaled air, the system is able to detect the turning points of the breath
and therefore derive breathing rate. This method depends on a reasonable current of air coming
through the nostril. It should still work if you breathe with your mouth open as long as your nose is
not completely blocked. Speech will disrupt the normal air current, and will give rise to unreliable
breathing calculations.
3.1.2.1
Breathing Calibration
The breath detection method requires a short period of time to calibrate to your breath. This
happens automatically during the first 20 seconds of any session (i.e. after you press 'play'). It's
important that you breathe naturally and evenly, and not too slowly, through the nose, during this
time. Note that the breath signal will not display properly until proper calibration is established.
3.1.2.2
Manual Re-calibration
If for any reason you lose reliable breath detection during a session (e.g. you have to remove and
reattach the sensor) there is a way to recover: in the support window, there is a button labelled
'Calibrate', that you simply press. You should breathe naturally and evenly and not too slowly for a
few breaths prior to pressing. If this doesn't work you can stop and restart the application. Generally
the breath detection once established is very reliable and you should not need to re-calibrate during
normal use.
EMG with Breathing Application User Guide, copyright Glyn Blackett
page 4
Figure 3 – A well-calibrated breathing signal
Figure 3 shows you what a well-calibrated breath signal looks like (in the support window). The
upper trace is the temperature of inhaled / exhaled air, while the middle trace is its first derivative or
gradient. The yellow dotted lines are thresholds used for the detection of the breath turning points.
They should be reasonably far apart, but close enough to the centre that the trace will easily and
consistently cross to register a turning point.
3.2 Derived Breathing Parameters
From the detection of the breath turning points, the software calculates:
• breathing rate, and average breathing rate (the averaging period is 1 minute)
• the ratio between the (durations of the) inhalation phase and exhalation phase of the breath. This
is shortened to 'I:E Ratio' (or simply 'I:E'). A 1-minute average is also calculated.
These two are shown in the long term display (figure 7), and can be used as the basis of audio
feedback (section 4.1.6).
3.3 Muscle Tension in Breathing
This section discusses how muscle tension biofeedback can be used in relation to breathing. As
noted in the introduction, different styles of breathing reflect different mental and emotional states.
The aim of the application is to help you move towards breathing physiology that is more
supportive of qualities of mind associated with meditation. But what distinguishes different styles of
breathing?
We can say that the three parameters listed in section 3.2 do so, but in addition we can point to
which muscles are used and how.
EMG with Breathing Application User Guide, copyright Glyn Blackett
page 5
3.3.1
Breathing Muscles
Many muscles may be involved in breathing. In general they tighten on the in-breath and release on
the out-breath. The main muscle groups are:
• The diaphragm – this is a sheet of muscle that separates the abdomen from the chest. It's
attached to the spine at the back and lower ribs at the front. When relaxed it is shaped like a
dome or a parachute, and when it tightens it pulls down, drawing air into the lungs.
• The intercostal muscles – these lie between the ribs and when tightened they collectively lift
the rib cage upwards and outwards, drawing air into the lungs.
• Upper chest muscles, shoulders and even some neck muscles – unlike the diaphragm and
intercostals these are “designed” more as reserve breathing capacity (needed for e.g. aerobic
exercise). Again unlike the diaphragm and intercostals they will become fatigued with
continuous use.
Other muscles may “join in” in subtle ways with the breathing movements, that really aren't
necessary for breathing – e.g. nostrils may flare.
3.3.1.1
Abdominal Breathing
Relaxed breathing should only involve the diaphragm and intercostals – especially the diaphragm.
The breath appears and feels like it's coming from the belly. Generally the breathing rate is slow.
This natural and instinctive style is what you see in a sleeping baby.
3.3.1.2
Chest-based Breathing
In stressful situations, muscles everywhere tend to tighten up – including the breathing muscles – as
though we needed to literally brace ourselves against some threat. This affects the breath – we tend
to take more air in and then not let it out fully. (Think of the startle response as an exaggerated form
of this tendency – there is a sharp intake of breath and then hold it.)
This pattern leads to the upper chest and shoulder muscles becoming more involved – having not let
go of the previous breath we are forced to use these muscles to take more air in. In many people this
style of breathing has become habitual, to the point where muscles may even become painful
because of fatigue.
In reality, abdominal breathing and chest-based breathing are two poles on a spectrum rather than
distinct categories.
3.3.2
Sensor Placements
We can use EMG to highlight the difference between chest-based and abdominal breathing. I
mentioned earlier that where we place the sensors determines which muscles contribute to the
measurement. A convenient placement for breathing training is on the wrists. This picks up muscle
tension in the hands, arms, shoulders and to some extent even upper chest and even neck – but not
the diaphragm. That means that with the wrist placement, chest-based breathing shows up as a
prominent undulation in the signal – as tension rises on the in-breath and falls on the out-breath. By
contrast abdominal breathing shows as a relatively stable (flat) trace.
Another placement useful for monitoring breathing involves one active sensor sited over the scalene
muscle and the other active over the trapezius muscle. This placement is less convenient and
requires some anatomical knowledge.
Another common placement used in EMG biofeedback is the forehead (frontalis muscle). This
placement doesn't generally have any relevance to breathing. It is covered in more depth in the
Basic EMG Application User Guide.
EMG with Breathing Application User Guide, copyright Glyn Blackett
page 6
3.4 Derived EMG Parameters
By analysing the EMG signal in relation to the cycle of the breath the application derives the
following parameters:
•
Minimum EMG – at the beginning of each inhalation the software registers the minimum
EMG over the preceding breath cycle.
•
Maximum EMG – at the beginning of each exhalation the software registers the maximum
EMG over the preceding breath cycle.
•
Chest score – the difference between the above two, calculated once per breath.
In chest-based breathing there is a relatively large difference between minimum and maximum
EMG over the breath cycle, while in abdominal breathing the difference is relatively low. So chest
score is an indicator of the degree of chest-based breathing.
In figure 4 below, the magenta trace is a wrist-placement-derived EMG signal showing a prominent
chest-based breathing rhythm. The green-yellow trace is breath.
A'
Breath ampl.
B'
A
B
Figure 4 – Chest score calculation
You can see how the software derives the above parameters: at the beginning of the exhalation
phase of the breath (A), the previous maximum is noted (A'), then at the beginning of the inhalation
(B) the previous minimum is noted (B'). The difference between A' and B' is chest sore – you can
think of it as a kind of amplitude in the “breath wave”.
3.4.1
Limitations of the Chest Score Parameter
Chest score is by no means a perfect measure of chest-based breathing – it's important you
understand its limitations.
Chest score will be high when the subject takes large breaths and relaxes the chest and shoulder
muscles by letting the breath right out again. But there is another form of chest breathing, involving
quick, shallow breaths. In this case the EMG doesn't change much over the cycle of each breath, so
the chest score will be relatively low.
On the other hand the application will still show this style of breathing because the EMG itself is
relatively high.
A further limitation is that movements unrelated to breathing will skew the chest score to an
artificially high value.
EMG with Breathing Application User Guide, copyright Glyn Blackett
page 7
4 User Interface
When you first start the application from the Platform, you will see two windows. The main
window is shown in figure 5 below, while the support window is shown later (figure 10).
The support window allows you to check that breath detection is working properly (see the
discussion of breath calibration in section 3.1.2). I expect that most users will rarely need to make
reference to it.
4.1 Main Window
1. Standard Controls
2. Short Term Display
7.
Threshold 1
4.
Threshold 2
3. Numeric
Displays
5. Long Term Display
6. Audio Controls
Figure 5 – Main window
This section explains how to configure the controls in the main window.
4.1.1
Standard Controls (Start / Stop, etc.)
A set of buttons – Play, Stop and Pause – are the same in all the applications in the suite. They
should be self-explanatory.
The 'Epoch' control sets the time period at which EMG data is written to the session data file. This
data file is used to generate session reports, which are described in section 5 below. Choosing a
lower time period generates more data. The setting also controls the level of averaging of the
recorded data. For example, if you select 2 seconds, then the application will write to the session
data file once every two seconds, the average EMG over that two second period. (The EMG and
Breathing application also writes breathing data but the Epoch control does not affect this.)
The button marked with a red asterisk is a simple event marker. You can use it to mark adventitious
happenings and changes in session conditions (e.g. you turn on or off breath pacing). It is
particularly useful for coaches and therapists. Events thus marked are represented in the long term
EMG with Breathing Application User Guide, copyright Glyn Blackett
page 8
chart (see section 4.4 below) by a vertical white line. They are also recorded in the session data file
and are shown in session report charts (as dotted vertical lines) (see section 5).
Note that pressing the escape key during a session has the same effect as pressing the red asterisk
with your mouse (i.e. it is an alternative).
4.1.2
Short Term Display and Controls
1
2
3
Figure 6 – Short term displays and controls
The chart (figure 6 above) shows EMG (magenta) and breath (green-yellow).
The following (combo-box) controls, positioned below the charts (1 to 3 in figure 6), control the
display of the signal.
EMG Average
Controls the level of smoothing of the EMG signal. With a shorter average you
will see all the fine-grained changes in muscle tension. With a longer average
these are smoothed out, and the signal will be slightly slower in responding to
change.
For most users a setting of 1.0 or 2.0 seconds will be suitable.
EMG Range
Sets the upper limit of the display. (The lower limit is always zero.) Select a
larger range if the (magenta) EMG trace appears to be off the top of the chart.
(If you can't see the trace it probably is off the top.) Select a lower range as you
learn to reduce tension, so that the display offers greater sensitivity (meaning
that even subtle changes in muscle tension can be seen).
Period
This controls the length of time it takes for the traces to traverse the whole chart
from right to left – or in other words the horizontal range.
Note there is no vertical range control for the breath signal. This should automatically be adjusted to
fit the display, during the calibration process. (If it goes off the top or bottom, it means recalibration
is needed. Use the recalibrate button in the support window, as described section 3.1.2.) Each breath
starts from the same point on the vertical axis – sometimes you see this as jumps in the signal.
EMG with Breathing Application User Guide, copyright Glyn Blackett
page 9
4.1.3
Numeric Displays
These are positioned close to the bottom of the window, just above the audio feedback controls.
Averages are calculated over a 60 second interval.
4.1.4
Long Term Displays and Controls
1
2
3
Figure 7 – Long term display and controls
The long-term chart (figure 7) shows breathing rate in blue, inhalation to exhalation ratio in red, and
maximum and minimum EMG in dark and light magenta respectively. The controls (combo boxes)
are positioned above the chart (1 to 3 in figure 7) .
EMG
Controls the vertical range of both the maximum and minimum EMG traces
(dark and light magenta, respectively). You can see this range displayed if you
click on either of the magenta squares.
Br. Rate
Controls the vertical range of the blue breathing rate trace. Click the blue
square (upper left of chart) to see this range displayed in the chart.
LT Period
Controls the horizontal (time) range.
Note that the red I:E ratio trace has a fixed range of 0 to 2. The bold line in the centre of the chart is
at 1.0, meaning that when the red trace is below the line, the exhalation phase lasts longer than the
inhalation phase (usually desirable).
EMG with Breathing Application User Guide, copyright Glyn Blackett
page 10
4.1.5
Threshold Display and Controls
The essence of threshold-based
feedback is that a discrete feedback
event (such as a bell-ring) is
triggered whenever the feedback
parameter exceeds some limit. The
value of using the threshold is that
the feedback is doesn't require
constant attention, freeing you to
focus on your direct experience. The
feedback only comes in when you've
drifted out of your desired
psychophysiological state.
1
In the EMG with Breathing
application there are two threshold
2
3
4
5
displays, so the software can flag
when either one of two parameters
Figure 8 – Threshold displays and controls
goes out of range. For example you
can set it to flag either when your
breathing rate becomes too fast, or your muscle tension rises too high.
6
Threshold 1 is to the left of the long term display, and shown in figure 8, while threshold 2 is to the
right (not shown). The controls for each are functionally equivalent.
In practice the important feedback from the threshold is auditory (e.g. a bell ring). The audio
aspects are covered more in section 4.1.6 below. Further to this a lamp lights up when the threshold
condition is met (2 in figure 8).
The bar graph has either one or two movable levels (one is shown in figure 8, labelled 1) which
define the threshold limits. To change these limits simply drag the bars with your mouse. The
numeric displays 5 and 6 show the settings. The bar graph's range is taken from the long term
display controls.
For each of the two thresholds, you can choose which parameter to base feedback on, e.g. minimum
EMG, using the combo box control 3 in figure 8, in the case of threshold 1. The combined options
are EMG, minimum EMG, chest score, breathing rate and I:E ratio
You can set different conditions to be met for the threshold event to be triggered, via the combo box
control (4 in figure 8). The options are listed in the table below.
Between
Two limits are used; the condition is met whenever the parameter is both below the
upper limit and above the lower limit.
Outside
Two limits are used; the condition is met whenever the parameter is either above the
upper limit or below the lower limit.
Above
A single limit is used; the condition is met when the parameter is above this.
Below
A single limit is used; the condition is met when the parameter is below this.
Off
The threshold will not be active. Use this option if you're only interested in one of the
two thresholds (i.e. turn the one you're not interested in off).
As an example of how you might use threshold-based feedback, suppose you wish to maintain a
steady breathing rate of around 6 breaths per minute with your baseline muscle tension remaining
EMG with Breathing Application User Guide, copyright Glyn Blackett
page 11
below a limit of say 2 microvolts. Use threshold 1 to set the muscle tension condition. Set its
parameter to be Minimum EMG (using control 2), then set its condition to be “above”, then drag the
level to around 2. Use threshold 2 to set the breathing rate condition. Set its parameter to be
breathing rate, set its condition to be “outside”, then drag the threshold levels so that the upper is
say around 7 bpm and the lower is say around 5 bpm. You will probably want to turn on audio
feedback for the threshold feedback, which is covered in the next section.
4.1.6
Audio Feedback Controls
Audio feedback allows you to use the application with eyes closed – useful in meditation practice.
You can choose how much and how often the feedback is activated, and thus how intrusive it is. The
controls (figure 9) are found at the bottom of the main window.
There are three forms of audio feedback available. With each, you can choose which physiological
parameter to base the feedback on.
Each has an on/off button (appearing as green triangles 2,5 & 7 in figure 9, but switching to red
squares when the feedback is turned on). Each also has an independent volume control (sliders 3, 6
and 8 in figure 9) graded on a scale of 0-100.
For midi and breath tone feedback, it is necessary to use a range of the feedback parameter, just as
for graphical feedback. The range defines what values of the parameter correspond to the highest
and lowest notes available. Rather than creating separate controls, the ranges are taken from the
graphical range controls – details are given in the tables below.
4.1.6.1
Midi
When midi feedback is turned on, a musical note is played repeatedly, whose pitch varies with the
chosen feedback parameter.
The combo box (1 in figure 9) controls the parameter used. You can choose from those listed in the
table below. Note that changing the selected parameter causes the application to restart processing,
so it is better to make your choice before you start your session.
The pitch varies over a parameter range set by other controls – see the table below for details. The
lower the parameter the deeper the midi note. For most parameters, a note is triggered once per
breath.
You can set some options for midi feedback, notably the instrument (piano by default) from the
Platform (i.e. before starting the application). See the Installation and Set-up Guide for further
details.
EMG
The pitch of the midi note varies with EMG. A note is played 4 times per second.
The pitch range is mapped to the EMG range selected in the LT display control for
(1 in figure 7).
Min EMG
The pitch varies with the minimum EMG. A note is triggered at the beginning of
each inhalation.
EMG with Breathing Application User Guide, copyright Glyn Blackett
page 12
The pitch range is mapped to the EMG range selected in the LT display control (1 in
figure 7).
Max EMG
The pitch varies with the maximum EMG. A note is triggered at the beginning of
each exhalation.
The pitch range is mapped to the EMG range selected in the LT display control (1 in
figure 7).
Br. Rate
The pitch varies with breathing rate.
The pitch range is mapped to a parameter range defined by the breathing rate range
control in the long term chart (2 in figure 7) (actually this sets the upper limit, while
the lower limit is fixed at 3.0 bpm).
I:E Ratio
The pitch varies with inhalation to exhalation ratio. The pitch range is mapped to a
fixed parameter range of 0 to 2.
Threshold 1 The pitch varies with the parameter that is selected for threshold 1 (i.e. in control 3
in figure 8). The pitch range is mapped to a parameter range defined by the two
threshold levels (in threshold 1) – the advantage of this option is that you can adjust
the levels to precisely control the parameter range and thus the sensitivity of the
feedback.
This only makes sense if you have two threshold levels visible, so you should select
'outside' for the threshold condition (control 4 in figure 8).
Threshold 2 This option works in the same way as the 'threshold 1' option above, except using
the threshold 2 controls.
4.1.6.2
Breath Tone
When this option is turned on, a tone is played which follows the breath. The pitch gently ascends
and descends in pitch for each inhalation / exhalation respectively. (Each breath has a relatively
narrow range in pitch.) The tone sounds during the movement of the breath, and falls silent at the
turning points. This form of feedback is very useful if you are using the breath as the focus of your
meditation.
At an overarching level, the pitch varies with the selected feedback parameter – the lower the
parameter value, the deeper the pitch.
The combo box (4 in figure 9) allows you to choose which parameter to use as the basis of
feedback. The choices are the same as for midi feedback (listed in the above table) except for EMG.
(The same range controls apply.)
4.1.6.3
Threshold
Threshold-based feedback was introduced in section 4.1.5 above.
When this option is activated, a sound is played whenever either of the threshold conditions is met.
You can choose to deactivate either of the thresholds, so that the feedback sound only relates to one.
You can configure the two thresholds as described in section 4.1.5: to summarise, you can set the
parameter, the threshold condition (e.g. above or below the level) and also drag the bars in the
display to control the threshold limits.
The value of using the threshold is that the feedback is generally less intrusive, freeing you to focus
on your direct experience. The feedback only comes in when you've drifted out of your desired
EMG with Breathing Application User Guide, copyright Glyn Blackett
page 13
psychophysiological zone.
For the sound, the software actually plays back a recorded file. This is one of a set of files found in
the 'media' folder in the capnometry designs sub-folder (i.e. generally speaking C:\Program
Files\BioEraPro\design\YBF\EMG_Breathing\media\ ). There are six files, named '1.wav', '2.wav'
and '3.wav', etc. – 1 to 3 apply to threshold 1 while 4 to 6 apply to threshold 2.
If the threshold 1 condition is set to 'outside' and the upper threshold is exceeded, then file '2.wav' is
played, or else if the lower limit is crossed then file '3.wav' is played. For all other threshold
conditions, file '1.wav' is played. If the threshold 2 condition is set to 'outside' and the upper
threshold is exceeded, then file '5.wav' is played, or else if the lower limit is crossed then file '6.wav'
is played. For all other threshold conditions, file '4.wav' is played.
You can have the application play sounds of your choice by simply substituting these files with your
own. For example you could record a message in your own voice. There are lots of programs that
you can use to do this, such as “Audacity”, a freeware application. Your recording needs to be saved
in WAV format.
EMG with Breathing Application User Guide, copyright Glyn Blackett
page 14
4.2 Support Window
Figure 10 shows the support window. It displays the raw temperature signal together with various
aspects of the breath detection method (see section 3.1.2).
The two lamp displays at the bottom (shown turned off) will flash briefly whenever the application
detects (i) beginning of the exhalation (left lamp), and (ii) beginning of the inhalation (right lamp).
Press the 'Calibrate' button to recalibrate the breath as described in section 3.1.2.
EMG with Breathing Application User Guide, copyright Glyn Blackett
page 15
5 Session Reports
The application records data so that you can generate a report for your sessions. The report contains
summary data and graphs showing the progression of the feedback parameters over the whole
session.
To generate and open a session report, click the button labelled 2 in figure 1. A dialog window
opens in which you can select various options (see figure 11).
The software creates the report in html format. It will be opened using your computer's default web
browser, e.g. Internet Explorer. (Note that a live internet connection is not needed.) The html file is
saved, so you can for example email it to someone. See the Installation and Set-up Guide for details
of file storage.
5.1 Report Options
Most of the options should be self-explanatory.
If you change your mind about options on seeing your report, you can regenerate the report by
clicking the report button (2 in figure 1), then checking 'Overwrite existing report' (top left in the
dialog).
Options relating to either EMG data or breathing data are found under separate tabs.
Combo box controls allow you to set maximum values for several of the parameters. Setting a
maximum is a basic way of excluding “artefacts”, for example if you changed your posture during
the session causing the EMG signal to go much higher than baseline. Data points exceeding the
maximum value are excluded.
5.2 Adding Notes to a Report
You can choose to write some notes for your session report. Checking 'Add notes to report' (top
right of the dialog) allows you to do this.
You may wish to add notes after having first seen the report. In this case, simply click the button (2
in figure 1) again, and check the Add notes option. This will regenerate the report with your added
notes.
EMG with Breathing Application User Guide, copyright Glyn Blackett
page 16
5.3 Sample Session Report
Training Session Report
Training Application
EMG with Breathing
User Name
Default User
Session Date
24/05/14 19:42
EMG with Breathing Application User Guide, copyright Glyn Blackett
page 17
Breathing Summary Data
Parameter
Mean
Max
Min
S.D.
Breathing Rate
10.8 bpm
17.3 bpm
2.4 bpm
3.4 bpm
I:E Ratio
0.9
1.32
0.16
0.18
Minimum EMG
2.6 uV
5.3 uV
0.8 uV
1.8 uV
Maximum EMG
3.8 uV
11.1 uV
1.5 uV
2.2 uV
Chest Score
1.2 uV
7.0 uV
0.3 uV
1.3 uV
EMG with Breathing Application User Guide, copyright Glyn Blackett
page 18
6 Application Report
An application report summarises all the sessions for the currently selected user, in charts and a
table.
To generate and open an application report, click the button labelled 3 in figure 1. A dialog window
opens in which you can select various options (see figure 12).
As with session reports, the software creates the application report in html format. It will be opened
using your computer's default web browser, e.g. Internet Explorer. (Note that a live internet
connection is not needed.) The html file is saved, so you can for example email it to someone. See
the Installation and Set-up Guide for details of file storage.
6.1 Report Options
The application report options dialog is an adapted version of the session report options dialog.
Many of the options are the same, and should be self-explanatory. See section 5.1 above.
As with all of the application reports in the suite, there is a chart for each of the main parameters
tracked in the application – in the case of the EMG and Breathing application that means breathing
rate, inhalation to exhalation ratio, minimum EMG per breath, maximum EMG per breath and chest
score. For each chart you can opt for line graphs for the maximum, minimum, mean and standard
deviation. The line graphs have one point per session.
EMG with Breathing Application User Guide, copyright Glyn Blackett
page 19