1
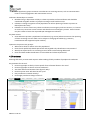
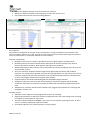
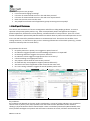
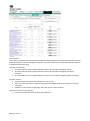
Mental Health System Profiling Tools User Guide 2. Data to intelligence Draft Version 1.2. June 2014 DRAFT: 15 06 14 Contents 1. Introduction ..................................................................................................................................................3 2. Tool content .................................................................................................................................................4 3. Data review...................................................................................................................................................5 4. Focus on the detail .......................................................................................................................................7 4. 1 Risk and related factors .........................................................................................................................7 4.2 Prevalence ..............................................................................................................................................8 4.3 Services ...................................................................................................................................................9 4.4 Quality and Outcomes ......................................................................................................................... 11 4.5 Finance ................................................................................................................................................ 12 5. Outputs ...................................................................................................................................................... 14 DRAFT: 15 06 14 1. Introduction This document is a support guide for users of the Severe Mental Illness System Profiling Tool and the Common Mental Health Disorder System Profiling Tool. It is primarily for those less familiar with data and aims to help them understand their population with a mental illness or at risk of developing a disorder, and to consider the services in place to support them. It assists with both asking and answering key questions and helps place tool interrogation within the overall intelligence gathering process. It also focusses on benchmarking as the key route to highlight variation across the pathway. These tools bring together a wide range of information across the mental health pathway. The detail included supports users to take an intelligence driven approach to planning, and to consider a broad picture in relation to mental health. It provides numbers and rates for local areas and is sufficiently interactive to enable bespoke comparison with both geographical and statistical neighbours. This guide focuses on content and interpretation of the tools, rather than functionality. A companion ‘using fingertips software’ guide is available which describes how to use the software. DRAFT: 15 06 14 2. Tool content A key guiding principle when developing the tool was to maximise data availability for users and bring together an array of relevant data items. The following general points about the data are worth bearing in mind when using the tools: Definitions & caveats – because data are included from a variety of sources (e.g. MHMDS, IAPT, Census 2011, QOF, Social Care returns), for differing populations (whole population, adults, sample survey) and presented in a number of ways (counts, rates, ratios) each indicator has detailed metadata including caveats. All indicator specific information is held within ‘definitions’. Data quality – indicators are included if they were viewed as of sufficient quality or (on occasion) they provide an important element of the picture that cannot be gained elsewhere. Each indicator has been assessed for quality and validity and an overall quality ranking is appended to their title. Comparison: data are generally presented in ways that enable comparison (e.g. rates or percentages), however on occasion it is only possible to present numbers (e.g. prisoner numbers and certain prevalence estimates). Care should be taken in use of these indicators. Significance – the majority of indicators show when a local value is statistically significant from the chosen benchmark value. This significance is based on whether the 95% confidence interval of the area’s measure overlaps with the benchmark value. A significant difference means that the difference between the indicator and the benchmark is not likely to be due to chance. It is important to consider that this is a marker of statistical significance and the difference may not necessarily have public health or policy significance. In particular, indicators based on very large numbers can have differences which are highlighted as statistically significantly different but the difference is actually very small. Age groups – data within the tool mostly relates to adults; however the definition of adults does differ between indicators due to differences in definitions at source. Within the tool ‘adult’ can mean 16 – 64, 16 – 74 or 18+, and on occasion, for instance with some of mental health minimum data set, indicators are expressed as a rate per resident population aged 18+, but the activity may include some younger people. Use of “mapped” data - the finance indicators use data mapped from PCT to CCG and the ‘Pathway’ domain presents a high level summary that necessitates some mapping of indicators to CCG from other geographies. This mapping does not work well for the minority of CCGs which do not have a co-terminus area relationship. The aim is to phase out mapping of data from the tool as soon as practically possible. Repeating indicators – for convenience, when indicators are available at more than one geography they are included for all geographies available. However on occasion the source and reporting period can differ which accounts for difference in values for similar indicators. DRAFT: 15 06 14 3. Data review The main purpose of the tools is to help users gather intelligence to inform needs assessment, strategy development or to make commissioning decisions. When reviewing data, consideration of the following principles may help achieve this: The process should be informed by collective knowledge and local knowledge: Work in a multi-disciplinary team Add local data and perspective. Know the questions you want to ask: Agree purpose and desired outputs Know where and how to seek additional information. It is important for the user to sense check the data, i.e. compare with local intelligence and ask: Do the values seem correct? If not, why do you think not? How do you rate data completeness & accuracy? Staged approach to viewing indicators: Gain an overview - begin by viewing all indicators within the domain, i.e. view data for CCG and LA (and MHT where available) in one domain before moving on The ‘Area Profile’ view is good for overview: it allows sight of all domain indicators and shows where your area is an outlier When moving to detail, viewing indicators in ‘Compare areas’ - sorting by high/low values allows assessment of relative position and identification of neighbours adopting good practice Using the ‘Trend’ view enables assessment of change over time. Many ‘service’ and ‘quality and outcome’ indicators are updated quarterly so this view will become increasingly important. Learn through comparison with areas like your own: Compared with similar areas (statistical neighbours) to identify own good practice and opportunities for improvement Identify high performing statistical neighbours. Are particular neighbours consistently high performing? What can be gleaned from their profile? How can you learn from them? When interpreting results, focus on where difference is real: Focus on key indicators Focus on where your area is significantly different from the benchmark Ask: this difference is significant, but is it meaningful? What does this mean for you? Some values do not have confidence intervals, use them with more caution Focus on indicators where the local value is an outlier (amongst the lowest or highest) For each indicator you prioritise, given local understanding of services and circumstances, ask: If the local value is high or low compared to England and comparators, why? DRAFT: 15 06 14 Does the degree of difference make sense, i.e. is it higher or lower than expected? What does it mean? What does it suggest to you about service user profile? How do values link to contributing factors, e.g. deprivation, staff numbers, primary care management, specialist care service organisation etc? Assess relationships between indicators: Are there inconsistencies between indicators (i.e. elements of services you believe should show similar results, do not)? Is this due to data recording? Or a service based reason? How do the indicators interact? E.g. are demographic indicators reflected in prevalence rates? And are both reflected in numbers of service users? Where outputs from different indicators support each other, ask does this strengthen findings? Ask: are these areas which require particular attention? DRAFT: 15 06 14 4. Focus on the detail This section provides a guide to gathering intelligence from the five domains. It highlights key indicators key questions, key caveats and provides a basic interpretation of the relationship between indicators. 4. 1 Risk and related factors This section aims to support prevention of mental illness, quantify key related factors within local areas and help identify population groups who are at risk. The section also includes data on broad ethnic group and data that give an indication of risks associated with accessing services. Data are predominantly presented at upper tier local authority level supplemented by indicators at lower tier and clinical commissioning group. Note: topics covered primarily reflect data availability. Many important risk and related factors are not easily quantified using routinely available national data. Key questions for the tool: What are the key population characteristics in your area? Are they changing? What are your important local risk factors for mental illness? Does consideration of segments of the population help identify risk? Key indicators: Deprivation is a key determinant of population level risk of mental illness. Overall deprivation is a summary measure and some key component elements are also presented. Key population groups with elevated risk of mental illness include: long term unemployed, the homeless, prisoners and people with a learning disability A large range of indicators are presented for the common mental health disorders tool which represent a selection of the many social and lifestyle factors known to be risk factors DRAFT: 15 06 14 Some population groups encounter some barriers to accessing services, such as communication issues or lack of engagement with mainstream services. Indicators relationships to consider: Numbers living in deprivation is likely to relate to prevalence of mental illness and should be considered alongside numbers of people accessing mental health services. Indicators relating to segments of the population can inform planning of action to prevent or identify disorders early. Indicators on service access may relate to indicators on emergency and crisis services, i.e. barriers to access may mean less routine contact and therefore more emergency contact. Access barriers may also relate to lower than expected QOF management indicators. Key data caveats Some indicators present a population level measure (e.g. census) whereas some are the reporting of those accessing a service which can be subject to changing thresholds (e.g. statutory homelessness and supported asylum seekers). Questions the process may prompt: What can be done to reduce risk in the population? Does the risk profile help decide preventive and targeted early identification interventions? Would you expect barriers to accessing services? How are these being addressed? Does local data enable identification of risk and barriers below LA/CCG level? 4.2 Prevalence Planning effectively to meet need requires understanding of likely numbers of people with conditions. Key questions for the tool: How many people are likely to have specific forms of mental illness in the area? How many people are known to have conditions? Are there differences between these figures? Why? How many new cases will there be each year? Has prevalence increased recently? How might prevalence change in future? DRAFT: 15 06 14 Key indicators Estimated prevalence of a disorder is an estimate of annual cases taking into account age, sex and (where possible) need. The numbers known to GPs is a count over a longer period and may include a wider range of conditions. Some indicators based on survey responses are included to show how people self-report their mental health or wellbeing Indicator relationships: Prevalence measures and QOF register indicators should be considered alongside numbers of people living in deprivation, and also with numbers of people accessing mental health services. Incidence measure should link with early intervention services. QOF registers should be considered alongside QOF patient management indicators in the Quality and Outcomes section, for instance fewer than expected on the QOF register may play a part in low number of exceptions recorded or high performance in quality of care indicators. QOF registers could also be considered alongside emergency and crisis service indicators, e.g. fewer than expected on the register may link with more people accessing specialist services at times of crisis. Key data caveats: Prevalence estimates should be treated as a baseline guide to numbers with a condition. QOF counts can be subject to some variation in recording. Prevalence estimates relate to a year, QOF registers cover a period of years, this should be born in mind when comparing the two. Some estimates are only based on the age:sex profile and make no adjustment for local risk factors Self-reported survey measures do not represent validated diagnoses of mental health conditions Questions the process may prompt: Is current service planning based on need similar to that estimated in the tool? If not what is the impact of this? Is prevalence of mental illness increasing? Are early intervention services reaching expected numbers? If not what steps will be taken to investigate and address? Are numbers on the QOF register as expected? If higher or lower, why? What is the range across practices? Are indicators of risk at practice level known? 4.3 Services This section helps the user consider if people are being supported by the right services in the right numbers across the care pathway. It presents health care data generally by clinical commissioning group and social care data by local authority. Key datasets (such as mental health minimum dataset (MHMDS) and Improving Access to Psychological Therapies (IAPT)) will be updated on a quarterly basis to allow upto-date analysis assessment of recent trend. Key questions for the tool: Given the risk profile, are service utilisation rates as expected? Is need the key driver of service utilisation for health? Is need the key driver of service utilisation for social care? Are service utilisation rates changing? DRAFT: 15 06 14 What is the balance between acute and community services? What is the balance between crisis/emergency services and routine care? Are health and social care services working together? Key indicators: Key indicators will depend on the topic under consideration. A range of indicators are provided on key services including: primary care, IAPT, specialist care and social services. Some present a general measure where as others focus on a particular element of service delivery. Indicator relationships: Numbers of service users relates to prevalence measures, QOF registers and deprivation. Numbers of Social Care mental health clients and new Social Care assessments may relate to relate to prevalence measures, QOF registers and deprivation measures. Relationship between IAPT referrals, service attendance and service completion may relate to the service model in place. All service measures should be viewed in light of the appropriate prevalence and incidence measures. For example Areas A and B may have the same population size and rate of new cases of psychosis supported by the early intervention team, but B’s estimated incidence is double that of A, which may suggest Area B service requires more capacity. Inpatient bed use should be viewed alongside the delayed discharge indicators. Emergency admissions and use of the mental health act should be viewed in light of the QOF exceptions and patient care indictors in Quality and Outcomes and numbers supported by Social Care. Admissions for common mental health conditions may suggest that conditions are not being well managed in primary care Key data caveats: QOF data can be subject to some geographical variation in recording. Reporting mechanisms for IAPT have recently changed and there are some coding issues, meaning incomplete or missing data for some CCGs. The level of detail included on MHMDS is the result of a new monthly reporting process. As this is new it is currently regarded as experimental data. Prescribing indicators only measure primary care prescribing DRAFT: 15 06 14 Questions the process may prompt: Is service need changing? Growing? Is the mix of commissioned services in line with best practice? Is the mix of commissioned services in line with user requirements? Have new services come into the area? Are people from all areas and all population groups accessing services equally? 4.4 Quality and Outcomes This domain aids assessment of service management and efforts to help people get better. It covers a spectrum of important quality markers e.g. data associated with patient management and support, patient experience, effectiveness of the pathway, and effectiveness of care processes. There are a small number of indicators presented by Mental Health Trust which relate to patient and staff experience as this area is not well covered by available indicators at commissioner level. The section also includes ‘cross cutting’ measures, i.e. data that can play a role in assessing effectiveness of the whole system (e.g. suicide and excess mortality due to mental illness). Key questions for the tool: Do quality measure in primary care suggest an optimal service? Do indicators suggest specialist service knowledge of patients is as expected? Do discharge indicators suggest the system is effective? Do indicators values suggest an appropriate focus on recovery? Is data recording at an appropriate level? Are patients content with the services they receive? Do staff feel they are equipped to support patients effectively? Are Social Care clients supported to take control of their own care? Do ‘cross cutting’ indicators suggest the overall pathway works well? Key indicators: Key indicators will depend on the topic under consideration. A range of quality indicators are provided on services such as primary care, IAPT, specialist care and social services. QOF data includes measures relating to physical health as well as mental health. There are also data presented by Mental Health Trust which provides intelligence on patient and staff views. Indicators on suicide, self-harm and mortality and DRAFT: 15 06 14 excess mortality due to mental illness are included as ‘cross cutting’ indicators which are key to assessing the quality of the overall care pathway. Indicator relationships: Numbers of QOF exceptions should be viewed in light of the overall register and prevalence estimates. For instance there may be lower exceptions in areas where, based on prevalence, the register appears low. QOF patient management indicators should also consider this. IAPT waiting times may link to overall service use. CPA management indicators should be viewed in light of the numbers and proportion of all patients on CPA. When comparing Social Care indicators on self-directed support and self-directed payments they should be viewed in context of the overall numbers of people support by Social Care. Key data caveats: QOF data can be subject to some geographical variation in recording. QOF data uses the ‘patients receiving the intervention’ rates, i.e. the denominator includes exceptions and therefore the values differ from the commonly reported “underlying achievement” rate. The level of detail included on IAPT is the result of there being a new IAPT dataset. This data is subject to some coding issues that will be eliminated over time. The level of detail included on MHMDS is the result of a new monthly reporting process. As this is new it is currently regarded as experimental data. Questions the process may prompt: Are service quality measure good enough? Can you / will you assess quality of primary care services below CCG / LA level? Do you require the inputs of neighbouring commissioners to assess specialist services? Are the outcomes of commissioned services good enough? How can they be improved? What steps need to be put in place to make this happen? 4.5 Finance This domain helps check if value for money is being achieved. It should seldom be used in isolation, i.e. rates of spend should generally be viewed in light of prevalence of conditions and numbers accessing services. At this time, only data on health services are presented. Key questions for the tool: How much is invested in commissioned services? Are you achieving value for money? How do local costs compare with others? Is this data recent enough to meaningfully assess spend? Does mapping data from PCT work well for your area? DRAFT: 15 06 14 The indicators: The majority of indicators are derived from programme budgeting data, showing overall spend on mental health and spend on the sub-categories ‘Psychosis’ (in severe mental illness tool) and ‘Other’ (in common mental health disorders tool). Indicator relationships: To assess value for money spend indicators need to be considered alongside activity. To assess value for money spend indicators need to be considered alongside prevalence estimates. To assess value for money spend indicators need to be considered alongside patient outcomes. Key data caveats: Finance measures are generally mapped from PCT to CCG. There are inconsistencies in coding of the programme budgeting data, particularly for the subcategories. Indicators in this section are generally older than those in other sections. Questions the process may prompt: Could commissioned services be more cost effective? DRAFT: 15 06 14 5. Outputs Completion of the assessment process should result in an understanding of key indicators that suggest differences in the local population that need further attention. Key messages are strengthened when indicator results are repeated and / or linked across domains. The completed output should: Assess the local situation by benchmarking against a chosen peer group Highlight areas of apparent good practice for the local area Highlight areas of apparent risk Identify the areas for potential improvement Identify areas for further investigation Identify statistical neighbours who appear to be adopting good practice. DRAFT: 15 06 14